The True Cost of Poor Lubrication - UE · PDF file© 2012 Des-Case Corp. 3 Quiz Time...
28
© 2012 Des-Case Corp. 1 Des-Case Confidential The True Cost of Poor Lubrication Jason Kopschinsky, CMRP Director of Reliability Services Des-Case Corporation
-
Upload
nguyenhuong -
Category
Documents
-
view
212 -
download
0
Transcript of The True Cost of Poor Lubrication - UE · PDF file© 2012 Des-Case Corp. 3 Quiz Time...

© 2012 Des-Case Corp. 1
Des-Case Confidential
The True Cost of Poor Lubrication
Jason Kopschinsky, CMRP Director of Reliability Services
Des-Case Corporation

© 2012 Des-Case Corp. 2
Quiz Time
• How important is precision lubrication to overall equipment reliability?
Source: Machinery Lubrication Reader Survey March, 2011 (n: 347)
99.1%
Des-Case Confidential

© 2012 Des-Case Corp. 3
Quiz Time
• At your plant, have you achieved a level of lubrication that you would consider close to best practice?
Source: Machinery Lubrication Reader Survey March, 2011 (n: 347)
Des-Case Confidential

© 2012 Des-Case Corp. 4
Roadblocks to Precision Lubrication
Problem Solution
Lack of knowledge or understanding of what’s possible
External Support & Engineered products/solutions & Training
Too busy putting out fires to develop an action plan
Project Management Support
Lack of management buy-in to provide funding
Develop a Business Case
Des-Case Confidential

© 2012 Des-Case Corp. 5
Des-Case Confidential
The Role of Lubrication in Machine Reliability
Less than 0.5% of a plant’s maintenance budget is spent purchasing lubricants, but the downstream effects of poor lubrication can impact as much as 30% of a plant’s total maintenance costs each year.
ExxonMobil Case Study
© 2012 Des-Case Corp.

© 2012 Des-Case Corp. 6
What Causes Machines to Fail?
Ref: MIT, E. Rabinowicz
70% of loss of machine life is due to loss of surface material
Loss of Usefulness
Des-Case Confidential

© 2012 Des-Case Corp. 7
What Causes Surface Degradation?
Ref: MIT, E. Rabinowicz
Surface Degradation
Des-Case Confidential

© 2012 Des-Case Corp. 8
What Causes Machines to Wear?
Ref: NRCC, STLE
Primary Wear Mechanisms
82% of mechanical
wear is caused by
particle contamination
Des-Case Confidential

© 2012 Des-Case Corp. 9
0.001” = 25.4 microns 1” = 25,400 microns
Human Hair
How Big is a Micron?
Des-Case Confidential

© 2012 Des-Case Corp. 10
One tsp of dirt in a 55 gal drum yields a particle count of 19/17/14. That means there are about 1 billion particles in the drum which are greater than 4 microns in diameter.
How Much Does it Take to Contaminate?
Des-Case Confidential

© 2012 Des-Case Corp. 11
How Clean is New Oil?
With few exceptions, new oil is never clean enough for common applications. New oil must be filtered before installation to provide any reasonable level of cleanliness. New Oil is Dirty!!!
Des-Case Confidential

© 2012 Des-Case Corp. 12
Particle Effects on Component Life
Des-Case Confidential

© 2012 Des-Case Corp. 14
Failure starts Precision PdM (high frequency vibration analysis , oil analysis)
Wear debris analysis
Vibration analysis
Thermography
Audible noise/hot to touch
Looseness
Ancillary damage
Catastrophic failure
P
roac
tive
P
red
icti
ve
P
reve
nti
ve
R
un
To
Fai
l % r
emai
nin
g lif
e
Operating Hours
0%
100%
Progression of a Failure P-F Curve
Des-Case Confidential

© 2012 Des-Case Corp. 15
Time Based PM’s
Des-Case Confidential
“When evaluated on a benefit/cost basis, approximately 50% of PM tasks have essentially no value.” John S. Mitchell
Time Based
Oil Drains
Time Based
Replacements Over Lubrication

© 2012 Des-Case Corp. 16
Time Based Replacements
Des-Case Confidential Ref: NASA RCM Guide
• 30 identical 6309 deep groove ball bearings
• Run to failure on test bench • Standard test procedures
The wide variation in bearing life precludes the use of any effective time-based maintenance strategy.

© 2012 Des-Case Corp. 17
Contamination Control Strategy
3
Des-Case Confidential
Set Targets Measure Results Take Action

© 2012 Des-Case Corp. 18
Case Study – Steel Mill Hydraulics
0
10
20
30
40
50
60
70
80
90
100
year 1 year 2 year 3 year 4 year 5
Hydraulic Failures
Principle strategy: 1. Set targets 2. Offline filtration &
improved Breathers 3. Good oil analysis
Results: 96% drop in hydraulic failures 80% drop in oil consumption
Des-Case Confidential

© 2012 Des-Case Corp. 19
Automotive Press Case Study
0
10000
20000
30000
40000
50000
60000
70000
80000
1 2 3 4 5 6 7
Par
ticl
e C
on
cen
trat
ion
(P
arti
cle
s/m
L) =
/> 4
mic
ron
Sample Number
93%-97% reduction in particle
contamination
Des-Case Confidential

© 2012 Des-Case Corp. 20
Automotive Press Case Study
A Line B Line C Line D Line E Line
3 yearaverage
2012 YTD
Do
wn
tim
e (M
inu
tes)
Downtime 54% reduction in
downtime
6 7 8 9 10
Des-Case Confidential

© 2012 Des-Case Corp. 21
Des-Case Confidential
© 2012 Des-Case Corp.
Deploying Best in Class Lubrication –
Minimizing the Financial Impact

© 2012 Des-Case Corp. 22
Lubrication TransformationSM – Business Case Analysis
Key Objectives – Financial Analysis:
Work with plant maintenance management to estimate the amount lost each year due to imprecise lubrication
Develop an action plan to help close the gap on the most common reasons for poor lubrication
Estimate the upfront and ongoing costs to close the gaps
Calculate the 5-year Net Present Value (NPV) and Internal Rate of Return (IRR) for improvements
Note: Most companies have a hurdle rate of 15-30% IRR for project approval
Managers speak in dollars and cents, not beta ratios and microns. We need to learn the language of management.
Managers really don’t care about lubrication. They care about the financial impact of poor lubrication.
Des-Case Confidential
© 2012 Des-Case Corp. 23
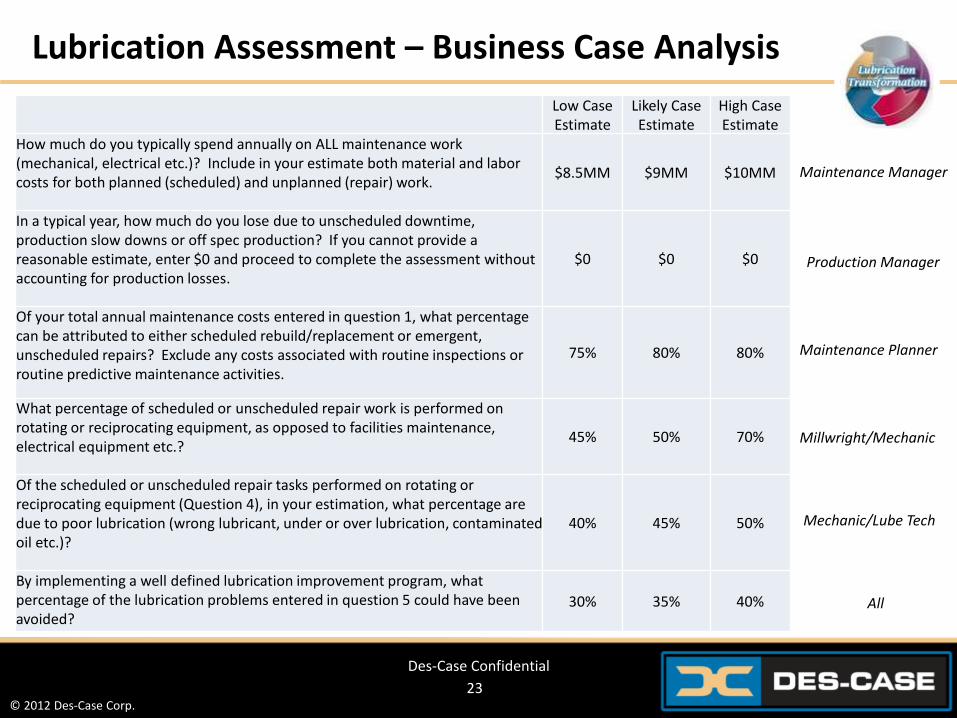
Lubrication Assessment – Business Case Analysis
Low Case Estimate
Likely Case Estimate
High Case Estimate
How much do you typically spend annually on ALL maintenance work (mechanical, electrical etc.)? Include in your estimate both material and labor costs for both planned (scheduled) and unplanned (repair) work.
$8.5MM $9MM $10MM
In a typical year, how much do you lose due to unscheduled downtime, production slow downs or off spec production? If you cannot provide a reasonable estimate, enter $0 and proceed to complete the assessment without accounting for production losses.
$0 $0 $0
Of your total annual maintenance costs entered in question 1, what percentage can be attributed to either scheduled rebuild/replacement or emergent, unscheduled repairs? Exclude any costs associated with routine inspections or routine predictive maintenance activities.
75% 80% 80%
What percentage of scheduled or unscheduled repair work is performed on rotating or reciprocating equipment, as opposed to facilities maintenance, electrical equipment etc.?
45% 50% 70%
Of the scheduled or unscheduled repair tasks performed on rotating or reciprocating equipment (Question 4), in your estimation, what percentage are due to poor lubrication (wrong lubricant, under or over lubrication, contaminated oil etc.)?
40% 45% 50%
By implementing a well defined lubrication improvement program, what percentage of the lubrication problems entered in question 5 could have been avoided?
30% 35% 40%
Des-Case Confidential
Maintenance Manager
Production Manager
Maintenance Planner
Millwright/Mechanic
Mechanic/Lube Tech
All

© 2012 Des-Case Corp. 24
Lubrication Assessment – Business Case Analysis
Response Calculated value
Choose low, medium or high case estimate likely case
Annual maintenance costs $9,000,000 $9,000,000
Downtime losses $0 $0
Scheduled PM and Repair costs 80% $7,200,000
Amount spent on rotating/reciprocating equipment
50% $3,600,000
Percentage of lubrication related problems 45% $1,620,000
Percentage of lubrication problems that can be eliminated
35% $567,000
Estimated Annual Losses Due to Poor Lubrication likely case $1,620,000
Addressable Losses Due to Poor Lubrication
likely case $567,000
Des-Case Confidential

© 2012 Des-Case Corp. 25
Lubrication Transformation™ – Macro Business Case
Des-Case Confidential

© 2012 Des-Case Corp. 26
Foundry Case Study | Dust Collector Bearings
• 26 Dust Collector Units • 250hp motors greased every 90 days • 6” fan bearings greased every two weeks
Current Practice • 16.65 fl.oz. of grease per motor bearing / 90 days • 3.33 fl.oz. of grease per fan bearing / 14 days
Calculated Practice • 1.35 fl.oz. of grease per motor bearing / 90 days • 5.48 fl.oz. of grease per fan bearing / 30 days
Assumptions • Cost of grease = $0.4/oz
• Cost of labor = $25/hr
• Time per shot = 4 seconds
Conclusions • Using the calculated relubrication volumes and frequencies on 26 dust collectors, there
would be a savings of $1747.64 per year which has a 5 year NPV of $5858.00. In addition, the amount of time that could be redirected to value added tasks is almost 40 hours per year.
• The above calculations do not account for travel time or damage to the bearing from over-lubrication or using the wrong lubricant reducing the useful life of the bearings.
• The grease selection for the fan bearings was also incorrect. A grease with a lower base oil viscosity should be selected.
Des-Case Confidential

© 2012 Des-Case Corp. 27
Foundry Case Study | Bearings
Statistics • More than 50% of electric motor failures are
bearing related. • An estimated 95% of all bearing failures are
premature. • 58% of bearing failures are due to poor lubrication,
contamination, over-lubrication or wrong lubricant selection.
Assumptions • $65,796.50 total electric motor purchases and rebuilds in 2011. • $1,496,623 total bearing purchases in 2011 (not including electric motor bearings)
Conclusions Based on Statistics • $65,796.50 x 50% x 58% = $19,080.99 failures likely due to poor lubrication, contamination, over-
lubrication or wrong lubricant selection in 2011.
• $1,496,623 x 58% = $868,041 in avoidable lubrication failures total bearing purchases in 2011 (not including electric motor bearings)
Des-Case Confidential

© 2012 Des-Case Corp. 28
Foundry Case Study – Closing the Gap
GAP = Benefits - Total Upfront Program Costs = ($1747.64 + $19,080.99 + $868,041) - $344,750 = $924,258.49 - $344,750 = $544,119.63
Des-Case Confidential

© 2012 Des-Case Corp. 29
Des-Case Confidential
Questions?
Putting best practices into practice…
Jason Kopschinsky, CMRP Director of Reliability Services
Des-Case Corporation 905.999.0076