International Police Executive Symposium (IPES) Are Police Agents Members of the Civil Society?
The Transition to Primary Education
Insights from the Growing Up in Ireland Study
Emer Smyth

THE TRANSITION TO PRIMARY EDUCATION:
INSIGHTS FROM THE GROWING UP IN IRELAND
STUDY
Emer Smyth
May 2018
Available to download from www.esri.ie
The Economic and Social Research Institute Whitaker Square, Sir John Rogerson’s Quay, Dublin 2
ISBN: 978-0-7070-0456-3 DOI: https://doi.org/10.26504/bkmnext360
This Open Access work is licensed under a Creative Commons Attribution 4.0 International License, which permits unrestricted use, distribution, and reproduction in any medium, provided the original work is properly credited.
ABOUT THE ESRI
The Economic and Social Research Institute (ESRI) is an independent research
institute working towards a vision of ‘informed policy for a better Ireland’. The
ESRI seeks to support sustainable economic growth and social progress in Ireland
by providing a robust knowledge base capable of providing effective solutions to
public policy challenges.
The Institute was founded in 1960 by a group of senior civil servants, led by
Dr T.K. Whitaker, who identified the need for independent and in-depth research
to support the policymaking process in Ireland. Since then, the Institute has
remained committed to independent research and its work is free of any expressed
ideology or political position. The Institute publishes all research reaching the
appropriate academic standard, irrespective of its findings or who funds the
research.
The ESRI brings together leading experts from a variety of disciplines who work
together to break new ground across a number of research initiatives. The
expertise of its researchers is recognised in public life and researchers are
represented on the boards and advisory committees of several national and
international organisations.
ESRI researchers uphold the highest academic standards. The quality of the
Institute’s research output is guaranteed by a rigorous peer review process.
Research is published only when it meets the required standards and practices.
Research quality has also been assessed as part of two peer reviews of the
Institute, in 2010 and 2016.
ESRI research findings are disseminated widely in books, journal articles and
reports. Reports published by the ESRI are available to download, free of charge,
from its website. ESRI staff members communicate research findings at regular
conferences and seminars, which provide a platform for representatives from
government, civil society and academia to discuss key findings from recently
published studies and ongoing research.
The ESRI is a company limited by guarantee, answerable to its members and
governed by a Council, comprising a minimum of 11 members and a maximum of
14 members, who represent a cross-section of ESRI members: academia, civil
service, state agencies, businesses and civil society.
Further information is available at www.esri.ie.
THE AUTHOR
Emer Smyth is a Research Professor at the Economic and Social Research Institute
(ESRI) and an Adjunct Professor at Trinity College Dublin (TCD).
ACKNOWLEDGEMENTS
This study has been commissioned by the National Council for Curriculum and
Assessment (NCCA). I am very grateful for the support of Arlene Forster, Sarah
Fitzpatrick and John Hammond. The report has benefited from comments from an
external reviewer, two ESRI reviewers, Helen Russell and the ESRI Director, Alan
Barrett.
The data for this report come from Waves 1, 2 and 3 of the Infant Cohort of the
Growing Up in Ireland survey (GUI). GUI has been funded by the Government of
Ireland through the Department of Children and Youth Affairs in association with
the Central Statistics Office (CSO) and the Department of Employment Affairs and
Social Protection. These data have been collected in accordance with the Statistics
Act, 1993. The Department of Children and Youth Affairs, the CSO and Department
of Employment Affairs and Social Protection take no responsibility for the views
expressed or the outputs generated from the research undertaken on the GUI data.

Tab le o f contents |iii
TABLE OF CONTENTS
ABBREVIATIONS ................................................................................................................................... viii
EXECUTIVE SUMMARY ........................................................................................................................... ix
CHAPTER 1 INTRODUCTION ............................................................................................................. 1
1.1 Background to the study ....................................................................................... 1
1.2 The policy context ................................................................................................. 2
1.3 Research on the transition to primary school ....................................................... 4
1.4 Methodology ......................................................................................................... 8
1.5 Outline of the report ........................................................................................... 16
CHAPTER 2 AGE ON STARTING SCHOOOL ...................................................................................... 17
2.1 Introduction ......................................................................................................... 17
2.2 Take-up of different types of education and care prior to starting school ......... 17
2.3 Preschool language development ....................................................................... 21
2.4 Age on starting school ......................................................................................... 23
2.5 Parental views on starting school ........................................................................ 32
2.6 Teacher views on starting school ........................................................................ 33
2.7 Transfer of information to the teacher ............................................................... 36
2.8 Conclusions .......................................................................................................... 37
CHAPTER 3 THE INFANT CLASSROOM ............................................................................................ 39
3.1 Introduction ......................................................................................................... 39
3.2 Class size and structure ....................................................................................... 39
3.3 Teacher characteristics ........................................................................................ 40
3.4 Teaching methods ............................................................................................... 40
3.5 Allocation of time within the class ...................................................................... 47
3.6 Home–school communication ............................................................................. 49
3.7 Conclusions .......................................................................................................... 53
ivThe t ransi t ion to pr imary educat ion
CHAPTER 4 CHILDREN’S EXPERIENCES OF THE TRANSITION TO PRIMARY SCHOOL ...................... 55
4.1 Introduction ......................................................................................................... 55
4.2 Settling into school .............................................................................................. 55
4.3 Vocabulary skills among five-year-olds ............................................................... 59
4.4 Teacher–pupil relationship .................................................................................. 64
4.5 Socio-emotional wellbeing .................................................................................. 71
4.6 Teacher rating of child skills ................................................................................ 78
4.7 Conclusions ........................................................................................................ 103
CHAPTER 5 CONCLUSIONS AND POLICY IMPLICATIONS .............................................................. 104
5.1 Introduction ....................................................................................................... 104
5.2 Preschool experiences and skill development .................................................. 104
5.3 Preparing for school start .................................................................................. 105
5.4 Early years classrooms ....................................................................................... 106
5.5 Settling into primary school .............................................................................. 107
5.6 Children’s skills at school entry ......................................................................... 107
5.7 Implications for policy ....................................................................................... 115
REFERENCES ................................................................................................................................... 120

Lists o f tables and f igures |v
LIST OF TABLES
Table 1.1 Number of missing cases on outcome measures ........................................................ 14
Table 2.1 Factors associated with age on starting school .......................................................... 30
Table 4.1 Multilevel models of factors associated with ease of transition to primary school ... 58
Table 4.2 Ordinary least squares regression models of factors associated with the five-year-
old’s BAS naming vocabulary test scores .................................................................... 62
Table 4.3 Multilevel models of factors associated with the quality of the teacher–child
relationship, as reported by the teacher .................................................................... 69
Table 4.4 Multilevel models of factors associated with the child having poorer socio-emotional
wellbeing (higher SDQ total difficulties score), as reported by the teacher ............... 74
Table 4.5 Multilevel models of the relationship between teacher–child relationship, vocabulary
skills at age 5 and the child having poorer socio-emotional wellbeing, as reported by
the teacher .................................................................................................................. 75
Table 4.6 Multilevel models of factors associated with the child having better pro-social
behaviour, as reported by the teacher ....................................................................... 77
Table 4.7 Multilevel models of the relationship between teacher–child relationship, vocabulary
skills at age 5 and the child having better pro-social behaviour, as reported by the
teacher ........................................................................................................................ 78
Table 4.8 Multilevel models of factors associated with the child having more negative attitudes
to school, as reported by the teacher ......................................................................... 81
Table 4.9 Multilevel models of the relationship between teacher–child relationship, vocabulary
skills at age 5 and the child having more negative attitudes to school, as reported by
the teacher .................................................................................................................. 83
Table 4.10 Multilevel models of factors associated with the child having poorer language skills,
as reported by the teacher .......................................................................................... 85
Table 4.11 Multilevel models of the relationship between teacher–child relationship, vocabulary
skills at age 5 and the child having poorer language skills, as reported by the teacher
..................................................................................................................................... 89
Table 4.12 Multilevel models of factors associated with the child’s skills in linking sounds and
letters, as reported by the teacher ............................................................................. 91
Table 4.13 Multilevel models of the relationship between teacher–child relationship, vocabulary
skills at age 5 and the child’s skills in linking sounds and letters, as reported by the
teacher ........................................................................................................................ 91
Table 4.14 Multilevel models of factors associated with children’s reading skills, as reported by
the teacher .................................................................................................................. 96
Table 4.15 Multilevel models of the relationship between teacher–child relationship, vocabulary
skills at age 5 and children’s reading skills, as reported by the teacher ..................... 97
Table 4.16 Multilevel models of factors associated with children’s number skills, as reported by
the teacher ................................................................................................................ 101

vi|The t rans it ion to pr imary educat ion
Table 4.17 Multilevel models of the relationship between teacher–child relationship, vocabulary
skills at age 5 and the child’s number skills, as reported by the teacher.................. 102
Table 5.1 Summary of analyses of the child and family factors associated with child outcomes
at age 5 ...................................................................................................................... 109
Table 5.2 Summary of analyses of the relationship between school type and child outcomes at
age 5 .......................................................................................................................... 113
LIST OF FIGURES
Figure 1.1 Timing of home-based and school-based fieldwork ................................................... 10
Figure 2.1 Receipt of non-parental care and education at 9 months old .................................... 18
Figure 2.2 Receipt of non-parental care and education at 3 years of age ................................... 19
Figure 2.3 Payment for additional hours of care and education among those taking part in the
ECCE scheme ............................................................................................................... 20
Figure 2.4 Naming vocabulary at age 3 by social background (model results) ............................ 21
Figure 2.5 Naming vocabulary at age 3 by child and family characteristics (model results) ....... 23
Figure 2.6 Proportion of children in junior infant classes aged 4 years or under on 1 January of
the school year ............................................................................................................ 24
Figure 2.7 Cumulative percentage of children who have started school by age in months ........ 24
Figure 2.8 Average age (in months) starting school by family socio-economic characteristics .. 25
Figure 2.9 Average age (in months) starting school by DEIS status of the school ....................... 26
Figure 2.10 Teacher rating of importance of different skills and competencies for a child’s
readiness to start school ............................................................................................. 34
Figure 2.11 Teacher agreement (% ‘agree’ and ‘strongly agree’) with statements on preparation
for primary school ....................................................................................................... 35
Figure 2.12 Teacher reports on receipt of information in relation to children in their class and
their satisfaction with this information....................................................................... 37
Figure 3.1 Proportion of children experiencing different forms of play in the classroom ‘every
day’, as reported by teachers ...................................................................................... 41
Figure 3.2 Proportion of children experiencing different forms of grouping and interaction in
the classroom ‘every day’, as reported by teachers ................................................... 43
Figure 3.3 Proportion of children experiencing whole-class teaching ‘every day’ by class size, as
reported by teachers ................................................................................................... 43
Figure 3.4 Proportion of children experiencing different forms of teaching and learning in the
classroom ‘every day’, as reported by teachers.......................................................... 44
Figure 3.5 Proportion of children experiencing different approaches to reading and maths in
the classroom ‘every day’, as reported by teachers ................................................... 46
Lists o f tables and f igures |vii
Figure 3.6 Proportion of children in classes where ICT is used ‘every day’, as reported by
teachers ....................................................................................................................... 47
Figure 3.7 Average number of minutes per week spent on different subject areas in junior and
senior infant classes .................................................................................................... 48
Figure 3.8 Average number of minutes per week spent on selected subjects by DEIS status of
the school .................................................................................................................... 48
Figure 3.9 Teacher reports on frequency of contact with parents .............................................. 50
Figure 3.10 Summary measure of teacher contact with parents by child and parent
characteristics ............................................................................................................. 51
Figure 3.11 Summary measure of teacher contact with parents by classroom and school
characteristics ............................................................................................................. 52
Figure 4.1 Parental perceptions of child settling into primary school ......................................... 56
Figure 4.2 Naming vocabulary (BAS) at age 5 by social background characteristics ................... 60
Figure 4.3 Naming vocabulary (BAS) at age 5 by child and family characteristics ....................... 61
Figure 4.4 Naming vocabulary (BAS) at school entry by DEIS status of the school ..................... 64
Figure 4.5a Teacher–child closeness (highest and lowest quartiles) by child characteristics ....... 66
Figure 4.5b Teacher–child conflict by child characteristics ............................................................ 67
Figure 4.6 Proportion of children with whom teachers report high levels of conflict by school
characteristics ............................................................................................................. 68
Figure 4.7 Child’s socio-emotional difficulties and prosocial behaviour by DEIS status of the
school .......................................................................................................................... 73
Figure 4.8 Child attitudes and disposition to school, as reported by the teacher ....................... 80
Figure 4.9 Child skills in language for communication and thinking, as reported by the teacher
..................................................................................................................................... 84
Figure 4.10 Children’s skills in linking sounds and letters, as reported by the teacher ................. 89
Figure 4.11 Children’s skills in linking sounds and letters by DEIS status of the school and class
level ............................................................................................................................. 92
Figure 4.12 Children’s reading skills, as reported by the teacher .................................................. 94
Figure 4.13 Children’s reading skills by DEIS status of the school and class level ......................... 95
Figure 4.14 Children’s number skills, as reported by the teacher ................................................. 99
Figure 4.15 Children’s number skills by DEIS status of the school and class level ....................... 100
vi i i |Abbreviat ions
Abbreviations
AIM Access and Inclusion Model
BAS British Ability Scale
CSO Central Statistics Office
DEIS Delivering Equality of Opportunity in Schools
ECCE Early Childhood Care and Education
EPPE Effective Preschool and Primary Education
GUI Growing Up in Ireland
NCCA National Council for Curriculum and Assessment
NSAI National Síolta Aistear Initiative
RMF Researcher Micro File
SDQ Strengths and Difficulties Questionnaire
SEN Special educational need

Execut ive summary |ix
EXECUTIVE SUMMARY
BACKGROUND TO THE STUDY
There has been considerable change in the early years policy landscape in recent
years, with the expansion of funded preschool provision, the introduction of
Aistear: The Early Childhood Curriculum Framework, work on facilitating the
transition from preschool to primary school and the ongoing revision of the
primary curriculum. It is therefore timely to look at children’s experiences adjusting
to primary education and the dispositions and skills they bring with them to the
school setting. The Growing Up in Ireland (GUI) study provides new information on
this crucial transition phase, placing experiences and outcomes in the context of
child and family factors from the first year of life. The report draws on information
on over 9,000 five-year-old children and their families, as well as on the
perspectives of their classroom teachers and school principals. The study, funded
by the National Council for Curriculum and Assessment (NCCA), addresses the
following key questions:
• What factors influence age at starting school? How do parents go about helping
prepare their children for starting school?
• What kinds of learning experiences are offered to children in the early years of
primary education? Does this differ across schools and classrooms?
• How do children settle into primary school? Do some groups of children
experience greater difficulties adjusting to the new setting?
• What cognitive and non-cognitive skills and capacities do children have at this
key transition phase?
This executive summary presents an overview of the main findings and outlines
their implications for policy development.
PREPARING FOR SCHOOL START
The cohort of children in the GUI study was the first to avail of a funded preschool
place provided through the Early Childhood Care and Education (ECCE) scheme,
with almost all families taking part in the scheme. Children varied in their prior
experience of non-parental care, with just over one-quarter in centre-based
settings at the age of three, that is, before beginning the ECCE scheme. Children
differed in their cognitive development before starting school, with marked
variation by the socio-economic circumstances of their family and by whether the
child had a disability/special educational need (SEN) or not.
The age at starting school has become older over time, with this increase being
more marked after the introduction of the ECCE scheme. Children tend to be older

x|The t rans it ion to pr imary educat ion
on school entry if they come from professional/managerial and highly educated
families. Children with a disability, especially those with socio-emotional or
learning difficulties, also tend to start school later than their peers. Mothers are
found to engage in a range of activities to support their child’s school entry,
including talking to their child about school, visiting the school and practising
reading, writing or numbers with the child.
Over time, there has been a significant shift in research and policy discourse from
focusing on children being ‘school ready’ towards looking at the interplay between
the family, school and child in facilitating the transition process (see O’Kane, 2016,
for a review of the relevant literature). The current study indicates that teachers,
in assessing the skills and dispositions they expect a child to possess on starting
school, tend to emphasise practical skills, such as a child managing their personal
care, and interpersonal or socio-emotional skills, such as being able to
communicate their needs, taking turns and not being disruptive. Pre-academic
skills are seen as a less important prerequisite by teachers. Teachers generally
receive information on whether the child coming into their class has a SEN, on the
child’s family circumstances and on whether the child has attended preschool.
However, teachers reported receiving little information on the skills developed in
preschool and the child’s individual strengths or challenges. This lack of
information is likely to constrain continuity in learning experiences for children and
current policy work by the NCCA is focusing on the development of templates that
would help facilitate the transfer of information between preschool and primary
school settings (NCCA, 2018a).
THE EARLY YEARS CLASSROOM
At the time of the teacher survey, the majority (72 per cent) of the five-year-olds
were in senior infant classes, with the remainder in junior infants classes.1 Teachers
were asked about the kinds of approaches they used in their classroom. The use of
whole-class teaching and individual work was the most common pattern at junior
and senior infant levels. Play-based activities are a common feature of early years
classrooms, but creative and pretend play are less frequently used in senior infants
than in junior infants classes. Junior infants groups in multi-grade classes (that is,
children from different levels in the same class) tend to experience less play-based
and hands-on activities than those in single-grade settings, presumably because
the teacher is also managing the activities of older children. Teachers in urban DEIS
(Delivering Equality of Opportunity in Schools) schools, especially Urban Band 1
schools, appear to place greater emphasis on some literacy and numeracy activities
as well as on play-based and hands-on activities than teachers in other schools.
1 Only a tiny number of children had not started school by the autumn of 2013.
Execut ive summary |xi
THE SETTLING-IN PROCESS
Mothers reported that the vast majority of five-year-olds were positive about
school, looking forward to going and saying good things about school. Only a small
proportion (4–5 per cent) of children frequently complain or are upset about going
to school, though one-fifth experience occasional difficulties. Transition difficulties
are more common among boys, those with disabilities, those with socio-emotional
difficulties, those from lone parent families and those from larger families. Ease of
transition is enhanced by the child having a positive relationship with their mother
and having experienced more home learning activities (such as being read to and
creative play) in their preschool years. Almost all the study children had
experienced centre-based care through the ECCE scheme so it is not possible to
assess whether taking part in the scheme facilitates the transition to primary
school. There is no evidence that experience of non-parental care prior to taking
part in ECCE makes a difference to the settling-in process. Children who attend
smaller schools (<100 pupils) settle in more quickly but no other differences by
school type are evident.
CHILDREN’S DISPOSITIONS AND SKILLS AT SCHOOL ENTRY
A range of information was collected on children’s dispositions and skills at school
entry, including a vocabulary test and teacher ratings of the child’s outcomes along
a number of dimensions. Clear gender differences are apparent, with boys
achieving lower test scores and being seen as having more negative dispositions to
school, greater socio-emotional difficulties and poorer literacy-related skills.
Children’s outcomes at this early stage vary significantly by social background, with
children from more disadvantaged backgrounds (in terms of social class or parental
education) having more negative attitudes, more socio-emotional difficulties and
poorer literacy- and numeracy-related skills. Reflecting differences in social profile,
children attending urban DEIS schools have lower vocabulary test scores and are
seen as having less positive dispositions and pre-academic skills. There is some
evidence, however, that this gap is somewhat less for the senior infants group,
suggesting that school-based learning plays an important role in providing
disadvantaged children with the social and pre-academic skills they may not have
possessed on school entry. The largest gap in early outcomes is evident in relation
to children with disabilities or SEN.
The study collected new information on the quality of the teacher’s relationship
with the child, as reported by the teacher. Teachers tend to report less close and
more conflictual relationships with boys, children from disadvantaged
backgrounds and children with disabilities/SEN.

xi i|The t ransi t ion to pr imary educat ion
IMPLICATIONS FOR POLICY
Recent policy initiatives have emphasised the importance of ensuring a continuity
of learning experience over the transition from preschool to primary school (NCCA,
2018a). However, the study findings point to a lack of communication between
early years providers and primary teachers about the kinds of skills and dispositions
children have acquired before starting school. Work is currently underway by the
NCCA on developing transfer templates to help ensure an exchange of information
between providers and hence greater continuity of experience for young children.
However, it appears evident that the transfer of information needs to be part of
broader efforts to facilitate the transition into primary education (NCCA, 2018a).
The fact that adjustment difficulties are more common among certain groups of
children (especially boys and those with disabilities) provides an important
evidence base for school principals and teachers in developing supports for
children over the transition process.
The findings point to the important role of parents in fostering a learning
environment at home, with children who have been read to frequently by, and who
have engaged in creative and educational activities with, their parents (or other
family members) settling more quickly into primary school. Parents tend to engage
in a range of activities, such as visiting the school and talking about school, to help
their children prepare for starting school. The high level of communication
between parents and teachers at this stage of the primary career offers the
potential for schools to further involve parents in supporting their children’s
learning.
The kinds of learning opportunities offered to children in the early years of primary
education vary by the type of school and classroom they attend. Some of this
variation appears to reflect a targeting of additional support towards certain
groups of children, especially those in schools with a concentration of
disadvantage. However, logistical constraints also play a role, with challenges for
teachers of multi-grade and/or larger classes in using more play-based and hands-
on activities. This pattern points to the importance of differentiation in learning,
so that all children have the opportunity to experience play-based and hands-on
activities. The findings also point to greater potential to provide children in senior
infants with more play-based learning, in keeping with the approach experienced
at junior infants level.
The findings reveal a social gradient in the cognitive and non-cognitive skills and
capacities children possess before and on school entry. This social gradient
undoubtedly reflects broader social inequalities in the cultural, financial and social
resources possessed by families. However, it is important to note the way in which
children from more disadvantaged backgrounds have poorer quality relationships
with their teachers, even at this early stage. The findings indicate significant
challenges to the full inclusion of children with disabilities/SEN, with this group of
Execut ive summary |xiii
children experiencing a more difficult transition and having poorer pre-academic
skills and socio-emotional wellbeing. Again, poorer quality relationships with
teachers are evident for this group. The study found that differences in the
teacher–student relationship vary by gender, social background and having a SEN,
pointing to the importance of emphasising a positive school and classroom climate
and supporting teachers to build good relationships with all children. Future waves
of the GUI study will be used to examine whether this early differentiation in
children’s skills has longer-term implications for their experiences and outcomes
as they move through the education system.

Introduct ion |1
CHAPTER 1
Introduction
1.1 BACKGROUND TO THE STUDY
There has been very little research in Ireland about the experiences and
outcomes of children in the early years of primary education. The third
wave of the infant cohort of the Growing Up in Ireland (GUI) study,
conducted just after the children’s fifth birthday, presents an opportunity
to address this gap in knowledge by providing new information on this key
transition phase, incorporating the perspectives of parents, teachers and
school principals. Because of the young age of the children, survey
information is collected about rather than directly from the children,
although children took part in tests of cognitive development. Later waves
of the survey place greater emphasis on directly capturing children’s own
experiences.
Placing transition experiences in the context of family and child
characteristics from the first year of life provides rich insights into the
factors shaping integration into primary education. Such research is
particularly timely in a context where there has been a sea-change in the
nature of early years education, alongside ongoing revision of the primary
curriculum. This study was commissioned by the National Council of
Curriculum and Assessment (NCCA) to inform its work in early childhood
and primary education. It addresses the following key questions:
• What factors influence age at starting school? How do parents go about
helping prepare their children for starting school?
• What kinds of learning experiences are offered to children in the early
years of primary education? Does this differ across schools and
classrooms?
• How do children settle into primary school? Do some groups of children
experience greater difficulties adjusting to the new setting?
• What cognitive and non-cognitive skills and capacities do children have
at this key transition phase?
This chapter begins by placing the study in the context of recent policy
developments in early years education and of previous research on the
transition to primary school. It then goes on to describe the GUI study and
2|The trans it ion to pr imary educat ion
the methodology used in this report. The chapter concludes with a brief
outline of the report.
1.2 THE POLICY CONTEXT
Historically, children in Ireland have had a low level of participation in
centre-based care and education, with provision largely operating through
private crèches and childminders and a small number of community-based
providers serving more socio-economically disadvantaged populations.
Recent years have seen a sea-change in the policy landscape. The Early
Childhood Care and Education (ECCE) scheme was introduced in January
2010 to provide children between three years three months and four years
six months with access to a funded preschool year (15 hours per week) of
programme-based activities. The rationale for the scheme was explicitly
couched in terms of improving school readiness among young children:
‘Children who avail of pre-school are more likely to be ready for school and
a formal learning and social environment’ (Department of Children and
Youth Affairs, 2009). When first introduced, children qualified for one
school year, with an extension in coverage after September 2016. From
September 2018, children will be able to start the scheme from two years
and eight months old until the transfer to primary school. In addition,
Budget 2018 saw the introduction of the Affordable Childcare Scheme,
which provides a non-means-tested subsidy to contribute towards
childcare costs before participation in the ECCE scheme, with means-
tested supports to cover provision for children up to 15 years of age.
When the ECCE scheme was introduced, it was stipulated that children
assessed as having additional needs could avail of the scheme over a two-
year period on a pro rata basis. The issue of inclusion for children with
special needs received increasing policy attention in the years that
followed. The Access and Inclusion Model (AIM) was introduced in 2016 to
ensure that children with disabilities could access the ECCE scheme. It
includes a suite of measures and supports, including an inclusion charter
to which service providers sign up, the provision of expert advice and
support, therapeutic interventions and additional assistance in the
preschool room.
In tandem with the expansion of funded provision, there has been
increasing emphasis on improving the quality of early years provision.
Síolta, the National Quality Framework for Early Childhood Education, was
published in 2006. It was designed to support quality improvement across
all ECCE settings for children from birth to six years of age. The Síolta
manual, updated in 2017 (Department of Education and Skills, 2017), is

Introduction|3
designed to support providers in engaging in ongoing quality improvement
and planning. Its key principles centre on the value of early childhood, a
children-first philosophy, the importance of parental involvement,
teamwork, a holistic approach to pedagogy and the centrality of play in
children’s development. On the basis of these principles, the manual
specifies a set of standards that providers can use to reflect on their
practice. Quality measures have also involved the specification of a
minimum qualification level for preschool leaders. The Tusla Early Years
Inspectorate has responsibility for the regulatory inspection of early
childhood settings, while inspectors from the Department of Education
and Skills conduct education-focused inspections of ECCE provision.
A related development has been an increasing focus on the nature,
content and pedagogy of early years learning. Aistear, an early years
curriculum framework covering children from birth to six years of age, was
introduced by the NCCA in 2009. Aistear has four themes – wellbeing,
identity and belonging, communicating, and exploring and thinking – and
presents examples of good practice in early years education.2 It is
innovative in that it is designed to cover the full range of settings, from the
child’s own home to preschool and primary school provision (NCCA,
2009a). The framework plays a strong emphasis on the importance of play
in children’s learning and development (Kernan, 2007) as well on the
quality of relationships and interactions with adults and other children and
the importance of a language-rich environment (NCCA, 2009b).
Aistear and Síolta are viewed as complementary, with Síolta covering all
aspects of early years provision while Aistear focuses on early learning and
development (NCCA, 2009c). Aistear and the primary curriculum are also
seen as complementary in terms of their key principles (NCCA, 2009a),
although some commentators have highlighted important differences
between the two approaches (O’Connor and Angus, 2014; Gray and Ryan,
2016). An online practice guide has been developed to provide a range of
resources for practitioners in using Aistear and Síolta
(www.aistearsiolta.ie). In addition, the National Síolta Aistear Initiative
(NSAI) has been established to support the coordinated rollout of the two
frameworks.
Work is currently underway at the NCCA on the development of templates
to facilitate the exchange of information between early years providers
and primary schools, hence enhancing the continuity of experience across
the transition process (NCCA, 2018a). Pilot work with a network of
2 The philosophy underpinning Aistear is discussed in greater detail in French (2009).
4|The trans it ion to pr imary educat ion
preschools and primary schools highlighted the potential value of this
approach but indicated that these templates need to be underpinned by
broader work on developing positive relationships among all involved in
the transition process (NCCA, 2018a). The primary curriculum is itself
changing with the recent introduction of a new language curriculum and,
at the time of writing, work is underway on a new mathematics curriculum,
as well as broader efforts to review and redevelop the full primary
curriculum.
These policy changes serve as an important backdrop to interpreting the
findings of this study. The children in the GUI infant cohort were the first
cohort to avail of the ECCE scheme so their experience of early years
education was very different to that of earlier cohorts of children. They are
likely to have been affected by at least some of the measures designed to
improve the quality of provision. However, the survey of five-year-olds was
conducted in 2013–2014, so the children will not have experienced any
subsequent changes to the primary curriculum (see Section 1.4 on the
timing of the study).
1.3 RESEARCH ON THE TRANSITION TO PRIMARY SCHOOL
1.3.1 International research
There has been much less research on the transition into primary
education than on the transition from primary to secondary level.
Nonetheless, a number of studies point to factors that facilitate children
settling into the new context (for a useful overview of Irish and
international studies, see O’Kane, 2016). As with the transition to
secondary education, there tends to be a discontinuity in structures and
experiences for children in terms of the physical environment (such as the
size of the grouping), the complexity of the social setting (with school
involving more and different children and adults), the level of individual
attention they receive and often a different approach to learning (Pianta,
2004; Dockett and Perry, 2007). Pianta (2004) characterises the transition
as involving increasing demands on the child but decreasing support for
them.
Over time, there has been a significant shift in research and policy
discourse from focusing on children being ‘school ready’ towards looking
at the interplay between the family, school and child in facilitating the
transition process (O’Kane, 2016). School readiness was often seen in
terms of children having the requisite language skills as well as the socio-
emotional or behavioural disposition to engage with formal learning

Introduction|5
(Booth and Crouter, 2008). However, increasingly this concept has been
subject to critique, with commentators highlighting ‘readiness’ as more
accurately relating to the ‘fit’ between the child and the context
(classroom or school) rather than as involving a lack or deficit within the
child (Pianta and Cox, 1999; Vernon-Feagans et al., 2008). Empirical studies
show that most children settle into the new setting relatively quickly
(Peters, 2010; Bradshaw et al., 2012). However, some groups of children,
namely boys and those from more socio-economically disadvantaged
families, are found to experience greater adjustment difficulties (Farkas
and Hibel, 2008; Bradshaw et al., 2012). Having poorer communication
skills may act as a barrier to making friends and building relationships with
adults (Girard et al., 2017). Parenting practices and parental wellbeing are
found to operate as important protective factors in enhancing children’s
socio-emotional adjustment during this period (Hartas, 2011).
Some commentators have argued that children’s voice has been neglected
in studies of early years transitions (Einarsdottir, 2007), though a growing
body of studies tap into children’s own perspectives. A number of common
themes emerge from these studies, in particular, children’s mixture of
excitement and anxiety about the transition, less focus on play-based
activities in school than in preschool (a contrast between ‘work’ and ‘play’),
a more structured day and different relationships with key adults
(Broström, 2000, 2003; Pramling and Willams-Graneld, 1993; Einarsdottir,
2003; Corsaro and Molinari, 2000).
The effect of type of preschool care on child outcomes has been the
subject of a good deal of controversy, with a lack of consensus emerging
from study findings (for a useful summary of the literature, see Russell et
al., 2016). However, firmer evidence exists on the way in which a high
quality preschool experience can facilitate the development of cognitive
and non-cognitive (social and emotional) skills and hence an easier
adjustment to primary education (Corsaro and Molinari, 2000; Augustine
et al., 2009). The Effective Preschool and Primary Education (EPPE) study
in England highlighted the way in which the quality of the preschool, in
terms of staff qualifications (including having trained teachers on staff),
staff retention, leadership skills and parental involvement, enhanced
intellectual development, independence, concentration and sociability
(Sylva et al., 2010). These effects persisted through the early years of
primary education (Sammons, 2010). In keeping with American research
(see, for example, Levin, 2009), the effects of high quality preschool were
greater for children from socio-economically disadvantaged backgrounds
(Sammons, 2010). Information exchange between preschool and school
6|The trans it ion to pr imary educat ion
staff has also been found to ease the transition process (Corsaro and
Molinari, 2000; O’Kane, 2016).
More frequently, research has emphasised the way in which the skills and
dispositions young children have on school entry reflects the socio-
economic circumstances of their families (Lee and Burkam, 2002; Bradbury
et al., 2012). Thus, children whose parents hold professional jobs and have
high levels of education tend to have better language skills and fewer
socio-emotional difficulties on school entry (Hansen et al., 2010; Sylva et
al., 2010). Many studies have shown that these patterns reflect differences
in the home learning environment, that is, the kinds of informal learning
opportunities offered to children, such as being read to and engaging in
creative play (Sammons, 2010). However, other studies have shown that,
even accounting for differences in the home learning environment, the
cultural, social and economic resources of the family have a significant and
direct influence on child cognitive and non-cognitive skills at this stage
(Sullivan et al., 2013; Hartas, 2015). Furthermore, empirical studies have
highlighted the way in which these early inequalities have longer-term
consequences into secondary education and beyond (Duncan et al., 2007;
Ermisch et al., 2012; Chowdry and McBride, 2017).
1.3.2 Irish research
Existing research on children’s experiences of primary school has largely
focused on older children rather than those in the infant classes. Drawing
on GUI data, research points to the ways in which nine-year-old children’s
experiences of more active forms of learning and the time they spend on
different subject areas vary significantly across schools and classrooms
(McCoy et al., 2012). Girls, those attending fee-paying schools, those
attending gaelscoileanna (Irish-medium schools) and those in non-
disadvantaged schools are more likely to experience active learning in their
classroom than boys, those in English-medium schools and those in
disadvantaged (DEIS) schools.3 Nine-year-olds are found to have high levels
of engagement in school, liking school, looking forward to coming to school
and liking their teacher. However, even at this stage, higher levels of
disengagement are found among boys and those with special educational
needs (SEN) (McCoy et al., 2012; McCoy et al., 2012). Children’s wellbeing
is found to vary significantly across schools and, to some extent, across
classrooms within schools. A child’s social relationship with their teacher
emerges as an important influence on child self-image, with more negative
self-evaluations among students who ‘never like’ their teacher and who
3 DEIS (Delivering Equality of Opportunity in Schools) is part of the Department of Education and Skills’ strategy
to address educational disadvantage.

Introduction|7
are reported to have discipline problems. Negative relations with peers in
the form of bullying are associated with poorer self-image (Smyth, 2015).
The absence of longitudinal studies of very young children in Ireland has,
until now, limited the potential to explore the transition into primary
education. However, the growing body of research on early years provision
provides a useful context for the current study.
Previous analyses of the GUI data indicate relatively little direct impact of
the type of care setting experienced at the age of three on cognitive skills
(measured in terms of vocabulary test scores) and non-cognitive outcomes
(assessed in terms of socio-emotional difficulties and preschool behaviour)
at the age of five (McGinnity et al., 2015; Russell et al., 2016). However,
the home learning environment in the preschool years is found to have a
significant effect on children’s vocabulary skills at the age of five
(McGinnity et al., 2017). The only study to date that has compared child
development before and after taking part in the ECCE scheme indicates
that a significant skills gap by social class background remains unchanged,
or even widens, over the course of that year (McKeown et al., 2015). An
experimental study, the Preparing for Life initiative, involved the provision
of intensive supports from pregnancy onwards for parents and children in
a disadvantaged area of Dublin. The study evaluation indicated that,
compared to similar children who had not received such supports, children
in the study group saw a significant improvement in their cognitive
development, communication and language skills and a reduction in their
levels of hyperactivity and inattention at school entry (PFL Evaluation
Team, 2016).
A recent in-depth mixed methods study (Ring et al., 2016) provided
insights into perceptions of school readiness among early years educators
and primary school teachers. As in earlier Irish studies (see, for example,
Hayes et al., 1997; O’Kane, 2007), social and emotional skills were seen as
the most important by both groups, though early years practitioners
tended to place greater emphasis on the importance of children’s
dispositions (that is, attitudes) than primary teachers. Both groups also
emphasised the importance of English language communication skills,
though primary teachers placed greater value on fluency in the child’s
mother tongue (where it was not English). Preschool staff and parents
were more likely to emphasise the importance of the child having pre-
academic skills (for example, recognising numbers or letters) than were
primary teachers. The study found that early years staff were actively
engaged in introducing the idea of ‘big school’ to the children and served
as an important source of advice to parents on when children might best

8|The trans it ion to pr imary educat ion
start school. However, considerable variability was reported in the nature
of communication and contact between preschools and primary schools,
with a noteworthy lack of exchange of information on the implementation
of Aistear and Síolta.
From the child’s perspective, Ring et al.’s study (2016) highlighted the way
children viewed the primary school as ‘big’ and busy and how they
emphasised the importance of making friends in the new setting. Their
views of what primary school would be like were shaped by their parents
and by other children, especially older siblings. A small-scale study of
children in rural Ireland pointed to some difficulties in adapting to fewer
play opportunities over the transition (McGettigan and Gray, 2012). There
has not been a systematic evaluation to date of the implementation of
Aistear. However, a number of small-scale studies provide useful insights,
with one study pointing to the continued dominance of didactic methods
in early years primary classrooms, with teachers pointing to large class
sizes, among other factors, as constraints on implementing a play-based
curriculum (Gray and Ryan, 2016). Another study (Fallon and O’Sullivan,
2015) highlights the expectations of parents as an additional barrier to
adopting a play-based curriculum.
This study seeks to build upon this existing research by taking a longitudinal
perspective that traces the influence of family and child factors, from the
first year of life, on children’s experiences of the transition process to
primary school.
1.4 METHODOLOGY
1.4.1 Data
The GUI study was commissioned by the Department of Health and
Children through the (then) Office of the Minister for Children, in
association with the (then) Department of Social Protection and the
Central Statistics Office. The study has been carried out by a consortium of
researchers led by the Economic and Social Research Institute (ESRI) and
Trinity College Dublin (TCD). The study focuses on two cohorts of children:
a nine-month (infant) cohort and a nine-year-old (child) cohort. Analyses
presented in this report focus on the infant cohort.
The infant cohort survey was based on a nationally representative sample
of 11,134 children drawn from the Child Benefit register. Parents were first
surveyed when the child was nine months old. This report mainly draws on
the second and third waves of this survey, conducted when the child was
Introduction|9
three years of age (2010–2011) and five years of age (2013). A total of
9,001 families were surveyed in Wave 3 (when the child was five years of
age). At both waves, detailed interviews were conducted with the primary
caregiver (who was the mother in over 99 per cent of cases) and the
secondary caregiver, if resident in the household.4 Physical measurements
were taken of the child and children completed cognitive tests at both
waves. For Wave 3, home visits occurred between March and September
2013. Because of differences in month of birth and age starting school (see
Chapter 2), over one-quarter (28 per cent) of children had not started
school by the time of the home visit.
Later in 2013, questionnaires were sent to the child’s principal and
classroom teacher to gather information on the characteristics of their
school and class, as well as on teacher perceptions of the study child. All
but a handful of the children had started school by this time-point. The
survey covers both children who had started school in September 2012,
before the home visit, and children who newly joined junior infants in
September 2013. The study children were therefore spread over two class
levels – junior and senior infant classes.
Two features of the fieldwork timing are worth bearing in mind in
examining the study findings. Firstly, GUI is an age-based rather than a
stage-based cohort; children are surveyed at five years of age rather than
at the exact time of entering primary education. As a result, reflecting
month of birth and parental decisions about when to send their child to
school, over one-quarter of the children had not started school at the time
of the home-based visit; for this reason, their mothers could not answer
questions about the settling-in process (though they were asked about
preparation for starting school). The verbal skills test was administered
during the home visit and so reflected the skills of children at different
stages - those who had not experienced any formal primary schooling as
well as those who had already been in school for a year. The verbal skills
of the latter group are likely to have been influenced by their exposure to
school-based learning. Secondly, the timing of the school-based data
collection means that teachers are reporting on children in junior and
senior infant classes, who might be expected to differ in their skill
development as a result of their class level. Furthermore, the separation in
time between maternal and teacher accounts might reflect that time lag
4 Because the vast majority of primary caregivers were mothers, primary caregivers are referred to as
‘mothers’ in the remainder of the report.
10|The t ransi t ion to pr imary educat ion
as well as differences in perceptions of the child’s outcomes between the
two groups.5 The analyses presented in the remainder of the report take
account of different timing in school start by conducting separate analyses
for junior and senior infant groups, where appropriate.
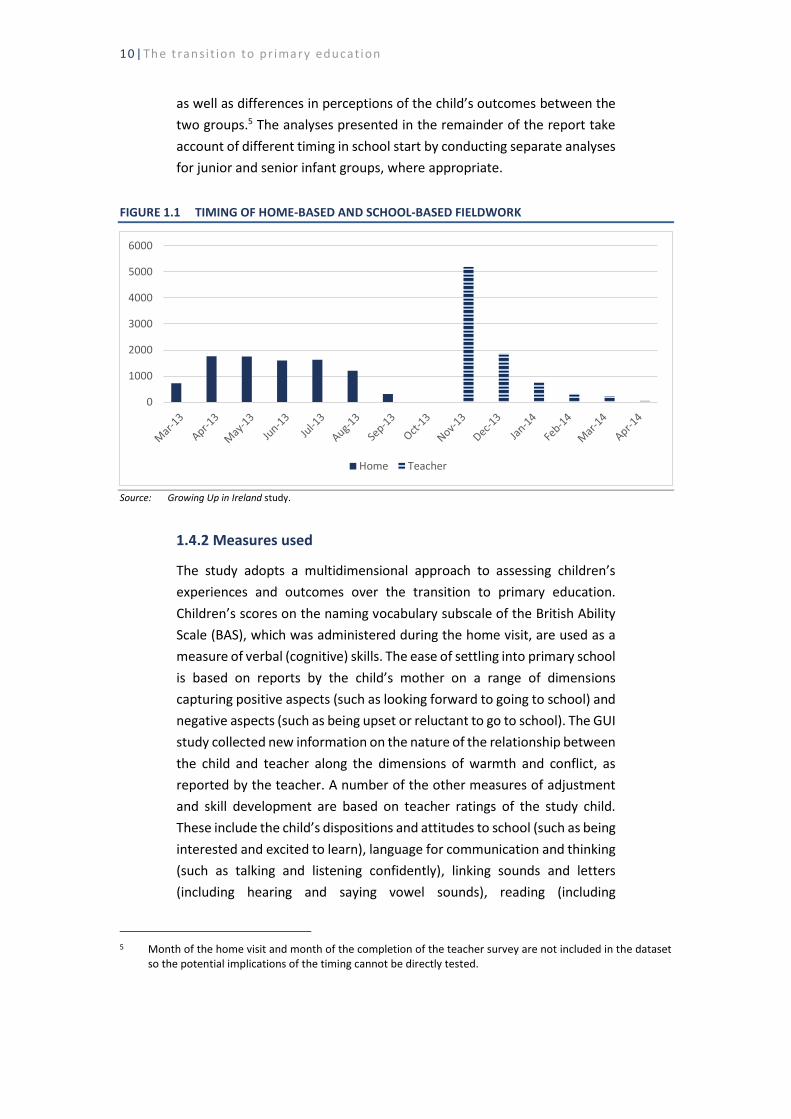
FIGURE 1.1 TIMING OF HOME-BASED AND SCHOOL-BASED FIELDWORK
Source: Growing Up in Ireland study.
1.4.2 Measures used
The study adopts a multidimensional approach to assessing children’s
experiences and outcomes over the transition to primary education.
Children’s scores on the naming vocabulary subscale of the British Ability
Scale (BAS), which was administered during the home visit, are used as a
measure of verbal (cognitive) skills. The ease of settling into primary school
is based on reports by the child’s mother on a range of dimensions
capturing positive aspects (such as looking forward to going to school) and
negative aspects (such as being upset or reluctant to go to school). The GUI
study collected new information on the nature of the relationship between
the child and teacher along the dimensions of warmth and conflict, as
reported by the teacher. A number of the other measures of adjustment
and skill development are based on teacher ratings of the study child.
These include the child’s dispositions and attitudes to school (such as being
interested and excited to learn), language for communication and thinking
(such as talking and listening confidently), linking sounds and letters
(including hearing and saying vowel sounds), reading (including
5 Month of the home visit and month of the completion of the teacher survey are not included in the dataset
so the potential implications of the timing cannot be directly tested.
0
1000
2000
3000
4000
5000
6000
Home Teacher
Introduction|11
understanding story) and numbers (including counting). The items used to
collect this information are a subset of those collected as a measure of
child achievement in the UK Millennium Cohort Study.6 In addition, the
child’s socio-emotional wellbeing is assessed on the basis of teacher
reports, using the widely used Strengths and Difficulties Questionnaire
(SDQ). More detailed descriptions of these outcome measures are given in
Chapter 4.
GUI data provide very rich background information on the socio-economic
circumstances of the children and their families, allowing for an analysis of
the factors influencing the transition to primary education. The individual
and family variables used for analysis throughout this report include the
following.
• Family social class: A social class classification, based on the Irish
Census of Population measure, was assigned to both mother and father
(where the latter was resident) based on their respective occupations.
In line with standard procedures, a dominance approach (see Erikson,
1984) was used, whereby in two-parent families, in which both partners
were economically active outside the home, the family’s social class
group was assigned on the basis of the higher of the two. This approach
provides a more accurate picture of the social position and resources of
the family as a whole. A six-fold classification of family social class is
used: professional and managerial, for shorthand often termed
‘middle-class’ in the text; non-manual, skilled manual and semi-
skilled/unskilled manual (for shorthand, termed ‘working-class’ in the
text); and non-employed.
• Mother’s education: The groups are lower secondary or less, Leaving
Certificate, post-secondary, tertiary degree and postgraduate degree.
Mother’s education is commonly used in the literature as it has been
found to be more highly predictive of child outcomes (Stevenson and
Baker, 1987).
• Family structure: A two-fold classification of family structure is used –
one-parent and two-parent.
• Number of older siblings: This reflects the family size into which
children are born; having older children may also mean that parents are
more familiar with the school system.
6 In England, the measure was based on the Foundation Stage Profile completed for all children at the end of
the first year of primary education by their teacher. In Wales, Scotland and Northern Ireland, these measures were replicated using a questionnaire to teachers (Johnson, 2008).

12|The t ransi t ion to pr imary educat ion
• Immigrant status: A family is defined as being an immigrant family if
both parents were born outside Ireland (or the sole parent if in a one-
parent family).
• Disability/SEN: This is based on the mother’s report when the child was
five years of age of whether the child had one or more of a list of
specified disabilities or SEN.7
• Location: This relates to whether the family is living in an urban or rural
area.
The GUI data also capture a number of different aspects of preschool
experiences at home and in other early childhood settings that might be
expected to influence skill development and the adjustment to primary
school. These include the following.
• The quality of the parent–child relationship: This was measured when
the child was three years of age using two subscales of the Pianta
Parent–Child Relationship Scale (Short Form) (Pianta, 1992), which
capture positive aspects (closeness) and level of conflict.
• The home learning environment: This involved capturing the number
of days in an average week in which someone at home engages in a
range of learning-related activities with the child (including reading,
learning songs and painting), based on the measure used in the EPPE
study (Sylva et al., 2010); and the number of children’s books in the
home.
• Measures of early cognitive development: This was captured by the
Naming Vocabulary and Picture Similarities scales from the BAS (Elliott
et al., 1996), which were administered by the interviewers when the
child was three years of age, and again at five years of age.
• Socio-emotional wellbeing: This was assessed using the SDQ
(Goodman, 1997). The questionnaire, completed by the mother (when
the child was three) and the mother and teacher (when the child was
five), includes four scales, which capture socio-emotional difficulties
(emotional symptoms, conduct problems, hyperactivity/inattention
and peer relationship problems). A positive measure of prosocial
behaviour, that is, positive interaction with others, was also captured
using the SDQ.
7 Information collected at five years of age is used, as some conditions may have been identified since the
previous wave of the survey, at three years of age. It should be noted that some specific learning difficulties (such as dyslexia) may not yet have been identified because of the child’s age.

Introduction|13
• The main type of care setting at the age of three: This was reported by
the mother, distinguishing between being cared for by parents only,
relatives, non-relatives, and in centre-based settings. Whether the child
had taken part in the ECCE scheme was also asked, at five years of age.
• Age at starting school: This was reported by the mother.
In order to examine potential variation in experiences across different
settings, a range of school and teacher (classroom) characteristics were
also taken into account. School characteristics included the DEIS status of
the school, the gender mix of the school and school size.8 Classroom
characteristics included whether the class was single-grade or multi-grade
(that is, included children from different levels in the same class, like junior
and senior infants), class size, teacher gender and teacher experience. It
should be noted that these factors are taken into account in order to
examine descriptive differences and cannot be used to infer teacher
‘effects’, since the timing of the school-based fieldwork means that most
children will already have completed junior infants, potentially with a
different teacher than they have in senior infants.
1.4.3 Analytical approach and treatment of missing data
Analyses presented in this report are based on the GUI detailed Researcher
Microdata Files. The data for all waves have been re-weighted (statistically
adjusted) to ensure that the information is representative of the
population of children in Ireland.
8 The Delivering Equality of Opportunity in Irish Schools (DEIS) scheme targets additional funding towards
schools serving more disadvantaged populations. At the time of the survey, these schools were selected on the basis of principals’ reports of the numbers of students with particular characteristics (including living in social housing, and being from an unemployed family). At primary level, there are three types of schools: DEIS Urban Band 1 (the most disadvantaged), DEIS Urban Band 2 and Rural DEIS.
14|The t ransi t ion to pr imary educat ion
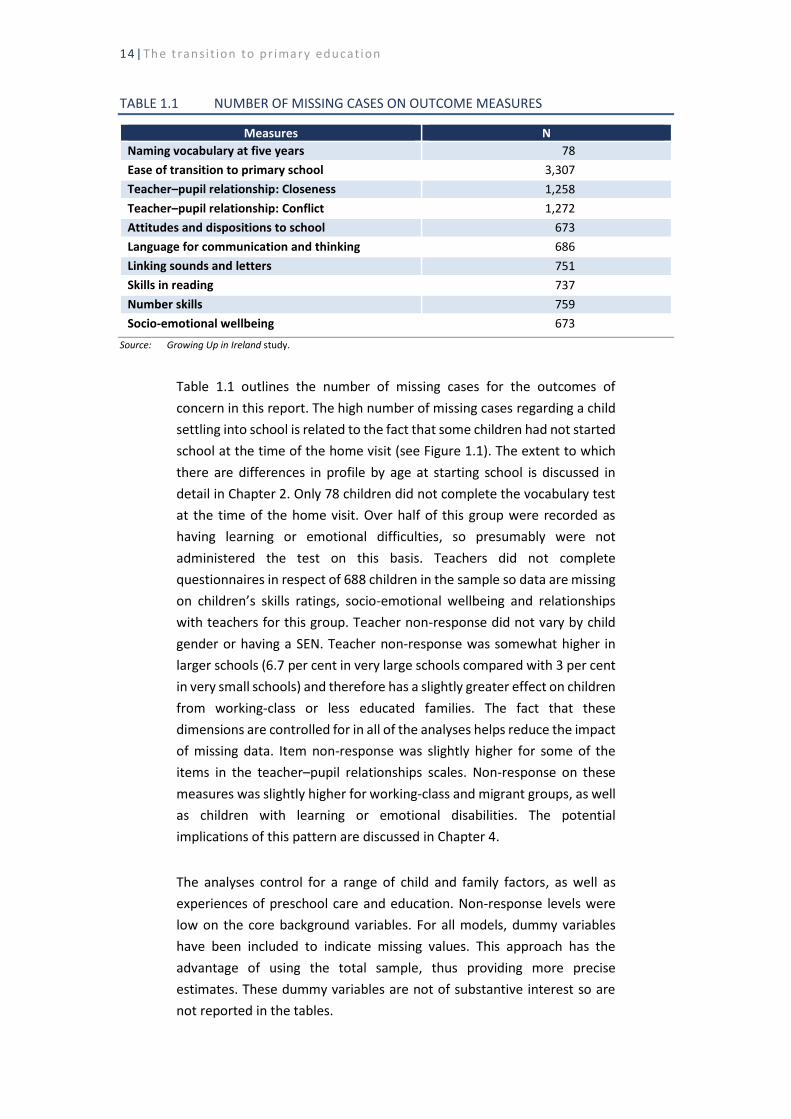
TABLE 1.1 NUMBER OF MISSING CASES ON OUTCOME MEASURES
Measures N
Naming vocabulary at five years 78
Ease of transition to primary school 3,307
Teacher–pupil relationship: Closeness 1,258
Teacher–pupil relationship: Conflict 1,272
Attitudes and dispositions to school 673
Language for communication and thinking 686
Linking sounds and letters 751
Skills in reading 737
Number skills 759
Socio-emotional wellbeing 673
Source: Growing Up in Ireland study.
Table 1.1 outlines the number of missing cases for the outcomes of
concern in this report. The high number of missing cases regarding a child
settling into school is related to the fact that some children had not started
school at the time of the home visit (see Figure 1.1). The extent to which
there are differences in profile by age at starting school is discussed in
detail in Chapter 2. Only 78 children did not complete the vocabulary test
at the time of the home visit. Over half of this group were recorded as
having learning or emotional difficulties, so presumably were not
administered the test on this basis. Teachers did not complete
questionnaires in respect of 688 children in the sample so data are missing
on children’s skills ratings, socio-emotional wellbeing and relationships
with teachers for this group. Teacher non-response did not vary by child
gender or having a SEN. Teacher non-response was somewhat higher in
larger schools (6.7 per cent in very large schools compared with 3 per cent
in very small schools) and therefore has a slightly greater effect on children
from working-class or less educated families. The fact that these
dimensions are controlled for in all of the analyses helps reduce the impact
of missing data. Item non-response was slightly higher for some of the
items in the teacher–pupil relationships scales. Non-response on these
measures was slightly higher for working-class and migrant groups, as well
as children with learning or emotional disabilities. The potential
implications of this pattern are discussed in Chapter 4.
The analyses control for a range of child and family factors, as well as
experiences of preschool care and education. Non-response levels were
low on the core background variables. For all models, dummy variables
have been included to indicate missing values. This approach has the
advantage of using the total sample, thus providing more precise
estimates. These dummy variables are not of substantive interest so are
not reported in the tables.
Introduction|15
In each chapter of this report, descriptive analyses of the main patterns
are presented, followed by multivariate models designed to look at a
number of factors simultaneously. Multilevel models are used for the
analyses in Chapter 4 in order to provide more precise estimates of
differences between schools and classrooms. Social systems frequently
have a hierarchical organisation; for example, people (level 1) live in
households (level 2) in local authority areas (level 3), and students (level 1)
learn in schools (level 2). The existence of hierarchically organised data
means that we need to take this hierarchy into account when analysing
data (Goldstein, 2003). Traditional regression techniques have involved
the assumption that there is no autocorrelation within the data; that is,
that students represent independent observations, rather than being
clustered within schools. Treating students in a school as independent
observations results in mis-estimated precision, incorrect standard errors,
confidence limits and tests (Jones, 1991). In contrast to regression
procedures, multilevel modelling techniques take the clustering of
individuals within groups into account.
Analyses presented in this report were carried out using the MLwiN
computer package (see Rasbash et al., 2012). Output from this package
provides estimates of both fixed and random parameters. Fixed
parameters can be interpreted in the same way as conventional regression
coefficients. Where outcomes are continuous (as with ease of transition to
primary school, for example), higher values indicate that the factor is
associated with a greater ease of transition, taking account of the other
factors in the model. Where outcomes are binary or categorical (as is the
case for attitudes to school, for example), the coefficients are presented in
terms of odds ratios; thus, an odds ratio of two for gender would indicate
that girls are twice as likely as boys to have very negative attitudes to
school. The distinctive feature of multilevel modelling is that it provides
estimates of random parameters – that is, the amount of variation
between individuals and schools. This can indicate the extent to which
schools differ, taking account of student characteristics. The findings based
in this report are based on three-level models, with children (level 1)
regarded as clustered within their classrooms (teachers) (level 2), which
are clustered within primary schools (level 3). The study children were
spread across 2,235 primary schools and had 4,006 teachers, reflecting the
fact that many children in the same school were taught by different class
teachers. Using a three-level model allows for a more precise estimate of
potential variation by both school type and teacher characteristics and
serves to control for the extent to which different types of teachers are
employed in different schools.
16|The t ransi t ion to pr imary educat ion
1.5 OUTLINE OF THE REPORT
Chapter 2 looks at children’s experiences of education and care prior to
starting school and the factors associated with age on starting school. The
chapter also examines parental and teacher views on the skills and
capacities children should have when starting school, as well as on the
kinds of information teachers receive on incoming students. Chapter 3
looks at the kinds of learning contexts experienced by five-year-olds,
including the size and structure of the class, the characteristics of their
teacher, the teaching methods used, time allocated to different subject
areas and the nature of communication between school and home.
Chapter 4 explores children’s adjustment to primary school, as reported by
their mother, and teacher ratings of the child’s skills and capacities.
Chapter 5 summarises the main findings and discusses the implications for
policy development.
Age on star t ing schoo l |17
CHAPTER 2
Age on starting school
2.1 INTRODUCTION
The appropriate age for children to start education has been the subject of
much research and policy debate internationally. There is very marked
variation across countries in school starting age, ranging from four to seven
years of age (Sharp, 2002; O’Kane and Murphy, 2016b). Research has
shown that children who are younger than their peers on school entry may
have greater academic and socio-emotional difficulties (see, for example,
Fredriksson and Öckert, 2014; Datar, 2006). School start can be influenced
by a range of factors, including the perceived maturity of the child, family
situation and parental employment. More broadly, the decision about
when to send a child to school may also reflect access to other forms of
education and care in the early years. This chapter looks at the factors
influencing age at starting school among the Growing Up in Ireland (GUI)
infant cohort, relating the timing to a broad array of family and child
factors. Section 2.2 places this decision in context by looking at children’s
participation in different forms of care and education before starting
school. Section 2.3 considers preschool language development, while
Section 2.4 focuses on children’s age on starting school. Sections 2.5 and
Section 2.6 look at the perceptions of when children are ‘ready’ to start
school on the part of parents and teachers respectively. Section 2.7 looks
at the transfer of information from preschool settings to primary school
teachers.
2.2 TAKE-UP OF DIFFERENT TYPES OF EDUCATION AND CARE PRIOR TO
STARTING SCHOOL
The sample in the infant cohort was the first cohort of children in Ireland
to be able to avail of the funded preschool year provided through the Early
Childhood Care and Education (ECCE) scheme. The survey collected
information on whether parents had availed of the scheme and whether
they had paid for additional hours over and above those provided through
the scheme. In addition, information had been collected on use of non-
parental care at nine months and three years of age.
At nine months old, 40 per cent of infants had been in receipt of non-
parental care on a regular basis each week. In total, 11 per cent of the
infants were in centre-based care, with 17 per cent being looked after by
a relative and 12 per cent a non-relative (either in their home or in the
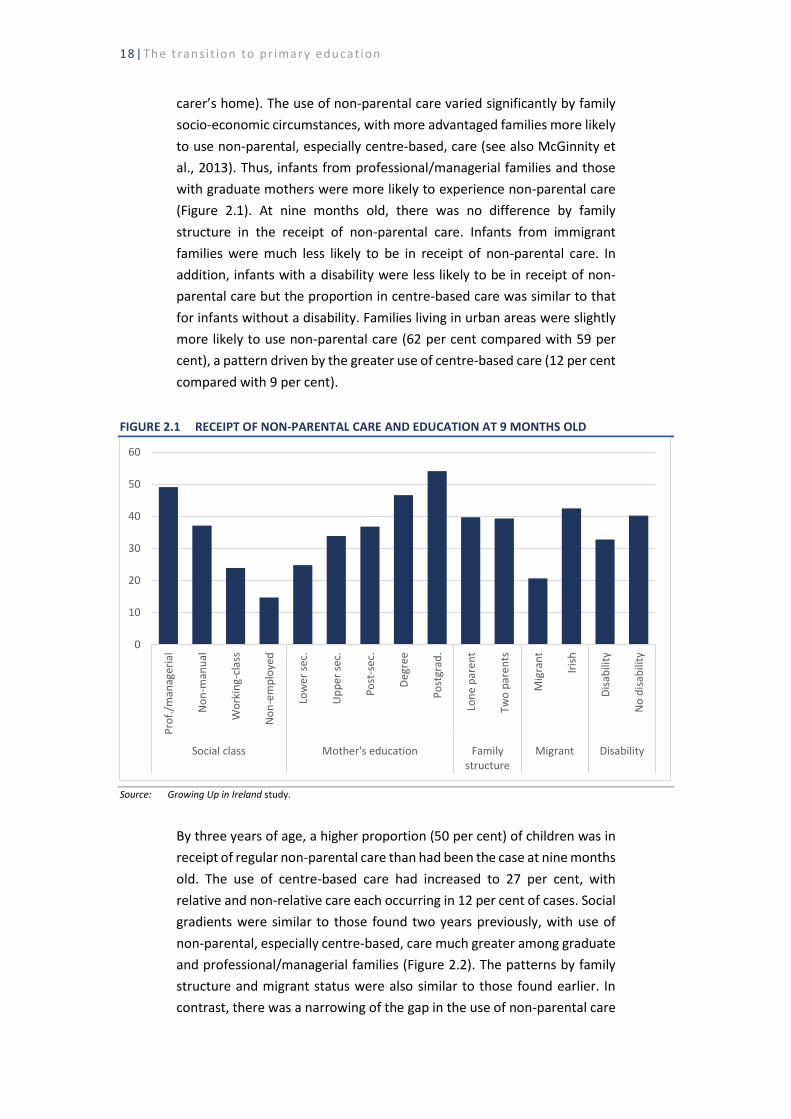
18|The t ransi t ion to pr imary educat ion
carer’s home). The use of non-parental care varied significantly by family
socio-economic circumstances, with more advantaged families more likely
to use non-parental, especially centre-based, care (see also McGinnity et
al., 2013). Thus, infants from professional/managerial families and those
with graduate mothers were more likely to experience non-parental care
(Figure 2.1). At nine months old, there was no difference by family
structure in the receipt of non-parental care. Infants from immigrant
families were much less likely to be in receipt of non-parental care. In
addition, infants with a disability were less likely to be in receipt of non-
parental care but the proportion in centre-based care was similar to that
for infants without a disability. Families living in urban areas were slightly
more likely to use non-parental care (62 per cent compared with 59 per
cent), a pattern driven by the greater use of centre-based care (12 per cent
compared with 9 per cent).
FIGURE 2.1 RECEIPT OF NON-PARENTAL CARE AND EDUCATION AT 9 MONTHS OLD
Source: Growing Up in Ireland study.
By three years of age, a higher proportion (50 per cent) of children was in
receipt of regular non-parental care than had been the case at nine months
old. The use of centre-based care had increased to 27 per cent, with
relative and non-relative care each occurring in 12 per cent of cases. Social
gradients were similar to those found two years previously, with use of
non-parental, especially centre-based, care much greater among graduate
and professional/managerial families (Figure 2.2). The patterns by family
structure and migrant status were also similar to those found earlier. In
contrast, there was a narrowing of the gap in the use of non-parental care
0
10
20
30
40
50
60
Pro
f./m
anag
eria
l
No
n-m
anu
al
Wo
rkin
g-cl
ass
No
n-e
mp
loye
d
Low
er s
ec.
Up
per
sec
.
Po
st-s
ec.
Deg
ree
Po
stgr
ad.
Lon
e p
are
nt
Two
par
en
ts
Mig
ran
t
Iris
h
Dis
abili
ty
No
dis
abili
ty
Social class Mother's education Familystructure
Migrant Disability

Age on star t ing schoo l |19
for children with and without disabilities. The urban–rural difference was
greater for toddlers than for infants, with 35 per cent of families in urban
areas using centre-based care compared with just 20 per cent of those in
rural areas. Overall, patterns of participation in non-parental care reflect a
complex interplay of different factors, including rates of maternal
employment, access (both in terms of household income and geographical
location) and the availability of extended family to help with childcare (see
McGinnity et al., 2013). This study is concerned not with the causes of
differential take-up but with the consequences in terms of children’s
exposure to different types of care before they start primary school.
FIGURE 2.2 RECEIPT OF NON-PARENTAL CARE AND EDUCATION AT 3 YEARS OF AGE
Source: Growing Up in Ireland study.
The vast majority (96 per cent) of parents availed of the ECCE scheme, with
just under one-quarter (23 per cent) of families paying for additional hours
with the same provider. Although ECCE take-up levels were high across all
groups of families, some groups had higher non-take-up levels than others;
this related to more disadvantaged groups (12 per cent of the non-
employed and 10 per cent of those with lower secondary education or less)
and to the child having a disability (9 per cent non-take-up). More
advantaged groups were more likely to pay for additional hours over and
above the ECCE provision (Figure 2.3), with highest levels of take-up among
the professional/managerial group and graduate, especially postgraduate,
mothers. A gap in take-up appears by family structure, with lone parents
less likely to pay for hours over and above those provided through ECCE.
0
10
20
30
40
50
60
70
80
Pro
f./m
anag
eria
l
No
n-m
anu
al
Wo
rkin
g-cl
ass
No
n-e
mp
loye
d
Low
er s
ec.
Up
per
sec
.
Po
st-s
ec.
Deg
ree
Po
stgr
ad.
Lon
e p
are
nt
Two
par
en
ts
Mig
ran
t
Iris
h
Dis
abili
ty
No
dis
abili
ty
Social class Mother's education Familystructure
Migrant Disability
%

20|The t ransi t ion to pr imary educat ion
Those from migrant families were also less likely to pay for additional hours
while those in urban areas were more likely to do so (29 per cent compared
with 18 per cent). There was no difference in the rate of use of additional
hours by child disability.
FIGURE 2.3 PAYMENT FOR ADDITIONAL HOURS OF CARE AND EDUCATION AMONG THOSE TAKING PART IN THE ECCE SCHEME
Source: Growing Up in Ireland study.
These patterns mean that children have had very different exposure to
non-parental care and centre-based settings prior to starting school. While
almost all have had some exposure through the ECCE programme, the type
and duration of non-parental care varies significantly by family socio-
economic circumstances. As a result of this differentiation, children
starting in different types of primary schools will have had different
experiences of early childhood care and education. In particular, children
starting in DEIS (Delivering Equality of Opportunity in Schools) schools are
less likely to have experienced non-parental care at the ages of nine
months and three years of age. Furthermore, non-take-up of ECCE, at 16
per cent, was highest among those going to Urban Band 1 DEIS schools.
Payment for additional hours over and above those provided under the
ECCE scheme was also less prevalent among those who subsequently went
to DEIS schools.
Analyses later in the report examine whether the type of preschool care
and education received influences the ease of transition to primary
0
5
10
15
20
25
30
35
40
45
Pro
f./m
anag
eria
l
No
n-m
anu
al
Wo
rkin
g-cl
ass
No
n-e
mp
loye
d
Low
er s
ec.
Up
per
sec
.
Po
st-s
ec.
Deg
ree
Po
stgr
ad.
Lon
e p
are
nt
Two
par
en
ts
Mig
ran
t
Iris
h
Dis
abili
ty
No
dis
abili
ty
Social class Mother's education Familystructure
Migrant Disability
%

Age on star t ing schoo l |21
education. The following section looks at the skills children have developed
before they enter the school system, focusing on language development.
2.3 PRESCHOOL LANGUAGE DEVELOPMENT
The longitudinal nature of the GUI study means that we can look at the
skills developed by children before they reached school age, as well as
exploring their development on school entry. At the age of three, the
children were administered the British Ability Scale (BAS) test on naming
vocabulary, which captured their verbal skills at this stage. Figure 2.4
shows variation by social background characteristics in the vocabulary test
scores, while Figure 2.5 shows differences by other child and family
characteristics. These figures are based on multivariate model results (full
models not shown here), which allows us to compare the simultaneous
effects of different characteristics.
FIGURE 2.4 NAMING VOCABULARY AT AGE 3 BY SOCIAL BACKGROUND (MODEL RESULTS)
Source: Growing Up in Ireland study.
It is clear that language development among three-year-olds differs
significantly by the socio-economic characteristics of their families.
Children from professional/managerial families achieve around two points
more than those from semi/unskilled manual backgrounds, while those
from non-employed households achieve even lower scores, even taking
account of the mother’s education. Children whose mothers have a
primary or postgraduate degree score 2.8 to 3.6 points higher than other
children (Figure 2.4). Children’s vocabulary test scores do not vary by
-2
-1
0
1
2
3
4
Pro
fess
ion
al
Man
ager
ial
No
n-m
anu
al
Skill
ed
man
ual
No
n-e
mp
loye
d
Leav
ing
Cer
t.
Po
st-s
eco
nd
ary
Tert
iary
Po
stgr
adu
ate
Social class (Ref.: Semi/unskilled)Mother's education (Ref.: Lower secondary or
less)

22|The t ransi t ion to pr imary educat ion
family structure, that is, whether they are from a lone parent or two-
parent family, once social class and parental education are taken into
account (Figure 2.5). However, children with more older siblings have
significantly poorer language development at this stage. Girls score better
in this vocabulary test, by about three points, than boys. Those living in
urban areas have lower vocabulary scores on average than those in rural
areas, even taking account of differences in socio-economic
characteristics. Children from migrant backgrounds achieve significantly
lower vocabulary scores than children from native Irish families, with a
sizeable gap of 7.7 points evident at the age of three. There is also a
developmental gap for children with disabilities, who score almost five
points lower than their peers.
In sum, early language development varies markedly by the social
circumstances of the family into which children are born. These patterns
are important given the role of vocabulary as a foundation for later school
engagement (see Kennedy et al., 2012). At the same time, it is important
to note that social class background and maternal education explain only
4 per cent of the variation found in children’s test scores. Thus, while social
differentiation is marked, other factors also play a role in shaping
children’s developmental outcomes.
The extent to which early language development influences children’s
skills and dispositions on school entry is explored further in Chapter 4. The
following section examines whether early vocabulary skills play a role in
the timing of children’s school start.
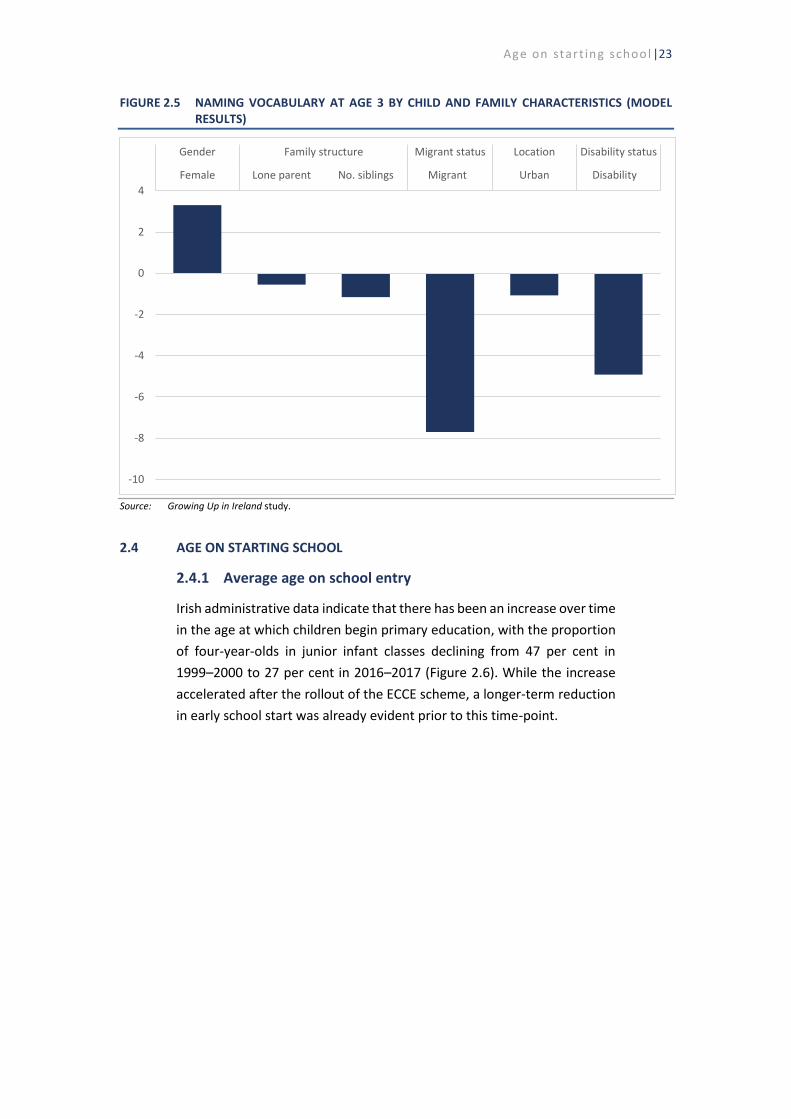
Age on star t ing schoo l |23
FIGURE 2.5 NAMING VOCABULARY AT AGE 3 BY CHILD AND FAMILY CHARACTERISTICS (MODEL RESULTS)
Source: Growing Up in Ireland study.
2.4 AGE ON STARTING SCHOOL
2.4.1 Average age on school entry
Irish administrative data indicate that there has been an increase over time
in the age at which children begin primary education, with the proportion
of four-year-olds in junior infant classes declining from 47 per cent in
1999–2000 to 27 per cent in 2016–2017 (Figure 2.6). While the increase
accelerated after the rollout of the ECCE scheme, a longer-term reduction
in early school start was already evident prior to this time-point.
-10
-8
-6
-4
-2
0
2
4
Female Lone parent No. siblings Migrant Urban Disability
Gender Family structure Migrant status Location Disability status
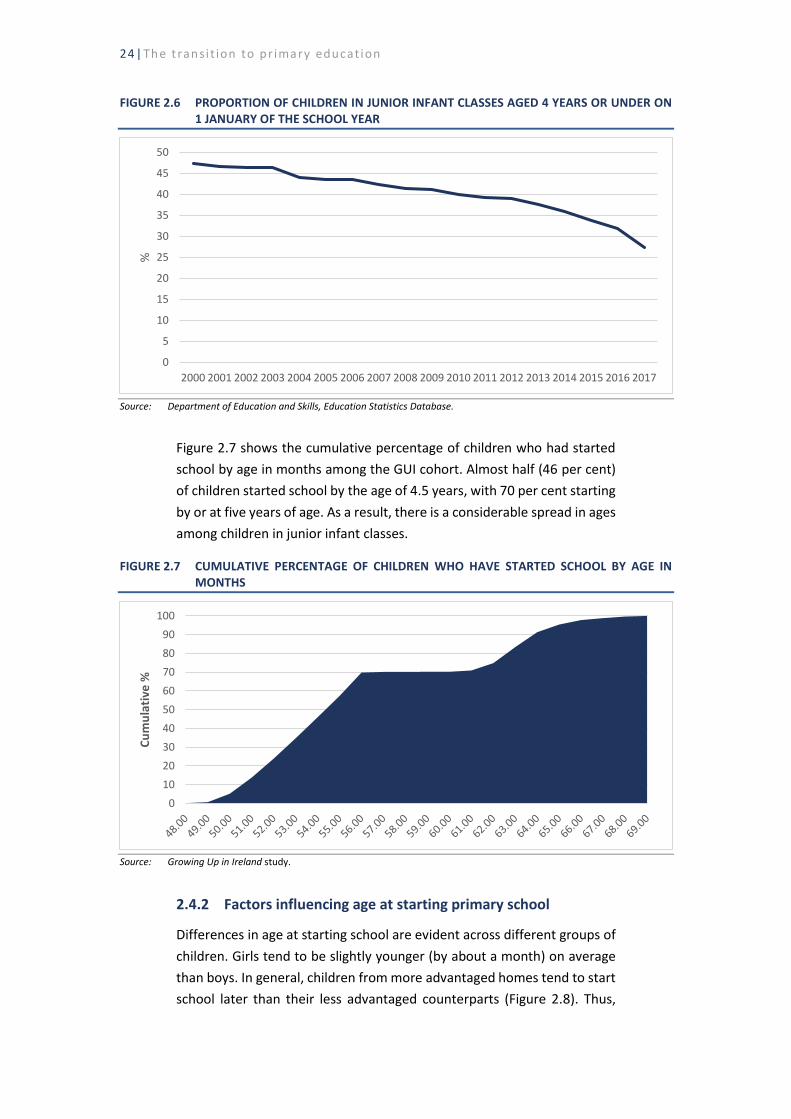
24|The t ransi t ion to pr imary educat ion
FIGURE 2.6 PROPORTION OF CHILDREN IN JUNIOR INFANT CLASSES AGED 4 YEARS OR UNDER ON 1 JANUARY OF THE SCHOOL YEAR
Source: Department of Education and Skills, Education Statistics Database.
Figure 2.7 shows the cumulative percentage of children who had started
school by age in months among the GUI cohort. Almost half (46 per cent)
of children started school by the age of 4.5 years, with 70 per cent starting
by or at five years of age. As a result, there is a considerable spread in ages
among children in junior infant classes.
FIGURE 2.7 CUMULATIVE PERCENTAGE OF CHILDREN WHO HAVE STARTED SCHOOL BY AGE IN MONTHS
Source: Growing Up in Ireland study.
2.4.2 Factors influencing age at starting primary school
Differences in age at starting school are evident across different groups of
children. Girls tend to be slightly younger (by about a month) on average
than boys. In general, children from more advantaged homes tend to start
school later than their less advantaged counterparts (Figure 2.8). Thus,
0
5
10
15
20
25
30
35
40
45
50
2000 2001 2002 2003 2004 2005 2006 2007 2008 2009 2010 2011 2012 2013 2014 2015 2016 2017
%
0
10
20
30
40
50
60
70
80
90
100
Cu
mu
lati
ve %
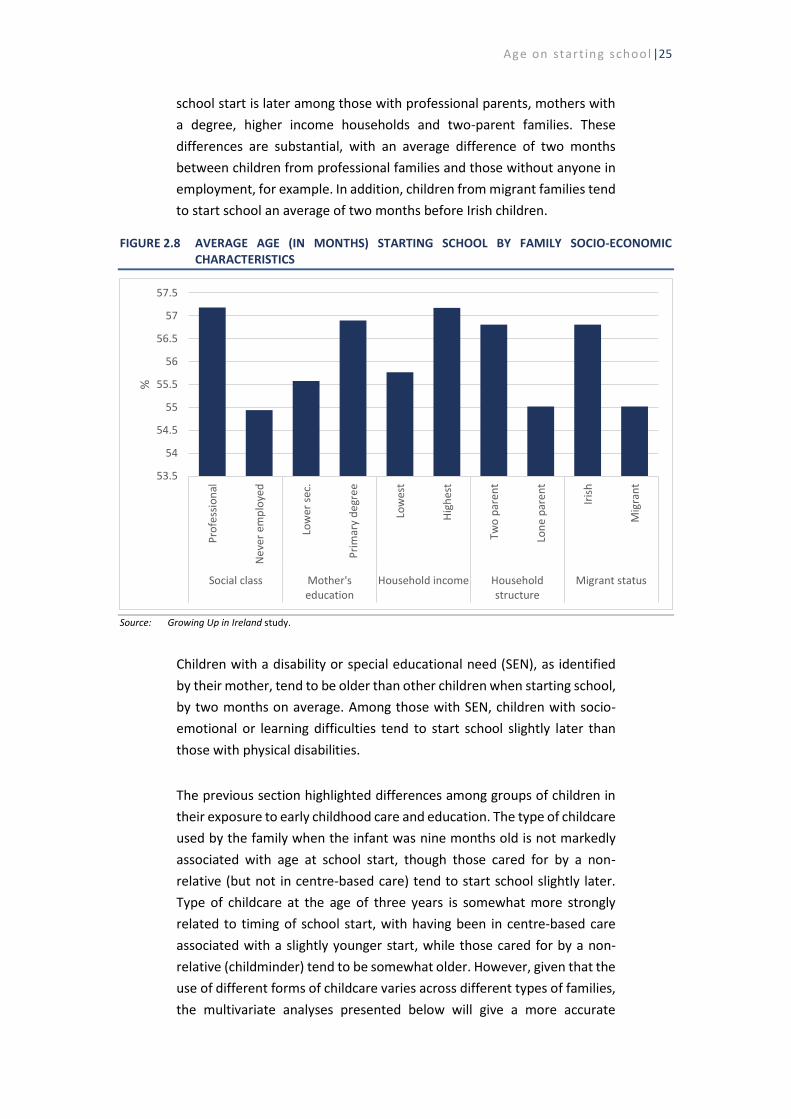
Age on star t ing schoo l |25
school start is later among those with professional parents, mothers with
a degree, higher income households and two-parent families. These
differences are substantial, with an average difference of two months
between children from professional families and those without anyone in
employment, for example. In addition, children from migrant families tend
to start school an average of two months before Irish children.
FIGURE 2.8 AVERAGE AGE (IN MONTHS) STARTING SCHOOL BY FAMILY SOCIO-ECONOMIC CHARACTERISTICS
Source: Growing Up in Ireland study.
Children with a disability or special educational need (SEN), as identified
by their mother, tend to be older than other children when starting school,
by two months on average. Among those with SEN, children with socio-
emotional or learning difficulties tend to start school slightly later than
those with physical disabilities.
The previous section highlighted differences among groups of children in
their exposure to early childhood care and education. The type of childcare
used by the family when the infant was nine months old is not markedly
associated with age at school start, though those cared for by a non-
relative (but not in centre-based care) tend to start school slightly later.
Type of childcare at the age of three years is somewhat more strongly
related to timing of school start, with having been in centre-based care
associated with a slightly younger start, while those cared for by a non-
relative (childminder) tend to be somewhat older. However, given that the
use of different forms of childcare varies across different types of families,
the multivariate analyses presented below will give a more accurate
53.5
54
54.5
55
55.5
56
56.5
57
57.5
Pro
fess
ion
al
Ne
ver
emp
loye
d
Low
er s
ec.
Pri
mar
y d
egr
ee
Low
est
Hig
hes
t
Two
par
en
t
Lon
e p
are
nt
Iris
h
Mig
ran
t
Social class Mother'seducation
Household income Householdstructure
Migrant status
%

26|The t ransi t ion to pr imary educat ion
picture of the relationship between type of childcare and school start by
taking account of a range of factors. Those who did not take part in the
ECCE scheme started school an average of one month earlier than their
peers.
Children starting in urban DEIS schools are significantly younger than those
beginning in rural DEIS or non-DEIS schools (Figure 2.9). The earliest start
is found among children in Urban Band 1 schools, who are on average
almost three months younger than those attending non-DEIS schools.
Whether this reflects the more disadvantaged social profile of children
attending DEIS schools or not is explored below.
FIGURE 2.9 AVERAGE AGE (IN MONTHS) STARTING SCHOOL BY DEIS STATUS OF THE SCHOOL
Source: Growing Up in Ireland study.
The remainder of this section uses a series of multivariate models to
identify the relative importance of different factors influencing age at
starting school, taking account of the time of year when the children were
born. Age at school start was standardised to have a mean of zero and a
standard deviation of one to allow for a comparison of the relative
influence of different factors. Positive coefficients indicate that the factor
is associated with children being older starting school while negative
coefficients show that children with those characteristics are younger on
school entry.
52.5
53
53.5
54
54.5
55
55.5
56
56.5
57
57.5
DEIS Urban Band 1 DEIS Urban Band 2 Rural DEIS Non-DEIS
%
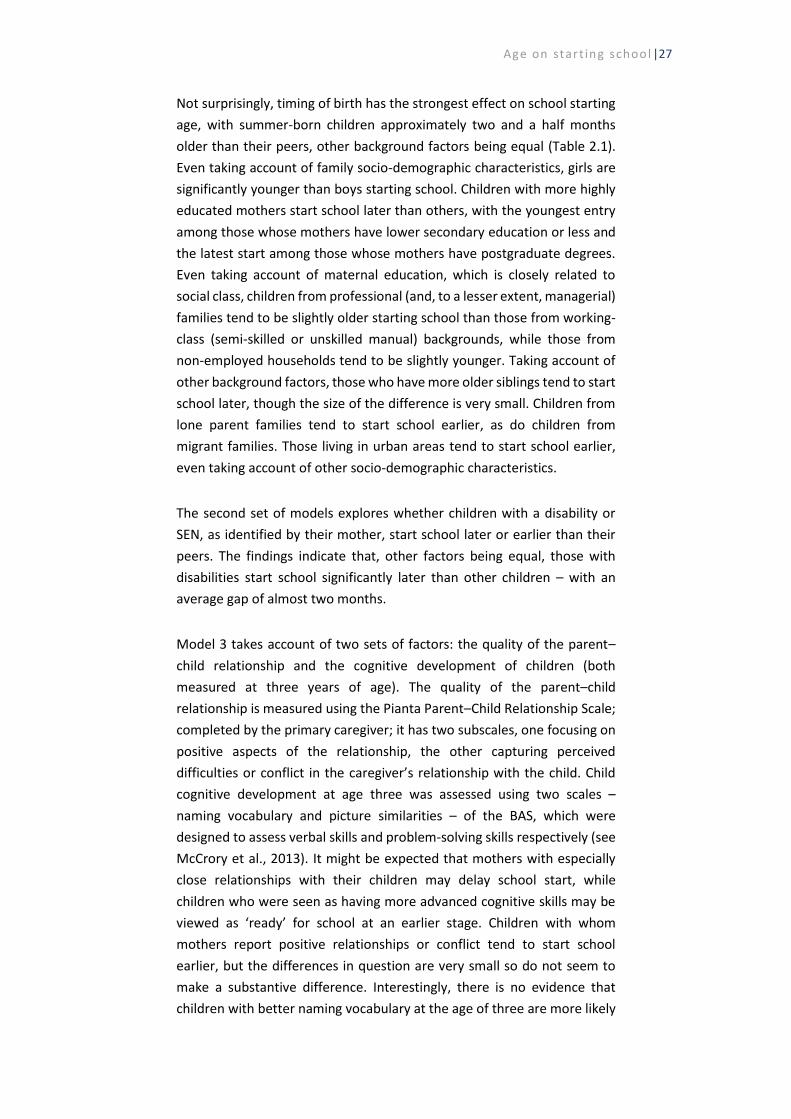
Age on star t ing schoo l |27
Not surprisingly, timing of birth has the strongest effect on school starting
age, with summer-born children approximately two and a half months
older than their peers, other background factors being equal (Table 2.1).
Even taking account of family socio-demographic characteristics, girls are
significantly younger than boys starting school. Children with more highly
educated mothers start school later than others, with the youngest entry
among those whose mothers have lower secondary education or less and
the latest start among those whose mothers have postgraduate degrees.
Even taking account of maternal education, which is closely related to
social class, children from professional (and, to a lesser extent, managerial)
families tend to be slightly older starting school than those from working-
class (semi-skilled or unskilled manual) backgrounds, while those from
non-employed households tend to be slightly younger. Taking account of
other background factors, those who have more older siblings tend to start
school later, though the size of the difference is very small. Children from
lone parent families tend to start school earlier, as do children from
migrant families. Those living in urban areas tend to start school earlier,
even taking account of other socio-demographic characteristics.
The second set of models explores whether children with a disability or
SEN, as identified by their mother, start school later or earlier than their
peers. The findings indicate that, other factors being equal, those with
disabilities start school significantly later than other children – with an
average gap of almost two months.
Model 3 takes account of two sets of factors: the quality of the parent–
child relationship and the cognitive development of children (both
measured at three years of age). The quality of the parent–child
relationship is measured using the Pianta Parent–Child Relationship Scale;
completed by the primary caregiver; it has two subscales, one focusing on
positive aspects of the relationship, the other capturing perceived
difficulties or conflict in the caregiver’s relationship with the child. Child
cognitive development at age three was assessed using two scales –
naming vocabulary and picture similarities – of the BAS, which were
designed to assess verbal skills and problem-solving skills respectively (see
McCrory et al., 2013). It might be expected that mothers with especially
close relationships with their children may delay school start, while
children who were seen as having more advanced cognitive skills may be
viewed as ‘ready’ for school at an earlier stage. Children with whom
mothers report positive relationships or conflict tend to start school
earlier, but the differences in question are very small so do not seem to
make a substantive difference. Interestingly, there is no evidence that
children with better naming vocabulary at the age of three are more likely

28|The t ransi t ion to pr imary educat ion
to start school earlier. Those with higher scores on the picture similarity
test tend to start school slightly earlier but the difference is very small. It
may be that cognitive development after having completed the ECCE year,
which was not measured through the survey, might have more influence
on decisions around the timing of school start.
Model 4 looks at the potential influence of the child’s temperament and
socio-emotional wellbeing, again measured at three years of age. There is
no evidence that parents postpone sending their children to school if they
have greater socio-emotional difficulties in terms of conduct, emotional or
hyperactivity difficulties or peer problems. There is some evidence that
children who are seen as exhibiting more prosocial behaviour start school
slightly earlier. Children who demonstrate the trait of persistence also tend
to be sent to school earlier.
Children who had been in centre-based childcare at the age of three
started school slightly earlier than those cared for full-time by their
mothers, other factors being equal (Model 5). However, there is little
variation in school start between those cared for full-time by their parents
or by a relative or non-relative. The fact that the vast majority of children
took part in the ECCE scheme may have altered the extent to which
parental decisions around school start were related to childcare
arrangements prior to ECCE.
Even taking account of a range of social background characteristics,
children tend to start in DEIS Urban Band 1 schools at an appreciably
younger age; a tendency was also found for those in Urban Band 2 schools
to be slightly younger, but much less so than is the case for Urban Band 1
schools (Model 6). At the other end of the spectrum, children are also
younger starting in fee-paying schools and, to some extent, over-
subscribed schools (that is, schools that receive more applications than
there are places available).
In sum, while timing of birth makes a difference, family background and
child disability also impact on age at starting school, with earlier school
start among more socially disadvantaged children and those from lone
parent or migrant families, and later school start among more advantaged
groups as well as those with a disability. Having earlier experience of
centre-based care is also associated with a younger school start. Although
there is clear variation in school starting age by family, child and school
characteristics, these factors only explain 12 per cent of the variation in
age, suggesting that a range of other factors play a role in parental

Age on star t ing schoo l |29
decisions around school start. Parental perceptions around when their
child should start school are explored further in the following section.

TABLE 2.1 FACTORS ASSOCIATED WITH AGE ON STARTING SCHOOL
Model 1 Model 2 Model 3 Model 4 Model 5 Model 6
Constant Female Social class:
Professional Managerial Non-manual Skilled manual Non-employed
(Ref.: Semi/unskilled) Mother’s education:
Leaving Certificate Post-secondary Tertiary Postgraduate degree
(Ref.: Lower secondary or less) Number of older siblings Lone parent family Migrant family Living in an urban area Summer-born
-0.096 -0.170***
0.095* 0.077±
-0.007 0.033
-0.092±
0.086** 0.118** 0.134*** 0.205***
0.032**
-0.166*** -0.217*** -0.213*** 0.455***
-0.126 -0.155***
0.097* 0.082*
-0.008 0.064
-0.105*
0.083* 0.115** 0.134*** 0.210***
0.030**
-0.175*** -0.209*** -0.217*** 0.453***
0.791 -0.139***
0.101* 0.084*
-0.030 0.035
-0.126*
0.084* 0.137** 0.154**** 0.234***
0.031**
-0.147*** -0.264*** -0.220*** 0.471***
0.931 -0.129***
0.094* 0.078±
-0.036 0.041
-0.125*
0.073* 0.135** 0.142*** 0.221***
0.030**
-0.144*** -0.266*** -0.219*** 0.466***
0.966 -0.130***
0.103* 0.083
-0.032 0.041
-0.123*
0.073* 0.133** 0.141*** 0.222***
0.026*
-0.138*** -0.267*** -0.205*** 0.463***
1.006 -0.130***
0.068 0.056
-0.047 0.028
-0.111
0.057± 0.113* 0.112** 0.189***
0.028**
-0.130*** -0.260*** -0.187*** 0.460***
Has a disability/SEN 0.338*** 0.261*** 0.255*** 0.258*** 0.269***
Positive parent–child relationship Parent–child conflict Naming vocabulary score at 3 Picture similarity score at 3
-0.019** -0.004* 0.000
-0.004***
-0.010± -0.004 0.000
-0.004***
-0.011± -0.003 0.000
-0.004***
-0.009 -0.003 0.000
-0.004*** (Table 2.1 continued overleaf.)
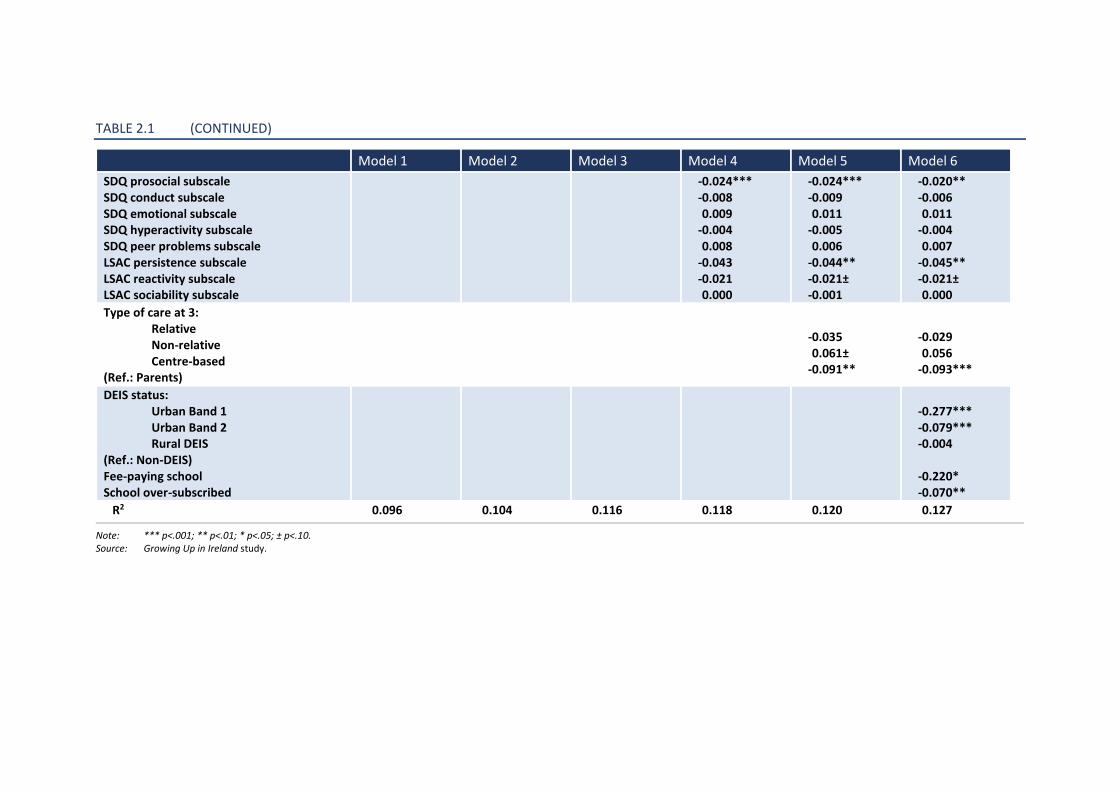
TABLE 2.1 (CONTINUED)
Model 1 Model 2 Model 3 Model 4 Model 5 Model 6
SDQ prosocial subscale SDQ conduct subscale SDQ emotional subscale SDQ hyperactivity subscale SDQ peer problems subscale LSAC persistence subscale LSAC reactivity subscale LSAC sociability subscale
-0.024*** -0.008 0.009
-0.004 0.008
-0.043 -0.021 0.000
-0.024*** -0.009 0.011
-0.005 0.006
-0.044** -0.021± -0.001
-0.020** -0.006 0.011
-0.004 0.007
-0.045** -0.021± 0.000
Type of care at 3: Relative Non-relative Centre-based
(Ref.: Parents)
-0.035 0.061±
-0.091**
-0.029 0.056
-0.093***
DEIS status: Urban Band 1 Urban Band 2 Rural DEIS
(Ref.: Non-DEIS) Fee-paying school School over-subscribed
-0.277*** -0.079*** -0.004
-0.220* -0.070**
R2 0.096 0.104 0.116 0.118 0.120 0.127
Note: *** p<.001; ** p<.01; * p<.05; ± p<.10. Source: Growing Up in Ireland study.

32|The t ransi t ion to pr imary educat ion
2.5 PARENTAL VIEWS ON STARTING SCHOOL
At the time of the third wave of data collection within the home, the majority (72
per cent) of children had started school (see Chapter 1). These parents were asked
to respond to a series of statements regarding their child’s readiness for school.
The responses given were generally very positive, with 98 per cent reporting their
child could go to the toilet on their own, 97 per cent agreeing or strongly agreeing
that their child knew enough about sharing and taking turns to manage at primary
school, and 95 per cent feeling their child was able to mix socially. A slightly smaller
proportion (85 per cent) felt their child had the necessary pre-reading and writing
skills to start school. Only a small number had concerns about their child starting
school, being worried that the child would find being apart from them too difficult
(13 per cent), feeling their child was not independent enough (9 per cent) and
being concerned that their child would be reluctant to go to school (15 per cent).
These items were used to form a scale of perceived school readiness among
parents (see Murray et al., forthcoming).9 Some differences were evident between
groups of children, with girls, those from professional/managerial households,
those with graduate mothers, those from two-parent families, those from Irish
families and those without a disability being seen as more ‘school ready’ than other
children.
Those parents whose children had not yet started school at the time of the home
interview were given a series of possible reasons. The main reasons seen as ‘very
important’ were thinking the child was too young (79 per cent) and feeling the child
was ‘not ready’ (65 per cent). Other reasons included the advice of preschool or
school staff to defer school start (10 per cent), the child having a speech or
developmental delay (10 per cent) and the child having a health problem or
disability (7 per cent).
Families whose children had already started school were asked about the sources
of advice and information they had used before their child started school and the
kinds of activities they engaged in to get the child ‘ready to start school’.10 The main
sources of advice mentioned were friends (50 per cent) and other parents (49 per
cent). Preschool staff were mentioned by a significant minority (39 per cent) of
mothers, while more than one-quarter (29 per cent) mentioned primary school
staff. Other sources of advice included their own siblings (24 per cent) and the
school website (23 per cent). There was some variation across families in their use
of different sources of information. More highly educated mothers were much
more likely to go to preschool staff for advice (with 44 per cent of those with
postgraduate degrees doing so compared with 34 per cent of mothers with lower
secondary education or less) and somewhat more likely to go to primary school
staff for advice (34 per cent compared with 28 per cent respectively). More highly
9 The scale has a reliability of 0.75. 10 The same questions were asked of those whose children had not yet started school, with very similar patterns of
responses.

Age on star t ing schoo l |33
educated and professional/managerial women were also more likely to go to their
friends and other parents for advice. Migrant parents were more dependent on
primary school staff (34 per cent compared with 28 per cent), the school website
(27 per cent compared with 22 per cent) and friends (57 per cent compared with
49 per cent) for advice. Migrant parents were much less likely to rely on their own
siblings for advice (13 per cent compared with 26 per cent), most likely reflecting
the fact that their siblings were outside the country and therefore unfamiliar with
the Irish education system. Lone parent families did not differ markedly from two-
parent families in terms of sources of advice, though they were more likely to
depend on siblings and less likely to rely on the school website. What is evident
from the findings is the greater reliance of more advantaged families on both
formal and informal sources of advice. Further analyses reveal that the use of
multiple sources of advice is part of an active school choice strategy, with reliance
on different information sources more prevalent among parents who had
registered their children for multiple primary schools in an effort to secure their
preference. In keeping with this pattern, parents whose child is attending an over-
subscribed school are more likely to report having relied on friends, other parents
and the school website for information.
In preparation for the child starting school, almost all (98 per cent) mothers
reported talking to their child about school. The vast majority attended an
information session at the school (86 per cent), visited the school (81 per cent) and
practised reading, writing or numbers with the child (81 per cent). Over half (55
per cent) also sought advice from friends, neighbours and/or family in preparing
the child for starting school. Many of these preparatory activities were prevalent
across social groups, but more advantaged families were somewhat more likely to
attend a school information session, with 88 per cent of the
professional/managerial group doing so, compared with 82 per cent of the non-
employed group. In addition, highly educated mothers were much more likely to
seek advice from friends, neighbours or family members, with 65 per cent of
postgraduate mothers doing so, compared with 48 per cent of those with lower
secondary education or less. Migrant families and those whose child had a
disability were somewhat more likely to visit the school before the child started
school than other parents. An interesting finding is that the less advantaged
families are slightly more likely to practise reading, writing or numbers with their
child as a preparation for school (85 per cent of mothers with a Junior Certificate
education or less did so compared with 74 per cent of postgraduate mothers),
perhaps reflecting some differences in views regarding the skills needed to be
‘ready’ for school.
2.6 TEACHER VIEWS ON STARTING SCHOOL
Information from primary school teachers was collected later in the year, at which
point almost all children had started school (see Chapter 1). Teachers of the five-
year-olds were asked a series of questions about the relative importance of
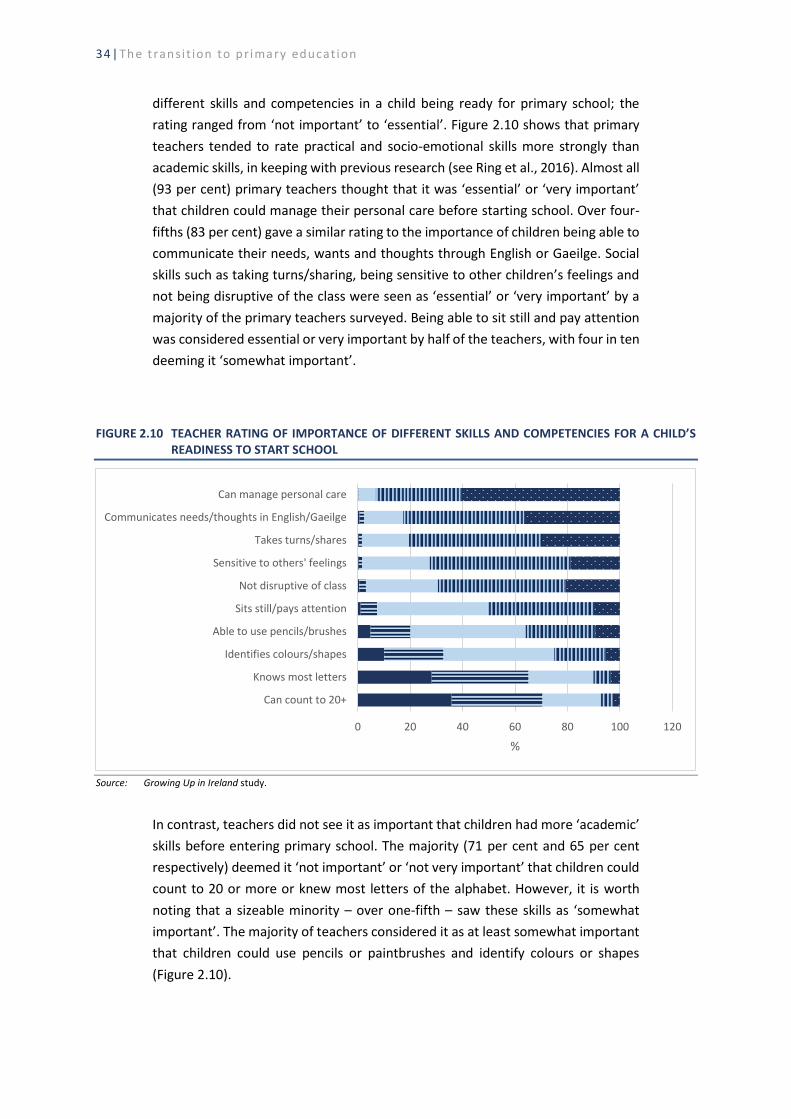
34|The t ransi t ion to pr imary educat ion
different skills and competencies in a child being ready for primary school; the
rating ranged from ‘not important’ to ‘essential’. Figure 2.10 shows that primary
teachers tended to rate practical and socio-emotional skills more strongly than
academic skills, in keeping with previous research (see Ring et al., 2016). Almost all
(93 per cent) primary teachers thought that it was ‘essential’ or ‘very important’
that children could manage their personal care before starting school. Over four-
fifths (83 per cent) gave a similar rating to the importance of children being able to
communicate their needs, wants and thoughts through English or Gaeilge. Social
skills such as taking turns/sharing, being sensitive to other children’s feelings and
not being disruptive of the class were seen as ‘essential’ or ‘very important’ by a
majority of the primary teachers surveyed. Being able to sit still and pay attention
was considered essential or very important by half of the teachers, with four in ten
deeming it ‘somewhat important’.
Table
FIGURE 2.10 TEACHER RATING OF IMPORTANCE OF DIFFERENT SKILLS AND COMPETENCIES FOR A CHILD’S READINESS TO START SCHOOL
Source: Growing Up in Ireland study.
In contrast, teachers did not see it as important that children had more ‘academic’
skills before entering primary school. The majority (71 per cent and 65 per cent
respectively) deemed it ‘not important’ or ‘not very important’ that children could
count to 20 or more or knew most letters of the alphabet. However, it is worth
noting that a sizeable minority – over one-fifth – saw these skills as ‘somewhat
important’. The majority of teachers considered it as at least somewhat important
that children could use pencils or paintbrushes and identify colours or shapes
(Figure 2.10).
0 20 40 60 80 100 120
Can count to 20+
Knows most letters
Identifies colours/shapes
Able to use pencils/brushes
Sits still/pays attention
Not disruptive of class
Sensitive to others' feelings
Takes turns/shares
Communicates needs/thoughts in English/Gaeilge
Can manage personal care
%
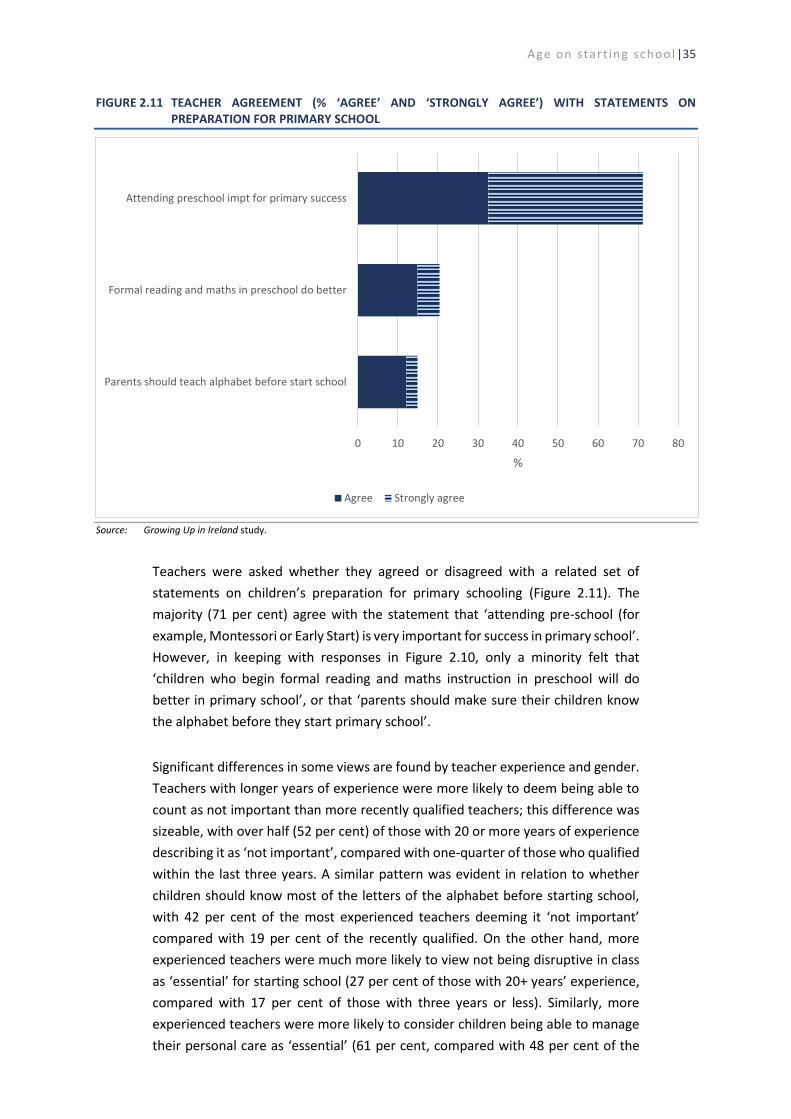
Age on star t ing schoo l |35
FIGURE 2.11 TEACHER AGREEMENT (% ‘AGREE’ AND ‘STRONGLY AGREE’) WITH STATEMENTS ON PREPARATION FOR PRIMARY SCHOOL
Source: Growing Up in Ireland study.
Teachers were asked whether they agreed or disagreed with a related set of
statements on children’s preparation for primary schooling (Figure 2.11). The
majority (71 per cent) agree with the statement that ‘attending pre-school (for
example, Montessori or Early Start) is very important for success in primary school’.
However, in keeping with responses in Figure 2.10, only a minority felt that
‘children who begin formal reading and maths instruction in preschool will do
better in primary school’, or that ‘parents should make sure their children know
the alphabet before they start primary school’.
Significant differences in some views are found by teacher experience and gender.
Teachers with longer years of experience were more likely to deem being able to
count as not important than more recently qualified teachers; this difference was
sizeable, with over half (52 per cent) of those with 20 or more years of experience
describing it as ‘not important’, compared with one-quarter of those who qualified
within the last three years. A similar pattern was evident in relation to whether
children should know most of the letters of the alphabet before starting school,
with 42 per cent of the most experienced teachers deeming it ‘not important’
compared with 19 per cent of the recently qualified. On the other hand, more
experienced teachers were much more likely to view not being disruptive in class
as ‘essential’ for starting school (27 per cent of those with 20+ years’ experience,
compared with 17 per cent of those with three years or less). Similarly, more
experienced teachers were more likely to consider children being able to manage
their personal care as ‘essential’ (61 per cent, compared with 48 per cent of the
0 10 20 30 40 50 60 70 80
Parents should teach alphabet before start school
Formal reading and maths in preschool do better
Attending preschool impt for primary success
%
Agree Strongly agree
36|The t ransi t ion to pr imary educat ion
recently qualified). Male teachers are somewhat more likely than female teachers
to rate counting as important; over one-third (36 per cent) of female teachers rate
this as ‘not important’, compared with 19 per cent of male teachers. Male teachers
are also more likely to rate knowing the alphabet as at least somewhat important,
with 56 per cent doing so compared with 34 per cent of their female counterparts.
Finally, male teachers were less likely than female teachers to see children being
able to manage their personal care as ‘essential’ (39 per cent compared with 61
per cent).
There were few consistent differences by gender or experience in the rating of
other aspects of child readiness. Neither were there many systematic differences
in teacher perspectives by their type of school – in terms of social mix, gender mix
or whether it was multi-grade (that is, with children from more than one class in
the same classroom).
In relation to views on preschool education, more experienced teachers were
somewhat less likely to see attending preschool as important for primary school
success and were less likely to emphasise the importance of formal reading and
maths instruction at preschool level. Less experienced teachers were more likely
to consider that parents should teach children the alphabet before they start
school. Male teachers were much more likely to agree or strongly agree about the
importance of formal instruction at preschool level (46 per cent doing so,
compared with 20 per cent of female teachers) and to agree that parents should
teach children the alphabet before they start school. Teachers in urban DEIS
schools were somewhat more likely to see attending preschool as important for
primary school success. In addition, teachers in urban DEIS, especially Band 1,
schools were more likely to emphasise the importance of formal reading and maths
instruction in preschool.
2.7 TRANSFER OF INFORMATION TO THE TEACHER
A number of templates being used for the transfer of information from preschool
to school settings have been identified (O’Kane and Murphy, 2016a). Work on the
development of templates for rollout at national level is currently underway by the
NCCA (NCCA, 2018a). In this context, it is useful to look at the kinds of information
teachers currently receive and their degree of satisfaction with that information
(Figure 2.12). The vast majority (92 per cent) of teachers reported receiving
information on whether children had SEN. The majority also received information
on whether the child had attended preschool and on family circumstances (73 per
cent and 69 per cent respectively). Information gaps were much more evident in
relation to children’s individual strengths, interests and challenges, and in relation
to the skills they developed in preschool (with only 27 per cent and 13 per cent
respectively reporting receiving such information). Where teachers received
information, they were generally satisfied with the information received. There
was little variation by child or school characteristics in the receipt of information.

Age on star t ing schoo l |37
However, teachers in DEIS Urban Band 1 schools were somewhat more likely to
report receiving information on individual children’s strengths and challenges (39
per cent doing so compared with 26 per cent in non-DEIS schools).
FIGURE 2.12 TEACHER REPORTS ON RECEIPT OF INFORMATION IN RELATION TO CHILDREN IN THEIR CLASS AND THEIR SATISFACTION WITH THIS INFORMATION
Source: Growing Up in Ireland study.
2.8 CONCLUSIONS
This chapter has examined children’s experience of care and education prior to
starting school, their age on school start and teacher and parental perceptions of
the qualities that will help children adapt to primary school. The cohort of children
in the GUI study were among the first to avail of the ECCE scheme, so almost all
had experience of centre-based care and education prior to starting school.
Although rates of non-take-up of ECCE were generally low, non-take-up rates were
higher among more disadvantaged groups (12 per cent of the non-employed) and
children who went on to attend Urban Band 1 DEIS schools (16 per cent non-take-
up). Children differed significantly in their experience of centre-based care prior to
taking ECCE, with children from more advantaged families more likely to have
experienced centre-based care at nine months and three years of age.
Average age at school start has been increasing over time, particularly since the
introduction of the ECCE scheme. Among the sample, almost half had started
school by 4.5 years of age, with 70 per cent starting by or at five years of age. This
means that there is a considerable spread of ages among children in junior infant
classes, posing potential challenges to teachers in catering for children at different
developmental stages. Taking account of month of birth, age on school entry tends
to be older among boys, children from more advantaged homes (in terms of social
class and parental education) and among children with a disability/SEN. Children
attending urban DEIS schools tend to be significantly younger starting school than
those in rural DEIS or non-DEIS schools. Having earlier experience of centre-based
0102030405060708090100
0102030405060708090
100
Whether theyhave SEN
Whetherattendedpreschool
Familycircumstances
Individualstrengths,
interests andchallenges
Skills developedat preschool
% S
atis
fie
d
%
Type of information received
Information Satisfaction

38|The t ransi t ion to pr imary educat ion
care (that is, prior to the age of three years) is also associated with a younger school
start.
Mothers engaged in a range of activities to help their children prepare for starting
school. Almost all (98 per cent) reported talking to their child about school and the
vast majority attended an information session at the school (86 per cent), visited
the school (81 per cent) and practised reading, writing or numbers with the child
(81 per cent). Over half (55 per cent) also sought advice from friends, neighbours
and/or family in preparing the child for starting school. These activities were
prevalent across all social groups but it is interesting to note that engaging in
formal learning activities in preparation for school was somewhat more common
among those from disadvantaged backgrounds. This pattern may reflect different
levels of awareness among parents as to the relative emphasis on play-based
learning as opposed to ‘academic’ work in junior infant classes.
In keeping with previous research (see, for example, Ring et al., 2016), teachers
tended to emphasise the importance of socio-emotional qualities in assessing a
child’s readiness to start school, and were much less likely to see pre-academic
skills (such as being able to count or recognise letters) as important. However, it is
worth noting that more recently qualified teachers tended to rate these pre-
academic skills as more important than more experienced teachers. Teachers were
asked about the information they received on incoming pupils; the vast majority
(92 per cent) received information on whether the child had a disability/SEN. The
majority also received information on whether the child had attended preschool
and on their family circumstances. However, an information gap was evident in
relation to the skills acquired by the child during preschool, an important issue for
policy given the intention of Aistear to promote continuity of learning over the
transition. Given this pattern, the adoption of templates by all early childhood
practitioners for the exchange of information on each child is likely to facilitate
greater continuity in experiences for children over the transition to primary school.
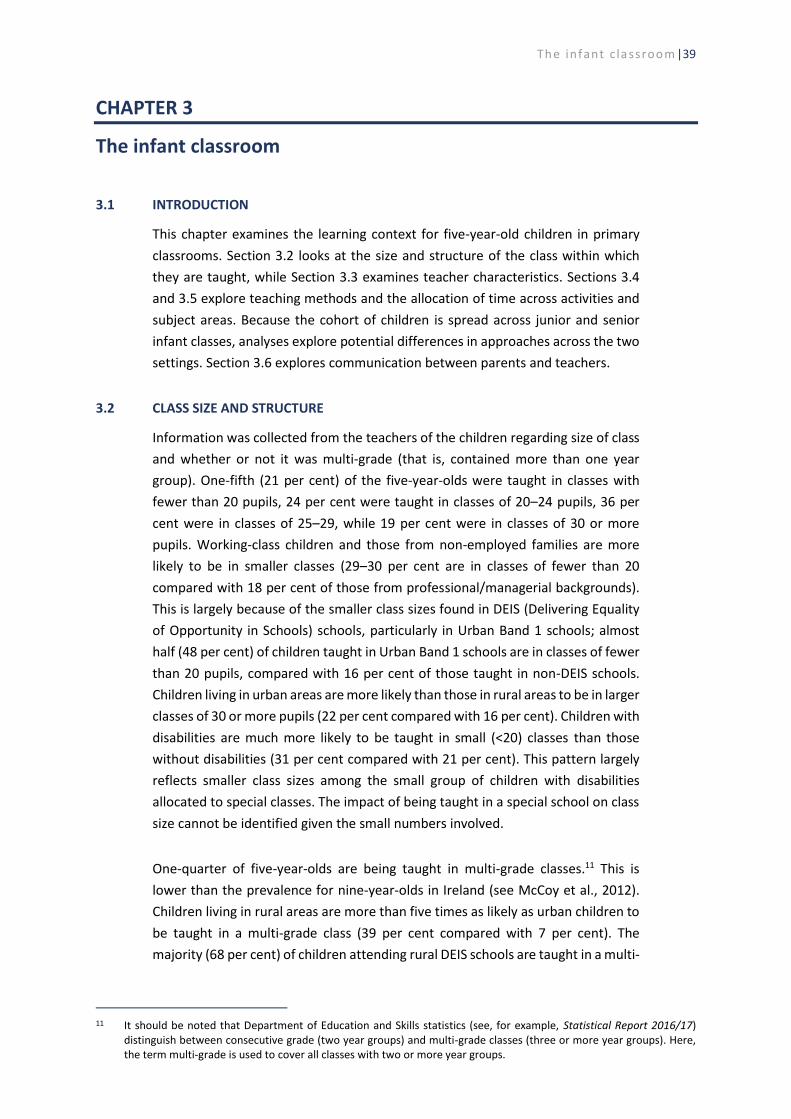
The infant c lassroom |39
CHAPTER 3
The infant classroom
3.1 INTRODUCTION
This chapter examines the learning context for five-year-old children in primary
classrooms. Section 3.2 looks at the size and structure of the class within which
they are taught, while Section 3.3 examines teacher characteristics. Sections 3.4
and 3.5 explore teaching methods and the allocation of time across activities and
subject areas. Because the cohort of children is spread across junior and senior
infant classes, analyses explore potential differences in approaches across the two
settings. Section 3.6 explores communication between parents and teachers.
3.2 CLASS SIZE AND STRUCTURE
Information was collected from the teachers of the children regarding size of class
and whether or not it was multi-grade (that is, contained more than one year
group). One-fifth (21 per cent) of the five-year-olds were taught in classes with
fewer than 20 pupils, 24 per cent were taught in classes of 20–24 pupils, 36 per
cent were in classes of 25–29, while 19 per cent were in classes of 30 or more
pupils. Working-class children and those from non-employed families are more
likely to be in smaller classes (29–30 per cent are in classes of fewer than 20
compared with 18 per cent of those from professional/managerial backgrounds).
This is largely because of the smaller class sizes found in DEIS (Delivering Equality
of Opportunity in Schools) schools, particularly in Urban Band 1 schools; almost
half (48 per cent) of children taught in Urban Band 1 schools are in classes of fewer
than 20 pupils, compared with 16 per cent of those taught in non-DEIS schools.
Children living in urban areas are more likely than those in rural areas to be in larger
classes of 30 or more pupils (22 per cent compared with 16 per cent). Children with
disabilities are much more likely to be taught in small (<20) classes than those
without disabilities (31 per cent compared with 21 per cent). This pattern largely
reflects smaller class sizes among the small group of children with disabilities
allocated to special classes. The impact of being taught in a special school on class
size cannot be identified given the small numbers involved.
One-quarter of five-year-olds are being taught in multi-grade classes.11 This is
lower than the prevalence for nine-year-olds in Ireland (see McCoy et al., 2012).
Children living in rural areas are more than five times as likely as urban children to
be taught in a multi-grade class (39 per cent compared with 7 per cent). The
majority (68 per cent) of children attending rural DEIS schools are taught in a multi-
11 It should be noted that Department of Education and Skills statistics (see, for example, Statistical Report 2016/17)
distinguish between consecutive grade (two year groups) and multi-grade classes (three or more year groups). Here, the term multi-grade is used to cover all classes with two or more year groups.

40|The t ransi t ion to pr imary educat ion
grade setting. Children with disabilities are equally likely to be taught in a multi-
grade setting as other children.
The remainder of this chapter explores the extent to which class size and structure
are associated with other aspects of teaching and learning.
3.3 TEACHER CHARACTERISTICS
Only 3.6 per cent of five-year-olds are taught by a male teacher, with a slightly
higher representation of men in senior infants than in junior infant classes. Over
one-quarter (28 per cent) of the children were taught by teachers who had less
than five years’ experience, while just under one-quarter (24 per cent) had
teachers with 15 years or more experience. No differences in teacher experience
are found between junior and senior infant classes.
Data on nine-year-olds in 2008 indicated an overrepresentation of newly qualified
teachers in urban DEIS schools (McCoy et al., 2014). For the younger cohort, where
data were collected in 2013, these stark differences are no longer evident,
although there is still a tendency for more experienced teachers (15 years or more)
to be underrepresented in urban DEIS schools; 14–17 per cent of five-year-olds in
Urban Band 1 and 2 schools are taught by teachers with this level of experience,
compared with 34 per cent in rural DEIS schools and 25 per cent in non-DEIS
schools. The pattern for rural DEIS schools reflects a wider trend towards more
experienced teachers in rural settings; 27 per cent of children in rural areas are
taught by those with 15 or more years’ experience compared with 20 per cent of
urban children. The differences found between urban DEIS and other schools mean
that children from working-class or non-employed families and those from migrant
backgrounds, groups that are overrepresented in urban DEIS schools, are less likely
to be taught by very experienced teachers. The level of teacher experience does
not vary for children with disabilities or special educational needs (SEN) compared
with their peers.
Analyses presented in the remainder of the chapter explore variation in teaching
methods and time allocation by teacher experience. Because of the small number
of male teachers in the sample, potential variation by gender is not discussed.
3.4 TEACHING METHODS
Class teachers were asked to indicate the frequency with which they used a wide
variety of approaches in their classroom. The response categories comprised of:
‘never or almost never’, ‘some days’, ‘most days’ and ‘every day’.
Figure 3.1 shows the proportion of children who engage in physical play, creative
play (such as painting or using play-dough), pretend play (such as make-believe)
and games with rules (such as board games) in the classroom context every day.
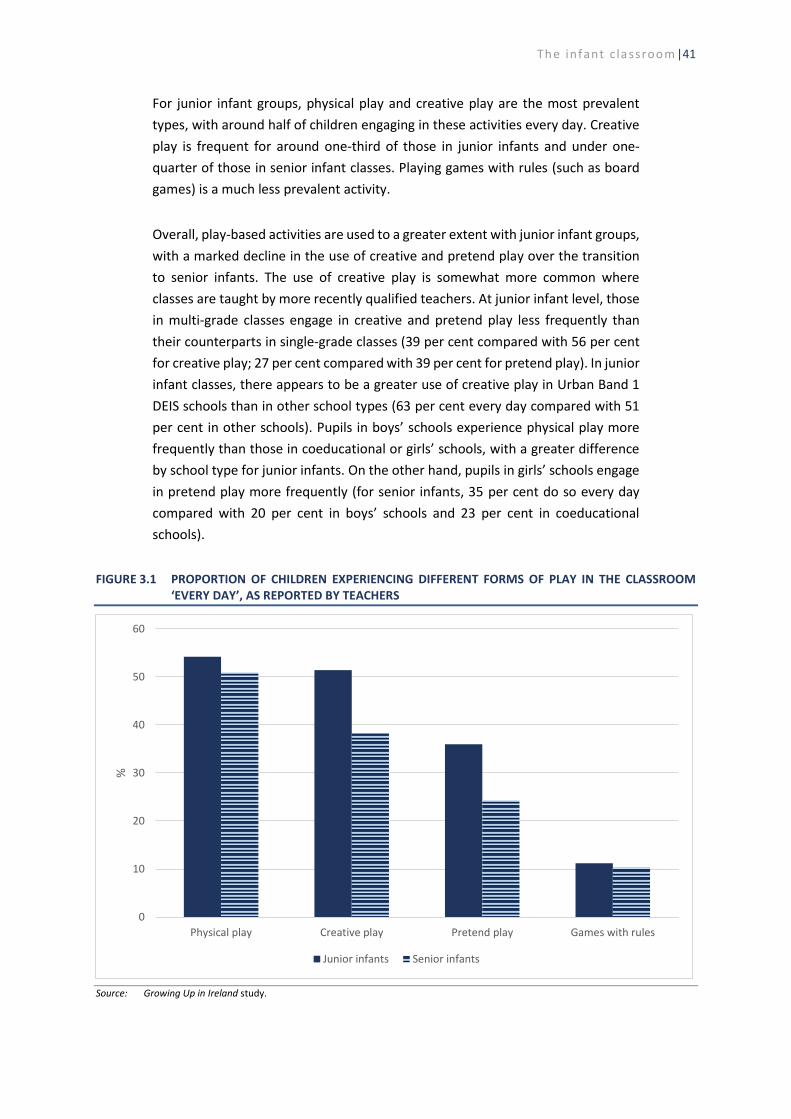
The infant c lassroom |41
For junior infant groups, physical play and creative play are the most prevalent
types, with around half of children engaging in these activities every day. Creative
play is frequent for around one-third of those in junior infants and under one-
quarter of those in senior infant classes. Playing games with rules (such as board
games) is a much less prevalent activity.
Overall, play-based activities are used to a greater extent with junior infant groups,
with a marked decline in the use of creative and pretend play over the transition
to senior infants. The use of creative play is somewhat more common where
classes are taught by more recently qualified teachers. At junior infant level, those
in multi-grade classes engage in creative and pretend play less frequently than
their counterparts in single-grade classes (39 per cent compared with 56 per cent
for creative play; 27 per cent compared with 39 per cent for pretend play). In junior
infant classes, there appears to be a greater use of creative play in Urban Band 1
DEIS schools than in other school types (63 per cent every day compared with 51
per cent in other schools). Pupils in boys’ schools experience physical play more
frequently than those in coeducational or girls’ schools, with a greater difference
by school type for junior infants. On the other hand, pupils in girls’ schools engage
in pretend play more frequently (for senior infants, 35 per cent do so every day
compared with 20 per cent in boys’ schools and 23 per cent in coeducational
schools).
FIGURE 3.1 PROPORTION OF CHILDREN EXPERIENCING DIFFERENT FORMS OF PLAY IN THE CLASSROOM ‘EVERY DAY’, AS REPORTED BY TEACHERS
Source: Growing Up in Ireland study.
0
10
20
30
40
50
60
Physical play Creative play Pretend play Games with rules
%
Junior infants Senior infants

42|The t ransi t ion to pr imary educat ion
Figure 3.2 presents information on the type of grouping and nature of interaction
between teachers and pupils in the classroom. In almost all cases, teachers ask
children questions every day while pupils asking teachers questions is prevalent for
four-fifths of children. Similarly, pupils interacting by taking turns and engaging in
conversation is common in four-fifths of cases but pupils asking each other
questions in class is less prevalent (happening every day for 40 per cent of
children). The use of individual work and whole-class teaching emerges as the
dominant pattern, with group work and pair work employed only in a minority of
classrooms. Pupils rarely suggest topics to be covered in class, with this ‘never or
almost never’ happening in four out of every ten cases.
In contrast to the pattern for play-based activities, there are very few differences
between junior and senior infant classes in the use of grouping and different forms
of interaction (Figure 3.2). Pair work is more commonly used by more recently
qualified teachers; for example, one-quarter of those qualified in the last five years
use pair work with junior infants every day, compared with 16 per cent of those
with more than 15 years’ experience. A similar pattern is found for pupils asking
teachers questions in class and pupils asking each other questions in class, both
being less prevalent among more experienced teachers. The practice of pupils
working individually is slightly more common in larger classes, though the
difference is not sizeable. Group work is less commonly used in multi-grade classes
at both junior and senior infants levels. Whole-class teaching is less commonly used
by more experienced teachers (more than 15 years’ experience) compared to other
groups of teachers. It is also much less commonly used in multi-grade classes (62
per cent versus 78 per cent for junior infants; 62 per cent versus 76 per cent for
senior infants), though the patterns nonetheless show that the majority of five-
year-olds in multi-grade settings experience whole-class teaching on a daily basis.
The use of whole-class teaching is significantly related to class size, being more
prevalent in larger classes. This pattern is evident at both junior and senior infant
class levels (see Figure 3.3).
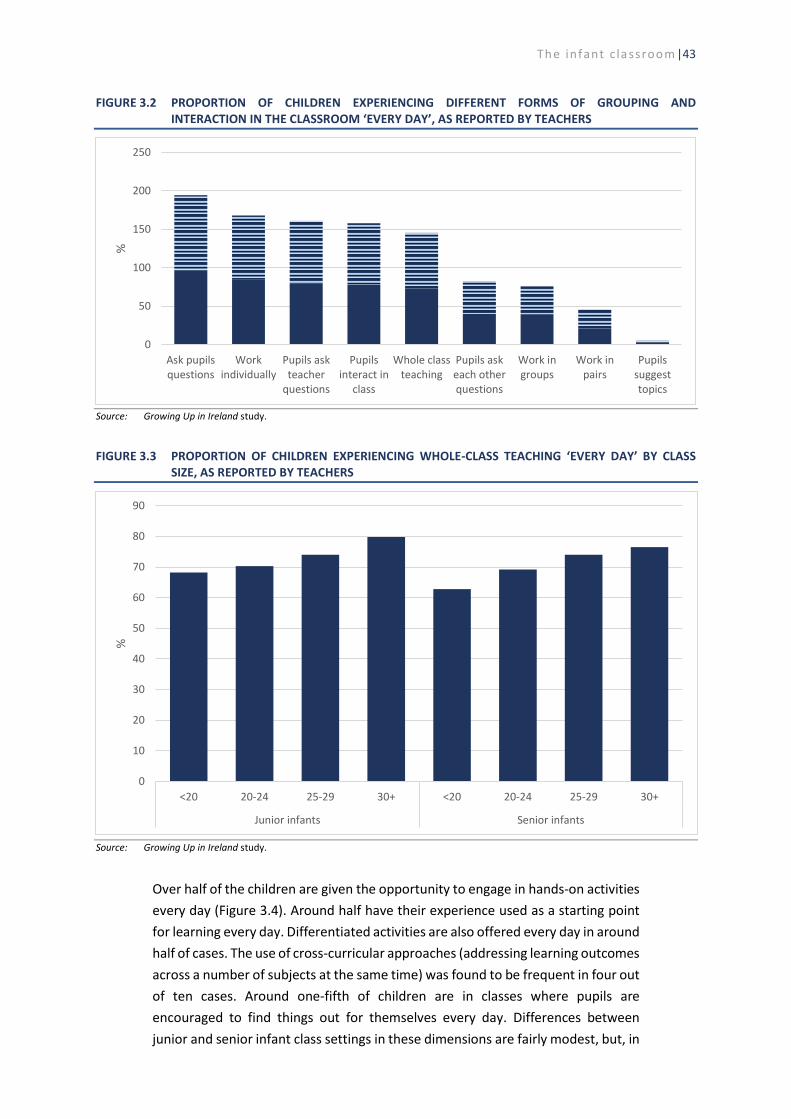
The infant c lassroom |43
FIGURE 3.2 PROPORTION OF CHILDREN EXPERIENCING DIFFERENT FORMS OF GROUPING AND INTERACTION IN THE CLASSROOM ‘EVERY DAY’, AS REPORTED BY TEACHERS
Source: Growing Up in Ireland study.
FIGURE 3.3 PROPORTION OF CHILDREN EXPERIENCING WHOLE-CLASS TEACHING ‘EVERY DAY’ BY CLASS SIZE, AS REPORTED BY TEACHERS
Source: Growing Up in Ireland study.
Over half of the children are given the opportunity to engage in hands-on activities
every day (Figure 3.4). Around half have their experience used as a starting point
for learning every day. Differentiated activities are also offered every day in around
half of cases. The use of cross-curricular approaches (addressing learning outcomes
across a number of subjects at the same time) was found to be frequent in four out
of ten cases. Around one-fifth of children are in classes where pupils are
encouraged to find things out for themselves every day. Differences between
junior and senior infant class settings in these dimensions are fairly modest, but, in
0
50
100
150
200
250
Ask pupilsquestions
Workindividually
Pupils askteacher
questions
Pupilsinteract in
class
Whole classteaching
Pupils askeach otherquestions
Work ingroups
Work inpairs
Pupilssuggesttopics
%
0
10
20
30
40
50
60
70
80
90
<20 20-24 25-29 30+ <20 20-24 25-29 30+
Junior infants Senior infants
%

44|The t ransi t ion to pr imary educat ion
keeping with the pattern for play-based learning, teachers appear to use hands-on
activities to a greater extent with junior infants. There is a slightly greater use of
differentiation in senior infant classes, perhaps reflecting teachers’ greater
familiarity with the different needs and abilities of the children at this stage. There
is also a slightly greater use of differentiation in smaller classes. For junior infant
classes, differentiated activities are more common in multi-grade than in single-
grade settings (60 per cent compared with 48 per cent on a daily basis) but no such
difference is evident at senior infant level. Girls’ schools are somewhat less likely
to use differentiation than coeducational or boys’ schools. Hands-on activities are
used less often by more experienced teachers in junior infant classes; the pattern
is similar for senior infants, though the difference is less marked. Hands-on
activities are also less common in multi-grade settings, with a much larger
difference for junior infant classes (54 per cent compared with 66 per cent every
day). For senior infant classes, hands-on activities are more frequently used in
Urban Band 1 schools (73 per cent daily, compared with 45–55 per cent in other
schools) but there is little variation by DEIS status for junior infant classes. Teachers
in boys’ schools were somewhat more likely to say that they used pupil experience
as a starting point for learning than those in other school types.
FIGURE 3.4 PROPORTION OF CHILDREN EXPERIENCING DIFFERENT FORMS OF TEACHING AND LEARNING IN THE CLASSROOM ‘EVERY DAY’, AS REPORTED BY TEACHERS
Source: Growing Up in Ireland study.
Figure 3.5 shows the use of different approaches to reading and maths in the
classroom. By its nature, a self-completion survey can only collect quite broad
information on the types of teaching methods used; it is unclear, for example,
whether ‘counting out loud’ involves whole-class or group work. Nonetheless, the
findings provide new information on the kinds of approaches used in early years
0
10
20
30
40
50
60
70
Hands-on activities Experience asstarting point
Differentiatedactivities
Learning outcomesacross subjects
Pupils find things out
%
Junior infants Senior infants

The infant c lassroom |45
classes. Work on phonics and word sounds take place every day in almost all
classes, while new or difficult vocabulary is often discussed in six out of ten cases.
In over one-quarter of cases, teachers read stories to the children where they can
see the print every day, while reading to them where they cannot see the print is
less prevalent, at 13 per cent. Counting out loud was found to happen every day in
70 per cent of cases, while games related to numbers occur on a daily basis in
around half of settings.
Few differences are evident between junior and senior infant classes along these
dimensions. On closer unpacking, for single-grade classes, teachers are more likely
to read to junior infants every day (at 35 per cent, compared with 25 per cent for
senior infants). This difference is not apparent for multi-grade classes, reflecting
the fact that teachers are catering to senior as well as junior infants (and possibly
older class levels as well). In addition, teachers, especially at junior infant level,
appear to read (showing the print) more frequently to groups of children who are
expected to be less engaged with reading.12 Thus, the frequency of reading to
junior infant pupils is much higher in urban DEIS than in rural DEIS or non-DEIS
schools (40–49 per cent compared with 25 per cent and 32 per cent respectively).
Similarly, reading on a daily basis is more prevalent in boys’ schools than in
coeducational or girls’ schools (45 per cent compared with 32 per cent and 26 per
cent). Pupils counting out loud is much less common where they are taught by
more experienced teachers and in multi-grade settings. For senior infant classes,
pupils counting out loud is more common in urban DEIS schools than in rural or
non-DEIS schools. Newly qualified teachers (with less than three years’ experience)
are more likely to use games relating to numbers or maths than other teachers,
while multi-grade teachers are much less likely to use such games. Children
attending boys’ schools engage in these games more frequently than those in girls’
or coeducational schools.
12 This pattern is not evident for teachers reading to pupils where pupils cannot see the print.
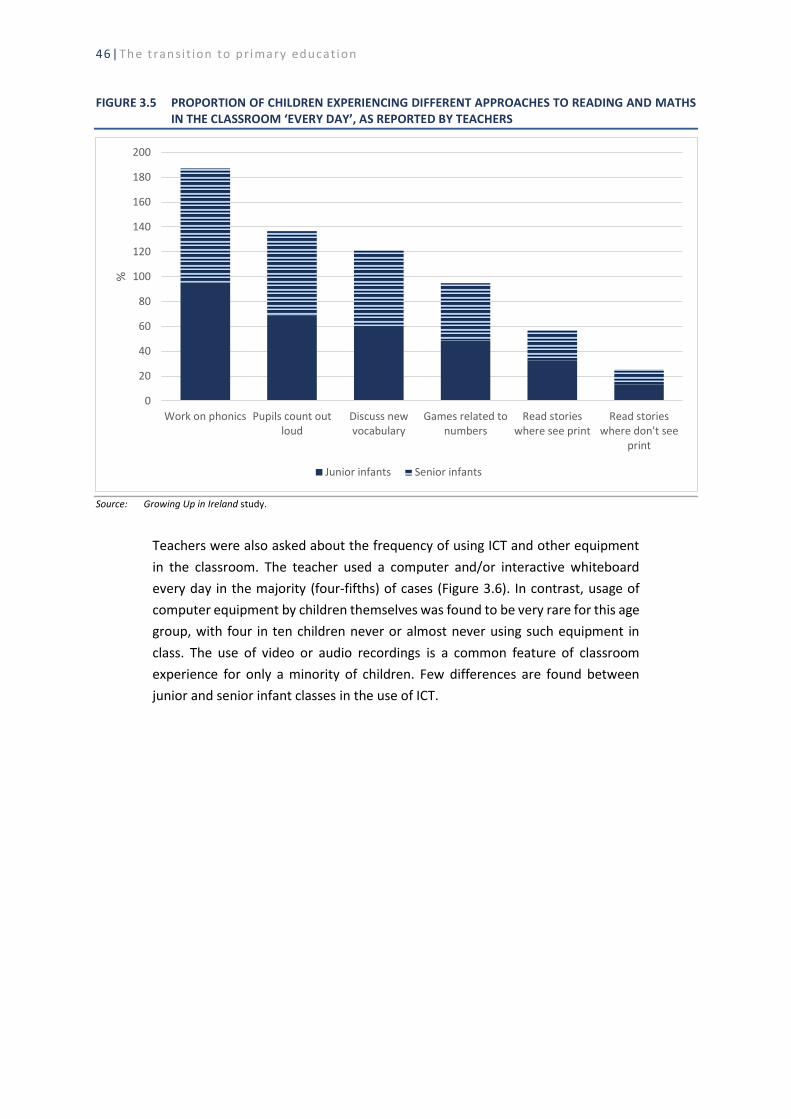
46|The t ransi t ion to pr imary educat ion
FIGURE 3.5 PROPORTION OF CHILDREN EXPERIENCING DIFFERENT APPROACHES TO READING AND MATHS IN THE CLASSROOM ‘EVERY DAY’, AS REPORTED BY TEACHERS
Source: Growing Up in Ireland study.
Teachers were also asked about the frequency of using ICT and other equipment
in the classroom. The teacher used a computer and/or interactive whiteboard
every day in the majority (four-fifths) of cases (Figure 3.6). In contrast, usage of
computer equipment by children themselves was found to be very rare for this age
group, with four in ten children never or almost never using such equipment in
class. The use of video or audio recordings is a common feature of classroom
experience for only a minority of children. Few differences are found between
junior and senior infant classes in the use of ICT.
0
20
40
60
80
100
120
140
160
180
200
Work on phonics Pupils count outloud
Discuss newvocabulary
Games related tonumbers
Read storieswhere see print
Read storieswhere don't see
%
Junior infants Senior infants

The infant c lassroom |47
FIGURE 3.6 PROPORTION OF CHILDREN IN CLASSES WHERE ICT IS USED ‘EVERY DAY’, AS REPORTED BY TEACHERS
Source: Growing Up in Ireland study.
3.5 ALLOCATION OF TIME WITHIN THE CLASS
Classroom teachers were asked about the amount of time spent across the
different subject areas of the primary curriculum. It was found that most time is
spent on English, typically four hours per week, followed by maths (around three
hours per week) (Figure 3.7). About 2.5 hours is spent on Gaeilge, and 100 minutes
on religious/ethical education. Typically, one hour per week is spent on physical
education and visual arts, with slightly less than an hour a week spent on the other
subject areas. A slight increase was observed in the amount of time spent on
English and maths between junior and senior infants, but little difference was
found between the two class settings in other respects.
There is some variation by teacher experience, with more experienced teachers
spending more time on English, art and music, though the differences involved are
not large. Differences in time allocation are also evident by the DEIS status of the
school. Teachers in Urban Band 1 schools spend significantly more time on English
than other school types, with a difference of around half an hour per week on
average, compared to teachers in non-DEIS schools (Figure 3.8). The trade-off is
that these schools allocate less time to Gaeilge and to religious/ethical education.
Rural DEIS schools appear to spend more time on Gaeilge per week than the other
schools. Time spent on maths is somewhat higher in Urban Band 2 and rural DEIS
schools but Urban Band 1 schools do not differ from non-DEIS schools in their
maths time allocation. Single-sex schools devote somewhat more time to English
(with boys’ schools allocating more time than girls’ schools) and slightly less time
0
10
20
30
40
50
60
70
80
90
Computer/IWB Video/audio recordings Pupils use computer/iPad
%
Junior infants Senior infants
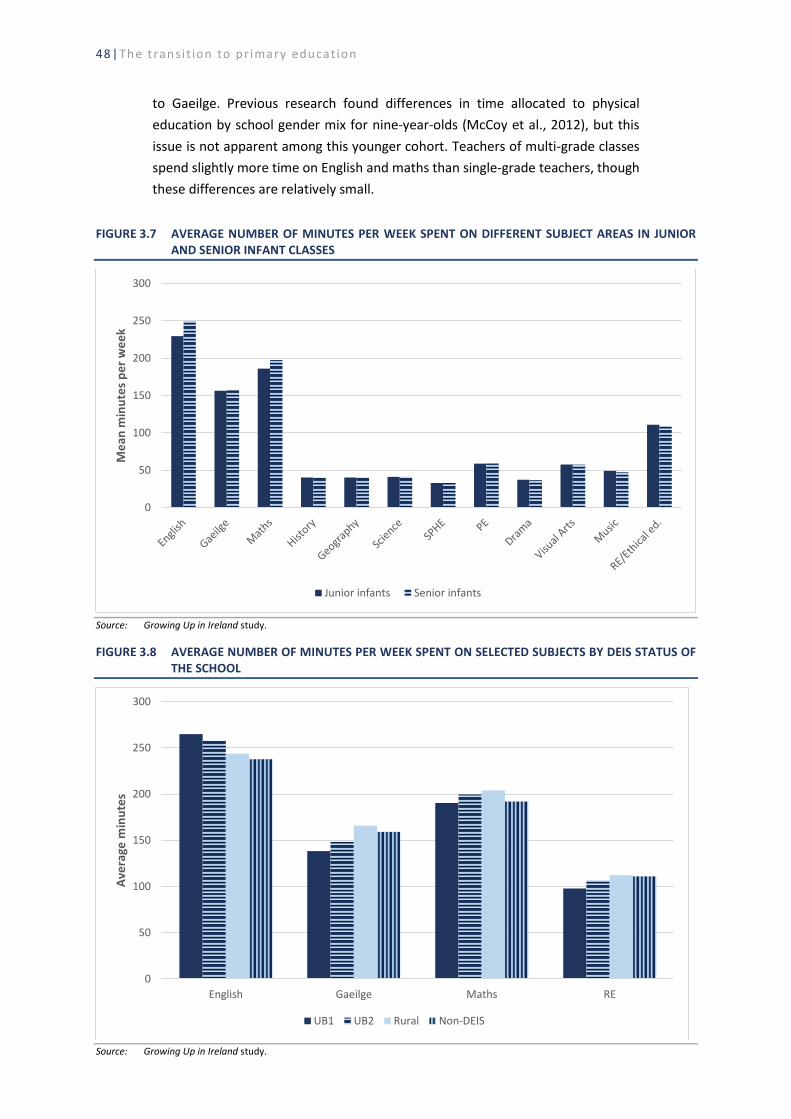
48|The t ransi t ion to pr imary educat ion
to Gaeilge. Previous research found differences in time allocated to physical
education by school gender mix for nine-year-olds (McCoy et al., 2012), but this
issue is not apparent among this younger cohort. Teachers of multi-grade classes
spend slightly more time on English and maths than single-grade teachers, though
these differences are relatively small.
FIGURE 3.7 AVERAGE NUMBER OF MINUTES PER WEEK SPENT ON DIFFERENT SUBJECT AREAS IN JUNIOR AND SENIOR INFANT CLASSES
Source: Growing Up in Ireland study.
FIGURE 3.8 AVERAGE NUMBER OF MINUTES PER WEEK SPENT ON SELECTED SUBJECTS BY DEIS STATUS OF THE SCHOOL
Source: Growing Up in Ireland study.
0
50
100
150
200
250
300
Me
an m
inu
tes
pe
r w
ee
k
Junior infants Senior infants
0
50
100
150
200
250
300
English Gaeilge Maths RE
Ave
rage
min
ute
s
UB1 UB2 Rural Non-DEIS

The infant c lassroom |49
Teachers were also asked about the proportion of time in the classroom that was
based around play-based activity. Around one-quarter of classroom time was
described as being devoted to play-based learning (with a slightly higher rate in
junior infant classes, at 27 per cent compared to 23 per cent); this is in keeping
with the frequency of use of creative and pretend play discussed in the previous
section. Less experienced teachers tend to allocate more time to play-based
learning than their more experienced counterparts; 30 per cent of the newly
qualified group (with less than three years’ experience) devote one-third or more
of classroom time to play-based learning, compared with 20 per cent of teachers
with 20 years or more experience. No variation was apparent by class size, school
social mix or gender mix. Teachers in multi-grade classes tended to spend
somewhat less time on play-based activity.
3.6 HOME–SCHOOL COMMUNICATION
Information on parent–teacher communication was collected from both teachers
and parents. The vast majority (95 per cent) of teachers reported that ‘nearly all’
parents of the children in their class attend parent–teacher meetings while 31 per
cent reported that ‘nearly all’ parents attend other meetings organised by the
school. In relation to the proportion of parents who would approach the teacher
informally to discuss their child’s progress, answers varied, with around one-
quarter responses falling into each of the four answer categories: ‘nearly all’, ‘more
than half’, ‘less than half’ to ‘only a few’. According to the teacher data, levels of
attendance at parent–teacher meetings are lower in Urban Band 1 DEIS schools
(with ‘nearly all’ parents attending in 80 per cent of these cases, compared with 96
per cent in non-DEIS schools). Teachers highlight even greater variation by school
social mix in attendance at other school events, with only a few parents attending
such events in 18 per cent of Urban Band 1 schools, compared with 9 per cent in
non-DEIS schools.
Teachers were also asked questions about their level of communication with the
parents of the study child. Four different aspects of frequency of communication
were captured: the frequency of informally meeting with the child’s parent(s); the
parent(s) talking to the teacher about the child’s behaviour; the parent(s) talking
to the teacher about the child’s schoolwork; and the teacher asking the parent(s)
to come to the school to discuss the child (Figure 3.9). Informal meetings were
found to be relatively common, taking place at least once a week in four out of ten
cases; only 7 per cent of families never have such meetings. The high level of
informal contact is likely to reflect interaction while bringing the child to, or
collecting them from, school. However, the survey did not ask about who brings
the child to school. Meetings about the child’s behaviour or schoolwork are much
less prevalent, though over one-quarter of families have such meetings at least
monthly. It is less common for a teacher to request parent(s) to come for a
meeting, something that occurs regularly for only 7 per cent of children, with the
main responses being less often than monthly (60 per cent) or never (32 per cent).

50|Th e t ran si t ion to p r imary educat ion
FIGURE 3.9 TEACHER REPORTS ON FREQUENCY OF CONTACT WITH PARENTS
Source: Growing Up in Ireland study.
The four measures were combined to give an overall scale of parent–teacher communication.13 Some variation is evident by child and family characteristics (Figure 3.10). The parents of sons have somewhat more contact with teachers than the parents of daughters; this pattern is driven by more specific meetings regarding the child’s behaviour or schoolwork rather than by differences in informal meetings. There is a slight tendency for more frequent contact with working-class and non-employed families, again largely driven by the prevalence of more formal discussions. Migrant families have somewhat greater levels of contact with teachers across all dimensions, most likely reflecting their greater reliance on the school as a source of information because of the absence of insider knowledge on the education system (see Chapter 2). The largest difference is evident in relation to the parents of children with disabilities, who have much more frequent contact with teachers across all of the dimensions captured.
13 The scale had a reliability of 0.695.
0
10
20
30
40
50
60
70
80
90
100
Informally meet Talk about child's behaviour Talk about child'sschoolwork
Come to school to discusschild
At least weekly 1–2 times a month Less often Never

The infant c lassroom |51
FIGURE 3.10 SUMMARY MEASURE OF TEACHER CONTACT WITH PARENTS BY CHILD AND PARENT CHARACTERISTICS
Source: Growing Up in Ireland study.
Parent–teacher contact is also found to vary across different schools and
classrooms (Figure 3.11). More frequent contact is evident where children are in
junior infant classes than in senior infants, reflecting the emphasis on the settling-
in process. Teacher–parent contact is greater in smaller classes (that is, those with
20 or fewer pupils), with lower levels found in classes of 25 pupils or more. Families
with children attending DEIS Urban Band 1 schools have the most frequent contact
with teachers; this pattern is not only driven by more formal discussions but also
relates to much higher levels of day-to-day informal contact. As with class size,
contact levels are greater in smaller schools (those with fewer than 100 students).
8
8.5
9
9.5
10
10.5
11
11.5
12
12.5M
ale
Fem
ale
Pro
f.-m
anag
.
No
n-m
anu
al
Wo
rkin
g-cl
ass
No
n-e
mp
loye
d
Iris
h
Mig
ran
t
No
dis
abili
ty
Dis
abili
ty
Child gender Social class Migrant status Child disability
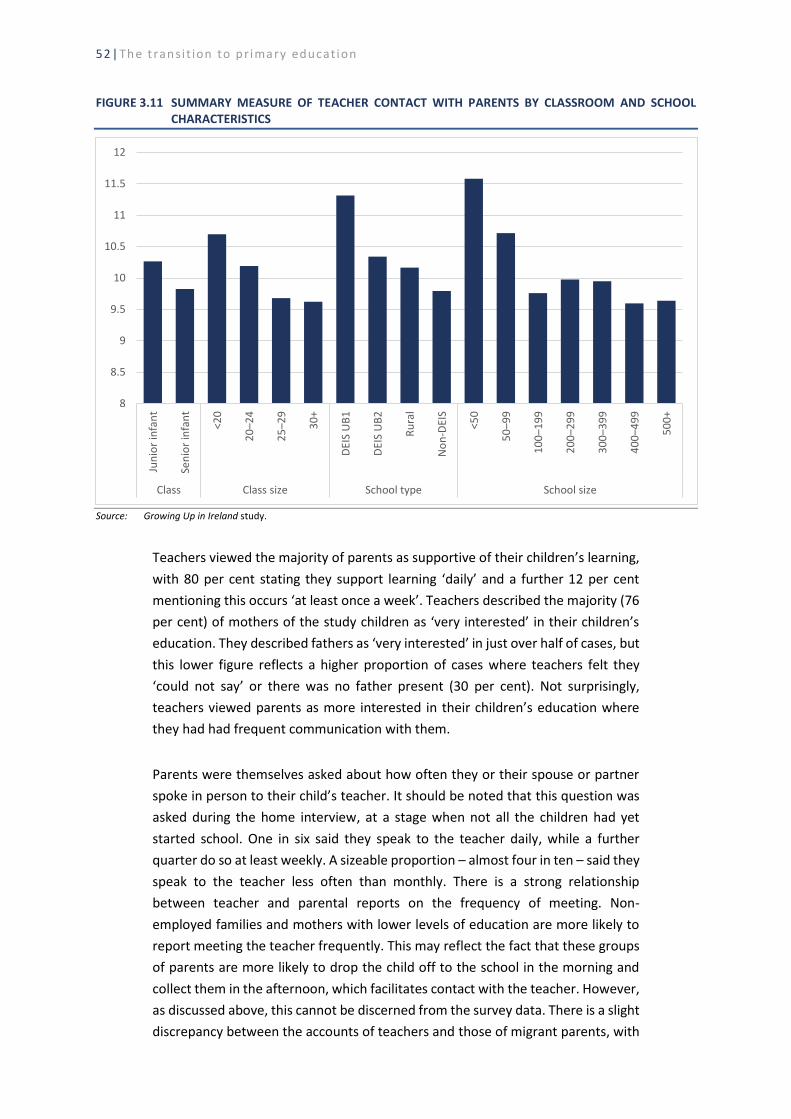
52|The t ransi t ion to pr imary educat ion
FIGURE 3.11 SUMMARY MEASURE OF TEACHER CONTACT WITH PARENTS BY CLASSROOM AND SCHOOL CHARACTERISTICS
Source: Growing Up in Ireland study.
Teachers viewed the majority of parents as supportive of their children’s learning,
with 80 per cent stating they support learning ‘daily’ and a further 12 per cent
mentioning this occurs ‘at least once a week’. Teachers described the majority (76
per cent) of mothers of the study children as ‘very interested’ in their children’s
education. They described fathers as ‘very interested’ in just over half of cases, but
this lower figure reflects a higher proportion of cases where teachers felt they
‘could not say’ or there was no father present (30 per cent). Not surprisingly,
teachers viewed parents as more interested in their children’s education where
they had had frequent communication with them.
Parents were themselves asked about how often they or their spouse or partner
spoke in person to their child’s teacher. It should be noted that this question was
asked during the home interview, at a stage when not all the children had yet
started school. One in six said they speak to the teacher daily, while a further
quarter do so at least weekly. A sizeable proportion – almost four in ten – said they
speak to the teacher less often than monthly. There is a strong relationship
between teacher and parental reports on the frequency of meeting. Non-
employed families and mothers with lower levels of education are more likely to
report meeting the teacher frequently. This may reflect the fact that these groups
of parents are more likely to drop the child off to the school in the morning and
collect them in the afternoon, which facilitates contact with the teacher. However,
as discussed above, this cannot be discerned from the survey data. There is a slight
discrepancy between the accounts of teachers and those of migrant parents, with
8
8.5
9
9.5
10
10.5
11
11.5
12Ju
nio
r in
fan
t
Sen
ior
infa
nt
<20
20
–24
25
–29
30
+
DEI
S U
B1
DEI
S U
B2
Ru
ral
No
n-D
EIS
<50
50
–99
10
0–1
99
20
0–2
99
30
0–3
99
40
0–4
99
50
0+
Class Class size School type School size
The infant c lassroom |53
migrant parents themselves reporting lower levels of communication than Irish
parents. This contrasts with the higher levels of contact with migrant parents
reported by teachers. As with teacher reports, parents of children with a disability
reported more contact with teachers. Variation by school type resembles the
patterns reported by teachers, with greater parent–teacher contact in DEIS Urban
Band 1 schools, small schools and small classes.
3.7 CONCLUSIONS
This chapter has explored the kinds of learning experienced by children in the early
years of their primary education. It has shown that different forms of play,
including physical, creative and pretend play, are common features of early years
classrooms, as is the engagement of pupils in hands-on activities. However, the
dominant teaching methods used centre on questioning, individual work and
whole-class teaching, with relatively low levels of use of group and pair work. In
terms of the amount of time spent on different subject areas, the greatest amount
of time is spent on English (an average of four hours per week), followed by maths
(at three hours per week).
At the time of the teacher survey, 72 per cent of the five-year-olds were in senior
infant classes, with the remainder in junior infants. Teachers appear to tailor
methods and activities to the class level, with a greater emphasis on play-based
and hands-on activities in junior infant classes than at senior infants level. This is
reflected in the slight increase found in the amount of time spent on English and
maths in senior infant level, compared to junior infant level. Previous research on
the experiences of nine-year-olds highlighted significant variation between
different types of schools in the types of teaching methods used and in the time
allocated to different subject areas (McCoy et al., 2012). Among five-year-olds, the
greatest differences in learning experiences are apparent between junior and
senior infant classes. However, there is evidence that teachers adapt their
approaches to the profile of pupils, although not to the same extent as for older
children. The findings point to variation in approaches by the social mix of the
student population, with teachers in urban DEIS schools appearing to make greater
use of methods to encourage pupil engagement while at the same time developing
key skills in literacy and numeracy. Thus, teachers in urban DEIS schools place a
greater emphasis on hands-on and play-based activities, as well as on reading to
pupils and pupils counting out loud. Teachers in Urban Band 1 DEIS schools spend
around half an hour more a week on English than those in other schools, with the
time spent on Gaeilge and religious/ethical education reduced accordingly.
Some differences were found by the gender mix of the school, with a greater use
of physical play and reading out loud found in boys’ schools. In keeping with
findings on nine-year-olds (McCoy et al., 2012), the size and structure of the class
appears to act as a constraint on the use of certain activities. Thus, whole-class
teaching is more prevalent in larger classes; in addition, junior infant children in

54|The t ransi t ion to pr imary educat ion
multi-grade classes experience fewer play-based and hands-on activities than their
peers in single-grade settings.
Both teachers and parents report high levels of informal contact. Parent–teacher
contact levels are higher for junior than for senior infants, where the child has a
disability or SEN, in Urban Band 1 schools, and in smaller classes and schools.
Working-class and non-employed families, as well as the parents of boys, tend to
have more frequent contact with teachers, largely driven by specific meetings
around the child’s behaviour or schoolwork.

Children’s experiences of the transition to primary school|55
CHAPTER 4
Children’s experiences of the transition to primary school
4.1 INTRODUCTION
This chapter focuses on children’s experiences and outcomes as they make the
transition to primary education. The analyses adopt a multidimensional approach,
drawing on the perspectives of parents and teachers as well as cognitive test scores
for children. The Growing Up in Ireland (GUI) study is an age cohort study; thus,
children in the sample are at different stages, depending on the month in which
they were born and their parents’ decision about when to send them to school (see
Chapter 2). For this reason, the analyses generally distinguish between children in
junior and senior infant classes as they will have had differential exposure to the
classroom and school experiences described in Chapter 3. Section 4.2 examines the
ease of settling into primary school, as reported by the child’s mother. Section 4.3
looks at children’s scores on the naming vocabulary subscale of the British Ability
Scale (BAS), which was administered during the home visit. Section 4.4 looks at the
nature of the relationship between the child and teacher along the dimensions of
warmth and conflict, as reported by the teacher. Section 4.5 looks at the child’s
socio-emotional wellbeing, based on teacher reports employing the widely used
Strengths and Difficulties Questionnaire (SDQ). Section 4.6 focuses on teacher
ratings of the child’s skills and competencies: dispositions and attitudes to school,
language for communication and thinking, linking sounds and letters, reading and
numbers.
4.2 SETTLING INTO SCHOOL
Mothers were asked to respond to a number of statements regarding their child’s
experience of settling into primary school. It should be noted that this information
was collected during the home interview, so does not include data from
approximately one-quarter of the children, who had not yet started school. In four-
fifths of cases, mothers reported that their child looks forward to going to school
and says good things about school on a frequent basis, that is, more than once a
week (Figure 4.1). Only a small proportion of children (2–3 per cent) never say
positive things about school, while a significant minority (13–18 per cent) were
reported to be positive about school only occasionally (once a week or less often).
Around three-quarters of five-year-olds do not complain about school or become
upset and reluctant to go to school. Frequent complaining and upset is common
among only a small number of children (4–5 per cent), while occasional
complaining or upset is evident for around one-fifth of children.

56|The t ransi t ion to pr imary educat ion
FIGURE 4.1 PARENTAL PERCEPTIONS OF CHILD SETTLING INTO PRIMARY SCHOOL
Source: Growing Up in Ireland study.
The four measures were combined to give an overall scale of the ease of
integration into primary school.14 Multilevel models were used to look at the
factors associated with ease of transition, taking account of the clustering of
children in different schools and classrooms (Table 4.1). This approach provides
more accurate estimates of the variation between different types of schools and
classrooms (teachers) in the ease of transition to primary school. The measure has
been standardised to have a mean of zero and a standard deviation of one in order
to allow for a comparison of effects for this outcome with other child outcomes
discussed later in the chapter. Model 1 examines the relationship between child
and family characteristics and ease of transition. Girls are seen as significantly more
likely to be positively engaged with school, even at this early age, than boys (Table
4.1, Model 1). There are few differences by maternal education in Model 1 but such
differences become more evident in Models 2 and 3; in other words, for children
of equal cognitive and socio-emotional development, mothers with higher levels
of education reported more difficult transitions. There is no significant variation by
social class background in the transition process, controlling for maternal
education. Lone mothers reported greater transition difficulties for their children,
even taking account of the social class and educational profile of this group. Ease
of transition is found to be greater among children in rural areas, while having
more older siblings is associated with slightly greater transition difficulties (though
the size of this effect is rather small). Children from migrant families have slightly
easier transitions to primary school, a finding that is in stark contrast to results on
14 This scale has a reliability of 0.648.
0
1
2
3
4
5
6
7
8
9
UB1 UB2 Rural Non-DEIS
Junior infants Senior infants
Children’s experiences of the transition to primary school|57
the transition from primary to second-level education, where migrant teenagers
experience greater difficulties (see Smyth, 2017). The greatest transition
difficulties are found among children with disabilities, again resembling the pattern
for primary-post-primary transitions.

58|The t ransi t ion to pr imary educat ion
TABLE 4.1 MULTILEVEL MODELS OF FACTORS ASSOCIATED WITH EASE OF TRANSITION TO PRIMARY SCHOOL
Model 1 Model 2 Model 3
Constant 0.025 0.027 0.147
Female 0.250*** 0.212*** 0.211***
Social class: Professional Managerial Non-manual Skilled manual Non-employed
(Ref.: Semi/unskilled)
0.019 -0.003 -0.015 -0.025 0.005
-0.004 -0.022 -0.018 -0.024 0.014
0.014 -0.007 -0.012 -0.015 0.012
Mother’s education: Leaving Certificate Post-secondary Tertiary Postgraduate degree
(Ref.: Lower secondary or less)
-0.002 -0.081 -0.098* -0.081
-0.019 -0.105* -0.143** -0.150*
-0.013 -0.098± -0.133** -0.140*
Number of older siblings -0.029* -0.028* -0.028*
Lone parent family -0.175*** -0.174*** -0.171***
Migrant family 0.078* 0.112** 0.117**
Living in an urban area -0.102*** -0.103*** -0.103***
Child has disability -0.452*** -0.378*** -0.385***
Positive parent–child relationship at 3 Parent–child conflict at 3 Home learning environment at 3 Naming vocabulary score at 3 Picture similarity score at 3 SDQ Total Difficulties at 3 SDQ Prosocial subscale at 3
0.022** -0.010** 0.010*** 0.000
-0.001 -0.013*** 0.006
0.022** -0.010** 0.010*** 0.000
-0.001 -0.014*** 0.006
Type of care at 3: Relative Non-relative Centre-based Other
(Ref.: Parents) Age starting school
0.005 0.048 0.257 0.405
-0.015**
0.001 0.049 0.049 0.250
-0.015*
DEIS status: Urban Band 1 Urban Band 2 Rural DEIS
(Ref.: Non-DEIS) Gender mix:
Boys Girls (Ref.: Coed)
School size: 50–99 100–199 200–299 300–399 400–499 500+ (Ref.: <50)
0.125*
-0.002 0.020
0.009 0.020
-0.124 -0.165* -0.195** -0.110 -0.165* -0.141*
Schools 1,954 1,954 1,954
Classes (teachers) 2,701 2,701 2,701
N 5,694 5,694 5,694
Note: *** p<.001; ** p<.01; * p<.05; ± p<.10. Source: Growing Up in Ireland study.
Children’s experiences of the transition to primary school|59
Model 2 looks at whether a child’s preschool experiences are associated with how
they settle into primary education. Transitions are somewhat easier where
mothers report a close relationship with their child (when they are three years)
and somewhat more difficult where the relationship is more conflictual. Children
who experienced a more stimulating home learning environment at the age of
three settle into school more readily, though the difference is rather small.
Cognitive skills (in terms of naming vocabulary and non-verbal reasoning) at the
age of three are not associated with the later ease of transition. On the other hand,
those who had greater socio-emotional difficulties at that age have greater
transition difficulties later. Contrary to expectations, the type of childcare
experienced at three years is not related to the ease of transition to primary school.
However, it is worth noting that almost all of these children had taken part in the
funded preschool year and so had experienced a centre-based preschool setting.
Somewhat surprisingly, all else being equal, children who are older on starting
school are found to have greater transition difficulties, though the difference is
small. This may reflect the decision of parents to postpone school entry for children
who are not deemed to be ‘ready’ for the new environment.
Model 3 looks at whether transition difficulties vary across different types of
school, taking account of child and family characteristics. Teacher characteristics
are not explored here because it cannot be assumed that the child has the same
teacher at the time of the parental interview as later in the year. Interestingly,
children attending DEIS (Delivering Equality of Opportunity in Schools) Urban Band
1 schools are reported to have an easier transition to primary school than might be
expected given their other characteristics. This may reflect the particular approach
adopted in DEIS schools to easing the transition. No variation is found by the
gender mix of the school. There is some evidence that those in smaller schools (less
than 100 pupils) settle into school more readily than those in larger schools.
Additional analysis (not shown here) examined the relationship between ease of
transition and the different activities parents had carried out with their children in
preparation for starting school. There is no significant relationship between
settling into school and the parents having attended an information meeting,
visited the school or sought advice from family, neighbours or friends about the
process. In contrast, the children of mothers who reported practising reading,
letters or numbers with the child have fewer transition difficulties.
4.3 VOCABULARY SKILLS AMONG FIVE-YEAR-OLDS
Chapter 2 described differences in children’s vocabulary skills at the age of three.
A similar age-appropriate test, the BAS vocabulary test, was administered to them
two years later, during the home visit. As a result, the test captured skill
development when children were at very different stages – around one-quarter
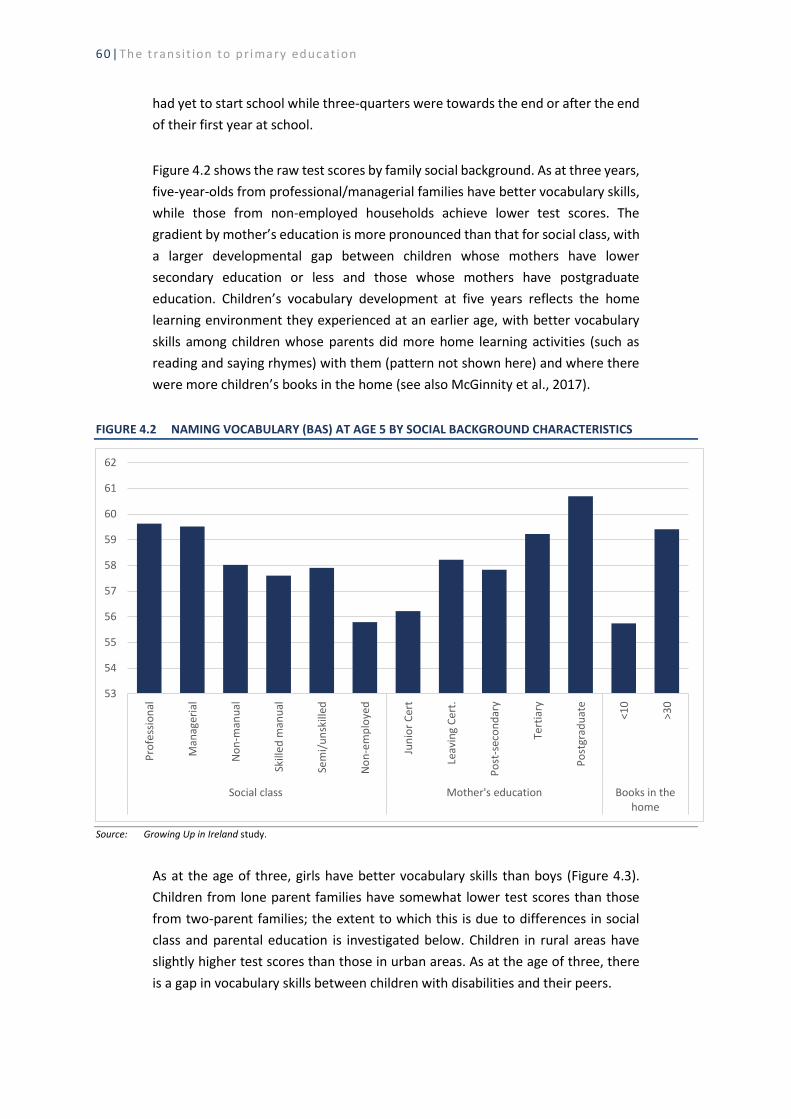
60|The t ransi t ion to pr imary educat ion
had yet to start school while three-quarters were towards the end or after the end
of their first year at school.
Figure 4.2 shows the raw test scores by family social background. As at three years,
five-year-olds from professional/managerial families have better vocabulary skills,
while those from non-employed households achieve lower test scores. The
gradient by mother’s education is more pronounced than that for social class, with
a larger developmental gap between children whose mothers have lower
secondary education or less and those whose mothers have postgraduate
education. Children’s vocabulary development at five years reflects the home
learning environment they experienced at an earlier age, with better vocabulary
skills among children whose parents did more home learning activities (such as
reading and saying rhymes) with them (pattern not shown here) and where there
were more children’s books in the home (see also McGinnity et al., 2017).
FIGURE 4.2 NAMING VOCABULARY (BAS) AT AGE 5 BY SOCIAL BACKGROUND CHARACTERISTICS
Source: Growing Up in Ireland study.
As at the age of three, girls have better vocabulary skills than boys (Figure 4.3).
Children from lone parent families have somewhat lower test scores than those
from two-parent families; the extent to which this is due to differences in social
class and parental education is investigated below. Children in rural areas have
slightly higher test scores than those in urban areas. As at the age of three, there
is a gap in vocabulary skills between children with disabilities and their peers.
53
54
55
56
57
58
59
60
61
62
Pro
fess
ion
al
Man
ager
ial
No
n-m
anu
al
Skill
ed
man
ual
Sem
i/u
nsk
illed
No
n-e
mp
loye
d
Jun
ior
Cer
t
Leav
ing
Cer
t.
Po
st-s
eco
nd
ary
Tert
iary
Po
stgr
adu
ate
<10
>30
Social class Mother's education Books in thehome
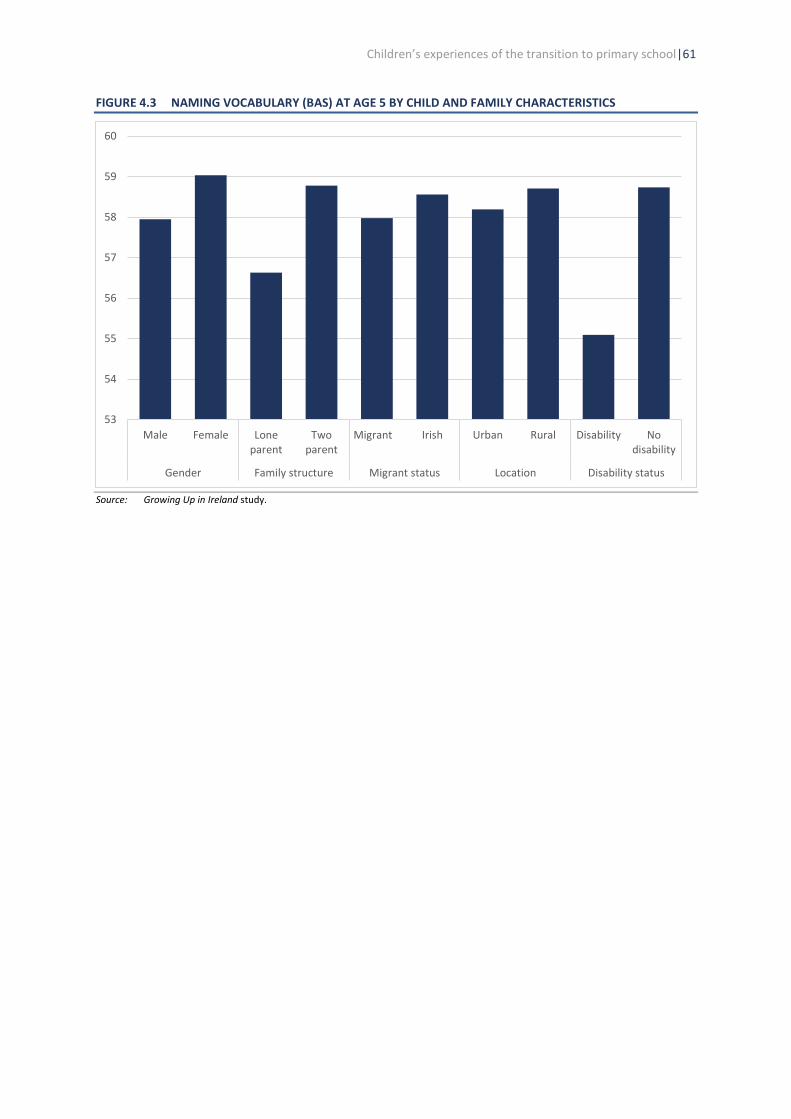
Children’s experiences of the transition to primary school|61
FIGURE 4.3 NAMING VOCABULARY (BAS) AT AGE 5 BY CHILD AND FAMILY CHARACTERISTICS
Source: Growing Up in Ireland study.
53
54
55
56
57
58
59
60
Male Female Loneparent
Twoparent
Migrant Irish Urban Rural Disability Nodisability
Gender Family structure Migrant status Location Disability status
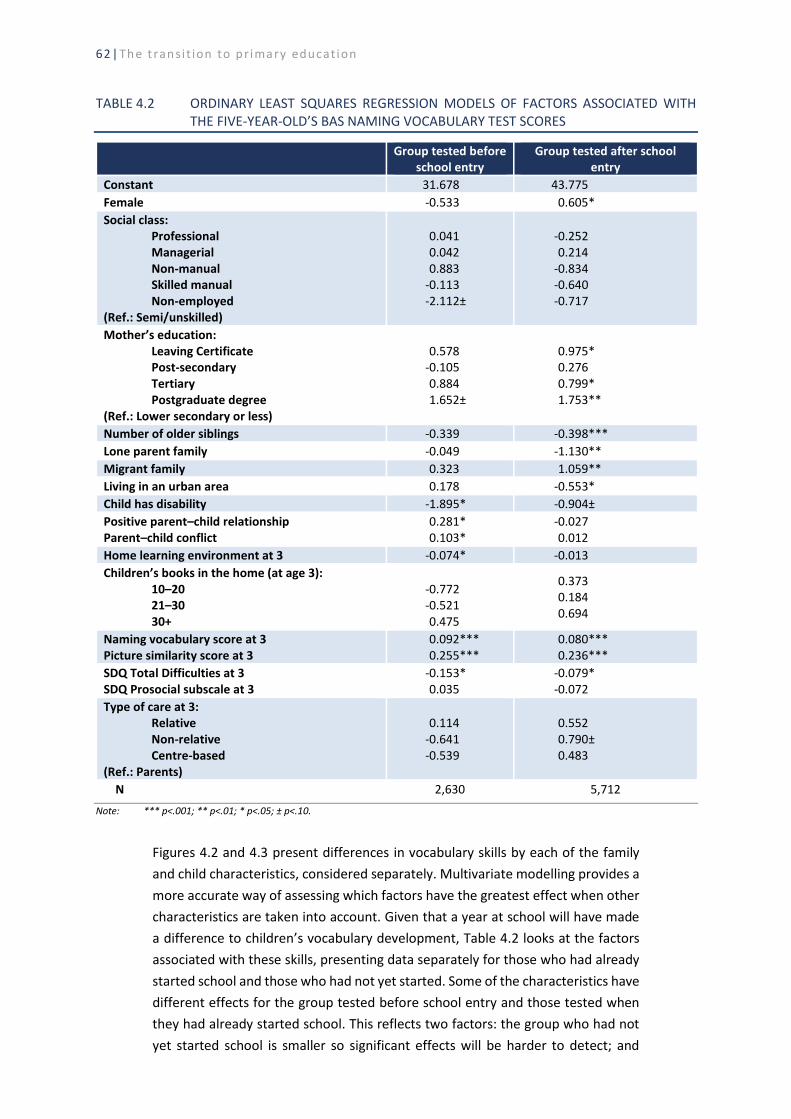
62|The t ransi t ion to pr imary educat ion
TABLE 4.2 ORDINARY LEAST SQUARES REGRESSION MODELS OF FACTORS ASSOCIATED WITH THE FIVE-YEAR-OLD’S BAS NAMING VOCABULARY TEST SCORES
Group tested before
school entry Group tested after school
entry
Constant 31.678 43.775
Female -0.533 0.605*
Social class: Professional Managerial Non-manual Skilled manual Non-employed
(Ref.: Semi/unskilled)
0.041 0.042 0.883
-0.113 -2.112±
-0.252 0.214
-0.834 -0.640 -0.717
Mother’s education: Leaving Certificate Post-secondary Tertiary Postgraduate degree
(Ref.: Lower secondary or less)
0.578
-0.105 0.884 1.652±
0.975* 0.276 0.799* 1.753**
Number of older siblings -0.339 -0.398***
Lone parent family -0.049 -1.130**
Migrant family 0.323 1.059**
Living in an urban area 0.178 -0.553*
Child has disability -1.895* -0.904±
Positive parent–child relationship Parent–child conflict
0.281* 0.103*
-0.027 0.012
Home learning environment at 3 -0.074* -0.013
Children’s books in the home (at age 3): 10–20 21–30 30+
-0.772 -0.521 0.475
0.373 0.184 0.694
Naming vocabulary score at 3 Picture similarity score at 3
0.092*** 0.255***
0.080*** 0.236***
SDQ Total Difficulties at 3 SDQ Prosocial subscale at 3
-0.153* 0.035
-0.079* -0.072
Type of care at 3: Relative Non-relative Centre-based
(Ref.: Parents)
0.114
-0.641 -0.539
0.552 0.790± 0.483
N 2,630 5,712
Note: *** p<.001; ** p<.01; * p<.05; ± p<.10.
Figures 4.2 and 4.3 present differences in vocabulary skills by each of the family
and child characteristics, considered separately. Multivariate modelling provides a
more accurate way of assessing which factors have the greatest effect when other
characteristics are taken into account. Given that a year at school will have made
a difference to children’s vocabulary development, Table 4.2 looks at the factors
associated with these skills, presenting data separately for those who had already
started school and those who had not yet started. Some of the characteristics have
different effects for the group tested before school entry and those tested when
they had already started school. This reflects two factors: the group who had not
yet started school is smaller so significant effects will be harder to detect; and

Children’s experiences of the transition to primary school|63
those who have delayed school start are distinctive in other ways (see Chapter 2).
The models presented control for cognitive skills development at age three, so can
be interpreted as reflecting progress relative to this earlier time-point.
Among those tested after school entry, girls achieve higher vocabulary test scores
than boys, even taking account of their better verbal skills at age three. No
significant gender difference is found among the pre-entry group; it may be that
because girls tend to be sent to school earlier than boys (see Chapter 2), those girls
who start later have other characteristics that are not captured in this model. The
children of more educated mothers have better vocabulary skills (see Figure 4.2)
but also make more progress relative to their earlier skill development. Lower
vocabulary scores are found among children from lone parent families, those who
have more older siblings and those living in urban areas (for those who have
started school only). Migrant children are found to have made greater progress
relative to their (English) vocabulary skills at the age of three, with a much larger
effect for those who have started school. In other words, a good deal of the gap in
language skills between migrant and Irish children found at the age of three closes
in the subsequent two years, with school start appearing to prompt a significant
gain in English language skills. Children with disabilities have poorer vocabulary
skills, even relative to the achievement gap evident when they were three. The
larger gap found among those who have not yet started school suggests that
parents delay school entry for those with the kinds of disabilities that hamper
children’s development to a greater extent (see Chapter 2).
The effects of home learning activities and books in the home are mediated by
early skills development. In other words, children have better vocabulary skills at
age three where they experience a more stimulating learning environment, an
advantage they maintain at five years. Not surprisingly, children with better verbal
and non-verbal skills at the age of three have better verbal skills two years later.
However, it is worth noting that vocabulary skills at the two time-points are not
very strongly related.15 This reflects two factors. Firstly, some children develop
language skills at different stages, so many will have ‘caught up’ by five years.
Secondly, a significant proportion of children do fairly or very well on the
vocabulary test at the age of five, so there is not as much variation in the spread of
scores as there is at three years. Children who experience socio-emotional
difficulties at the age of three have poorer verbal skills at the age of five. The type
of preschool care experienced is not highly related to verbal skills at five years,
though scores improve between three and five somewhat more for those who
have been cared for by a non-relative (consistent with the findings of McGinnity et
al., 2015).
15 The correlation between vocabulary skills test scores at three and five years is 0.2, on a scale of zero (not related) to
one (perfectly related).

64|The t ransi t ion to pr imary educat ion
FIGURE 4.4 NAMING VOCABULARY (BAS) AT SCHOOL ENTRY BY DEIS STATUS OF THE SCHOOL
Source: Growing Up in Ireland study.
The social gradient in children’s language development means that children start
different types of school with different sets of skills, which may advantage or
disadvantage them in adjusting to the new school setting, an issue explored in the
remainder of the chapter. Figure 4.4 shows vocabulary test scores for those
attending a DEIS school at the time of the test or who subsequently go on to attend
a DEIS school. It is clear that the intake to urban DEIS schools, especially those in
the more deprived Urban Band 1 schools, has poorer vocabulary skills at this early
stage. In contrast, children who enter rural DEIS schools have verbal skills that are
equivalent to, if not higher than, those in non-DEIS schools.16 The extent to which
attending a school with a concentration of children from disadvantaged
backgrounds influences other aspects of the transition is explored in the remainder
of the chapter.
4.4 TEACHER–PUPIL RELATIONSHIP
Classroom teachers were asked to complete the Pianta Teacher–Student
Relationship Scale, which involves rating each of the study children they taught in
terms of a number of statements, with categories ranging from ‘definitely applies’
to ‘definitely does not apply’. Two subscales were formed on the basis of these
responses. Closeness reflected responses to the following statements.
• I share an affectionate, warm relationship with this child.
16 These patterns are intended to show differences between schools in the starting point of their pupils. The scores of
those tested before school entry and the group tested after starting school should not be interpreted as comparing like with like, as age at starting school differs significantly by child and family characteristics (see Chapter 2).
51
52
53
54
55
56
57
58
59
60
61
Group who have not yet started school Group who have started school
UB 1 UB 2 Rural Non-DEIS
Children’s experiences of the transition to primary school|65
• If upset, this child will seek comfort from me.
• This child values his/her relationship with me.
• When I praise this child, he/she beams with pride.
• The child spontaneously shares information about himself/herself.
• It is easy to be in tune with what this child is feeling.
• This child openly shares his/her feelings and experiences with me.
The degree of conflict reflected responses to the following statements.
• This child and I always seem to be struggling with each other.
• This child is uncomfortable with physical affection or touch from me.
• This child easily becomes angry at me.
• This child remains angry or is resistant after being disciplined.
• Dealing with this child drains my energy.
• When this child is in a bad mood, I know we’re in for a long and difficult day.
• This child is sneaky or manipulative with me.
For descriptive purposes, ratings of closeness and conflict were grouped into four
categories. Overall, teachers who report higher levels of closeness to a child tend
to report lower levels of conflict with them, and vice versa. However, it is worth
noting that a small group of children, 5 per cent of the study cohort, fall into both
the low closeness and low conflict groups, so may be somewhat marginalised
within the class group.

66|The t ransi t ion to pr imary educat ion
FIGURE 4.5A TEACHER–CHILD CLOSENESS (HIGHEST AND LOWEST QUARTILES) BY CHILD CHARACTERISTICS
Source: Growing Up in Ireland study.
Figure 4.5a shows the proportions falling into the highest and lowest levels of
closeness by child characteristics, while Figure 4.5b shows comparable information
on teacher–child conflict levels. The quality of relationship is found to vary
significantly by gender, social background, migrant status and whether the child
has a disability. Overall, these differences are greater in relation to ‘poorer’
outcomes, that is, higher conflict and lower closeness. Boys are much more likely
to be less close to their teacher and have more conflict with them. Children from
working-class and non-employed families have poorer relationships with their
teachers than their middle-class peers, with those from non-employed households
having particularly high levels of conflict with their teachers. The children of
immigrants have less close and more conflictual interaction with classroom
teachers. Even at this early stage of their schooling, children with disabilities have
more conflict with their teachers and are less close to them.17 Type of disability
makes a significant difference; children with physical disabilities are not very
different to their non-disabled peers but those with emotional and learning
disabilities are twice as likely to fall into the high conflict group.
17 The number of missing cases for the total scales of closeness and conflict is greater in relation to more disadvantaged
children and those with SEN (see Chapter 1). As a result, the figures presented here may represent a slight underestimate of differences in the quality of teacher–student relationships for these groups of children.
0
5
10
15
20
25
30
35
40
45
Mal
e
Fem
ale
Pro
f.-m
anag
.
No
n-m
anu
al
Wo
rkin
g-cl
ass
No
n-e
mp
loye
d
Iris
h
Mig
ran
t
No
dis
abili
ty
Dis
abili
ty
Child gender Social class Migrant status Child disability
%
Lowest Highest
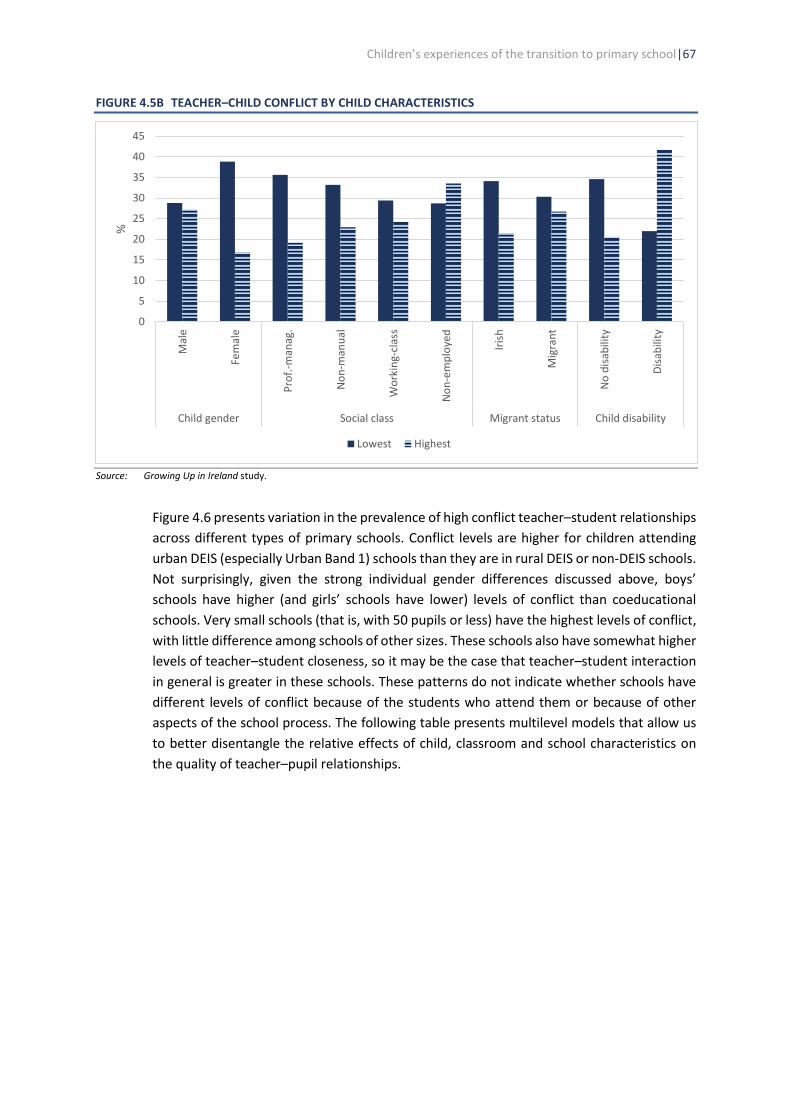
Children’s experiences of the transition to primary school|67
FIGURE 4.5B TEACHER–CHILD CONFLICT BY CHILD CHARACTERISTICS
Source: Growing Up in Ireland study.
Figure 4.6 presents variation in the prevalence of high conflict teacher–student relationships
across different types of primary schools. Conflict levels are higher for children attending
urban DEIS (especially Urban Band 1) schools than they are in rural DEIS or non-DEIS schools.
Not surprisingly, given the strong individual gender differences discussed above, boys’
schools have higher (and girls’ schools have lower) levels of conflict than coeducational
schools. Very small schools (that is, with 50 pupils or less) have the highest levels of conflict,
with little difference among schools of other sizes. These schools also have somewhat higher
levels of teacher–student closeness, so it may be the case that teacher–student interaction
in general is greater in these schools. These patterns do not indicate whether schools have
different levels of conflict because of the students who attend them or because of other
aspects of the school process. The following table presents multilevel models that allow us
to better disentangle the relative effects of child, classroom and school characteristics on
the quality of teacher–pupil relationships.
0
5
10
15
20
25
30
35
40
45
Mal
e
Fem
ale
Pro
f.-m
anag
.
No
n-m
anu
al
Wo
rkin
g-cl
ass
No
n-e
mp
loye
d
Iris
h
Mig
ran
t
No
dis
abili
ty
Dis
abili
ty
Child gender Social class Migrant status Child disability
%
Lowest Highest

68|The t ransi t ion to pr imary educat ion
FIGURE 4.6 PROPORTION OF CHILDREN WITH WHOM TEACHERS REPORT HIGH LEVELS OF CONFLICT BY SCHOOL CHARACTERISTICS
Source: Growing Up in Ireland study.
0
5
10
15
20
25
30
35
UB 1 UB 2 Rural Non-DEIS Coed Boys Girls <50 500+
DEIS status Gender mix School size
%
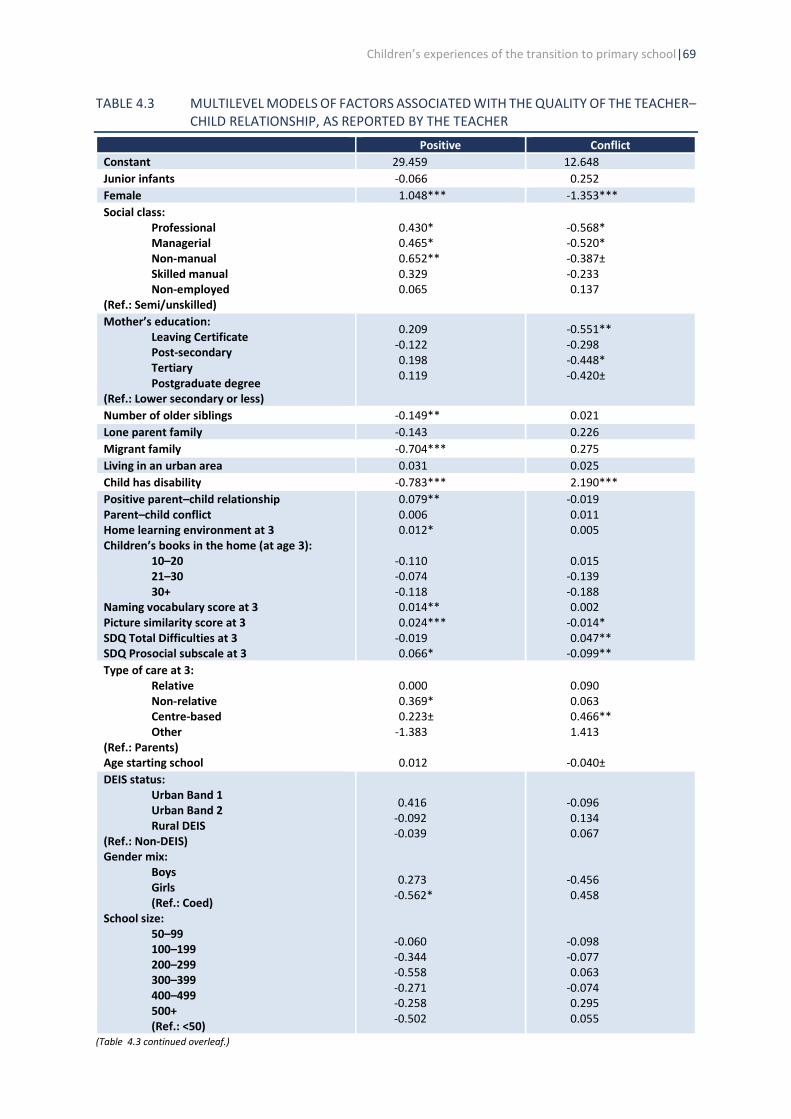
Children’s experiences of the transition to primary school|69
TABLE 4.3 MULTILEVEL MODELS OF FACTORS ASSOCIATED WITH THE QUALITY OF THE TEACHER–CHILD RELATIONSHIP, AS REPORTED BY THE TEACHER
Positive Conflict
Constant 29.459 12.648
Junior infants -0.066 0.252
Female 1.048*** -1.353***
Social class: Professional Managerial Non-manual Skilled manual Non-employed
(Ref.: Semi/unskilled)
0.430* 0.465* 0.652** 0.329 0.065
-0.568* -0.520* -0.387± -0.233 0.137
Mother’s education: Leaving Certificate Post-secondary Tertiary Postgraduate degree
(Ref.: Lower secondary or less)
0.209 -0.122 0.198 0.119
-0.551** -0.298 -0.448* -0.420±
Number of older siblings -0.149** 0.021
Lone parent family -0.143 0.226
Migrant family -0.704*** 0.275
Living in an urban area 0.031 0.025
Child has disability -0.783*** 2.190***
Positive parent–child relationship Parent–child conflict Home learning environment at 3 Children’s books in the home (at age 3):
10–20 21–30 30+
Naming vocabulary score at 3 Picture similarity score at 3 SDQ Total Difficulties at 3 SDQ Prosocial subscale at 3
0.079** 0.006 0.012*
-0.110 -0.074 -0.118 0.014** 0.024***
-0.019 0.066*
-0.019 0.011 0.005
0.015
-0.139 -0.188 0.002
-0.014* 0.047**
-0.099**
Type of care at 3: Relative Non-relative Centre-based Other
(Ref.: Parents) Age starting school
0.000 0.369* 0.223±
-1.383
0.012
0.090 0.063 0.466** 1.413
-0.040±
DEIS status: Urban Band 1 Urban Band 2 Rural DEIS
(Ref.: Non-DEIS) Gender mix:
Boys Girls (Ref.: Coed)
School size: 50–99 100–199 200–299 300–399 400–499 500+ (Ref.: <50)
0.416
-0.092 -0.039
0.273 -0.562*
-0.060 -0.344 -0.558 -0.271 -0.258 -0.502
-0.096 0.134 0.067
-0.456 0.458
-0.098 -0.077 0.063
-0.074 0.295 0.055
(Table 4.3 continued overleaf.)

70|The t ransi t ion to pr imary educat ion
TABLE 4.3 (CONTINUED)
Positive Conflict
Multi-grade class Class size:
20–24 25–29 30+
Male teacher Teacher experience:
3–5 years 5–10 years 10–15 years 15–20 years 20+ years (Ref.: <3 years)
0.215
-0.035 -0.011 -0.152 -1.263***
0.127
-0.014 0.237 0.262 0.668**
-0.058
-0.297 -0.410* -0.420± 0.963**
0.009 0.009 0.004
-0.649* -0.143
Between-school variation Between-teacher variation Between-child variation
0.549*** 4.918***
11.894***
0.059 4.283***
16.184***
Schools Teachers Children
2,157 3,813 7,307
2,157 3,813 7,307
Note: *** p<.001; ** p<.01; * p<.05; ± p<.10. Source: Growing Up in Ireland study.
Table 4.3 looks at the extent to which the quality of the teacher–child relationship
is shaped by a range of child, family, school and classroom characteristics. Because
patterns for junior and senior infant classes are similar, the analyses pool the two
groups of children. In keeping with the descriptive analysis in Figures 4.5a and 4.5b,
significant gender differences are found, with teachers reporting more positive and
less conflictual relationships with female pupils than male pupils. This pattern
holds, even taking account of gender differences in socio-emotional difficulties at
the age of three and in the prevalence of disabilities. Children from more middle-
class families have more positive relationships with their teachers and experience
less conflict with them. No difference is found between lone parent and two-
parent families when socio-economic characteristics are taken into account. There
is a tendency for children with more older siblings to have less positive
relationships with their teachers. Children from immigrant families have less
positive relationships with their teachers, all else being equal. However, the
descriptive pattern of higher levels of conflict for children from immigrant families
is found to be related to their lower test scores in naming vocabulary and picture
similarity at the age of three. Children with disabilities have significantly poorer
quality relationships with their teachers, even at this early stage, with lower levels
of closeness and higher levels of conflict.
The analyses explored the extent to which the quality of a teacher–child
relationship is influenced by a child’s preschool experience. Children who have
positive relationships with their parents when they are three years have more
positive relationships with their teachers two years later, but there is no evidence
that parent–child conflict transfers into conflict with teachers. Children with a
Children’s experiences of the transition to primary school|71
more positive home learning environment at the age of three also have better
relationships with their teachers, but the size of the difference is small. Those with
higher test scores in naming vocabulary at the age of three have more positive
relationships with their teachers, while higher non-verbal scores are associated
with a reduced incidence of conflict. Additional analyses (not shown here) indicate
that better verbal skills (naming vocabulary) measured during the home visit, and
some months prior to the teacher report, are associated with a better quality
relationship with the teacher. Socio-emotional difficulties at the age of three are
predictive of a conflictual relationship with a teacher, while being more prosocial
at three years was associated with a better relationship with teachers (more
closeness and less conflict).
Children who are cared for by non-relatives, either in home-based or centre-based
settings, have closer relationships with their teachers two years later, most likely
because of their familiarity with interacting with non-family members. At the same
time, however, children who have been in centre-based care also have higher
levels of conflict with their teachers. Being older on starting school is associated
with a slightly reduced level of conflict but the difference is small.
The DEIS status of a school no longer has a significant effect on the quality of
teacher–student relationships when other characteristics are considered. In other
words, the higher levels of conflict in urban DEIS schools depicted in Figure 4.6
reflect the concentration of more disadvantaged children and a higher proportion
of children with disabilities in these schools. There is a slight tendency for girls
attending single-sex girls’ schools to have somewhat less close relationships with
their teachers than those in coeducational schools. There is no significant variation
in the quality of teacher–student relationships by school size, once other
characteristics are considered.
There is relatively little variation by classroom and teacher characteristics in
relation to the quality of the relationship between child and teacher. Closeness
does not vary by class size, though levels of conflict are slightly lower in larger
classes (those with 25 or more pupils). Marked variation is found by teacher
gender, with lower levels of closeness and higher levels of conflict reported by male
teachers, though these findings should be interpreted with caution due to the
small number of male teachers in the study. More experienced teachers (20 years
or more) tend to report higher levels of closeness with their students. Even taking
account of child, family and teacher characteristics, significant variation is found in
the quality of teacher–pupil relationships among teachers in the same school, with
significant between-school variation found in teacher–pupil closeness.
4.5 SOCIO-EMOTIONAL WELLBEING
Teachers were asked to complete the Strength and Difficulties (SDQ)
questionnaire, an internationally used instrument to capture children’s socio-

72|The t ransi t ion to pr imary educat ion
emotional wellbeing. Difficulties are captured by 25 statements (items), which can
be broken down into four different subscales: emotional symptoms; conduct
problems; hyperactivity; and peer problems. In addition, five statements capture
prosocial behaviour, that is, whether the child socialises well with their peers. The
analyses in this section look at the factors influencing total difficulties (that is,
poorer socio-emotional wellbeing) and prosocial behaviour. Because there is no a
priori reason to expect socio-emotional wellbeing to differ between junior and
senior infant classes, the whole cohort of five-year-olds is included in the same
model.
Table 4.4 indicates that children in junior infant classes have poorer socio-
emotional wellbeing than those in senior infant classes, even taking account of age
on starting school. Girls have fewer socio-emotional difficulties than boys. In
addition, those from working-class/non-employed families or households with
lower levels of educational qualifications have greater difficulties. Even taking
account of social class and parental education, the children of lone parents are
described by teachers as having poorer socio-emotional wellbeing. There are no
differences found by family size, whether the child is from an immigrant family and
whether the family lives in an urban or rural area. Children with disabilities have
poorer socio-emotional wellbeing than their peers and the difference is sizeable,
larger than any of the other child and family characteristics considered.
Children with a more positive relationship with their parents at the age of three
have fewer socio-emotional difficulties two years later. In initial models (not shown
here), having a conflictual relationship with parents is associated with greater
difficulties, but this relationship changes direction when other factors are taken
into account. A more stimulating home learning environment is associated with
fewer difficulties, but this effect is mediated by cognitive skills and socio-emotional
wellbeing at the age of three. In other words, parent–child learning activities
reduce the incidence of socio-emotional difficulties at five years because they
enhance vocabulary and socio-emotional development at the age of three.
Children who live in a book-rich environment have fewer difficulties than their
peers, as do those with better verbal and non-verbal skills at age three. Children
who experience centre-based care at the age of three have significantly higher
levels of socio-emotional difficulties than those in other types of care, but the
effect is small (see also Russell et al., 2016).
During the home visit several months prior to the teacher questionnaire
completion (see Chapter 1), mothers were asked to complete the SDQ
questionnaire. Mothers’ ratings are predictive of teachers’ ratings but the
relationship is by no means very strong, which is not surprising given that children
will display different behaviours in different contexts. Children who are older on
starting school tend to have slightly better socio-emotional wellbeing than those
who are younger.

Children’s experiences of the transition to primary school|73
FIGURE 4.7 CHILD’S SOCIO-EMOTIONAL DIFFICULTIES AND PROSOCIAL BEHAVIOUR BY DEIS STATUS OF THE SCHOOL
Source: Growing Up in Ireland study.
Figure 4.7 shows the raw differences in total socio-emotional difficulties by DEIS
status of the school. Socio-emotional difficulties are found to be significantly
greater in Urban Band 1 schools and, to some extent, Urban Band 2 schools. Rural
DEIS schools resemble non-DEIS schools in the socio-emotional wellbeing of their
students. However, once the disadvantaged nature of the intake to urban DEIS
schools is taken into account, there are no significant differences between urban
DEIS and other schools (see Table 4.4). Boys attending single-sex schools are rated
as having fewer socio-emotional difficulties than those in coeducational schools,
though no such difference is evident for girls. It may be that boys in these settings
benefit from their teachers not comparing them to girls. Furthermore, there is no
systematic variation in socio-emotional wellbeing by school size, classroom or
teacher characteristics.
Table 4.5 takes account of the nature of the teacher–child relationship and
children’s naming vocabulary some months prior to the teacher report. Teachers
tend to have more conflictual and less close relationships with children with
greater socio-emotional difficulties. It may be that teacher may report greater
socio-emotional difficulties where they have a conflictual relationship. However, it
is worth noting that mothers’ ratings of poor socio-emotional wellbeing have the
same relationship with teacher closeness and conflict, though the relationship is
not as strong. Much of the social and gender gap in socio-emotional wellbeing is
explained by the quality of the teacher–child relationship. Children with better
0
1
2
3
4
5
6
7
8
9
Total difficulties Prosocial behaviour
Urban Band 1 Urban Band 2 Rural DEIS Non-DEIS
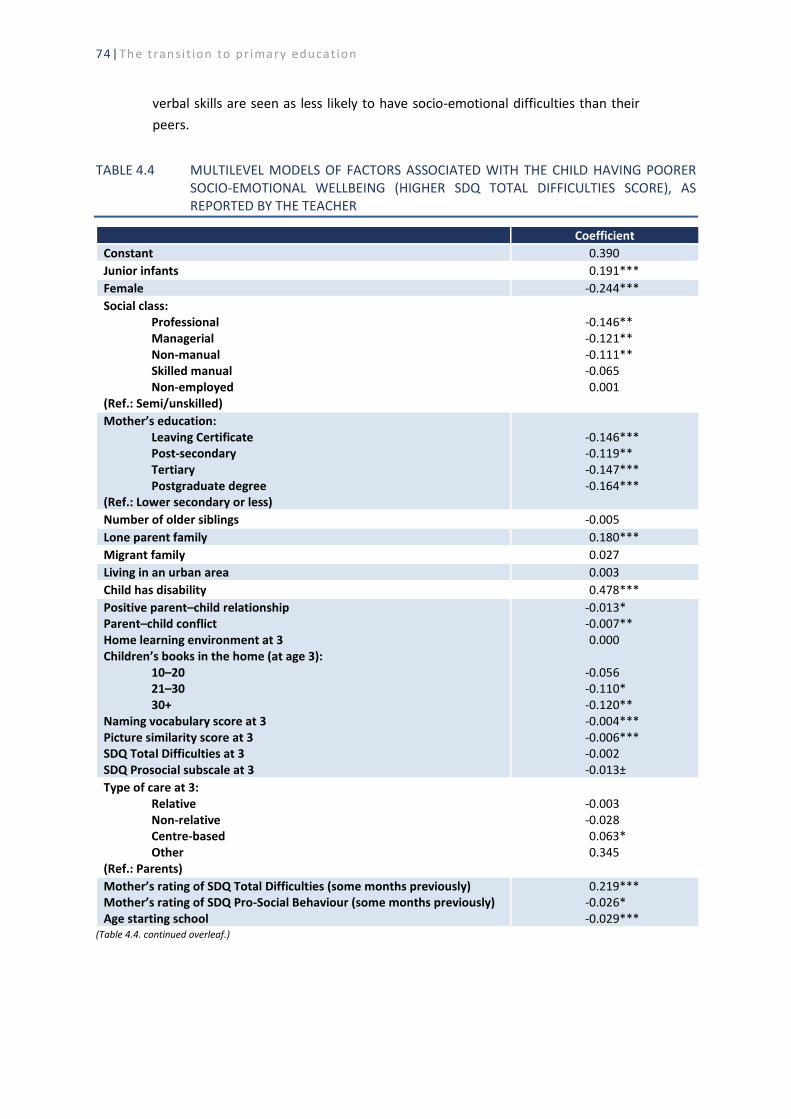
74|The t ransi t ion to pr imary educat ion
verbal skills are seen as less likely to have socio-emotional difficulties than their
peers.
TABLE 4.4 MULTILEVEL MODELS OF FACTORS ASSOCIATED WITH THE CHILD HAVING POORER SOCIO-EMOTIONAL WELLBEING (HIGHER SDQ TOTAL DIFFICULTIES SCORE), AS REPORTED BY THE TEACHER
Coefficient
Constant 0.390
Junior infants 0.191***
Female -0.244***
Social class: Professional Managerial Non-manual Skilled manual Non-employed
(Ref.: Semi/unskilled)
-0.146** -0.121** -0.111** -0.065 0.001
Mother’s education: Leaving Certificate Post-secondary Tertiary Postgraduate degree
(Ref.: Lower secondary or less)
-0.146*** -0.119** -0.147*** -0.164***
Number of older siblings -0.005
Lone parent family 0.180***
Migrant family 0.027
Living in an urban area 0.003
Child has disability 0.478***
Positive parent–child relationship Parent–child conflict Home learning environment at 3 Children’s books in the home (at age 3):
10–20 21–30 30+
Naming vocabulary score at 3 Picture similarity score at 3 SDQ Total Difficulties at 3 SDQ Prosocial subscale at 3
-0.013* -0.007** 0.000
-0.056 -0.110* -0.120** -0.004*** -0.006*** -0.002 -0.013±
Type of care at 3: Relative Non-relative Centre-based Other
(Ref.: Parents)
-0.003 -0.028 0.063* 0.345
Mother’s rating of SDQ Total Difficulties (some months previously) Mother’s rating of SDQ Pro-Social Behaviour (some months previously) Age starting school
0.219*** -0.026* -0.029***
(Table 4.4. continued overleaf.)

Children’s experiences of the transition to primary school|75
TABLE 4.4 (CONTINUED)
Coefficient
DEIS status: Urban Band 1 Urban Band 2 Rural DEIS
(Ref.: Non-DEIS) Gender mix:
Boys Girls (Ref.: Coed)
School size: 50–99 100–199 200–299 300–399 400–499 500+ (Ref.: <50)
-0.034 -0.020 -0.023
-0.166** 0.065
-0.025 -0.078 0.001
-0.011 0.041 0.007
Multi-grade class Class size:
20–24 25–29 30+
Male teacher Teacher experience:
3–5 years 5–10 years 10–15 years 15–20 years 20+ years (Ref.: <3 years)
-0.022
-0.036 -0.065± -0.048 -0.029
-0.018 0.019 0.010
-0.031 -0.021
Between-school variation Between-teacher variation Between-child variation
0.008 0.152*** 0.631***
Schools Teachers Children
2,278 4,145 8,326
Note: *** p<.001; ** p<.01; * p<.05; ± p<.10. Source: Growing Up in Ireland study.
TABLE 4.5 MULTILEVEL MODELS OF THE RELATIONSHIP BETWEEN TEACHER–CHILD RELATIONSHIP, VOCABULARY SKILLS AT AGE 5 AND THE CHILD HAVING POORER SOCIO-EMOTIONAL WELLBEING, AS REPORTED BY THE TEACHER
Coefficient
Teacher–child warmth Teacher–child conflict Naming vocabulary at age 5
-0.031*** 0.107***
-0.038***
Note: *** p<.001; ** p<.01; * p<.05; ± p<.10. Source: Growing Up in Ireland study.
Table 4.6 focuses on a more positive perspective, that of prosocial behaviour, that
is, positive behaviour towards peers and adults. Children in junior infant classes are
given slightly lower ratings of prosocial behaviour by their teachers than those in

76|The t ransi t ion to pr imary educat ion
senior infants, though the difference is very small. Girls are rated significantly more
highly than boys in this domain. In contrast to the pattern for socio-emotional
difficulties, there is little systematic variation by social class or maternal education,
though managerial and other non-manual groups are rated slightly more highly
than others. The children of lone parents are rated as having slightly less prosocial
behaviour by their teachers. A sizeable gap is evident in relation to the children of
immigrant families. As with socio-emotional difficulties, the largest gap emerges in
relation to children with disabilities.
There is very little variation in prosocial behaviour by preschool experiences,
though children with better verbal and non-verbal skills and those with more
positive relationships with their parents at age three have slightly higher ratings,
while those who have attended centre-based care have slightly lower ratings. Age
at starting school does not make a difference. Not surprisingly, a child’s mother’s
ratings of prosocial behaviour and socio-emotional difficulties some months
previously are predictive of teacher ratings. As with total difficulties, however, the
ratings are not very strongly associated; thus, children appear to act differently in
different settings and/or teachers and mothers use different benchmarks in
assessing child behaviour.
Before taking account of other factors, children attending urban DEIS schools have
lower levels of prosocial behaviour than those attending other schools (rural DEIS
or non-DEIS) (Figure 4.8), but these differences are much smaller than those found
in relation to socio-emotional difficulties. The differences by DEIS status are found
to relate to the more disadvantaged intake to the school. Boys attending single-sex
schools are reported to be more prosocial than boys in coeducational schools,
while girls in single-sex schools are deemed less prosocial. This appears to reflect
the fact that in these schools, the comparison is confined to one gender, whereby
boys are not being compared unfavourably to ‘sociable’ girls and vice versa. No
other school or classroom characteristics are associated with children’s prosocial
behaviour.
Teachers report more warmth and less conflict towards more prosocial children
(Table 4. 7) while ratings are slightly higher for children with better verbal skills.
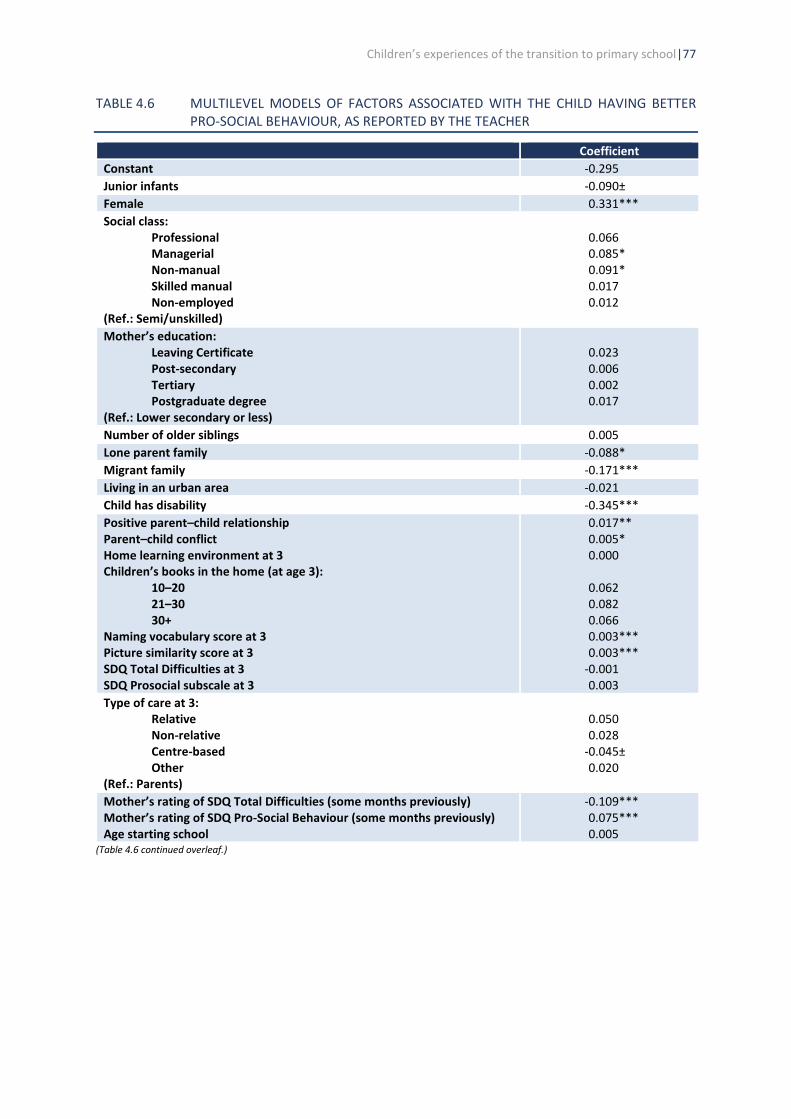
Children’s experiences of the transition to primary school|77
TABLE 4.6 MULTILEVEL MODELS OF FACTORS ASSOCIATED WITH THE CHILD HAVING BETTER PRO-SOCIAL BEHAVIOUR, AS REPORTED BY THE TEACHER
Coefficient
Constant -0.295
Junior infants -0.090±
Female 0.331***
Social class: Professional Managerial Non-manual Skilled manual Non-employed
(Ref.: Semi/unskilled)
0.066 0.085* 0.091* 0.017 0.012
Mother’s education: Leaving Certificate Post-secondary Tertiary Postgraduate degree
(Ref.: Lower secondary or less)
0.023 0.006 0.002 0.017
Number of older siblings 0.005
Lone parent family -0.088*
Migrant family -0.171***
Living in an urban area -0.021
Child has disability -0.345***
Positive parent–child relationship Parent–child conflict Home learning environment at 3 Children’s books in the home (at age 3):
10–20 21–30 30+
Naming vocabulary score at 3 Picture similarity score at 3 SDQ Total Difficulties at 3 SDQ Prosocial subscale at 3
0.017** 0.005* 0.000
0.062 0.082 0.066 0.003*** 0.003***
-0.001 0.003
Type of care at 3: Relative Non-relative Centre-based Other
(Ref.: Parents)
0.050 0.028
-0.045± 0.020
Mother’s rating of SDQ Total Difficulties (some months previously) Mother’s rating of SDQ Pro-Social Behaviour (some months previously) Age starting school
-0.109*** 0.075*** 0.005
(Table 4.6 continued overleaf.)

78|The t ransi t ion to pr imary educat ion
TABLE 4.6 (CONTINUED)
Coefficient
DEIS status: Urban Band 1 Urban Band 2 Rural DEIS
(Ref.: Non-DEIS) Gender mix:
Boys Girls (Ref.: Coed)
School size: 50–99 100–199 200–299 300–399 400–499 500+ (Ref.: <50)
0.022 0.036 0.086
0.183** -0.121*
0.082 0.089 0.018 0.036 0.037 0.027
Multi-grade class Class size:
20–24 25–29 30+
Male teacher Teacher experience:
3–5 years 5–10 years 10–15 years 15–20 years 20+ years (Ref.: <3 years)
0.059
0.026 0.037 0.036
-0.087
0.009 -0.053 0.020
-0.015 0.000
Between-school variation Between-teacher variation Between-child variation
0.000 0.210*** 0.663***
Schools Teachers Children
2,279 4,145 8,328
Note: *** p<.001; ** p<.01; * p<.05; ± p<.10. Source: Growing Up in Ireland study.
TABLE 4.7 MULTILEVEL MODELS OF THE RELATIONSHIP BETWEEN TEACHER–CHILD RELATIONSHIP, VOCABULARY SKILLS AT AGE 5 AND THE CHILD HAVING BETTER PRO-SOCIAL BEHAVIOUR, AS REPORTED BY THE TEACHER
Coefficient
Teacher–child warmth Teacher–child conflict Naming vocabulary at age 5
0.081*** -0.073*** 0.026**
Note: *** p<.001; ** p<.01; * p<.05; ± p<.10. Source: Growing Up in Ireland study.
4.6 TEACHER RATING OF CHILD SKILLS
The study collected detailed information from the teacher of each child on how
they were getting along in school. The items are a subset of those previously used
Children’s experiences of the transition to primary school|79
in the Millennium Cohort Study and are based on the Foundation Stage Profile in
England, thus providing a comparative benchmark. The five subscales relate to:
child disposition and attitudes; language for communication and thinking; linking
sounds and letters; reading; and numeracy.
4.6.1 Attitudes and disposition to school
The teacher was asked to give a yes/no response to each of the following items in
relation to the study child:
• shows an interest in classroom activities through observations or participation;
• dresses, undresses, and manages own personal hygiene with adult support;
• displays high levels of involvement in self-chosen activities;
• dresses and undresses independently and manages own personal hygiene;
• selects and uses activities and resources independently;
• continues to be interested, motivated and excited to learn;
• is confident to try new activities, initiate ideas, and to speak in a familiar group;
• maintains attention and concentration; and
• sustains involvement and perseveres, particularly when trying to solve a
problem or reach a satisfactory conclusion.
Figure 4.8 shows the proportion of five-year-olds for whom positive responses
were recorded by their teachers. Teachers report that the vast majority of children
are interested and involved in class activities, can manage their hygiene and
clothes independently, and are able to select new activities. However, around one-
quarter of five-year-olds are seen as not maintaining attention and sustained
involvement. An overall scale is derived, with each positive response counted as
one. On this scale, seven in ten children score an eight or nine, indicating high levels
of positive dispositions. The mean score across all children is 7.7, which is broadly
similar to that found in the UK (with scores ranging from 7.3 in England to 7.9 in
Northern Ireland) (see Hansen and Jones, 2008). Because of the high scores overall,
the analysis focuses on those children who receive lower scores (seven or below);
the junior and senior infants classes are pooled because of the relatively small
numbers in the group of children with low scores.

80|The t ransi t ion to pr imary educat ion
FIGURE 4.8 CHILD ATTITUDES AND DISPOSITION TO SCHOOL, AS REPORTED BY THE TEACHER
Source: Growing Up in Ireland study.
Table 4.8 presents a multilevel model that looks at the relationship between child,
family, school and teacher characteristics and the likelihood of children falling into
this more negative attitudes group (that is, those with scores of seven or below).
The results are presented in terms of odds ratios. Coefficients below one mean that
the characteristic is associated with a lower likelihood of having negative attitudes,
while coefficients larger than one indicate a greater tendency to hold negative
attitudes. Children in junior infants are seen as 1.2 times more likely to fall into the
group of children who have more negative dispositions in relation to school. This
pattern is perhaps not surprising, given that junior infant groups have had less time
to adapt to the necessity of maintaining concentration and involvement in the
classroom setting. Boys are significantly more likely to fall into this group than girls.
A social gradient is also evident, with children from working-class, non-employed
and/or less educated families more likely to have poorer levels of interest or
engagement. Children from immigrant families are more likely overall to fall into
this group but this is due to differences in language skills, namely, their lower
naming vocabulary at three years of age. The largest single difference is found in
relation to children with a disability, who are almost three times as likely as their
peers to be negatively disposed to school at this early stage.
Children who have more negative dispositions to school have lower verbal and
non-verbal test scores, and are more likely to have had socio-emotional difficulties,
a less positive relationship with their parents and a less stimulating home
environment at three years. The type of childcare experienced at the age of three
is not associated with later dispositions to school but those who are older on school
entry are less likely to have negative attitudes to school.
0 10 20 30 40 50 60 70 80 90 100
Sustains involvement
Maintains attention
Dresses/hygiene with support
Confident to try new activities
Continues to be interested
Selects activities independently
High levels of involvement
Dresses/hygiene independently
Interest in activities
%
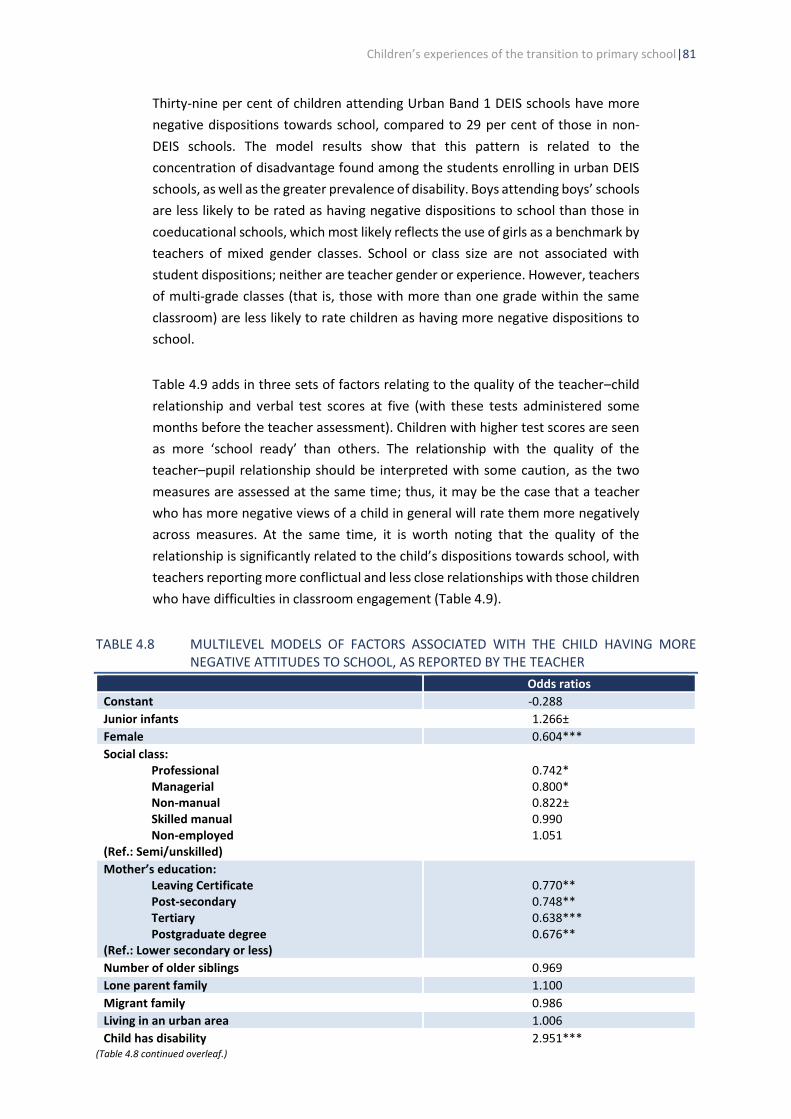
Children’s experiences of the transition to primary school|81
Thirty-nine per cent of children attending Urban Band 1 DEIS schools have more
negative dispositions towards school, compared to 29 per cent of those in non-
DEIS schools. The model results show that this pattern is related to the
concentration of disadvantage found among the students enrolling in urban DEIS
schools, as well as the greater prevalence of disability. Boys attending boys’ schools
are less likely to be rated as having negative dispositions to school than those in
coeducational schools, which most likely reflects the use of girls as a benchmark by
teachers of mixed gender classes. School or class size are not associated with
student dispositions; neither are teacher gender or experience. However, teachers
of multi-grade classes (that is, those with more than one grade within the same
classroom) are less likely to rate children as having more negative dispositions to
school.
Table 4.9 adds in three sets of factors relating to the quality of the teacher–child
relationship and verbal test scores at five (with these tests administered some
months before the teacher assessment). Children with higher test scores are seen
as more ‘school ready’ than others. The relationship with the quality of the
teacher–pupil relationship should be interpreted with some caution, as the two
measures are assessed at the same time; thus, it may be the case that a teacher
who has more negative views of a child in general will rate them more negatively
across measures. At the same time, it is worth noting that the quality of the
relationship is significantly related to the child’s dispositions towards school, with
teachers reporting more conflictual and less close relationships with those children
who have difficulties in classroom engagement (Table 4.9).
TABLE 4.8 MULTILEVEL MODELS OF FACTORS ASSOCIATED WITH THE CHILD HAVING MORE NEGATIVE ATTITUDES TO SCHOOL, AS REPORTED BY THE TEACHER
Odds ratios
Constant -0.288
Junior infants 1.266±
Female 0.604***
Social class: Professional Managerial Non-manual Skilled manual Non-employed
(Ref.: Semi/unskilled)
0.742* 0.800* 0.822± 0.990 1.051
Mother’s education: Leaving Certificate Post-secondary Tertiary Postgraduate degree
(Ref.: Lower secondary or less)
0.770** 0.748** 0.638*** 0.676**
Number of older siblings 0.969
Lone parent family 1.100
Migrant family 0.986
Living in an urban area 1.006
Child has disability 2.951*** (Table 4.8 continued overleaf.)
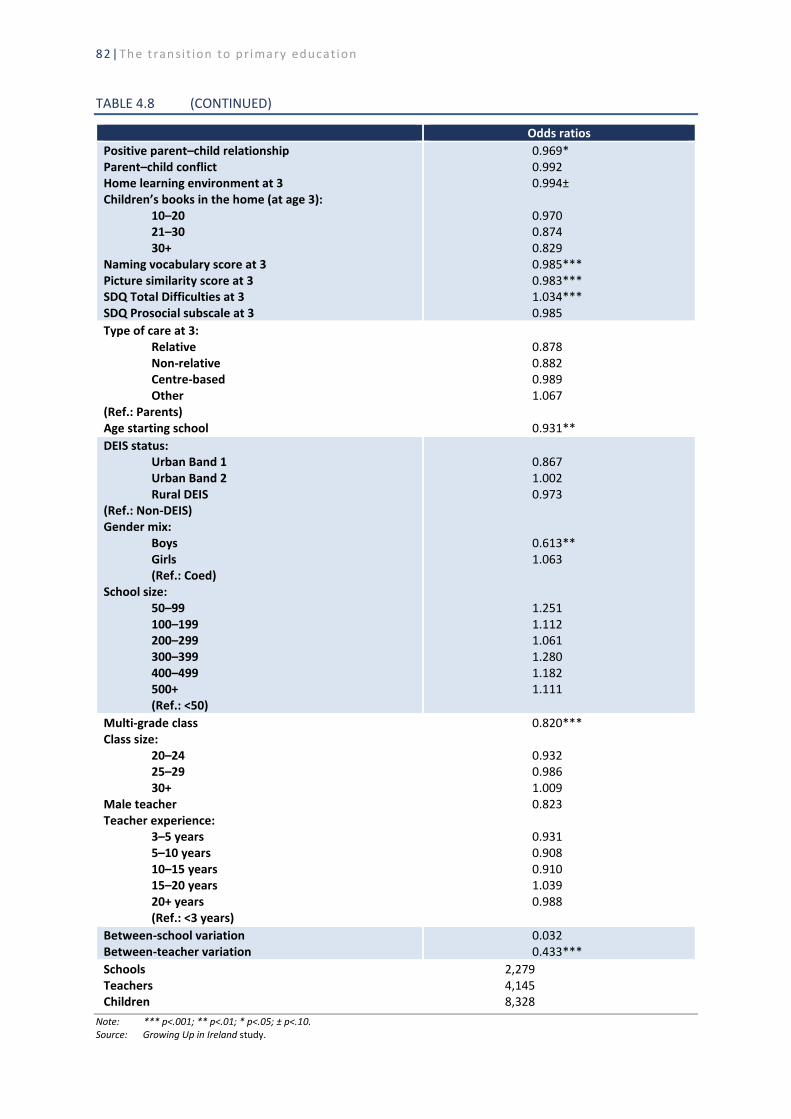
82|The t ransi t ion to pr imary educat ion
TABLE 4.8 (CONTINUED)
Odds ratios
Positive parent–child relationship Parent–child conflict Home learning environment at 3 Children’s books in the home (at age 3):
10–20 21–30 30+
Naming vocabulary score at 3 Picture similarity score at 3 SDQ Total Difficulties at 3 SDQ Prosocial subscale at 3
0.969* 0.992 0.994±
0.970 0.874 0.829 0.985*** 0.983*** 1.034*** 0.985
Type of care at 3: Relative Non-relative Centre-based Other
(Ref.: Parents) Age starting school
0.878 0.882 0.989 1.067
0.931**
DEIS status: Urban Band 1 Urban Band 2 Rural DEIS
(Ref.: Non-DEIS) Gender mix:
Boys Girls (Ref.: Coed)
School size: 50–99 100–199 200–299 300–399 400–499 500+ (Ref.: <50)
0.867 1.002 0.973
0.613** 1.063
1.251 1.112 1.061 1.280 1.182 1.111
Multi-grade class Class size:
20–24 25–29 30+
Male teacher Teacher experience:
3–5 years 5–10 years 10–15 years 15–20 years 20+ years (Ref.: <3 years)
0.820***
0.932 0.986 1.009 0.823
0.931 0.908 0.910 1.039 0.988
Between-school variation Between-teacher variation
0.032 0.433***
Schools Teachers Children
2,279 4,145 8,328
Note: *** p<.001; ** p<.01; * p<.05; ± p<.10. Source: Growing Up in Ireland study.
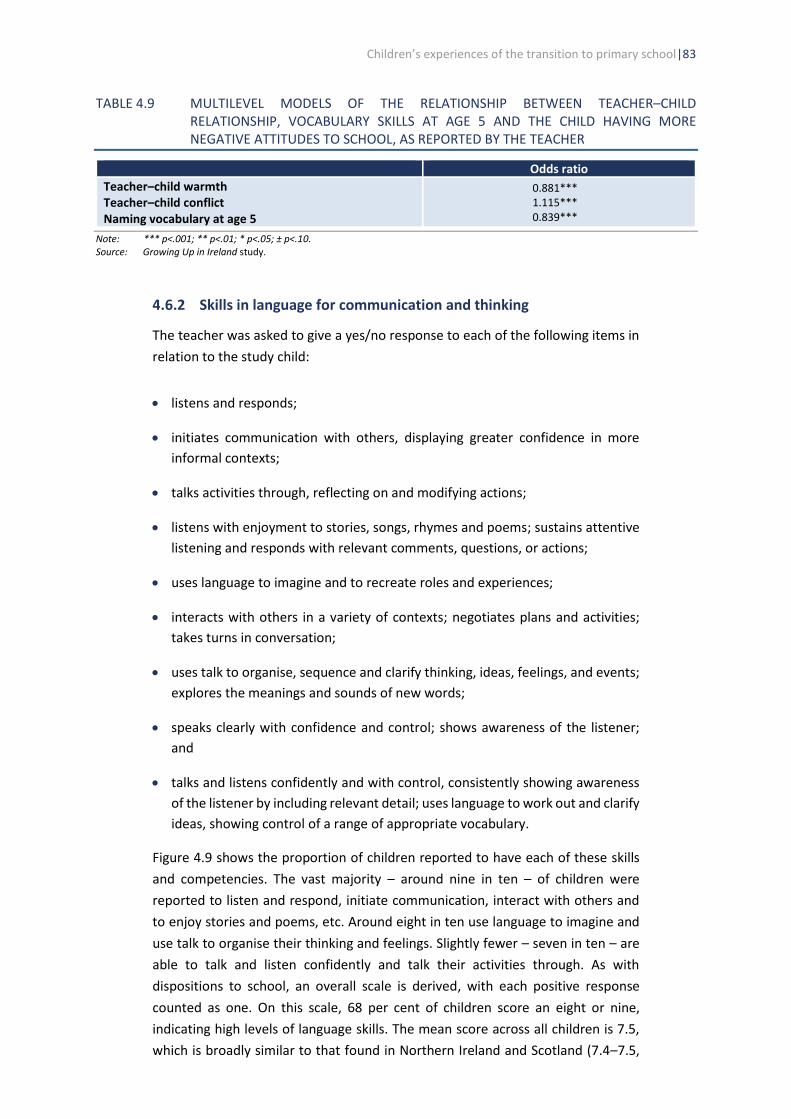
Children’s experiences of the transition to primary school|83
TABLE 4.9 MULTILEVEL MODELS OF THE RELATIONSHIP BETWEEN TEACHER–CHILD RELATIONSHIP, VOCABULARY SKILLS AT AGE 5 AND THE CHILD HAVING MORE NEGATIVE ATTITUDES TO SCHOOL, AS REPORTED BY THE TEACHER
Odds ratio
Teacher–child warmth Teacher–child conflict Naming vocabulary at age 5
0.881*** 1.115*** 0.839***
Note: *** p<.001; ** p<.01; * p<.05; ± p<.10. Source: Growing Up in Ireland study.
4.6.2 Skills in language for communication and thinking
The teacher was asked to give a yes/no response to each of the following items in
relation to the study child:
• listens and responds;
• initiates communication with others, displaying greater confidence in more
informal contexts;
• talks activities through, reflecting on and modifying actions;
• listens with enjoyment to stories, songs, rhymes and poems; sustains attentive
listening and responds with relevant comments, questions, or actions;
• uses language to imagine and to recreate roles and experiences;
• interacts with others in a variety of contexts; negotiates plans and activities;
takes turns in conversation;
• uses talk to organise, sequence and clarify thinking, ideas, feelings, and events;
explores the meanings and sounds of new words;
• speaks clearly with confidence and control; shows awareness of the listener;
and
• talks and listens confidently and with control, consistently showing awareness
of the listener by including relevant detail; uses language to work out and clarify
ideas, showing control of a range of appropriate vocabulary.
Figure 4.9 shows the proportion of children reported to have each of these skills
and competencies. The vast majority – around nine in ten – of children were
reported to listen and respond, initiate communication, interact with others and
to enjoy stories and poems, etc. Around eight in ten use language to imagine and
use talk to organise their thinking and feelings. Slightly fewer – seven in ten – are
able to talk and listen confidently and talk their activities through. As with
dispositions to school, an overall scale is derived, with each positive response
counted as one. On this scale, 68 per cent of children score an eight or nine,
indicating high levels of language skills. The mean score across all children is 7.5,
which is broadly similar to that found in Northern Ireland and Scotland (7.4–7.5,
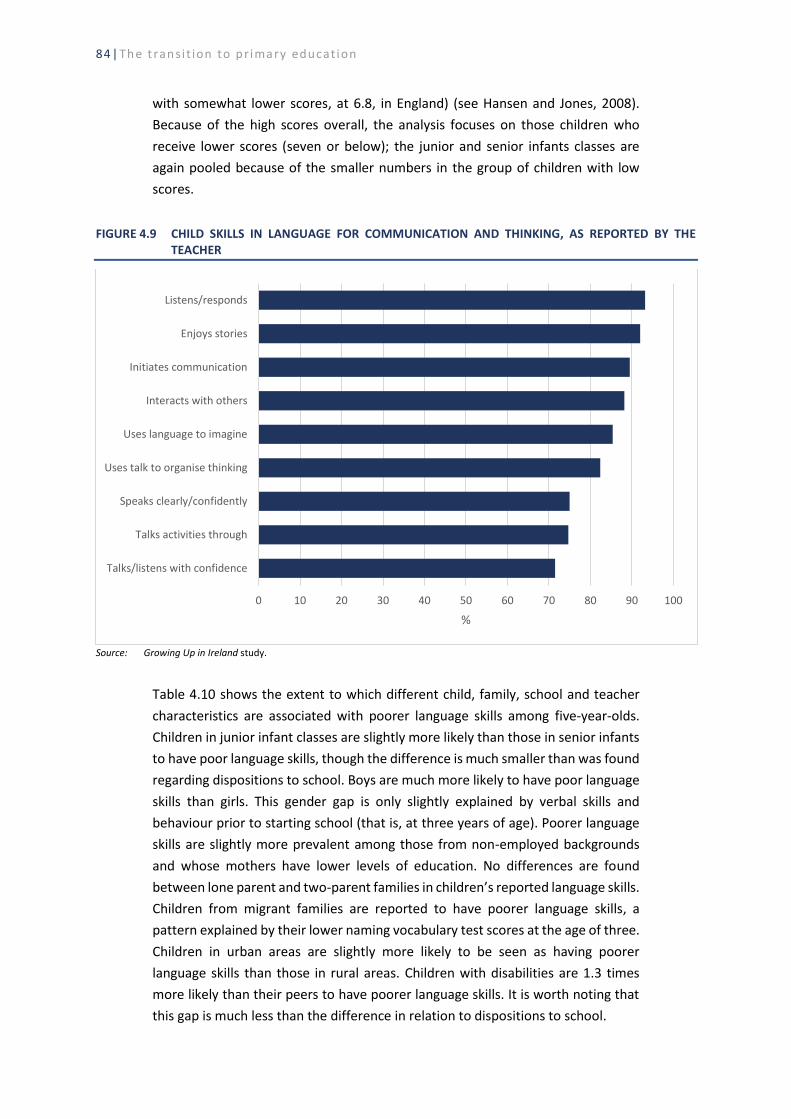
84|The t ransi t ion to pr imary educat ion
with somewhat lower scores, at 6.8, in England) (see Hansen and Jones, 2008).
Because of the high scores overall, the analysis focuses on those children who
receive lower scores (seven or below); the junior and senior infants classes are
again pooled because of the smaller numbers in the group of children with low
scores.
FIGURE 4.9 CHILD SKILLS IN LANGUAGE FOR COMMUNICATION AND THINKING, AS REPORTED BY THE TEACHER
Source: Growing Up in Ireland study.
Table 4.10 shows the extent to which different child, family, school and teacher
characteristics are associated with poorer language skills among five-year-olds.
Children in junior infant classes are slightly more likely than those in senior infants
to have poor language skills, though the difference is much smaller than was found
regarding dispositions to school. Boys are much more likely to have poor language
skills than girls. This gender gap is only slightly explained by verbal skills and
behaviour prior to starting school (that is, at three years of age). Poorer language
skills are slightly more prevalent among those from non-employed backgrounds
and whose mothers have lower levels of education. No differences are found
between lone parent and two-parent families in children’s reported language skills.
Children from migrant families are reported to have poorer language skills, a
pattern explained by their lower naming vocabulary test scores at the age of three.
Children in urban areas are slightly more likely to be seen as having poorer
language skills than those in rural areas. Children with disabilities are 1.3 times
more likely than their peers to have poorer language skills. It is worth noting that
this gap is much less than the difference in relation to dispositions to school.
0 10 20 30 40 50 60 70 80 90 100
Talks/listens with confidence
Talks activities through
Speaks clearly/confidently
Uses talk to organise thinking
Uses language to imagine
Interacts with others
Initiates communication
Enjoys stories
Listens/responds
%

Children’s experiences of the transition to primary school|85
TABLE 4.10 MULTILEVEL MODELS OF FACTORS ASSOCIATED WITH THE CHILD HAVING POORER LANGUAGE SKILLS, AS REPORTED BY THE TEACHER
Odds ratios
Constant 1.451
Junior infants 1.075*
Female 0.931***
Social class: Professional Managerial Non-manual Skilled manual Non-employed
(Ref.: Semi/unskilled)
0.948± 0.937* 0.918* 0.969 1.065*
Mother’s education: Leaving Certificate Post-secondary Tertiary Postgraduate degree
(Ref.: Lower secondary or less)
0.952* 0.999 0.936** 0.952
Number of older siblings 1.004
Lone parent family 0.976
Migrant family 1.035
Living in an urban area 1.030±
Child has disability 1.285***
Positive parent–child relationship Parent–child conflict Home learning environment at 3 Children’s books in the home (at age 3):
10–20 21–30 30+
Naming vocabulary score at 3 Picture similarity score at 3 SDQ Total Difficulties at 3 SDQ Prosocial subscale at 3
0.986*** 0.998 1.000
1.025 1.004 1.005 0.994*** 0.997*** 1.005* 1.000
Type of care at 3: Relative Non-relative Centre-based Other
(Ref.: Parents) Age starting school
0.954* 0.961± 0.979 1.008
0.990***
(Table 4.10 continued overleaf.)

86|The t ransi t ion to pr imary educat ion
TABLE 4.10 (CONTINUED)
Odds ratios
DEIS status: Urban Band 1 Urban Band 2 Rural DEIS
(Ref.: Non-DEIS) Gender mix:
Boys Girls (Ref.: Coed)
School size: 50–99 100–199 200–299 300–399 400–499 500+ (Ref.: <50)
1.013 1.010 1.008
0.920* 1.048
1.052 1.037 1.031 1.028 1.061 1.057
Multi-grade class Class size:
20–24 25–29 30+
Male teacher Teacher experience:
3–5 years 5–10 years 10–15 years 15–20 years 20+ years (Ref.: <3 years)
1.002
0.989 0.984 0.997 1.054
1.015 1.021 1.000 1.033 1.036
Between-school variation Between-teacher variation
0.001 0.191***
Schools Teachers Children
2,279 4,142 8,315
Note: *** p<.001; ** p<.01; * p<.05; ± p<.10. Source: Growing Up in Ireland study.
TABLE 4.11 MULTILEVEL MODELS OF THE RELATIONSHIP BETWEEN TEACHER–CHILD RELATIONSHIP, VOCABULARY SKILLS AT AGE 5 AND THE CHILD HAVING POORER LANGUAGE SKILLS, AS REPORTED BY THE TEACHER
Odds ratio
Teacher–child warmth Teacher–child conflict Naming vocabulary at age 5
0.969***
1.009***
0.990
Note: *** p<.001; ** p<.01; * p<.05; ± p<.10. Source: Growing Up in Ireland study.
Children who have a more positive relationship with their parents at age three are
less likely to have poor language skills two years later. The home learning
environment or number of books in the home does not have a direct effect on later
language skills but the home learning environment has an indirect effect through

Children’s experiences of the transition to primary school|87
early vocabulary skills. Children who have better vocabulary and non-verbal skills
at the age of three are less likely to have poor language skills two years later. Those
who have greater socio-emotional difficulties at three years tend to have slightly
poorer language skills at five years. Children who are cared for by a relative at the
age of three are less likely to have poor language skills later as, to some extent, are
those cared for by a non-relative when compared to those cared for by their
parents. Patterns for those who attend centre-based care are similar to those who
are cared for by their parents. Children who are older on starting school tend to
have somewhat better language skills.
Overall, 44 per cent of children attending DEIS Urban Band 1 schools are reported
to have poorer language skills, compared to 36 per cent of those in Urban Band 2
schools and 31 per cent in rural DEIS and non-DEIS schools. Table 4.5 shows no net
difference by DEIS status when other family and child characteristics are taken into
account. In other words, children in urban DEIS schools are reported to have poorer
language skills because they are more likely to come from non-employed or less
educated families and they are more likely to have a disability. Boys attending
single-sex schools are less likely to have poorer language skills; as with dispositions
to school, this may relate to the absence of girls as a reference group in these
schools. There is no variation by school size, classroom or teacher characteristics
in the prevalence of children having poorer language skills, all else being equal,
although there is some variation between individual teachers in the proportion
who report that children have poorer language skills.
Table 4.11 adds in the quality of the teacher–child relationship and the child’s
naming vocabulary test scores from several months previously. As with
dispositions to school, children with whom the teacher reports a positive
relationship are less likely (and those with a conflictual relationships more likely)
to be described as having poorer language skills by teachers. The gender gap in
perceived language skills is no longer significant when the quality of the teacher–
child relationship is taken into account. Somewhat surprisingly, naming vocabulary
test scores at age five are not significantly associated with perceived language
skills. This appears to be related to the mix of test scores found among those
characterised as having poorer language skills. Additional analyses (not shown
here) suggest a linear and significant relationship between naming vocabulary test
scores at five and language skills scores, as reported by the teacher.
4.6.3 Skills in linking sounds and letters
The teacher was asked to give a yes/no response to each of the following items in
relation to the study child:
• joins in rhyming and rhythmic activities;
• shows an awareness of rhyme and alliteration;

88|The t ransi t ion to pr imary educat ion
• links some sounds to letters;
• links sounds to letters, naming and sounding letters of the alphabet;
• hears and says initial and final sounds in words;
• hears and says vowel sounds within sounds;
• uses phonic knowledge to read simple and regular words;
• attempts to read more complex words, using phonic knowledge; and
• uses knowledge of letters, sounds and words when reading and writing
independently.
Figure 4.10 shows the proportion of children reported to have each of these skills
and competencies. The vast majority – around nine in ten – of children were
reported to link some sounds to letters, join in rhyming and to sound letters of the
alphabet. Awareness of rhyme, saying the initial and final sounds in words and
reading some simple words were reported for about four-fifths of children.
Sounding vowel sounds, reading more complex words and using the knowledge of
sounds independently were reported for fewer children but nonetheless were
evident for around seven in ten five-year-olds. As above, an overall scale is derived
with each positive response counted as one. The mean score across all children is
7.6, which is slightly higher than scores reported in the UK (where scores varied
from 6.2 in England to 7.5 in Scotland) (see Hansen and Jones, 2008). Because
children in junior infant classes differ markedly in their patterns to those in senior
infant classes (with a score of 6.6 compared with 8.1 respectively), the factors
influencing their skills are modelled separately in Table 4.8.
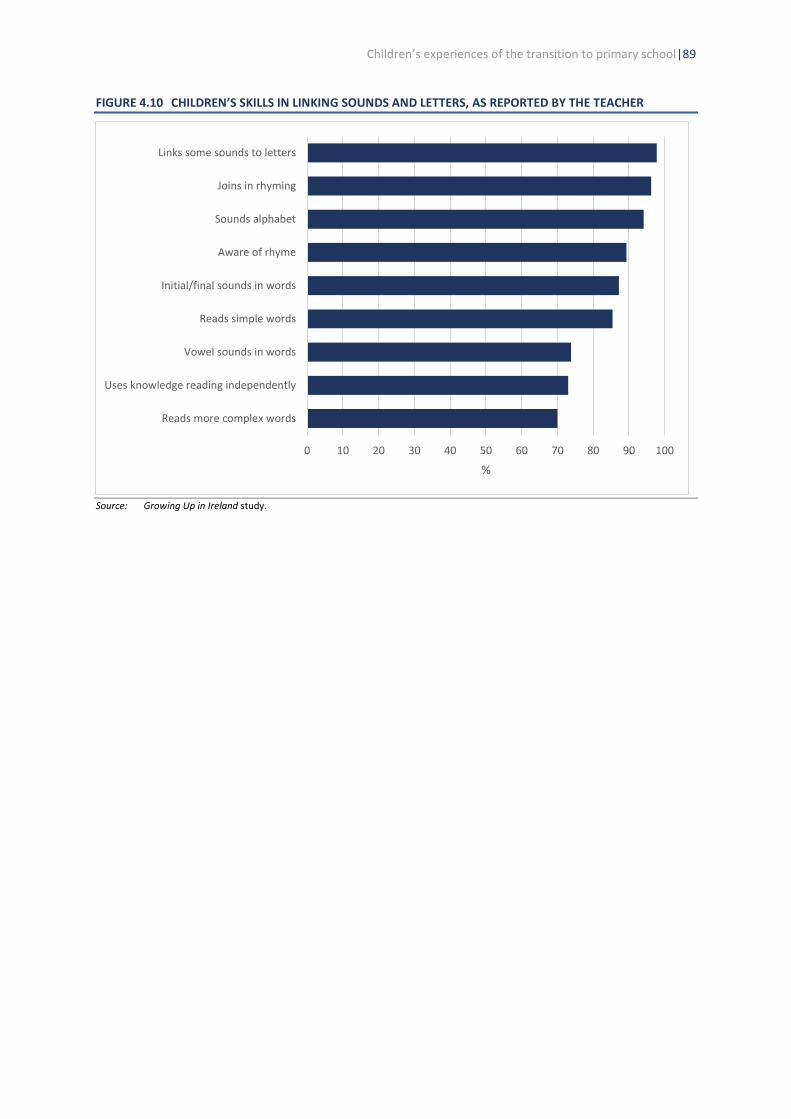
Children’s experiences of the transition to primary school|89
FIGURE 4.10 CHILDREN’S SKILLS IN LINKING SOUNDS AND LETTERS, AS REPORTED BY THE TEACHER
Source: Growing Up in Ireland study.
0 10 20 30 40 50 60 70 80 90 100
Reads more complex words
Uses knowledge reading independently
Vowel sounds in words
Reads simple words
Initial/final sounds in words
Aware of rhyme
Sounds alphabet
Joins in rhyming
Links some sounds to letters
%

90|The t ransi t ion to pr imary educat ion
TABLE 4.12 MULTILEVEL MODELS OF FACTORS ASSOCIATED WITH THE CHILD’S SKILLS IN LINKING SOUNDS AND LETTERS, AS REPORTED BY THE TEACHER
Junior infants Senior infants
Constant -0.650 -0.265
Female 0.117** 0.093***
Social class: Professional Managerial Non-manual Skilled manual Non-employed
(Ref.: Semi/unskilled)
0.000 -0.002 -0.030 -0.022 -0.090
0.168*** 0.119** 0.102* 0.081±
-0.101*
Mother’s education: Leaving Certificate Post-secondary Tertiary Postgraduate degree
(Ref.: Lower secondary or less)
0.053 0.153± 0.173* 0.177*
0.174*** 0.128** 0.234*** 0.191***
Number of older siblings 0.004 -0.053***
Lone parent family -0.199** 0.009
Migrant family -0.015 0.050
Living in an urban area -0.120* -0.006
Child has disability -0.600*** -0.339***
Positive parent–child relationship Parent–child conflict Home learning environment at 3 Children’s books in the home (at age 3):
10–20 21–30 30+
Naming vocabulary score at 3 Picture similarity score at 3 SDQ Total Difficulties at 3 SDQ Prosocial subscale at 3
-0.002 0.004 0.004
0.082 0.134 0.158 0.009*** 0.007***
-0.021*** -0.023*
0.007 0.002 0.004**
0.085± 0.143*** 0.176*** 0.007*** 0.004**
-0.008** -0.003
Type of care at 3: Relative Non-relative Centre-based Other
(Ref.: Parents) Age starting school
-0.013 0.059 0.059 0.994±
0.001
0.051 0.036 0.055*
-1.442**
0.011***
DEIS status: Urban Band 1 Urban Band 2 Rural DEIS
(Ref.: Non-DEIS) Gender mix:
Boys Girls (Ref.: Coed)
School size: 50–99 100–199 200–299 300–399 400–499 500+ (Ref.: <50)
-0.130 0.024 0.018
0.242± -0.028
-0.158 0.074 0.024 0.020
-0.068 -0.053
0.105± 0.022 0.004
0.075 -0.060
-0.044 -0.054 -0.073 -0.059 -0.097 -0.053
(Table 4.12 continued overleaf.)

Children’s experiences of the transition to primary school|91
TABLE 4.12 (CONTINUED)
Junior infants Senior infants
Multi-grade class Class size:
20–24 25–29 30+
Male teacher Teacher experience:
3–5 years 5–10 years 10–15 years 15–20 years 20+ years (Ref.: <3 years)
0.036
0.104 0.181* 0.151 0.189
-0.185± -0.106 -0.212± -0.169 -0.257*
0.092*
0.020 0.074± 0.043 0.042
0.042 0.024 0.041
-0.013 0.006
Between-school variation Between-teacher variation Between-child variation
0.256*** 0.287*** 0.485***
0.020± 0.086*** 0.482***
Schools Teachers Children
1,371 1,680 2,561
1,951 2,702 5,689
Note: *** p<.001; ** p<.01; * p<.05; ± p<.10. Source: Growing Up in Ireland study.
TABLE 4.13 MULTILEVEL MODELS OF THE RELATIONSHIP BETWEEN TEACHER–CHILD RELATIONSHIP, VOCABULARY SKILLS AT AGE 5 AND THE CHILD’S SKILLS IN LINKING SOUNDS AND LETTERS, AS REPORTED BY THE TEACHER
Junior infants Senior infants
Teacher–child warmth Teacher–child conflict Naming vocabulary at age 5
0.041*** -0.007 0.165***
0.022*** -0.014*** 0.070**
Note: *** p<.001; ** p<.01; * p<.05; ± p<.10. Source: Growing Up in Ireland study.
As with dispositions and language skills, girls are rated more positively than boys
by their teachers (Table 4.12). The patterns for the influence of social class
background differ between junior and senior infants. This may be because some
family influences are more evident among school entrants, while school
experiences will also have influenced outcomes by the time children are in senior
infants. Among the larger senior infants group, the highest scores are found among
those from professional/managerial families and the lowest scores are evident
among the non-employed group. In addition, among senior infants, those with
more older siblings have slightly lower scores. The children of more highly qualified
mothers achieve higher scores in both class groups. Among junior infants only,
lower scores are found among those from lone parent families and those living in
urban areas. Skills in linking sounds and letters are poorer among children with
disabilities; the size of the gap is larger among junior infants, most likely reflecting
the fact that parents of children with more severe impairments may wait until they
are older to send them to school (see Chapter 2).

92|The t ransi t ion to pr imary educat ion
Children who have more exposure to books in the home and a more positive home
learning environment at the age of three have better skills in linking sounds and
letters at five years of age.18 Children who have better verbal and non-verbal skills
at the age of three also have higher scores at five years, while scores are lower
among those who have socio-emotional difficulties at three. There are few
consistent differences by type of care at three but those who are in centre-based
care at three years have slightly higher scores later (though significantly so only for
senior infants). Being older starting school is associated with higher scores among
senior infants.
FIGURE 4.11 CHILDREN’S SKILLS IN LINKING SOUNDS AND LETTERS BY DEIS STATUS OF THE SCHOOL AND CLASS LEVEL
Source: Growing Up in Ireland study.
Figure 4.11 shows the raw differences in skills in linking sounds and letters by DEIS
status of the school. At both junior and senior infant levels, the lowest scores are
found among those in the most disadvantaged schools, Urban Band 1, with the
highest scores in rural DEIS and non-DEIS schools. The gap in scores is less at senior
infants level, suggesting that school-based learning has supported children in DEIS
schools in attaining skills that were already developed on school entry among some
of those in rural DEIS and non-disadvantaged schools. This interpretation is
supported by the fact that children attending Urban Band 1 DEIS schools achieve
slightly higher scores than might be expected given their disadvantaged profile
(Table 4.8), a pattern that is likely to reflect the strong emphasis on literacy in these
18 The pattern is similar for junior and senior infants but not statistically significant for the former, most likely reflecting
the smaller size of this group.
0
1
2
3
4
5
6
7
8
9
UB1 UB2 Rural Non-DEIS
Junior infants Senior infants

Children’s experiences of the transition to primary school|93
schools. There are no consistent differences in scores by the gender mix or size of
the school. Similarly, there is little consistent variation by classroom or teacher
characteristics, with slightly higher ratings of children’s skills in multi-grade classes.
Not surprisingly, naming vocabulary test scores are predictive of skills in linking
sounds and letters several months later. This relationship is stronger for the junior
infants group, again suggesting the importance of exposure to school in shaping
these skills among senior infants. Teachers with warmer relationships with children
report better skills among five-year-olds, while conflictual relationships are
associated with lower ratings. The quality of the relationship between teacher and
child accounts for around half of the initial gender gap in skills.
4.6.4 Skills in reading
Teachers were asked to give a yes/no response to each of the following items in
relation to the study child:
• is developing an interest in books;
• knows that print conveys meaning;
• recognises a few familiar words;
• knows that, in English or Irish, print is read from left to right and top to bottom;
• shows an understanding of the elements of stories, such as main character,
sequence of events, and openings;
• reads a range of familiar and common words and simple sentences
independently;
• retells narratives in the correct sequence, drawing on language patterns of
stories;
• shows an understanding of how information can be found in non-fiction texts
to answer questions about where, who, why and how; and
• reads books of own choice with some fluency and accuracy.
Figure 4.12 shows the proportion of children reported to have each of these
reading skills. The vast majority have an interest in books and understand the
nature of story and text, as well as being able to recognise a few words. Around
four-fifths of children can retell a story narrative, while three-quarters can read
some words independently. Just over half are described as reading books fluently
and as understanding how to access information in non-fiction texts. As above, an
overall scale is derived, with each positive response counted as one. The mean
score across all children is 7.5, which is comparable to scores reported in Northern
Ireland and Scotland (see Hansen and Jones, 2008). Because children in junior
infant classes differed in their patterns to those in senior infant classes (with a
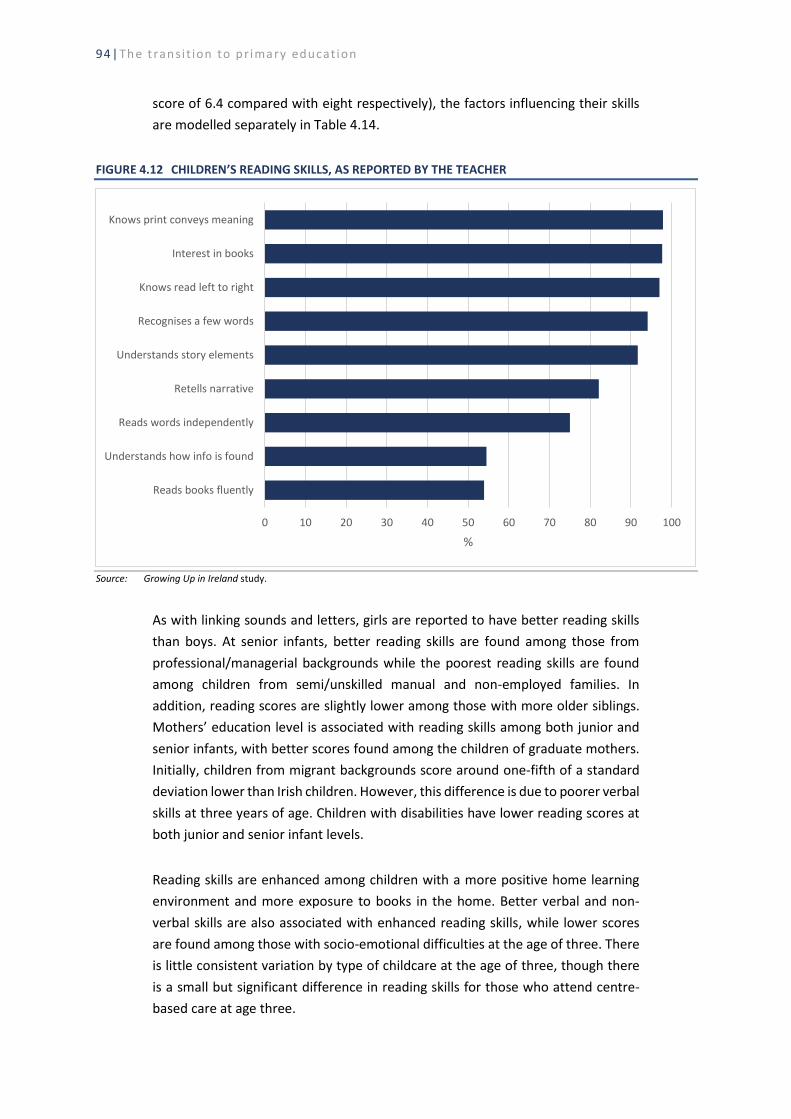
94|The t ransi t ion to pr imary educat ion
score of 6.4 compared with eight respectively), the factors influencing their skills
are modelled separately in Table 4.14.
FIGURE 4.12 CHILDREN’S READING SKILLS, AS REPORTED BY THE TEACHER
Source: Growing Up in Ireland study.
As with linking sounds and letters, girls are reported to have better reading skills
than boys. At senior infants, better reading skills are found among those from
professional/managerial backgrounds while the poorest reading skills are found
among children from semi/unskilled manual and non-employed families. In
addition, reading scores are slightly lower among those with more older siblings.
Mothers’ education level is associated with reading skills among both junior and
senior infants, with better scores found among the children of graduate mothers.
Initially, children from migrant backgrounds score around one-fifth of a standard
deviation lower than Irish children. However, this difference is due to poorer verbal
skills at three years of age. Children with disabilities have lower reading scores at
both junior and senior infant levels.
Reading skills are enhanced among children with a more positive home learning
environment and more exposure to books in the home. Better verbal and non-
verbal skills are also associated with enhanced reading skills, while lower scores
are found among those with socio-emotional difficulties at the age of three. There
is little consistent variation by type of childcare at the age of three, though there
is a small but significant difference in reading skills for those who attend centre-
based care at age three.
0 10 20 30 40 50 60 70 80 90 100
Reads books fluently
Understands how info is found
Reads words independently
Retells narrative
Understands story elements
Recognises a few words
Knows read left to right
Interest in books
Knows print conveys meaning
%

Children’s experiences of the transition to primary school|95
FIGURE 4.13 CHILDREN’S READING SKILLS BY DEIS STATUS OF THE SCHOOL AND CLASS LEVEL
Source: Growing Up in Ireland study.
Raw differences are evident in reading skills by the DEIS status of the school, with
lower scores in Urban Band 1 schools and higher scores in non-DEIS and rural DEIS
schools (Figure 4.13). As with linking sounds and letters, the gap is slightly greater
among junior infant classes. Taking account of social background and child
characteristics before school entry, no net variation is found by DEIS status.
Similarly, reading scores do not vary by the gender mix of the school or by school
size. Multi-grade teachers tend to report better reading skills among their
students, especially at senior infants levels. This may reflect more emphasis on
formal teaching and less emphasis on play-based learning in these classes (see
Chapter 3). The pattern by class size is not consistent so the positive coefficient for
large junior infant classes seems to reflect a correlation with other variables. There
are inconsistencies too in the pattern by teacher experience, though the most
experienced teachers tend to report poorer reading skills among their five-year-
old pupils.
As with other skills and competencies, better reading skills are reported for
children who have warmer and less conflictual relationships with their teachers.
Not surprisingly, verbal test scores are significantly related to reading skills some
months after the tests have been carried out (Table 4.15).
0
1
2
3
4
5
6
7
8
9
UB1 UB2 Rural Non-DEIS
Junior infants Senior infants
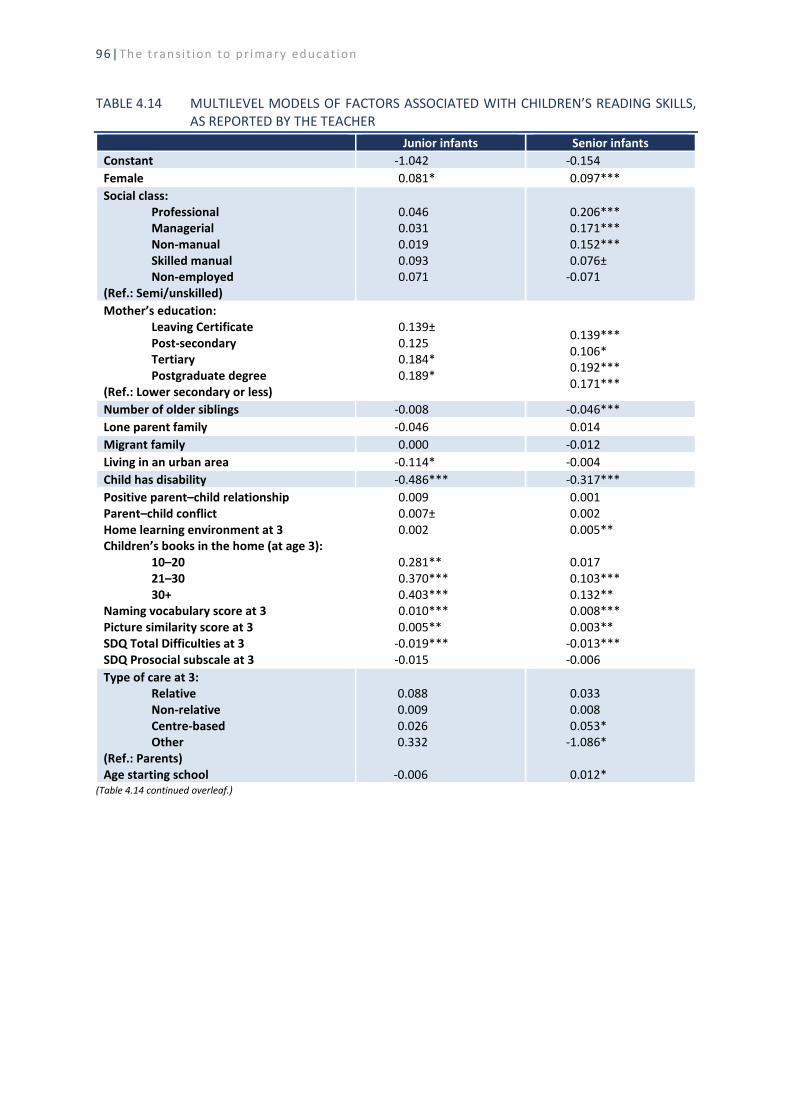
96|The t ransi t ion to pr imary educat ion
TABLE 4.14 MULTILEVEL MODELS OF FACTORS ASSOCIATED WITH CHILDREN’S READING SKILLS, AS REPORTED BY THE TEACHER
Junior infants Senior infants
Constant -1.042 -0.154
Female 0.081* 0.097***
Social class: Professional Managerial Non-manual Skilled manual Non-employed
(Ref.: Semi/unskilled)
0.046 0.031 0.019 0.093 0.071
0.206*** 0.171*** 0.152*** 0.076±
-0.071
Mother’s education: Leaving Certificate Post-secondary Tertiary Postgraduate degree
(Ref.: Lower secondary or less)
0.139± 0.125 0.184* 0.189*
0.139*** 0.106* 0.192*** 0.171***
Number of older siblings -0.008 -0.046***
Lone parent family -0.046 0.014
Migrant family 0.000 -0.012
Living in an urban area -0.114* -0.004
Child has disability -0.486*** -0.317***
Positive parent–child relationship Parent–child conflict Home learning environment at 3 Children’s books in the home (at age 3):
10–20 21–30 30+
Naming vocabulary score at 3 Picture similarity score at 3 SDQ Total Difficulties at 3 SDQ Prosocial subscale at 3
0.009 0.007± 0.002
0.281** 0.370*** 0.403*** 0.010*** 0.005**
-0.019*** -0.015
0.001 0.002 0.005**
0.017 0.103*** 0.132** 0.008*** 0.003**
-0.013*** -0.006
Type of care at 3: Relative Non-relative Centre-based Other
(Ref.: Parents) Age starting school
0.088 0.009 0.026 0.332
-0.006
0.033 0.008 0.053*
-1.086*
0.012* (Table 4.14 continued overleaf.)
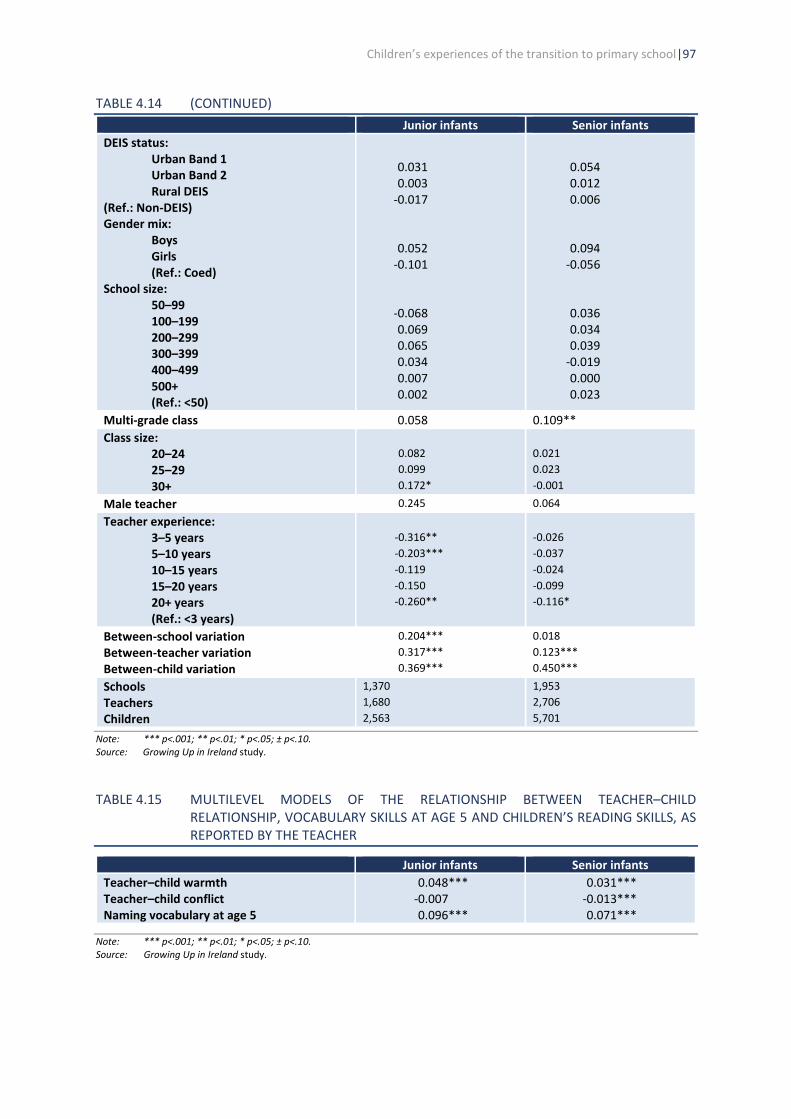
Children’s experiences of the transition to primary school|97
TABLE 4.14 (CONTINUED)
Junior infants Senior infants
DEIS status: Urban Band 1 Urban Band 2 Rural DEIS
(Ref.: Non-DEIS) Gender mix:
Boys Girls (Ref.: Coed)
School size: 50–99 100–199 200–299 300–399 400–499 500+ (Ref.: <50)
0.031 0.003
-0.017
0.052 -0.101
-0.068 0.069 0.065 0.034 0.007 0.002
0.054 0.012 0.006
0.094 -0.056
0.036 0.034 0.039
-0.019 0.000 0.023
Multi-grade class 0.058 0.109**
Class size: 20–24 25–29 30+
0.082
0.099
0.172*
0.021
0.023
-0.001
Male teacher 0.245 0.064
Teacher experience: 3–5 years 5–10 years 10–15 years 15–20 years 20+ years (Ref.: <3 years)
-0.316**
-0.203***
-0.119
-0.150
-0.260**
-0.026
-0.037
-0.024
-0.099
-0.116*
Between-school variation Between-teacher variation Between-child variation
0.204***
0.317***
0.369***
0.018
0.123***
0.450***
Schools Teachers Children
1,370
1,680
2,563
1,953
2,706
5,701
Note: *** p<.001; ** p<.01; * p<.05; ± p<.10. Source: Growing Up in Ireland study.
TABLE 4.15 MULTILEVEL MODELS OF THE RELATIONSHIP BETWEEN TEACHER–CHILD RELATIONSHIP, VOCABULARY SKILLS AT AGE 5 AND CHILDREN’S READING SKILLS, AS REPORTED BY THE TEACHER
Junior infants Senior infants
Teacher–child warmth Teacher–child conflict Naming vocabulary at age 5
0.048*** -0.007 0.096***
0.031*** -0.013*** 0.071***
Note: *** p<.001; ** p<.01; * p<.05; ± p<.10. Source: Growing Up in Ireland study.

98|The t ransi t ion to pr imary educat ion
4.6.5 Number skills
The teacher was asked to give a yes/no response to each of the following items in
relation to their study child:
• says some number names in familiar contexts, such as in nursery rhymes;
• counts reliably up to three everyday objects;
• counts reliably up to six everyday objects;
• says number names in order;
• recognises numerals one to nine;
• counts reliably up to ten everyday objects;
• orders numbers up to ten;
• uses developing mathematical ideas and methods to solve practical problems;
and
• recognises, counts, orders, writes, and uses numbers up to 20.
Figure 4.14 shows the proportion of children reported to have each of these
number skills. The vast majority say some number names in different contexts and
in order and can count up to six. Nine in ten children can count up to ten and
recognise the numbers one to nine. Almost four-fifths use mathematical skills to
solve practical problems. One-third of five-year-olds are able to count to 20. As
above, an overall scale is derived, with each positive response counted as one. The
mean score across all children is 7.7, which is comparable to scores reported in
England but slightly lower than scores in Wales, Northern Ireland and Scotland (see
Hansen and Jones, 2008). Because children in junior infant classes differ in their
patterns to those in senior infant classes (with a score of 6.9 compared with eight
respectively), the factors influencing their skills are modelled separately in Table
4.16.
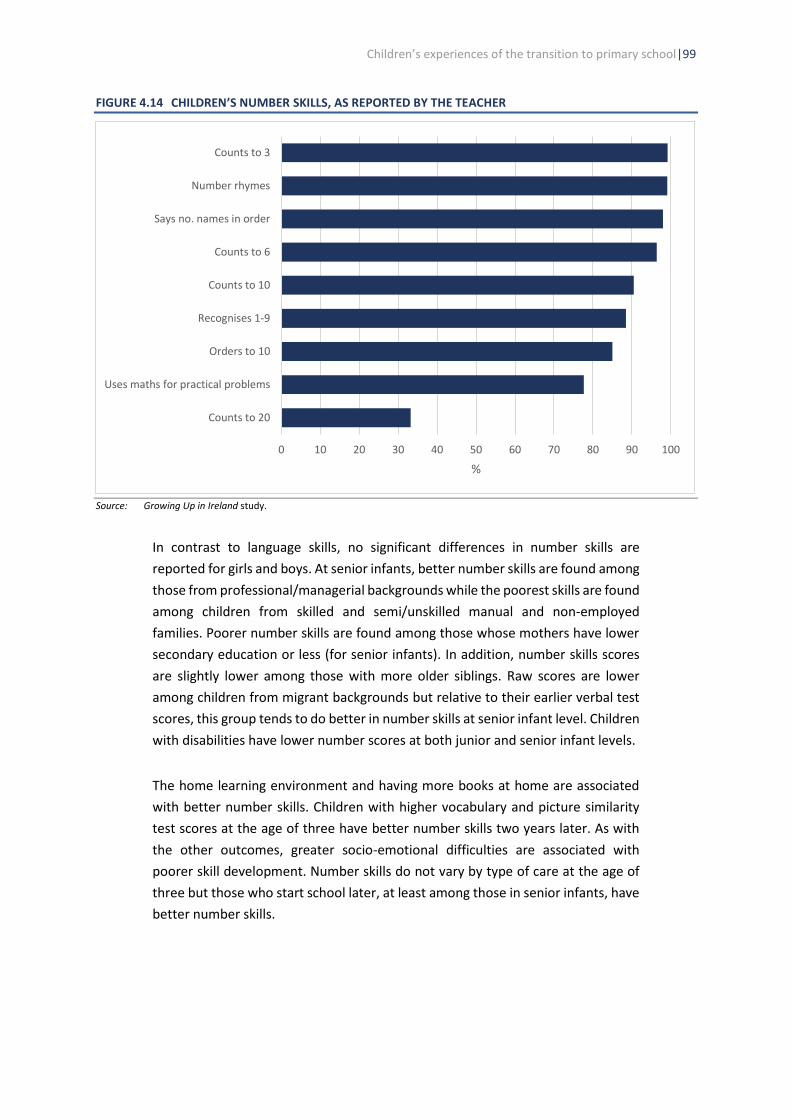
Children’s experiences of the transition to primary school|99
FIGURE 4.14 CHILDREN’S NUMBER SKILLS, AS REPORTED BY THE TEACHER
Source: Growing Up in Ireland study.
In contrast to language skills, no significant differences in number skills are
reported for girls and boys. At senior infants, better number skills are found among
those from professional/managerial backgrounds while the poorest skills are found
among children from skilled and semi/unskilled manual and non-employed
families. Poorer number skills are found among those whose mothers have lower
secondary education or less (for senior infants). In addition, number skills scores
are slightly lower among those with more older siblings. Raw scores are lower
among children from migrant backgrounds but relative to their earlier verbal test
scores, this group tends to do better in number skills at senior infant level. Children
with disabilities have lower number scores at both junior and senior infant levels.
The home learning environment and having more books at home are associated
with better number skills. Children with higher vocabulary and picture similarity
test scores at the age of three have better number skills two years later. As with
the other outcomes, greater socio-emotional difficulties are associated with
poorer skill development. Number skills do not vary by type of care at the age of
three but those who start school later, at least among those in senior infants, have
better number skills.
0 10 20 30 40 50 60 70 80 90 100
Counts to 20
Uses maths for practical problems
Orders to 10
Recognises 1-9
Counts to 10
Counts to 6
Says no. names in order
Number rhymes
Counts to 3
%
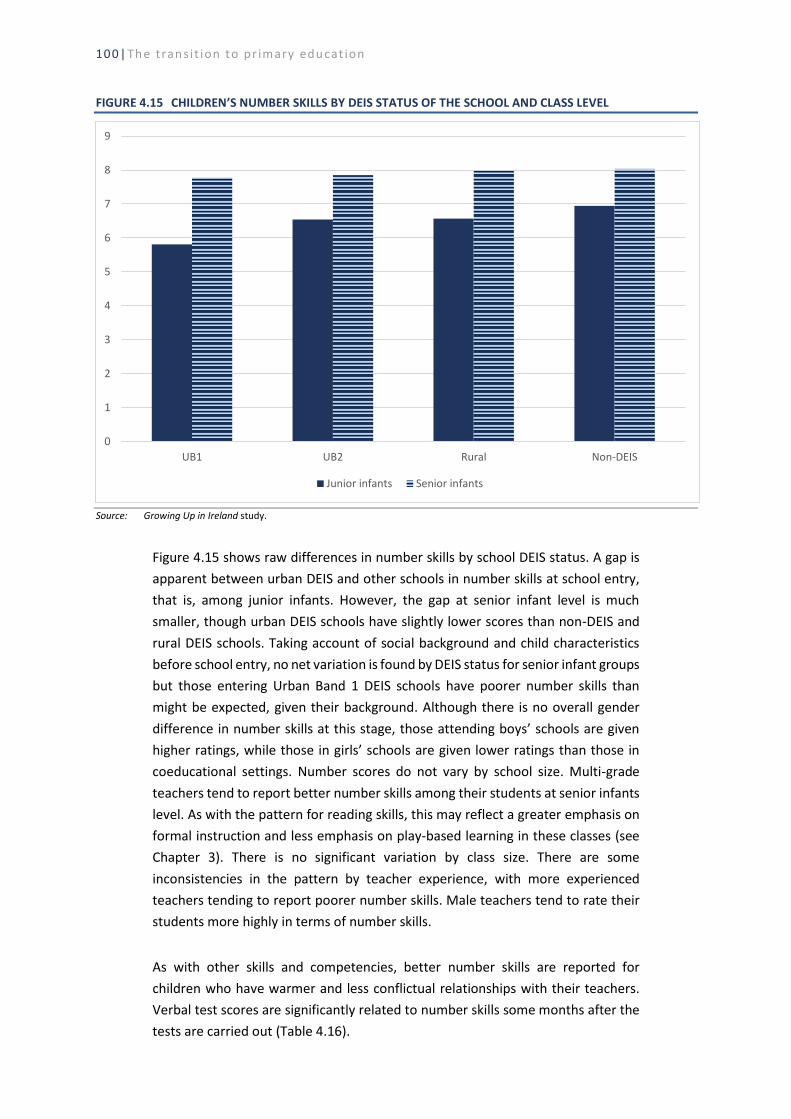
100|The trans it ion to pr imary educat ion
FIGURE 4.15 CHILDREN’S NUMBER SKILLS BY DEIS STATUS OF THE SCHOOL AND CLASS LEVEL
Source: Growing Up in Ireland study.
Figure 4.15 shows raw differences in number skills by school DEIS status. A gap is
apparent between urban DEIS and other schools in number skills at school entry,
that is, among junior infants. However, the gap at senior infant level is much
smaller, though urban DEIS schools have slightly lower scores than non-DEIS and
rural DEIS schools. Taking account of social background and child characteristics
before school entry, no net variation is found by DEIS status for senior infant groups
but those entering Urban Band 1 DEIS schools have poorer number skills than
might be expected, given their background. Although there is no overall gender
difference in number skills at this stage, those attending boys’ schools are given
higher ratings, while those in girls’ schools are given lower ratings than those in
coeducational settings. Number scores do not vary by school size. Multi-grade
teachers tend to report better number skills among their students at senior infants
level. As with the pattern for reading skills, this may reflect a greater emphasis on
formal instruction and less emphasis on play-based learning in these classes (see
Chapter 3). There is no significant variation by class size. There are some
inconsistencies in the pattern by teacher experience, with more experienced
teachers tending to report poorer number skills. Male teachers tend to rate their
students more highly in terms of number skills.
As with other skills and competencies, better number skills are reported for
children who have warmer and less conflictual relationships with their teachers.
Verbal test scores are significantly related to number skills some months after the
tests are carried out (Table 4.16).
0
1
2
3
4
5
6
7
8
9
UB1 UB2 Rural Non-DEIS
Junior infants Senior infants
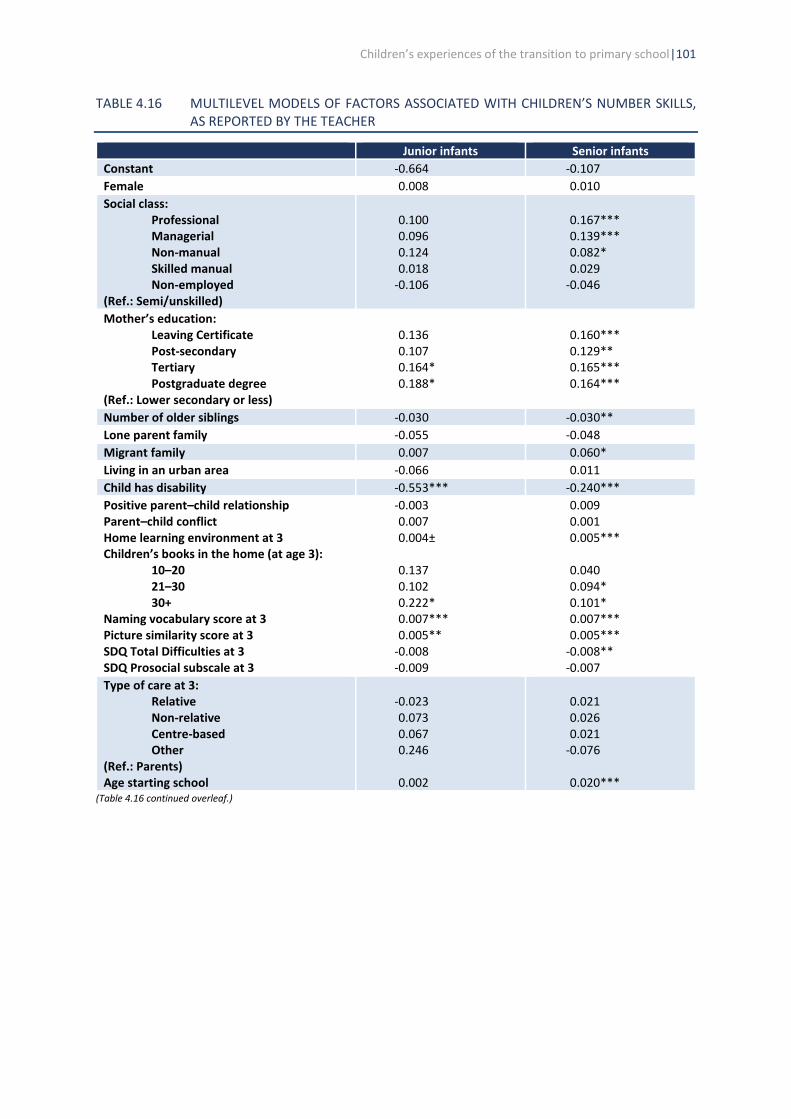
Children’s experiences of the transition to primary school|101
TABLE 4.16 MULTILEVEL MODELS OF FACTORS ASSOCIATED WITH CHILDREN’S NUMBER SKILLS, AS REPORTED BY THE TEACHER
Junior infants Senior infants
Constant -0.664 -0.107
Female 0.008 0.010
Social class: Professional Managerial Non-manual Skilled manual Non-employed
(Ref.: Semi/unskilled)
0.100 0.096 0.124 0.018
-0.106
0.167*** 0.139*** 0.082* 0.029
-0.046
Mother’s education: Leaving Certificate Post-secondary Tertiary Postgraduate degree
(Ref.: Lower secondary or less)
0.136 0.107 0.164* 0.188*
0.160*** 0.129** 0.165*** 0.164***
Number of older siblings -0.030 -0.030**
Lone parent family -0.055 -0.048
Migrant family 0.007 0.060*
Living in an urban area -0.066 0.011
Child has disability -0.553*** -0.240***
Positive parent–child relationship Parent–child conflict Home learning environment at 3 Children’s books in the home (at age 3):
10–20 21–30 30+
Naming vocabulary score at 3 Picture similarity score at 3 SDQ Total Difficulties at 3 SDQ Prosocial subscale at 3
-0.003 0.007 0.004±
0.137 0.102 0.222* 0.007*** 0.005**
-0.008 -0.009
0.009 0.001 0.005***
0.040 0.094* 0.101* 0.007*** 0.005***
-0.008** -0.007
Type of care at 3: Relative Non-relative Centre-based Other
(Ref.: Parents) Age starting school
-0.023 0.073 0.067 0.246
0.002
0.021 0.026 0.021
-0.076
0.020*** (Table 4.16 continued overleaf.)
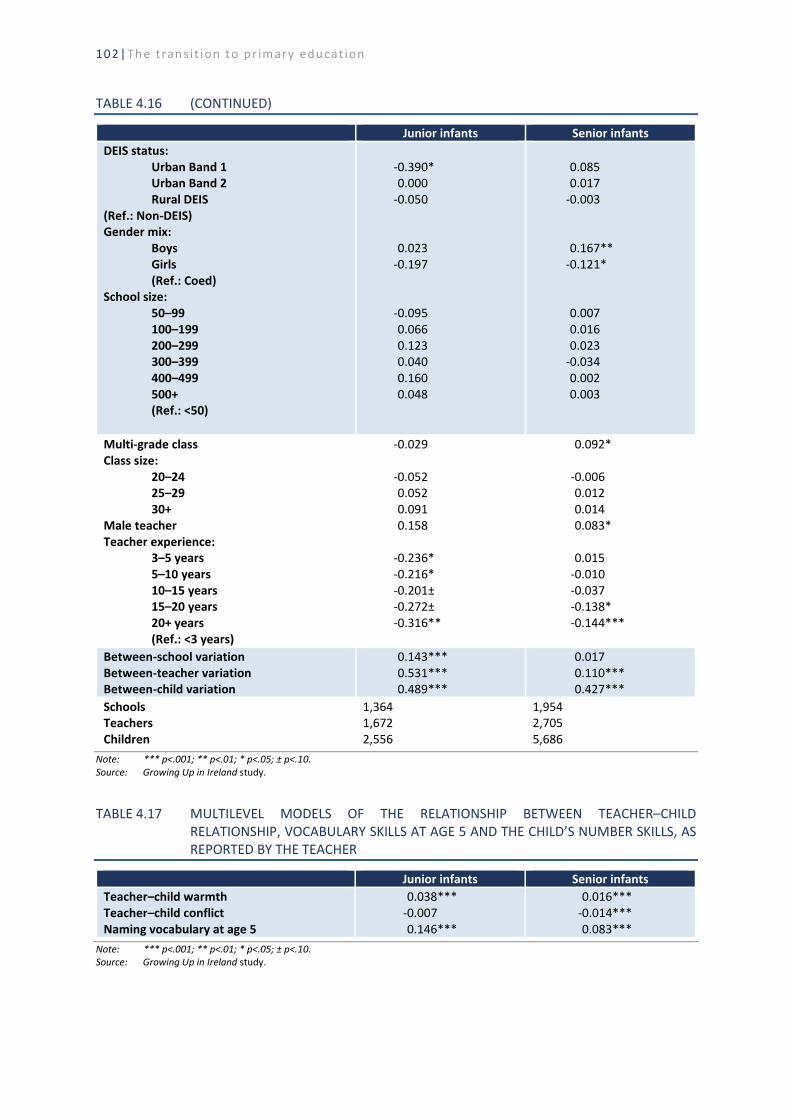
102|The trans it ion to pr imary educat ion
TABLE 4.16 (CONTINUED)
Junior infants Senior infants
DEIS status: Urban Band 1 Urban Band 2 Rural DEIS
(Ref.: Non-DEIS) Gender mix:
Boys Girls (Ref.: Coed)
School size: 50–99 100–199 200–299 300–399 400–499 500+ (Ref.: <50)
-0.390* 0.000
-0.050
0.023 -0.197
-0.095 0.066 0.123 0.040 0.160 0.048
0.085 0.017
-0.003
0.167** -0.121*
0.007 0.016 0.023
-0.034 0.002 0.003
Multi-grade class Class size:
20–24 25–29 30+
Male teacher Teacher experience:
3–5 years 5–10 years 10–15 years 15–20 years 20+ years (Ref.: <3 years)
-0.029
-0.052 0.052 0.091 0.158
-0.236* -0.216* -0.201± -0.272± -0.316**
0.092*
-0.006 0.012 0.014 0.083*
0.015
-0.010 -0.037 -0.138* -0.144***
Between-school variation Between-teacher variation Between-child variation
0.143*** 0.531*** 0.489***
0.017 0.110*** 0.427***
Schools Teachers Children
1,364 1,672 2,556
1,954 2,705 5,686
Note: *** p<.001; ** p<.01; * p<.05; ± p<.10. Source: Growing Up in Ireland study.
TABLE 4.17 MULTILEVEL MODELS OF THE RELATIONSHIP BETWEEN TEACHER–CHILD RELATIONSHIP, VOCABULARY SKILLS AT AGE 5 AND THE CHILD’S NUMBER SKILLS, AS REPORTED BY THE TEACHER
Junior infants Senior infants
Teacher–child warmth Teacher–child conflict Naming vocabulary at age 5
0.038*** -0.007 0.146***
0.016*** -0.014*** 0.083***
Note: *** p<.001; ** p<.01; * p<.05; ± p<.10. Source: Growing Up in Ireland study.

Children’s experiences of the transition to primary school|103
4.7 CONCLUSIONS
The GUI study provides a rich array of measures of different aspects of children’s
skills and wellbeing around entry to primary education, including mothers’
accounts of the ease of transition to primary school, teachers’ ratings of the child’s
socio-emotional wellbeing and dispositions towards school, a test of vocabulary
skills, and teachers’ ratings of literacy- and numeracy-related skills. Children are
seen as having settled into primary school well, though a small number (4–5 per
cent) are often upset or reluctant to go to school while around one-fifth experience
occasional such difficulties. Transition difficulties are more apparent for boys,
those from lone parent families, those living in urban areas and those with a
disability/SEN. A more stimulating home learning environment and closer
relationship between child and mother appear to ease transition.
The study collected new information on the quality of the teacher–pupil
relationship, as reported by the teacher. Teachers tend to report less close and
more conflictual relationships with boys, children from disadvantaged
backgrounds and children with disabilities/SEN.
Clear gender differences in children’s dispositions and skills are apparent in
relation to all dimensions, except number skills where no significant gender
difference is evident. Thus, boys achieve lower vocabulary test scores and are seen
as having more negative dispositions to school, greater socio-emotional difficulties
and poorer literacy-related skills. Children’s outcomes at this early stage vary
significantly by social background, with children from working-class, non-employed
or less highly educated families having more negative attitudes, more socio-
emotional difficulties and poorer literacy- and numeracy-related skills. Reflecting
differences in their social profile, children attending urban DEIS schools have lower
vocabulary test scores and are seen as having poorer dispositions and pre-
academic skills. There is some evidence, however, that this gap is somewhat less
for the senior infants group, suggesting that school-based learning plays an
important role in providing disadvantaged children with the social and pre-
academic skills they may not possess on school entry. The largest gap in early
outcomes is evident in relation to children with disabilities or SEN.
104|Conc lusions and po l icy impl icat ions
CHAPTER 5
Conclusions and policy implications
5.1 INTRODUCTION
Recent years have seen a transformation of the early years policy landscape in
Ireland, with the rollout of state-funded early childhood education (through the
Early Childhood Care and Education (ECCE) scheme) and the introduction of
Aistear: The Early Childhood Curriculum Framework, which aims to provide a
continuity of learning experiences over the transition from preschool to primary
school. While previous studies have looked at the impact of early childhood
education on child cognitive and socio-emotional outcomes and at perceptions of
school readiness (McGinnity et al., 2015; Russell et al., 2016; Ring et al., 2016),
there has been little research on children’s experiences of the transition to primary
school and the factors that facilitate their adjustment to the new setting. This
report draws on the Growing Up in Ireland (GUI) infant cohort data, which was
collected when the children were five years of age, to provide a comprehensive
examination of children’s preschool experiences, family preparation for sending
their children to primary school and teacher perceptions of the skills and
dispositions children possess on, or shortly after, school entry. This chapter
provides a summary of the main findings of the study and discusses their
implications for policy and practice.
5.2 PRESCHOOL EXPERIENCES AND SKILL DEVELOPMENT
The children surveyed in the GUI study were among the first in Ireland to be able
to avail of a funded preschool place through the ECCE scheme. Almost all families
of the study children (96 per cent) participated in this scheme. Prior to this,
children differed in their experience of non-parental care. At nine months of age,
four in ten of the study children had been in receipt of non-parental care on a
regular basis each week, with a total of 11 per cent in centre-based care. By three
years of age, just before the cohort was eligible for the ECCE scheme, a higher
proportion (50 per cent) of the children was in receipt of regular non-parental care,
with a total of 27 per cent in centre-based care. At both time-points, the use of
non-parental, especially centre-based, care is found to be more common among
more advantaged families – graduates and those in professional/managerial
occupations.
Although participation in the ECCE scheme is found to be high across all groups,
take-up levels are somewhat lower among more disadvantaged groups (12 per
cent non-take-up for non-employed families) and among those whose children
have a disability (9 per cent non-take-up). More advantaged families are more
likely to top up the hours provided through ECCE, as are two-parent families. As a
result of these patterns, the study children had very different experiences of early

The transition to primary education|105
childhood care and education before starting school, although almost all had some
experience of a centre-based setting. The extent to which this made a difference
to the transition process is discussed further below.
Children are found to differ in their cognitive development before starting school.
Language development at the age of three varies markedly by the socio-economic
circumstances of the child’s family. The highest vocabulary test scores are found
among those with graduate mothers and those from professional/managerial
families. In the test, girls score better than boys of similar backgrounds. Children
from migrant families have poorer English language skills than their peers, with a
very sizeable gap at three years of age. A large developmental gap is also evident
for children with disabilities. While these patterns are stark, it is important to
recognise that family background explains only 4 per cent of the variation in
language test scores at this stage, so a range of other factors also shape children’s
skill development. The influence of early language skills on the integration into
primary education is discussed in the remainder of the chapter.
5.3 PREPARING FOR SCHOOL START
The age at starting school has become older over time, with the proportion of four-
year-olds in junior infant classes declining from 47 per cent in 1999–2000 to 27 per
cent in 2016–2017 (Department of Education and Skills Education Statistics
Database).19 This decline predates the introduction of the ECCE scheme, though a
more marked increase in age at school start can be observed after the scheme is
rolled out. The extension from September 2018 of funded preschool provision to
cover the period from two years eight months to school entry is therefore likely to
further increase average age on school entry.
School start tends to be later among more advantaged families in terms of social
class, maternal education, household income and family structure. Girls tend to
start school slightly earlier, by about a month on average, than boys. Children from
migrant families also start school at a slightly younger age. Children with a
disability, especially socio-emotional or learning difficulties, tend to start school
later than their peers. Timing of birth obviously makes a difference, with summer-
born children starting school at an older age. Children attending urban DEIS
(Delivering Equality of Opportunity in Schools) schools, especially Urban Band 1
schools, tend to be younger on school entry than those attending other schools.
Being older on school entry tends to give a slight advantage to children, in that they
have less negative attitudes to school, better language skills, better skills in linking
sounds and letters, better reading and number skills, and fewer socio-emotional
difficulties.
19 The Department of Education and Skills’ Education Statistics Database is hosted by the Central Statistics Office; see
https://www.education.ie/en/Publications/Statistics/Education-Statistics-Database/.

106|Conc lusions and po l icy impl icat ions
Mothers tend to draw on informal advice and information, that is, from friends and
other parents, before their child starts school. More highly educated mothers are
more likely to use both informal and formal sources of information, including
preschool and primary school staff. Almost all mothers reported talking to their
child about going to school and over four-fifths had visited the school, attended an
information session and practised reading, writing or numbers with the child in
preparation for school start. Less advantaged families are somewhat more likely to
engage in more formal learning activities such as practising reading.
When asked about the factors that are important in a child’s ‘readiness’ to start
school, teachers tend to emphasise practical and socio-emotional skills, such as
managing personal care, children being able to communicate their needs, taking
turns/sharing, being sensitive to others’ feelings and not being disruptive in class.
Teachers tend to see more ‘academic’ skills, such as knowing the alphabet, being
able to count and receiving formal reading and maths instruction in preschool, as
less important in school readiness, though a sizeable proportion – over one-fifth –
see these skills as somewhat important.
Teachers were asked about the kinds of information they received on incoming
students. The vast majority (92 per cent) said they received information on
whether the children had a special educational need (SEN) and the majority – over
two-thirds – knew something about family circumstances and whether the child
had attended preschool. An information gap was evident regarding the child’s
individual strengths and challenges and the skills developed in preschool.20
5.4 EARLY YEARS CLASSROOMS
At the time of the teacher survey, the majority (72 per cent) of children were in
senior infant classes, while 28 per cent were in junior infants. One-quarter of five-
year-olds were being taught in multi-grade classes (that is, with two or more year
groups), and class size varied significantly. Very few (3.6 per cent) of the five-year-
olds were being taught by a male teacher and over one-quarter were being taught
by a teacher with less than five years’ experience.
Play-based activities are a common feature of early years classrooms, but there is
a decline in the use of creative and pretend play between junior and senior infants.
Creative play is used more frequently in DEIS Urban Band 1 schools and less often
in multi-grade classes. A combination of individual work and whole-class teaching
is the most common pattern across both junior and senior infant classes, with
groupwork and pair work employed frequently only in a minority of classrooms.
Whole-class teaching is more commonly used in larger classes. Over half of children
are given the opportunity to engage in hands-on activities every day, with this
happening to a greater extent in junior infant classes and Urban Band 1 schools
20 Similar issues emerged in recent policy work with a network of preschools and primary schools (see NCCA, 2018a).

The transition to primary education|107
and being less frequent in multi-grade classes. Teachers are more likely to read to
children every day in (single-grade) junior infant classes and in urban DEIS and
boys’ schools. In sum, there are marked differences in learning experiences
between children in junior and senior infant classes. Because teachers are
managing multiple classes, children in multi-grade classes experience fewer play-
based and hands-on activities. Teachers in urban DEIS schools, especially Urban
Band 1, appear to adapt their practice to engage children, using more play-based
and hands-on activities and more reading to the children and counting out loud.
More class time is spent by teachers on English, at an average of four hours per
week, followed by maths (three hours), Gaeilge (150 minutes) and religious or
ethical education (100 minutes). Around one hour per week each is spent on
physical education and visual arts, with less time spent on other subject areas.
There is a slight increase in the amount of time spent on English and maths
between junior and senior infant classes. Teachers in Urban Band 1 DEIS schools
spend significantly more time on English than those in other school types.
5.5 SETTLING INTO PRIMARY SCHOOL
Mothers were asked about the extent to which their child had settled into primary
school; this information on the transition process is only available on the three-
quarters of children who had started school by the time of the home visit. It was
found that, in the majority of cases, children look forward to going to school and
say good things about school on a frequent basis. Only a small proportion engage
in frequent complaining or being upset (4–5 per cent), though occasional
difficulties are apparent among one-fifth of children. Girls and children from
migrant families are seen as making a smoother transition to the school setting,
while more transition difficulties are apparent among those with disabilities, those
from lone parent families, those with more older siblings and those living in urban
areas. The quality of the relationship with parents and having had a more
stimulating home learning environment are associated with an easier transition,
while children who have more socio-emotional difficulties at the age of three later
have a more difficult transition to school.
There is no evidence that the type of childcare experienced at three, before
starting the ECCE scheme, affects the later transition to primary education. The
fact that almost all the study children had experienced centre-based care through
the ECCE scheme may have overridden any effects of earlier participation. There is
some evidence that those who attend smaller schools (with fewer than 100
students) settle in more quickly than those in larger schools.
5.6 CHILDREN’S SKILLS AT SCHOOL ENTRY
During the home visit, children were administered the British Ability Scale (BAS)
vocabulary test as a measure of verbal skills. Because GUI is an age rather than

108|Conc lusions and po l icy impl icat ions
stage cohort, three-quarters of the children completed this test while they were in
the last terms of junior infants, while one-quarter did the test before entering
primary school. Some months later, when all children had started school, teachers
were asked to rate the five-year-olds across a number of dimensions of skill and
competency development. Because of the different timing of school start, children
at this point were spread between junior and senior infant classes. The class level
is taken into account in the analyses. In order to look at commonalities and
differences in the factors associated with different outcomes, Table 5.1 presents a
summary of the analyses discussed in Chapter 4.

TABLE 5.1 SUMMARY OF ANALYSES OF THE CHILD AND FAMILY FACTORS ASSOCIATED WITH CHILD OUTCOMES AT AGE 5
Outcome Gender Social background Migrant status Disability/SEN Verbal skills at 3 SDQ at 3 Verbal
skills at 5
Quality of interaction with
teacher
Verbal skills at 5 Higher among girls.
Higher where maternal education is higher.
Greater progress relative to verbal skills at 3.
Lower.
Higher where higher test scores.
Lower where more difficulties.
n.a. n.a.
Teacher reported outcomes:
n.a.
Positive teacher–child relationship
More positive for girls.
Professional, managerial and non-manual more positive.
Lower. Lower. Higher where higher test scores.
NS n.a. n.a.
Conflictual teacher–child relationship
More conflictual for boys.
Working-class, non-employed and lower education more conflictual.
NS Much higher. NS Higher where more difficulties.
n.a. n.a.
Negative attitudes and dispositions to school
More negative among boys.
Working-class, non-employed and lower education more negative.
NS Much more negative.
More negative where lower test scores.
More negative where more difficulties.
More negative where lower test scores.
More negative: where relationship is more conflictual; and where it is and less positive.
Poorer language skills Poorer
among boys.
Poorest among non-employed and families with lower education.
Slightly poorer. Much poorer. Poorer where lower test scores at 3.
Poorer where more difficulties.
NS
Poorer where relationship is more conflictual and/or less positive.
Skills in linking sounds and letters
Better among girls.
Poorer among non-employed and families with lower education.
NS taking account of earlier skills.
Poorer. Better where higher test scores at 3.
Better where fewer difficulties.
Better where higher test scores.
Poorer where relationship is more conflictual and/or less positive.
(Table 5.1 continued overleaf.)

TABLE 5.1 (CONTINUED)
Outcome Gender Social background Migrant status Disability/SEN Verbal skills at 3 SDQ at 3 Verbal
skills at 5
Quality of interaction with
teacher
Reading skills Better among girls.
Poorer among working-class, non-employed and families with lower education.
NS taking account of earlier skills.
Poorer. Better where higher test scores at 3.
Better where fewer difficulties.
Better where higher test scores.
Poorer where relationship is more conflictual and/or less positive.
Number skills
NS Poorer among working-class, non-employed and families with lower education.
Slightly greater progress relative to verbal skills at 3.
Poorer. Better where higher test scores at 3.
Better where fewer difficulties.
Better where higher test scores.
Poorer where relationship is more conflictual and/or less positive.
Socio-emotional difficulties (SDQ total)
More difficulties among boys.
More difficulties among working-class, non-employed and families with lower education.
NS More difficulties.
Fewer difficulties where higher test scores at 3.
More difficulties at 5 where had more difficulties at 3.
Fewer difficulties where higher test scores.
More difficulties where relationship is more conflictual and/or less positive.
Prosocial behaviour
Better among girls.
NS Poorer. Poorer. Better where higher test scores at 3.
NS with difficulties and prosocial behaviour at 3, when mother’s rating at 5 is taken into account.
Better where higher test scores.
Poorer where relationship is more conflictual and/or less positive.
Notes: NS = not statistically significant n.a. = not applicable. Where patterns differ between junior and senior infants, the results for the larger senior infants group are used. Source: Growing Up in Ireland study.

The transition to primary education |111
5.6.1 Child and family factors
Clear gender differences are apparent, even at this early stage. Girls achieve higher
scores on the verbal skills test at the age of five than boys and receive more positive
ratings from their teachers across almost all dimensions. Thus, boys are seen as
having more negative dispositions to school, poorer language and reading skills,
and poorer skills at linking sounds and letters. Boys are rated by their teachers as
having more socio-emotional difficulties than girls, while girls are seen as having
better prosocial behaviour. Furthermore, teachers are more likely to characterise
their relationship with female students as more positive (warmer or closer) and
less conflictual. The only outcome where no gender gap is reported is in relation to
number skills, where no significant differences are found between boys and girls.
Social background emerges as an important differentiating factor in children’s
outcomes in the early years of primary school. Children with graduate mothers
have better verbal skills, according to the BAS measure. In relation to teacher
ratings, children from families with lower levels of education and from working-
class or non-employed groups are characterised as having more negative attitudes,
poorer language and reading skills, poorer skills in linking sounds and letters and
poorer number skills. Children from more disadvantaged families are rated as
having more socio-emotional difficulties but do not differ in their levels of prosocial
behaviour. Research on second-level students has pointed to the more negative
dynamic of teacher–student relationships among working-class young people (see,
for example, Smyth, 2016). Analyses presented in this report point to the early
roots of such a dynamic, with teachers describing a warmer relationship with
middle-class children and a more conflictual one with children from working-class
or non-employed households.
This study provides new insights into the integration into primary education of
children from migrant backgrounds. The picture is a complex one. Some of the
difference in (English language) verbal skills at the age of three is carried on to
school entry in relation to some outcomes, including teacher rating of language
and reading-related skills. At the same time, there is some evidence of a closing of
the gap in relation to some dimensions, with children from migrant families making
slightly greater progress in objective verbal skills and teacher-rated number skills
at five relative to their verbal skills at the age of three. Children from migrant
families do not differ from other children in the level of socio-emotional difficulties
but are described by their teachers as displaying less prosocial behaviour, perhaps
reflecting differences in language skills. Teachers describe a less close relationship
with migrant children but the degree of conflict does not differ by migrant status.
Similarly, new information is provided on the transition to primary school among
children with disabilities. There is a gap in verbal skills test scores, with children
with disabilities achieving significantly lower scores at the age of five. Teachers
112|Conc lusions and po l icy impl icat ions
describe children with disabilities as having more negative attitudes to school and
poorer language, reading-related and number skills. On average, children with
disabilities are rated as having more socio-emotional difficulties and poorer
prosocial behaviour. Of concern is the fact that, even at this early stage of
schooling, teachers view their relationship with children with SEN as being less
close and much more conflictual.
Table 5.1 also shows that children’s cognitive development and socio-emotional
wellbeing at the age of three are predictive of how they will fare over the transition
to primary school. Children with better verbal skills at the age of three have better
verbal test scores two years later and are assessed as having better outcomes by
their teachers. These children have fewer socio-emotional difficulties and display
more prosocial behaviour. They also have warmer relationships with their teachers
on school entry. On the other hand, children who have more socio-emotional
difficulties at the age of three (as rated by their mothers) have more negative
attitudes to school and poorer verbal, reading-related and number skills two years
later. They also tend to have a more conflictual relationship with their teacher.
Information on the quality of the relationship between teacher and child and on
the child’s school-related skills is collected at the same time so it is difficult to
disentangle causality. Teachers may rate children as having poorer skills if they
have a conflictual relationship with them and/or having a poor relationship with
their teacher may have an impact on a child’s skill development (as has been shown
in relation to second-level students; see Smyth, 2016 and 2017). Nonetheless, it is
worth highlighting that even at the age of five, a group of children is identifiable –
disproportionately boys, from working-class backgrounds and/or with special
educational needs (SEN) – who have poorer skill development and poorer quality
relationships with their teachers.
5.6.2 School differences in child outcomes
The analyses presented in Chapter 4 explored whether child outcomes varied by
the type of school attended. Given that the children surveyed will have been in that
school for a maximum of 1.5 years, between-school differences cannot be
regarded as reflecting the effect of being in a particular school. However, it is worth
examining whether children come to different types of schools with different levels
of prior skills and whether they may be evaluated differently by teachers across
different school contexts.

The transition to primary education |113
TABLE 5.2 SUMMARY OF ANALYSES OF THE RELATIONSHIP BETWEEN SCHOOL TYPE AND CHILD OUTCOMES AT AGE 5
Outcome DEIS status (raw difference between
schools) Gender mix (adjusted for gender and
social background)
Verbal skills at 5 Lowest test scores among those entering Urban Band 1 schools; rural DEIS scores equivalent to non-DEIS.
NS
Teacher reported outcomes:
Positive teacher–child relationship NS
Teachers report less closeness with girls attending girls’ schools than in coeducational schools.
Conflictual teacher–child relationship
More conflictual in Urban Band 1 schools; patterns for rural DEIS equivalent to non-DEIS.
NS
Negative attitudes and dispositions to school
More negative in urban DEIS schools; patterns for rural DEIS equivalent to non-DEIS.
Teachers report more positive attitudes to school among boys in boys’ schools than among boys in coeducational schools.
Poorer language skills Poorer in Urban Band 1 schools; patterns for rural DEIS equivalent to non-DEIS; Urban Band 2 patterns are closer to rural/non-DEIS than to Urban Band 1.
Teachers report slightly better skills among boys in boys’ schools than among boys in coeducational schools.
Skills in linking sounds and letters
For junior infants, lowest ratings for children in Urban Band 1 schools; gap in scores is less at senior infants level.
NS
Reading skills For junior infants, lowest ratings for children in Urban Band 1 schools; gap in scores is less at senior infants level.
NS
Number skills For junior infants, gap between urban DEIS schools and other schools; gap in scores is less at senior infants level.
Teachers report better skills among boys in boys’ schools than among boys in coeducational schools, while they report poorer skills among girls in girls’ schools than in coeducational schools.
Socio-emotional difficulties (SDQ total)
Greater in Urban Band 1 schools and, to some extent, Urban Band 2 schools; patterns for rural DEIS equivalent to non-DEIS.
Teachers report fewer difficulties among boys in boys’ schools than among boys in coeducational schools.
Prosocial behaviour
Slightly lower levels among children in urban DEIS schools.
Teachers report more prosocial behaviour among boys in boys’ schools than among boys in coeducational schools, while they report less prosocial behaviour among girls in girls’ schools than in coeducational schools.
Note: Where patterns differ between junior and senior infants, the results for the larger senior infants group are used. Source: Growing Up in Ireland study.
Table 5.2 shows that children who (go on to) attend Urban Band 1 DEIS schools
have significantly lower verbal skill test scores than those who go on to other
school types. This group of children is also rated by their teachers as having poorer
language skills than their peers, while those in Urban Band 1 and Band 2 schools
are characterised as having more negative attitudes to school. Across these

114|Conc lusions and po l icy impl icat ions
outcomes, children attending rural DEIS schools are very similar to their
counterparts in non-DEIS schools. In relation to more school-specific skills, such as
linking sounds and letters, reading and number skills, a social gradient is evident
among the junior infant group, with the lowest skill ratings found for those in Urban
Band 1 schools. However, differences are less marked among the senior infant
group, indicating that exposure to school-based learning may have reduced the
gap somewhat, a pattern that may reflect the strong emphasis in urban DEIS
classrooms on pre-reading, reading and number skills (see above and Chapter 3).
Teachers report greater socio-emotional difficulties among children in Urban Band
1 and, to some extent, Urban Band 2 schools, as well as a more conflictual
relationship with these children. The differences found by DEIS status of the school
relate to the greater concentration of children from socio-economically
disadvantaged families in these schools and to the greater prevalence of disability
or special educational need (SEN). There is no evidence at this stage of the so-called
‘multiplier effect’, that is, where the concentration of disadvantage in certain
schools results in poorer outcomes. In fact, there does seem to be a slight closing
of the gap in some school-related skills over the early years of primary education.
Just one-tenth of five-year-olds are taught in a single-sex setting so this group is
quite distinctive in terms of family and child characteristics. Taking account of the
different intake characteristics in single-sex schools, it is possible to explore
whether children are evaluated differently according to the gender mix of the
school. The findings in Table 5.2 show that teachers report more positive attitudes
to school, better language skills and fewer socio-emotional difficulties among boys
attending boys’ schools compared with boys with similar characteristics who go to
coeducational schools. The pattern for number skills seems to suggest some
gender stereotyping, with boys in single-sex schools being rated more highly while
girls in single-sex schools are rated more negatively than their peers in
coeducational schools. It is difficult at this early stage to determine whether these
differences relate to the ‘effect’ of being in a single-sex setting or a reference group
effect, whereby teachers contrast boys with ‘more engaged and better behaved’
girls in the same class. The evidence would appear to support a reference group
effect since the gender gap is larger in teacher-rated skills than in the objective test
of vocabulary skills administered by the interviewers. Furthermore, additional
analysis (not shown here) indicates that the gender gap in teacher-related socio-
emotional difficulties is much larger than that reported by mothers. Even if the
differences found in the gender gap between single-sex and coeducational settings
relate, at least in part, to the comparison teachers make between different pupils
in their class, they may nonetheless have longer-term implications as teacher
The transition to primary education |115
feedback and expectations have been found to be significant influences on child
experiences and outcomes.21
5.7 IMPLICATIONS FOR POLICY
5.7.1 The transition process
The early years landscape in Ireland has seen significant changes in recent years,
with the rollout of funded part-time places in early education through the ECCE
scheme and the introduction of the Aistear Curriculum Framework. As a result,
almost all children entering primary school have prior experience of centre-based
education and care. The success of the ECCE scheme in terms of take-up levels
means that it is not possible to determine whether taking part in preschool
education has an impact on the transition to primary school, as hardly any of the
study children did not take part.22 Parents are almost universally positive about the
care their children receive under the scheme (see McGinnity et al., 2015).
However, there has been a lack of systematic information on the quality and
content of early childhood education, though small-scale research suggests that
some primary teachers are critical of the ‘overly academic’ approach adopted in
some preschool settings (NCCA, 2018a). There is therefore a lack of Irish research
on early childhood education quality and its implications for later child outcomes;
such research would form a vital evidence base for policy development in the area.
In the GUI survey, primary teachers reported a lack of knowledge of the skills and
capacities developed by children before they start school and the kinds of activities
they have engaged in during preschool. There are existing examples of good
practice at local level in the development of transfer documentation for children
(see O’Kane and Murphy, 2016a) but the evidence from teachers in the GUI study
suggests that these practices are the exception. Work is currently underway by the
NCCA on developing transfer templates to help ensure an exchange of information
between early childhood practitioners and primary schools. The use of such
transfer documentation across all settings nationally is likely to facilitate
communication between care and education providers and to provide greater
continuity of learning opportunities over the transition process. However, it
appears evident that the transfer of information needs to be part of broader efforts
to facilitate the transition into primary education (NCCA, 2018a). The fact that
transition difficulties are more common among certain groups of children
(especially boys and those with disabilities) provides an important evidence base
21 Later waves of the GUI study will allow for a more detailed exploration of the trajectories of children in single-sex and
coeducational schools. 22 The scheme may have had a positive impact on all of those taking part but because we do not have data on children
who were too old to qualify for the scheme, we cannot identify any such difference using GUI data.

116|Conc lusions and po l icy impl icat ions
for school principals and teachers in developing supports for children to assist
them in integrating into the new setting.
5.7.2 Learning at home and at school
The findings point to the important role of parents in fostering a learning
environment at home, with children who have been read to frequently by, and
engaged in creative and educational activities with, their parents settling more
quickly into primary school. A more stimulating home learning environment also
provides children with the vocabulary skills they need to communicate with their
teachers and peers and engage in the primary curriculum. Parents tend to engage
in a range of activities, such as visiting the school and talking about school, to help
their children prepare for starting school. The high level of communication
between parents and teachers at this stage of the primary career offers the
potential for schools to further involve parents in supporting their children’s
learning.
The kinds of learning opportunities offered to children in the early years of primary
education vary by the type of school and classroom they attend. Some of this
variation appears to reflect the targeting of certain approaches towards children
who may require additional support. Thus, teachers in urban DEIS schools make
greater use of play-based learning to encourage children’s engagement but also
place a greater emphasis on reading and number skills. In addition, teachers in
boys’ schools place greater emphasis on reading, presumably in response to the
emerging gender gap in reading activities outside school, even at this early stage
(see Smyth, 2016). However, some of the variation seems to be, at least partly,
driven by logistical constraints. Thus, whole-class teaching is more commonly used
with larger classes and children at junior infants level in multi-grade classes appear
to have less exposure to play-based learning and being read to than their
counterparts in single-grade settings. This pattern points to the importance of
differentiation in class activities, so that all children have the opportunity to
experience play-based and hands-on activities. More generally, there appears to
be a reduction in the variety of play-based learning activities over the transition
from junior to senior infants, suggesting that there may be greater potential to
provide children in the early years with a more playful experience of learning. The
findings in this study align with views expressed in the consultation on primary
curriculum time and structure, where many respondents felt that schools lacked
the necessary support and resources to use child-led play (NCCA, 2018b). There
was broad agreement for using a more integrated curriculum structure for infant
classes, and the challenge of using a play-based pedagogy with a subject-based
curriculum was highlighted (NCCA, 2018b).

The transition to primary education |117
5.7.3 Equity in child experiences and outcomes
The study findings reveal that the socio-economic circumstances of the families
into which children are born significantly shape their cognitive and non-cognitive
skills and capacities before and on school entry, in keeping with the findings of
international studies (see, for example, Sylva et al., 2010). Thus, children whose
parents hold professional/managerial jobs and/or have third-level degrees have
better verbal skills and fewer socio-emotional difficulties at the age of three than
those whose parents hold working-class or no jobs and have lower levels of
educational qualifications. This social gradient remains evident two years later and,
after the transition to primary school, children from more disadvantaged
backgrounds are seen as having more negative dispositions towards school and
poorer language, reading-related and number skills. These differences are only
partly influenced by the extent to which parents engage in learning activities with
children and have more children’s books in the home. Parental education is found
to have a direct influence on child outcomes, even taking account of other factors.
International research indicates that social differentiation in foundational skills
such as literacy and numeracy has a long-term effect on educational and socio-
emotional outcomes (see, for example, Sammons et al., 2015). While the social
gradient in skills development undoubtedly reflects unequal access to economic,
cultural and social resources more generally, it is of concern that, even at this early
stage, children from more disadvantaged backgrounds experience poorer quality
relationships with their teachers; that is, less close and more conflictual
relationships, than those from more advantaged backgrounds.
Because of residential segregation and patterns of school choice, the social profile
of children varies across different kinds of schools. Children who go on to attend
urban DEIS schools, especially those in Urban Band 1, have poorer verbal skills at
the age of three. On school entry, they are characterised as having more negative
attitudes to school, poorer skills in relation to communication, reading and
numbers, and greater socio-emotional difficulties. The gap in skill development
between those in urban DEIS and other schools at senior infants level is slightly
narrower, suggesting that exposure to school-based learning appears to boost the
skills of more disadvantaged children. As with previous research (see, for example,
McCoy et al., 2014; Smyth et al., 2015), little difference is found in skill
development between those in rural DEIS and non-DEIS schools, suggesting the
need to target additional resources towards children in disadvantaged urban
settings. As has been argued previously (Smyth et al., 2015), the majority of
children from disadvantaged backgrounds do not attend DEIS schools and
therefore do not receive additional supports on the basis of their socio-economic
circumstances, highlighting the potential value of providing some, albeit tapered,
supports to disadvantaged groups across all school settings.
118|Conc lusions and po l icy impl icat ions
Previous analyses of the GUI study have highlighted the challenges in securing
genuine inclusion for children and young people with special educational needs
(SEN) (Banks and McCoy, 2011; McCoy and Banks, 2012). The current study findings
indicate that such challenges are evident from the early years of primary
education, with five-year-old children with SEN experiencing a more difficult
transition to school and having poorer academic skills and socio-emotional
wellbeing. Further research would be worthwhile in unpacking the extent to which
child experiences and outcomes vary by type of SEN. Of concern is the fact that
teachers describe their relationships with children with SEN as less warm/close and
more conflictual than they do regarding their relationships with other children.
A significant gender gap in educational experiences and outcomes has been well
documented in Ireland and internationally (Skelton et al., 2007), although there is
relatively little consensus about the drivers of these patterns. The study findings
point to significant differences between girls and boys in their academic and non-
cognitive skills, with girls rated more positively in terms of their communication,
language and reading skills, and behaviour. These gender patterns are at least
partly explained by variation in the quality of the teacher–student relationship,
with teachers feeling they have closer and less conflictual relationships with their
female students. It is difficult to disentangle the extent to which the patterns
reflect actual differences in cognitive and non-cognitive skills or perceptions of
these differences. Girls perform better on objective tests of verbal skills at the ages
of three and five and are characterised by their mothers as having fewer socio-
emotional difficulties. However, there is at least tentative evidence of some degree
of gender stereotyping at play. Firstly, the gender gap in teacher-rated skills is
larger than that in test-based assessments. Secondly, in single-sex schools, where
boys are not being compared with girls, they tend to be rated more positively by
their teachers across many of the domains. The gender gap in skills and dispositions
at the age of five is of significant policy concern as negative school experiences are
likely to set the tone for later disengagement and underachievement. International
experience suggests that the gender gap in educational outcomes is not readily
amenable to policy interventions (see Smyth, 2007). However, recent research
(Legewie and DiPrete, 2012) indicates that boys may be more responsive to
learning-oriented school environments, suggesting that school climate may be a
crucial factor in engaging boys.
A recurring theme emerging from the analyses is the importance of the quality of
the teacher–student relationship. While it is difficult to determine whether
teachers rate child outcomes more negatively because they have a conflictual
relationship with them or children react to more difficult relationships by
disengaging, it is clear that even at this early stage of the educational career,
differences in the teacher–student relationship are evident and these differences
are structured by gender, social background and having a SEN. In policy terms,
these findings highlight the importance of emphasising a positive school and
The transition to primary education |119
classroom climate and of supporting student and practising teachers to build
positive relationships with all students. There are implications for initial and
continuous teacher education in finding means of contesting the ways in which
some groups of students become seen as ‘challenging’ within the classroom
context. Future waves of the GUI survey will allow for a more detailed analysis of
the extent to which these early relationships and experiences set the tone for later
educational engagement.
120|References
REFERENCES
Augustine, J. M., S. E. Cavanagh and R. Crosnoe (2009). ‘Maternal education, early child care and the reproduction of advantage’, Social Forces, Vol. 88, No. 1, pp. 1–29.
Banks, J., and S. McCoy (2011). A study on the prevalence of special educational needs, Dublin: NCSE.
Booth, A. and A. C. Crouter, A.C. (eds.) (2008). Disparities in school readiness, New York: Laurence Erlbaum.
Bradbury, B., M. Corak, J. Waldfogel and E. Washbrook (2012). ‘Inequality in early childhood outcomes’, in J. Ermisch, M. Jäntti and T. Smeeding (eds.), From Parents to Children: The Intergenerational Transmission of Disadvantage, New York: Russell Sage Foundation.
Bradshaw, P., J. Hall, T. Hill, J. Mabelis and D. Philo (2012). Growing up in Scotland: Early experiences of primary school, Edinburgh: ScotCen.
Broström, S. (2000). ‘Communication and continuity in the transition from kindergarten to school’, Paper to the European Conference on Quality in Early Childhood Education.
Broström, S. (2003). ‘Problems and barriers in children’s learning when they transit from kindergarten to kindergarten class in school’. European Early Childhood Research Journal, Vol. 1, No. 1, pp. 51-65.
Chowdry, H. and T. McBride (2017). Disadvantage, behaviour and cognitive outcomes, London: Early Intervention Foundation.
Corsaro, W. A. and L. Molinari (2000). ‘Priming events and Italian children's transition from preschool to elementary school: Representations and action’, Social Psychology Quarterly, pp. 16–33.
Datar, A. (2006). ‘Does delaying kindergarten entrance give children a head start?’, Economics of Education Review, Vol. 25, No. 1, pp. 43–62.
Dockett, S., and B. Perry (2002). ‘Who’s ready for what? Young children starting school’, Contemporary Issues in Early Childhood, Vol. 3, No. 1, pp. 67–89.
Dockett, S. and B. Perry (2007). Transitions to school: Perceptions, expectations, experiences, New South Wales: UNSW Press.
Department of Children and Youth Affairs (2009). Guide for parents to the free pre-school year in early childhood care and education, Dublin: Department of Children and Youth Affairs.
Department of Education and Skills (2017). Síolta user mannual, Dublin: Department of Education and Skills.
Duncan, G. J., C. J. Dowsett, A. Claessens, K. Magnuson, A. C. Huston, P. Klebanov and H. Sexton (2007). ‘School readiness and later achievement’, Developmental Psychology, Vol. 43, No. 6, pp. 1428.
Einarsdottir, J. (2003). ‘When the bell rings we have to go inside: Preschool children’s views on the elementary school’, European Early Childhood Education Research Journal, Vol. 1, p. 35–49.
The transition to primary education |121
Einarsdottir, J. (2007). ‘Children’s voices on the transition from preschool to primary school’, in A.W. Dunlop and H. Fabian (eds.), Informing transitions in the early years, Maidenhead: Open University Press.
Elliott, C. D., P. Smith and K. McCulloch (1996). British Ability Scales, second edition (BAS II). Administration and scoring manual, London: Nelson.
Erikson, R. (1984). ‘Social class of men, women and families’, Sociology, Vol. 18, No. 4, pp. 500–514.
Ermisch, J., M. Jäntti and T. Smeeding (eds.) (2012). From parents to children: The intergenerational transmission of disadvantage, New York: Russell Sage Foundation.
Fallon, J. and C. O’Sullivan (2015). ‘Teachers’ beliefs about play in the infant classes of primary schools in the Republic of Ireland’, Paper presented at the 25th EECERA Annual Conference, Barcelona.
Farkas, G. and J. Hibel (2008). ‘Being unready for school: Factors affecting risk and resilience’, in A. Booth and A.C. Crouter (eds.), Disparities in school readiness, New York: Laurence Erlbaum.
Fredriksson, P. and B. Öckert (2014). ‘Life‐cycle effects of age at school start’, The Economic Journal, Vol. 124, No. 579, pp. 977–1004.
French, G. (2007). Children’s early learning and development, Dublin: NCCA.
Girard, L. C., J. B. Pingault, O. Doyle, B. Falissard and R. E. Tremblay (2017). ‘Expressive language and prosocial behaviour in early childhood: Longitudinal associations in the UK Millennium Cohort Study’, European Journal of Developmental Psychology, Vol. 14, No. 4, pp. 381–398.
Goldstein, H. (2003). Multilevel statistical models, London: Wiley.
Goodman, R. (1997). ‘The Strengths and Difficulties Questionnaire: A research note’, Journal of Child Psychology and Psychiatry, Vol. 38, No. 5, pp. 581-586.
Gray, C., and A. Ryan (2016). ‘Aistear vis-à-vis the primary curriculum: The experiences of early years teachers in Ireland’, International Journal of Early Years Education, Vol. 24, No. 2, pp. 188–205.
Hansen, K. and E. Jones (2008). ‘Foundation stage profile and devolved administration teacher survey’, in K. Hansen and H. Joshi (eds.), Millennium Cohort Study Third Survey: A user’s guide to initial findings, London: Centre for Longitudinal Studies.
Hansen, K., E. Jones, H. Joshi and D. Budge (2010). Millennium cohort study fourth survey: A user’s guide to initial findings, London: Centre for Longitudinal Studies, University of London.
Hartas, D. (2011). ‘The ecology of young children’s behaviour and social competence: Child characteristics, socio-economic factors and parenting’, Oxford Review of Education, Vol. 37, No. 6, pp. 763–783.
Hartas, D. (2015). ‘Parenting for social mobility? Home learning, parental warmth, class and educational outcomes’, Journal of Education Policy, Vol. 30, No. 1, pp. 21–38.
122|References
Hayes, N., J. O’Flaherty and M. Kernan (1997). A window on early education in Ireland: the First National Report of the IEA Preprimary Project, Dublin: Dublin Institute of Technology.
Jones, K. (1991). Multi-level models for geographical research, Norwich: University of East Anglia.
Kennedy, M., E. Dunphy, B. Dwyer, G. Hayes, T. McPhilips, J. Marsh, M. O’Connor and G. Shiel (2012). Literacy in early childhood and primary education (3–8 years), Dublin: NCCA.
Kernan, M. (2007). Play as a context for early learning and development, Dublin: NCCA.
Lee, V.E. and D. E. Burkam (2002). Inequality at the starting gate, Washington, DC: Economic Policy Institute.
Legewie, J. and T. A. DiPrete (2012). ‘School context and the gender gap in educational achievement’, American Sociological Review, Vol. 77, No. 3, pp. 463-485.
McCoy, S., and J. Banks (2012). ‘Simply academic? Why children with special educational needs don’t like school’, European Journal of Special Needs Education, Vol. 27, No. 1, pp. 81–97.
McCoy, S., A. Quail and E. Smyth (2014). ‘The effects of school social mix: Unpacking the differences’. Irish Educational Studies, Vol. 33, No. 3, pp. 307–330.
McCoy, S., E. Smyth and J. Banks (2012). The primary classroom: Insights from the Growing Up in Ireland study, Dublin: ESRI/NCCA.
McCrory, C., J. Williams, A. Murray, A. Quail and M. Thornton (2013). Design, Instrumentation and Procedures for the Infant Cohort at Wave Two (3 Years). Dublin: DCYA.
McGettigan, I. L. and C. Gray (2012). ‘Perspectives on school readiness in rural Ireland: the experiences of parents and children’. International Journal of Early Years Education, Vol. 20, No. 1, pp. 15-29.
McGinnity, F., P. McMullin, A. Murray and H. Russell (2017). ‘Social inequality in cognitive outcomes in Ireland: What is the role of the home-learning environment and childcare?’, in H.P. Blossfeld, N. Kulic, J. Skopek and M. Triventi (eds.), Childcare, early education and social inequality: An international perspective, Cheltenham: Edward Elgar.
McGinnity, F., A. Murray and S. McNally (2013). Mothers’ return to work and childcare choices for infants in Ireland. Dublin: DCYA.
McGinnity, F., H. Russell and A. Murray (2015). Non-parental childcare and child cognitive outcomes at age 5, Dublin: ESRI.
McKeown, K., T. Haase and J. Pratschke (2015). ‘Determinants of child outcomes in a cohort of children in the free pre-school year in Ireland, 2012/2013’, Irish Educational Studies, Vol. 34, No. 3, pp. 245–263.
Murray, A., J. Williams, E. McNamara (forthcoming). The lives of five-year-olds: from birth to five years, Dublin: DCYA.
NCCA (2009a). Aistear: The Early Childhood Curriculum Framework, Dublin: NCCA.
NCCA (2009b). Aistear User Guide, Dublin: NCCA.
The transition to primary education |123
NCCA (2009c). Aistear, the Early Childhood Curriculum Framework, and Síolta, the National Quality Framework for Early Childhood Education. Audit: Similarities and differences, Dublin: NCCA/DES.
NCCA (2018a). Preschool to Primary School Transition Initiative: Final Report, Dublin: NCCA.
NCCA (2018b). Primary developments: Consultation on curriculum structure and time. Final report, Dublin: NCCA.
O'Connor, D., and J. Angus (2014). ‘Give them time – An analysis of school readiness in Ireland’s early education system: A Steiner Waldorf perspective, Education 3-13, Vol. 42, No. 5, pp. 488–497.
O’Kane, M. (2007). Building bridges: The transition from ECCE setting to primary school for children in Ireland, Dublin: Dublin Institute of Technology, PhD thesis.
O’Kane, M. (2016). Transition from preschool to school, Dublin: NCCA.
O’Kane, M. and R. Murphy (2016a). Transition from preschool to school: Audit of transfer documentation in Ireland, Dublin: NCCA.
O’Kane, M. and R. Murphy (2016b). Transition from preschool to school: Audit of policy in 14 jurisdictions, Dublin: NCCA.
Peters, S. (2010). Literature review: Transition from early childhood education to school, Report to the Ministry of Education, New Zealand.
PFL Evaluation Team (2016). Did Preparing for Life Improve children’s school readiness?, Dublin: UCD Geary Institute.
Pianta, R. C. (1992). Child-parent relationship scale, Unpublished measure, University of Virginia.
Pianta, R. C. and M. W. Stuhlman (2004). ‘Teacher-child relationships and children's success in the first years of school’, School Psychology Review, Vol. 33, No. 3, pp. 444-458.
Pianta, R. C., and M. J. Cox (1999). The transition to kindergarten. A series from the National Center for Early Development and Learning, York, PA: Paul H. Brookes Publishing.
Pramling, I., and P. Williams-Graneld (1993), Starting compulsory school. Paper to the New Zealand Association for Research in Education.
Rasbash, J., F. Steele, W.J. Browne and H. Goldstein (2012). A user’s guide to MLWiN, Bristol: University of Bristol.
Ring, E., M. Mhic Mhathúna, M. Moloney, N. Hayes, D. Breathnach, P. Stafford, D. Carswell, S. Keegan, C. Kelleher, D. McCafferty, A. O’Keeffe, A. Leavy, R. Madden and M. Ozonyia (2016). An examination of concepts of school readiness among parents and educators in Ireland, Dublin: Department of Children and Youth Affairs.
Russell, H., O. Kenny and F. McGinnity (2016). Childcare, early education and socio-emotional outcomes at age 5, Dublin: ESRI.
Sammons, P. (2010). ‘Does pre-school make a difference? Identifying the impact of pre-school on children’s cognitive and social behavioural development at different ages’, in K. Sylva, E. Melhuish, P. Sammons, I. Siraj-Blatchford and B. Taggart (eds.), Early childhood matters: Evidence from the Effective Pre-school and Primary Education Project, Abingdon: Routledge.
124|References
Sammons, P., K. Toth and K. Sylva (2015). Pre-school and early home learning effects on A-level outcomes, London: Department for Education.
Sharp, C. (2002). ‘School starting age: European policy and recent research’, Paper to the LGA Seminar on When Should Our Children Start School, Slough: NFER.
Skelton, C., Francis, B., & Smulyan, L. (Eds.). (2006). The SAGE handbook of gender and education, London: Sage.
Smyth, E. (2007). ‘Gender and education’, in R. Teese, S. Lamb and M. Duru-Bellat (eds.), International Studies in Educational Inequality, Theory and Policy, Dordrecht: Springer, pp. 135–153.
Smyth, E. (2016). Students’ experiences and perspectives on secondary education: Institutions, transitions and policies, London: Palgrave Macmillan.
Smyth, E. (2015). Wellbeing and school experiences among 9- and 13-year-olds: Insights from the Growing Up in Ireland study, Dublin: ESRI/NCCA.
Stevenson, D.L. and D. P. Baker (1987). ‘The family–school relation and the child’s school performance’, Child Development, Vol. 58, No. 5, pp. 1348–1357.
Sullivan, A., S. Ketende and H. Joshi (2013). ‘Social class and inequalities in early cognitive scores’, Sociology, Vol. 47, No. 6, pp. 1187-1206.
Sylva, K., E. Melhuish, P. Sammons, I. Siraj-Blatchford and B. Taggart (eds.) (2010). Early childhood matters: Evidence from the Effective Pre-school and Primary Education Project, London: Routledge.
Vernon-Feagans, L., E. Odom, N. Pancsofar and K. Kainz (2008). ‘Comments on Farkas and Hibel: A transactional/ecological model of readiness and inequality’, in A. Booth and A.C. Crouter (eds.), Disparities in school readiness, New York: Laurence Erlbaum.
The Transition to Primary Education
Insights from the Growing Up in Ireland Study
Emer Smyth