
The Transatlantic Economy 2017 - WKO.at
41
The Transatlantic Economy 2017 Daniel S. Hamilton and Joseph P. Quinlan Center for Transatlantic Relations, Johns Hopkins University SAIS .
Transcript of The Transatlantic Economy 2017 - WKO.at

The Transatlantic Economy 2017
Daniel S. Hamilton and Joseph P. Quinlan Center for Transatlantic Relations, Johns Hopkins University SAIS
.

2017 – The Agenda is Damage Limitation
• Buy American, Hire American
• Potential Steel Tariffs
• Tax Reform Ripples to Europe
• NAFTA Renegotiation: Implications for Europe
• Pressures on WTO
• Focus on Trade Deficits
• Tweet – for – Tweet Temptations
• Privacy Shield
• China Market Economy Status

Brexit Scenarios• UK/EU27: 3 sets of negotiations:
– Terms of divorce (UK pay; rights of citizens; N. Ireland; ECJ);
– future relationship in trade, security, and other matters;
– transitional arrangements.
• Timetable:
– If sufficient progress, other negotiations start January 2018.
– UK Brexit March 29, 2019
– UK Stays in Customs Union and Single Market until Dec 31, 2020.
• Models:
• Soft variants ruled out: “Norwegian”; EEA; “Swiss”; Customs Union
• Hard variants remaining:
– “Cliff Edge:” No deal, WTO terms apply
– UK-EU FTA: CETA Plus
– UK-EU Zero Tariff Agreement
– UK-US FTA
– UK-US-EU Tripartite Arrangements

NOW WHAT?
• What do the facts tell us?
• Can we afford to walk away?

The State of the Transatlantic Economy:
•Despite turbulence, US/Europe each other’s most
important markets. No other commercial artery in the world
is as integrated.
•Transatlantic gaps in growth, job creation and trade all
narrowed in 2016.
•The transatlantic economy generates $5.5 trillion in total
commercial sales a year and employs up to 15 million
workers in mutually “onshored” jobs on both sides of the
Atlantic.
•Largest and wealthiest market in the world
•1/3 world GDP in terms of purchasing power
•66% of outward stock and 57% of inward stock of
global FDI

33,5%
27,4%
31,3%
57,4%
66,4%
81,0%
59,8%
0%
10%
20%
30%
40%
50%
60%
70%
80%
90%
World GDP World Exports World Imports World FDIInward Stock
World FDIOutward Stock
World M&ASales
World M&APurchases
Share of World Total
Sources: UN, IMF, figures for 2015.1. Based on PPP estimates.2. Excluding intra-EU, Norway, Switzerland and Iceland trade.
The Transatlantic Economy vs. The World
1 22

U.S
. $
tri
llio
ns
America's Major Commercial Arteries
Transatlantic
Total Foreign
Affiliate Sales
Latin America
Total Foreign
Affiliate Sales
NAFTA
Total TradeAsia/Pacific
Total Foreign
Affiliate Sales
Asia/Pacific
Total Trade
Latin America
Total TradeTransatlantic
Total Trade
NAFTA
Total Foreign
Affiliate Sales
$5.5 Trillion
$1.7 Trillion
$2.9 Trillion
$1.1 Trillion$1.2 Trillion$1.3 Trillion$1.3 Trillion$1.3 Trillion
Foreign Affiliate Sales: Estimates for 2015. Total Trade: Data for goods & services, 2015.
Source: Bureau of Economic Analysis.

57,6%
60,8%
65,5%
54%
56%
58%
60%
62%
64%
66%
1990-1999 2000-2009 2010-3Q2016
U.S. FDI Flows to Europe
(% of World Total*)
*Excluding Caribbean and Other Western Hemisphere.
Source: Bureau of Economic Analysis.
Data as of December 2016.
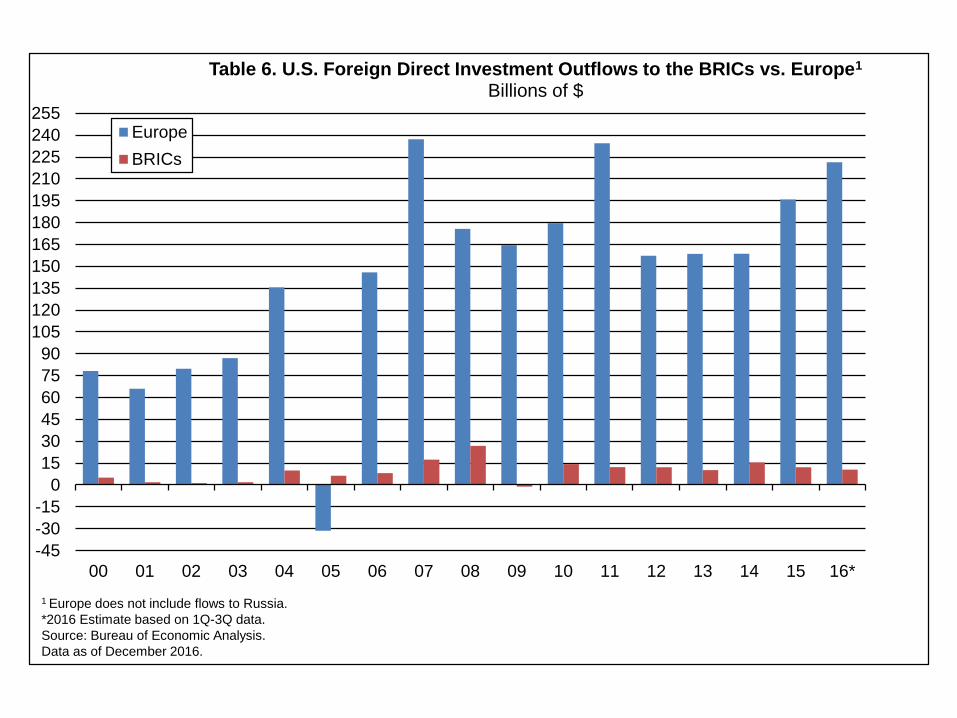
-45
-30
-15
0
15
30
45
60
75
90
105
120
135
150
165
180
195
210
225
240
255
00 01 02 03 04 05 06 07 08 09 10 11 12 13 14 15 16*
Table 6. U.S. Foreign Direct Investment Outflows to the BRICs vs. Europe1
Billions of $
Europe
BRICs
1 Europe does not include flows to Russia.
*2016 Estimate based on 1Q-3Q data.
Source: Bureau of Economic Analysis.
Data as of December 2016.

Europe; 46,7%
NAFTA (Canada/Mexico);
14,3%
South America;
6,9%
Africa/Middle East; 4,2%
Asia and Pacific; 21,7%
Other*; 6,1%
Europe
NAFTA (Canada/Mexico)
South America
Africa/Middle East
Asia and Pacific
Other*
U.S. FDI Outflows Excluding Flows to Nonbank Holding Companies, 2009-2015
(% of Total)
*Includes Central America (excluding Mexico) and Other Western Hemisphere.
Source: Bureau of Economic Analysis.
Data as of February 2017.
0
200
400
600
800
1.000
1.200
1.400
1.600
1.800
2.000
2.200
2.400
2.600
2.800
3.000
3.200
3.400
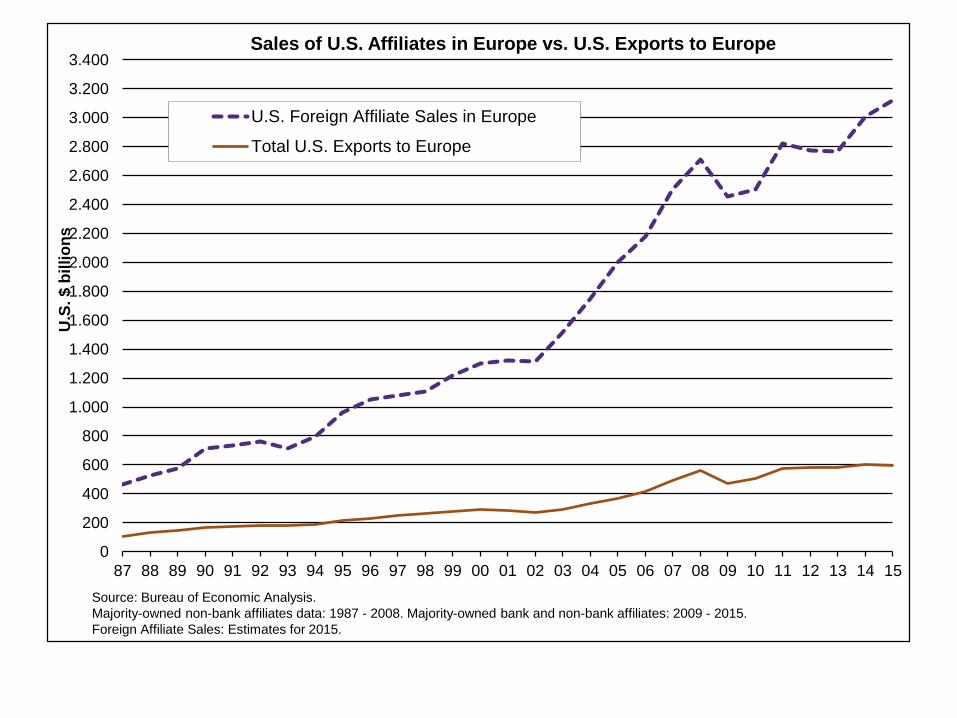
87 88 89 90 91 92 93 94 95 96 97 98 99 00 01 02 03 04 05 06 07 08 09 10 11 12 13 14 15
U.S
. $
bil
lio
ns
Sales of U.S. Affiliates in Europe vs. U.S. Exports to Europe
U.S. Foreign Affiliate Sales in Europe
Total U.S. Exports to Europe
Source: Bureau of Economic Analysis.
Majority-owned non-bank affiliates data: 1987 - 2008. Majority-owned bank and non-bank affiliates: 2009 - 2015.
Foreign Affiliate Sales: Estimates for 2015.


50
100
150
200
250
300
350
400
450
500
550
600
650
700
750
800
2004 2005 2006 2007 2008 2009 2010 2011 2012 2013 2014 2015
U.S
. $
bil
lio
ns
U.S. - Europe Services Linkages
U.S. Affiliates Services Supplied in Europe
U.S. Service Exports to Europe
Source: Bureau of Economic Analysis.
Majority-owned bank and non-bank affiliates. Services supplied in Europe estimates for 2015.

50
100
150
200
250
300
350
400
450
500
550
600
2004 2005 2006 2007 2008 2009 2010 2011 2012 2013 2014 2015
U.S
. $
bil
lio
ns
Europe - U.S. Services Linkages
European Affiliates Services Supplied in the U.S.
U.S. Service Imports from Europe
Source: Bureau of Economic Analysis.
Majority-owned bank and non-bank affiliates. Services supplied in the U.S. estimates for 2015.
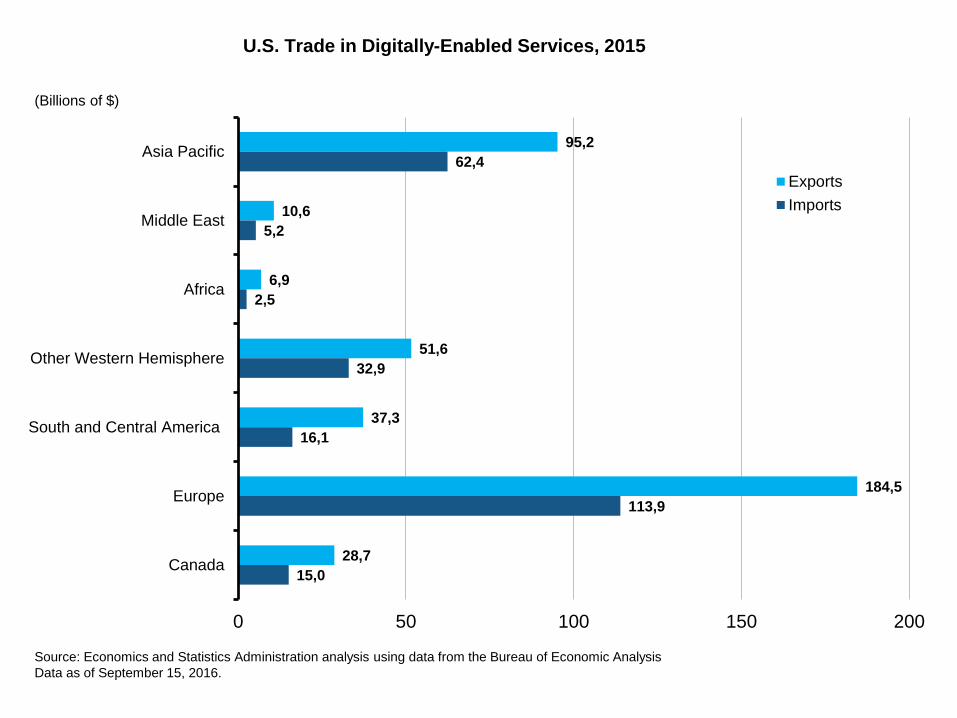
95,2
10,6
6,9
51,6
37,3
184,5
28,7
62,4
5,2
2,5
32,9
16,1
113,9
15,0
0 50 100 150 200
Asia Pacific
Middle East
Africa
Other Western Hemisphere
South and Central America
Europe
Canada
Exports
Imports
Source: Economics and Statistics Administration analysis using data from the Bureau of Economic Analysis
Data as of September 15, 2016.
(Billions of $)
U.S. Trade in Digitally-Enabled Services, 2015
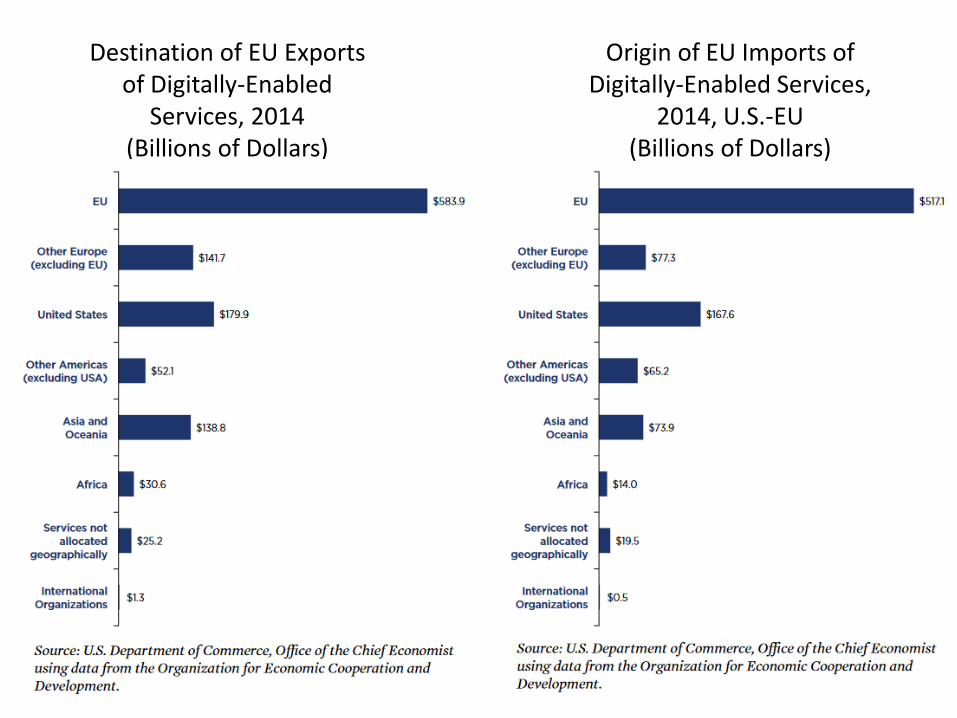
Destination of EU Exports of Digitally-Enabled
Services, 2014 (Billions of Dollars)
Origin of EU Imports of Digitally-Enabled Services,
2014, U.S.-EU (Billions of Dollars)
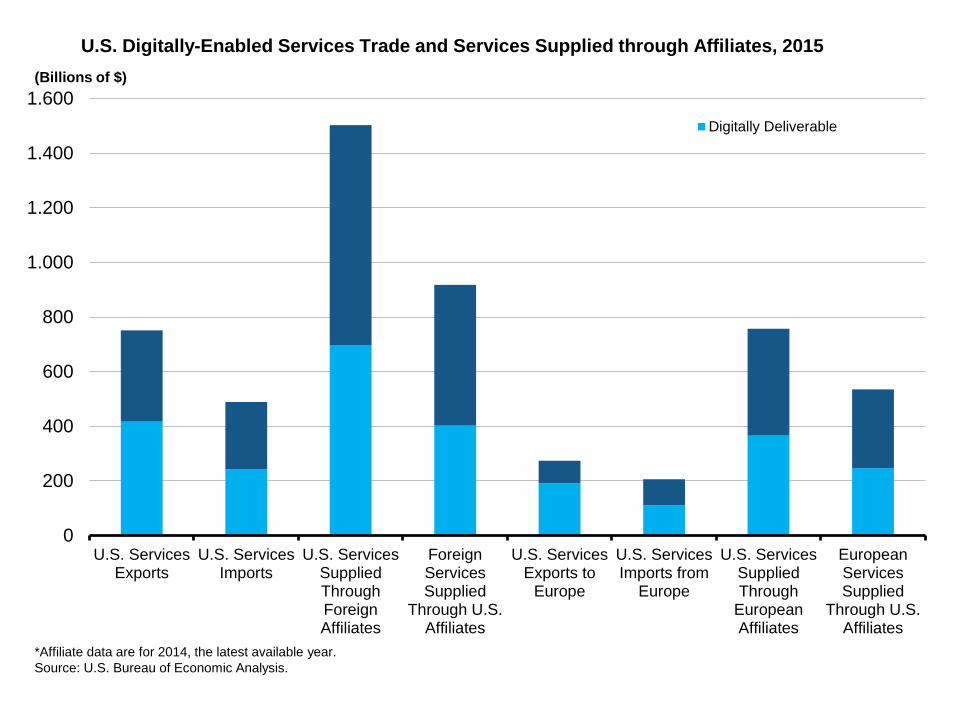
0
200
400
600
800
1.000
1.200
1.400
1.600
U.S. ServicesExports
U.S. ServicesImports
U.S. ServicesSuppliedThroughForeignAffiliates
ForeignServicesSupplied
Through U.S.Affiliates
U.S. ServicesExports to
Europe
U.S. ServicesImports from
Europe
U.S. ServicesSuppliedThrough
EuropeanAffiliates
EuropeanServicesSupplied
Through U.S.Affiliates
Digitally Deliverable
U.S. Digitally-Enabled Services Trade and Services Supplied through Affiliates, 2015
*Affiliate data are for 2014, the latest available year.
Source: U.S. Bureau of Economic Analysis.
(Billions of $)

U.S.- Based European Affiliates Account for Over Half of all U.S. Exports of Goods Shipped by U.S.-Based Foreign Affiliates
U.S. Exports of Goods Shipped by Affiliates [$millions]
All Countries Total 425,205
Europe 227,799 [54%]
UK 73,483 [17%]
Germany 45,014 [11%]
France 22,720 [ 5%]
Switzerland 20,510 [ 5%]
Netherlands 18,547 [ 4% ]
TOP 5 Account for 42 %
U.S.-Based foreign affiliates account for 26% of all U.S. goods exports.
Europe is the destination for 68% of U.S. goods exports by U.S.-based foreign affiliates
Source – BEA.

The Transatlantic Triangle – US, UK, EU• US is Britain’s largest export destination after the EU.
• Real driver of the British-American economy is investment. 2015, U.S. FDI in UK record $593.0 billion/UK FDI in US $483.8 billion. Sales of US/UK affiliates > $1.3 trillion.
• The UK accounted for 22% of overall global U.S. assets outside the United States.
• U.S. affiliates employ almost 1.4 million workers in the UK while UK affiliates employ roughly 1.1 million Americans.
• British firms #1 source of onshored jobs in 25 of the 50 U.S. states in 2014.
• US capital stock in UK ($593 billion) 2x combined U.S. investment in South America, Middle East and Africa ($244 billion). Total U.S. investment stock in China 13% of that in UK.
• Many U.S. companies invest in the UK, however, to gain access to the much bigger EU Single Market. U.S. affiliates based in the UK export more to the rest of Europe than U.S. affiliates based in China export to the rest of the world.
• EU is UK’s most important market. UK exports almost half of its goods and services to the EU — twice as much as to the US.
• Vital that all three legs of the transatlantic stool remain strong and sturdy.

NOW WHAT?
FUTURE SCENARIOS
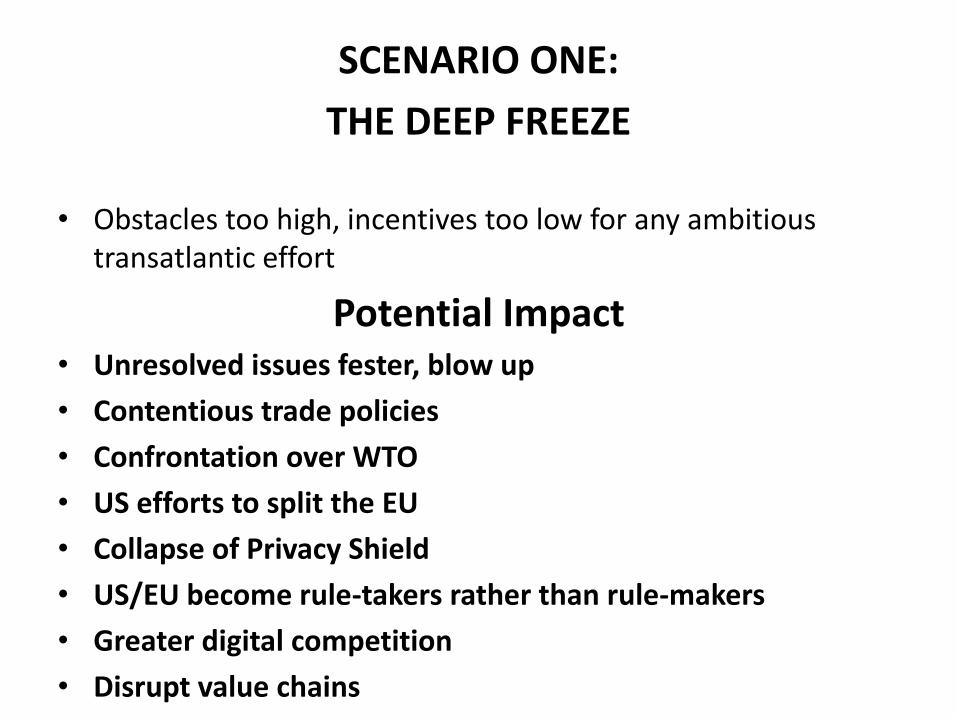
SCENARIO ONE:
THE DEEP FREEZE
• Obstacles too high, incentives too low for any ambitious transatlantic effort
Potential Impact• Unresolved issues fester, blow up
• Contentious trade policies
• Confrontation over WTO
• US efforts to split the EU
• Collapse of Privacy Shield
• US/EU become rule-takers rather than rule-makers
• Greater digital competition
• Disrupt value chains

SCENARIO TWO:
ORGAN HARVESTING• Harvest whatever wins you can from comatose TTIP
• US-EU Zero Tariff Agreement on Goods
• Case by case agreements on regulatory cooperation
POTENTIAL IMPACT• Momentum on goods trade; impact on jobs minimal
• Piecemeal progress on individual issues
• Can shift some regulatory attention to higher-risk countries
• Selective progress as global rule-makers
• Low profile: unlikely to succeed without high-profile push
• Does little to reposition for greater global competition
• Insufficient to mitigate privacy/tax/other disputes

SCENARIO THREE:
TTIP – THE SEQUEL• Seek Transatlantic Zero on Goods; open services markets;
public procurement; rules of origin
• Seek regulatory cooperation, sectoral agreements, aligned on TBTs, SPS
POTENTIAL IMPACT• Difficult to achieve with Trump and current Commission
• Toxic public reaction, especially in Austria/Europe
• Greater public anxieties re. trade
• ISDS a deal-breaker
• Little chance of progress re. labor/environment
• Does not address Brexit

SCENARIO FOUR:
THE NORTH ATLANTIC MARKETPLACE• Drop TTIP in favor of a focus on Jobs and Growth in the North Atlantic.
• Not a ‘single undertaking’ limited to US-EU; multi-channel initiative
• Seek series of bilateral Jobs and Growth Agreements, not only US-EU but also US-UK, UK-EU, US-non-EU Europe, EU/Canada/Mexico etc.
• a) jobs and growth: workforce development; SMEs; innovation economy; digital economy.
• b) tackle trade barriers to these goals.
• c) Split investment from trade; Exclude ISDS; affirm the primacy of domestic law.
• d) Regulatory cooperation should be about helping regulators become more efficient and effective at protecting their citizens in ways that are democratically legitimate and accountable, and not primarily about removing or reducing ‘non-tariff barriers to trade’. Limit to goods and services traded between the two parties. Apply only to executive agencies, not legislative bodies.
• e) align policies to 3rd countries such as China.

POTENTIAL IMPACT• Recognizes new dynamics of Europe/Brexit.
• Seeks to strengthen each foundation of North Atlantic space.
• Addresses anxieties about jobs and growth.
• Addresses popular critique of ISDS, regulatory harmonization.
• Addresses concerns about lower 3rd country standards; repositions North America and Europe as rule-makers.
• Difficult to manage/different tracks.
• Requires high level support, not limited to trade officials.


0
2
4
6
8
10
12
2004 2005 2006 2007 2008 2009 2010 2011 2012 2013 2014 2015
U.S.
Europe
Chinese Foreign Direct Investment Outflows - U.S. and Europe
(Billions of U.S. $)
Source: China National Bureau of Statistics/Haver Analytics.
Data as of January 2017.
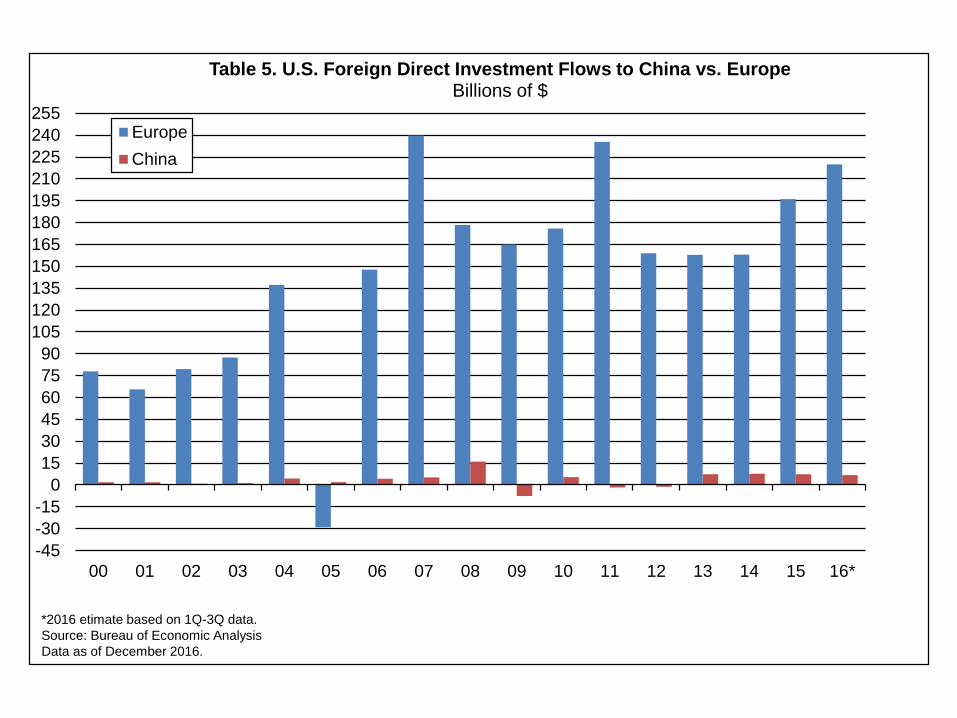
-45
-30
-15
0
15
30
45
60
75
90
105
120
135
150
165
180
195
210
225
240
255
00 01 02 03 04 05 06 07 08 09 10 11 12 13 14 15 16*
Table 5. U.S. Foreign Direct Investment Flows to China vs. EuropeBillions of $
Europe
China
*2016 etimate based on 1Q-3Q data.
Source: Bureau of Economic Analysis
Data as of December 2016.

Top 20 US States Total Goods Exports to Europe, by Value($Billion)
U.S. State 2015 U.S. State 2015
California 33.1 2.4x > China Ohio 9.5 2.4x >
Texas 31.9 2.8x > China Florida 9.0 8.0x >
New York 28.2 7.5x > China Georgia 9.0 3.4x >
Washington 14.2 1.4x < China New Jersey 9.0 5.9x >
Illinois 12.3 2.6 > China Kentucky 8.3 4.2x >
Louisiana 10.7 1.6 > China North Carolina 7.0 3.3x >
Pennsylvania 10.5 5.0 > China Michigan 6.9 2.2x >
South Carolina 9.8 2.2 > China Connecticut 6.3 6.1x >
Massachusetts 9.5 4.7 > China Tennessee 6.2 2.8x >
Indiana 9.5 7.5 > China Virginia 5.0 3.0x >
U.S. Total $319.7 Billion
Source: Foreign Trade Division, U.S. Census Bureau

48 51
58
66
54
65
86
114
136
154
176
197
179
217 217222
234
246237
245
30
40
50
60
70
80
90
100
110
120
130
140
150
160
170
180
190
200
210
220
230
240
250
260
1997 1998 1999 2000 2001 2002 2003 2004 2005 2006 2007 2008 2009 2010 2011 2012 2013 2014 2015 2016*
U.S
. $
bil
lio
ns
U.S. Earnings in Europe(U.S. foreign affiliate income from Europe)
Source: Bureau of Economic Analysis
*Data for 2016 is estimate.

The Expanding Digital FrontierSources: GMSA Intelligence; McKinsey Global
Institute; Author’s own estimates.

42%
53%
21%
14%
3%
12%
2%
2%
33%
19%
0%
10%
20%
30%
40%
50%
60%
70%
80%
90%
100%
U.S. Exports to EU EU Exports to the U.S.
Royalties and Licensing Fees
Telecommunications
Insurance
Financial
Business, Professional, &Technical
U.S. - EU Digitally-Enabled Services Trade by Sector, 2015
Sources: U.S. Trust Market Strategy Team®; U.S. Bureau of Economic Analysis.
Data as of December 2016.

Digital Leaders & Laggards in Europe & the United States

U.S. STATES:
TOP AUSTRIAN GOODS EXPORT DESTINATIONS
($ millions, 2016)
1. California 1,398.7
2. South Carolina 1,081.8
3. Georgia 875.6
4. Virginia 805.1
5. Pennsylvania 741.9
6. New Jersey 705.0

GOODS:
TOP FIVE U.S. IMPORTS FROM AUSTRIA
($ Millions, 2016)
• $10.9 billion (6.3% Austrian global exports; 21.3% excl. EU)
• Related party trade: 22% of total U.S. imports from Austria
1. Machinery and Transport Equipment 5,047.7
2. Chemicals and Related Products 2,233.9
3. Miscellaneous Manufactured Articles 1,241.1
4. Manufactured Goods by Material 1,217.1
5. Beverages and Tobacco 723.5

SERVICES:
TOP SIX U.S. IMPORTS FROM AUSTRIA
($ Millions, 2015)• $1.6 billion total
1. Travel (including education) 622.0
2. Transportation services 616.0
3. Other business services 143.0
4. Telecom, computer and information 60.0
5. Intellectual property 55.0
6. Financial services 32.0
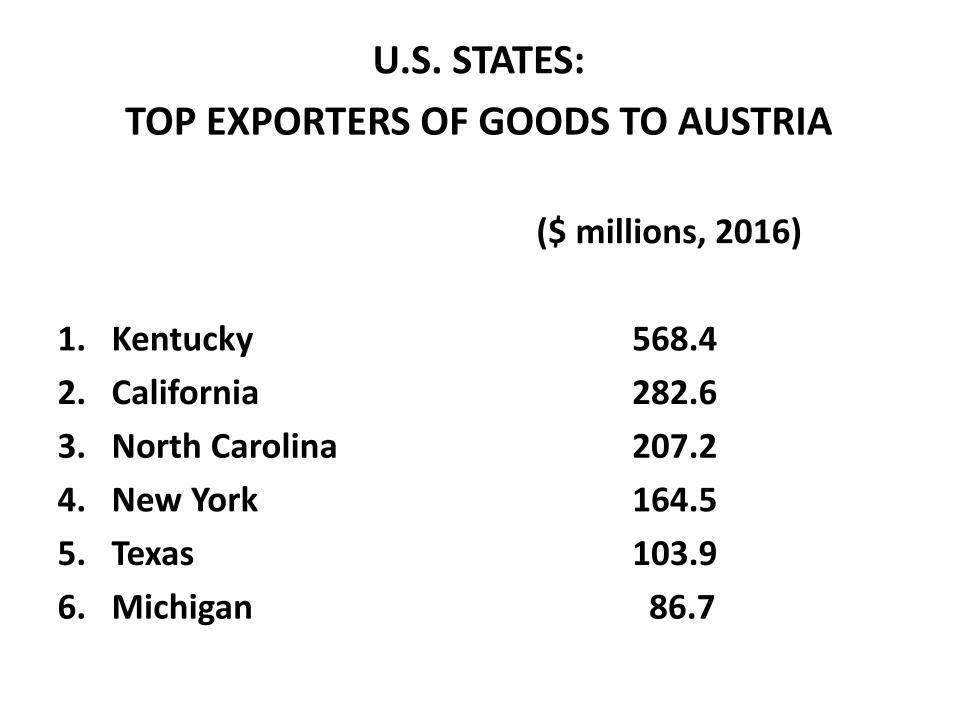
U.S. STATES:
TOP EXPORTERS OF GOODS TO AUSTRIA
($ millions, 2016)
1. Kentucky 568.4
2. California 282.6
3. North Carolina 207.2
4. New York 164.5
5. Texas 103.9
6. Michigan 86.7

GOODS:
TOP FIVE U.S. EXPORTS TO AUSTRIA
• Total: $3.8 billion (2.3% global total; 10.5% excl. inner-EU)
• Related party trade: 66% of total U.S. exports to Austria
1. Chemicals and Related Products 2,192.9
2. Machinery and Transport Equipment 702.6
3. Miscellaneous Manufactured Articles 355.9
4. Commodities and Transactions not
classified elsewhere 228.2
5. Manufactured Goods by Material 155.6

SERVICES:
TOP FIVE EXPORTS TO AUSTRIA
($millions, 2015)• Total: $1.6 billion
1. Travel (including education) 664.0
2. Intellectual property 342.0
3. Transportation services 161.0
4. Financial services 161.0
5. Other business services 118.0

AUSTRIA – U.S. GLOBAL LINKAGES 2016
($ BILLIONS)US in Austria in
Austria US___
Foreign Direct Investment 17.3 7.1
Total Assets of Affiliates 40.4 7.7
Foreign Affiliate Sales 22.7 8.3
Foreign Affiliate Income 2.6 0.6
Value Added of Affiliates 6.1 1.8
Affiliate Employees 46,184 16,974