The Total Economic Impact™ Of Microsoft 365 On End User ...
23
A Forrester Total Economic Impact™ Study Commissioned By Microsoft July 2019 The Total Economic Impact ™ Of Microsoft 365 On End User Productivity Employee Productivity Benefits Enabled By Microsoft 365
Transcript of The Total Economic Impact™ Of Microsoft 365 On End User ...

A Forrester Total Economic Impact™
Study Commissioned By Microsoft
July 2019
The Total Economic Impact™ Of Microsoft 365 On End User Productivity
Employee Productivity Benefits Enabled By Microsoft 365

Table Of Contents Executive Summary 1
Key Findings 2
TEI Framework And Methodology 4
The Microsoft 365 Customer Journey 5
Interviewed Organizations 5
Key Challenges 5
Key Results 6
Composite Organization 6
Analysis Of Benefits 7
Productivity Gains From Improved Collaboration, Communication, And File Sharing 7
Efficiency From Improved Mobile Access 9
Savings From Reduced Travel 10
Reduced User Downtime 11
Unquantified Benefits 13
Flexibility 13
Analysis Of Costs 14
License Costs 14
Planning, Implementation, And Deployment Costs 14
Training Costs 16
Financial Summary 17
Microsoft 365: Overview 18
Appendix A: Total Economic Impact 20
Appendix B: Supplemental Material 21
Project Director:
Corey McNair
Project Contributor:
Nicholas Ferrif
ABOUT FORRESTER CONSULTING
Forrester Consulting provides independent and objective research-based
consulting to help leaders succeed in their organizations. Ranging in scope from a
short strategy session to custom projects, Forrester ’s Consulting services connect
you directly w ith research analysts w ho apply expert insight to your specif ic
business challenges. For more information, visit forrester.com/consulting.
© 2019, Forrester Research, Inc. All rights reserved. Unauthorized reproduction
is strictly prohibited. Information is based on best available resources.
Opinions reflect judgment at the time and are subject to change. Forrester®,
Technographics®, Forrester Wave, RoleView , TechRadar, and Total Economic
Impact are trademarks of Forrester Research, Inc. All other trademarks are the
property of their respective companies. For additional information, go to
forrester.com.

1 | The Total Economic Impact™ Of Microsoft 365 On End User Productivity
Executive Summary
Improving employee productivity is an ongoing challenge for organizations of all shapes and sizes. Too often, the day-to-day grind of packed work schedules can result in employee fatigue and reduced effort levels. Meanwhile, a lack of communication and collaboration among team members can result in project workflow coming to a standstill. Required business trips and device downtime can exacerbate these productivity challenges. For organizations looking to improve employee productivity, utilizing collaboration and communication tools is critical.
Microsoft 365, which consists of Windows 10, Office 365, and Enterprise Mobility + Security (EMS), features a suite of collaboration tools aimed at improving productivity. Applications including OneDrive for Business, SharePoint, and Microsoft Teams provide workers an open line of communication for file sharing and real-time coediting of documents. In addition, employees can work anywhere on the go through new device management features and OneDrive storage. The automation of software updates and document savings promises to reduce user downtime as well.
Microsoft commissioned Forrester Consulting to conduct a Total Economic Impact™ (TEI) study and examine the potential return on investment (ROI) toward end user productivity that enterprises may realize by deploying Microsoft 365. The purpose of this study is to provide readers with a framework to evaluate the potential financial impact of Microsoft 365 on their organizations.
To better understand the benefits, costs, and risks associated with this investment, Forrester interviewed four customers with years of experience using Microsoft 365.
Prior to deploying Microsoft 365, the interviewed IT managers at organizations used Windows 7 and either Office 2010 or 2013. They primarily upgraded to Microsoft 365 for its more affordable licensing, though they were also interested in its applications with collaboration features. The managers recognized an opportunity to improve communication processes within their organizations through the applications. For some of the organizations, M365’s device management features also aligned with initiatives to increase mobile device usage for work.
Since ramping up Microsoft 365 and deploying its applications, the interviewees noted an acceleration in the timeline of projects within their purview. This acceleration was driven by employees making use of multiple Microsoft product features in concert with each other. Employees began regularly coauthoring documents, working more on the go, and using OneDrive and SharePoint to keep project documents synced and up to date. Employees no longer had to wait for emails to move forward with work or wait to get back to their office PCs to continue working.
The ROI shown in this study is reflective of only end user productivity benefits from Microsoft 365. For analysis of the full benefits realized from deploying Microsoft 365, please see the study, “The Total Economic Impact Of Microsoft 365.”
Benefits And Costs
Productivity gains from improved collaboration, communication, and file sharing:
3 hours in weekly time savings per end user
Efficiency from improved mobile access:
2.5 hours in weekly time savings per mobile user
License costs:
$6.59 million

2 | The Total Economic Impact™ Of Microsoft 365 On End User Productivity
Key Findings
Quantified benefits. The following risk-adjusted present value (PV) quantified benefits are representative of those experienced by the
companies interviewed:
› Microsoft 365’s collaboration, communication, and file-sharing tools help end users save 3 hours of labor per week. Workers leveraged key features such as group chats in Teams, coauthoring of documents in OneDrive, and syncing of documents to project folders in
SharePoint to improve collaboration.
› Availability of Microsoft applications and documents on mobile devices helps mobile workers reduce their time spent working on the go by 2.5 hours per week. Microsoft 365 licensing allowed users to access Windows or Office applications through an unlimited number of compatible devices, alongside access to documents from cloud storage through OneDrive. As a result, mobile workers have increased flexibility
over their work environments.
› Conferencing and collaboration tools help organizations avoid paying for 400 trips annually and upwards of 2,400 hours in travel. Organizations have been using video- and audioconferencing solutions to reduce business travel for several years now. Microsoft 365 took another step by ensuring all users at organizations had the same conference solution in Microsoft Teams, and that they could coedit documents in real time. As a result, end users were able to recreate
working sessions remotely.
› Microsoft 365 helps end users reduce their device downtime by 25% annually. Automated updates to Microsoft 365 ensured that all users at interviewed organizations were using the latest version of the software and had a secure connection to the software via any device, preventing any potential viruses or security threats. A 25% reduction in
disruptions represents 1 hour, 52 minutes for users.
Unquantified benefits. The interviewed organizations experienced the following benefits, which are not quantified for this study:
› Productivity savings assist in improving the employee experience. The amount of time savings that end users accrue through using Microsoft 365 lessens the burden of daily challenges like the back-and-forth of emails or inability to access work items. Improved worker attitudes as a result of fewer obstacles leads to less frustration and a
higher quality work output.
Costs. The interviewed organizations experienced the following risk-adjusted PV costs:
› Subscription licensing for Microsoft 365. Organizations paid $35 per user per month for access to the Microsoft 365 E3 license. Subscription license costs began when licenses were deployed to users during the
phased rollout.
› Deployment and training for Microsoft 365. Interviewed organizations varied greatly in their rollout and implementation planning. On average, the initial phase of deployment took 10 months before all users had access at the organizations. Three FTEs were needed for ongoing
administration and management.
ROI 47%
Benefits PV $22.4 million
NPV $7.2 million
Payback 21.0 months

3 | The Total Economic Impact™ Of Microsoft 365 On End User Productivity
› Workers and IT FTE training. Fifteen IT staff participated in five days of training and two days per year thereafter for training to keep up to speed with new features. End users spent 3 hours on upfront training and 1
hour per year on ongoing training.
Forrester’s interviews with four existing customers and subsequent financial analysis found that an organization based on these interviewed organizations experiences benefits of $22,401,718 over three years. versus costs of $15,241,757, adding up to a net present value (NPV) of $7,159,961 and an ROI of 47%.
Total benefit
s PV,
$22.4M
Total costs PV,
$15.2M
Initial Year 1 Year 2 Year 3
Financial Summary
Payback period:
21 months
$15.2M
$6.4M
$658.5K $171.0K
Productivity
gains from
improved
collaboration,
communication,
and file sharing
Efficiency from
improved mobile
access
Savings from
reduced travel
Reduced user
downtime
Benefits (Three-Year)
4 | The Total Economic Impact™ Of Microsoft 365 On End User Productivity
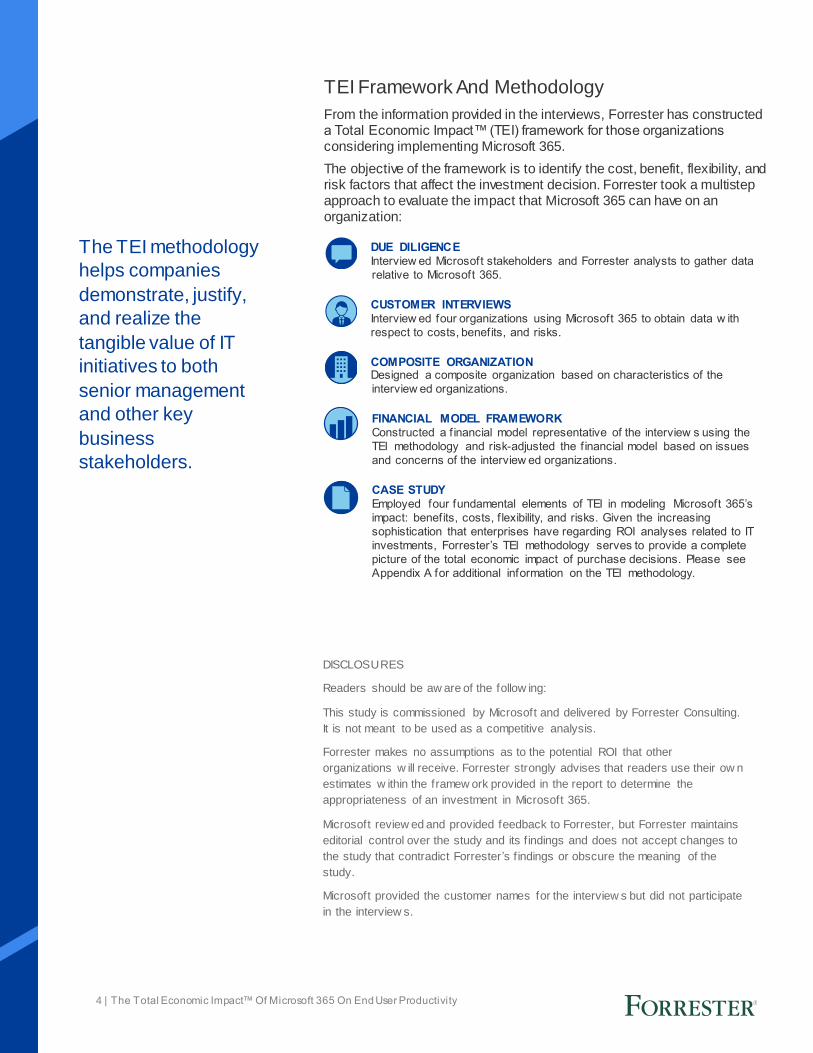
TEI Framework And Methodology
From the information provided in the interviews, Forrester has constructed a Total Economic Impact™ (TEI) framework for those organizations considering implementing Microsoft 365.
The objective of the framework is to identify the cost, benefit, flexibility, and risk factors that affect the investment decision. Forrester took a multistep approach to evaluate the impact that Microsoft 365 can have on an organization:
DUE DILIGENCE
Interview ed Microsoft stakeholders and Forrester analysts to gather data
relative to Microsoft 365.
CUSTOMER INTERVIEWS
Interview ed four organizations using Microsoft 365 to obtain data w ith
respect to costs, benefits, and risks.
COMPOSITE ORGANIZATION Designed a composite organization based on characteristics of the
interview ed organizations.
FINANCIAL MODEL FRAMEWORK
Constructed a f inancial model representative of the interview s using the
TEI methodology and risk-adjusted the f inancial model based on issues
and concerns of the interview ed organizations.
CASE STUDY
Employed four fundamental elements of TEI in modeling Microsoft 365’s
impact: benefits, costs, f lexibility, and risks. Given the increasing
sophistication that enterprises have regarding ROI analyses related to IT
investments, Forrester’s TEI methodology serves to provide a complete
picture of the total economic impact of purchase decisions. Please see
Appendix A for additional information on the TEI methodology.
The TEI methodology
helps companies
demonstrate, justify,
and realize the
tangible value of IT
initiatives to both
senior management
and other key
business
stakeholders.
DISCLOSURES
Readers should be aw are of the follow ing:
This study is commissioned by Microsoft and delivered by Forrester Consulting.
It is not meant to be used as a competitive analysis.
Forrester makes no assumptions as to the potential ROI that other
organizations w ill receive. Forrester strongly advises that readers use their ow n
estimates w ithin the framew ork provided in the report to determine the
appropriateness of an investment in Microsoft 365.
Microsoft review ed and provided feedback to Forrester, but Forrester maintains
editorial control over the study and its f indings and does not accept changes to
the study that contradict Forrester’s f indings or obscure the meaning of the
study.
Microsoft provided the customer names for the interview s but did not participate
in the interview s.

5 | The Total Economic Impact™ Of Microsoft 365 On End User Productivity
The Microsoft 365 Customer Journey
BEFORE AND AFTER THE MICROSOFT 365 INVESTMENT
Interviewed Organizations
For this study, Forrester conducted four interviews with Microsoft 365 customers. Interviewed customers include the following:
Key Challenges
The interviewed organizations shared several challenges they faced prior to adopting Microsoft 365, including:
› Difficulty managing documents over the course of a project. Interviewees cited compiling and managing documents as an obstacle for workflow productivity. Multiple versions of the same document often were shared among team members, creating confusion as to which version of the document was most up to date. In addition, team members occasionally created additional discord by forgetting to
upload documents to project folders.
› Lack of standard communication tools across business teams. The interviewed organizations operate on a global level, which has made it difficult to maintain a unified channel for communication. In some cases, remote teams adopted third-party communication apps due to unique communication features or ease of use for collaborating when on the go and without access to Windows. Without a standardized communication tool, end users on multiteam projects
would fall back on extended email conversations for discussions.
› An inability to access documents when traveling. Product managers shared their annoyance over not having readily accessible documents outside of those shared over email or saved locally. If they could access folders of saved documents, it could drive productivity
while traveling.
› Technical disruptions from workers not keeping their Windows systems up to date. Product managers referenced struggles over pushing software updates to workers’ Windows’ PCs. Notably, remote teams that did not report to the main office often lacked the latest security software updates, leading to security threats and help desk
tickets.
INDUSTRY REGION INTERVIEWEE MICROSOFT 365 END USERS
B2B European HQ, global
presence
CTO of environment
infrastructure 13,200
Telco European HQ Project and product manager
7,000
Utilities European HQ, global
presence
IT management/chief
product ow ner w orkspace 30,000
Utilities US HQ Manager of information
technology 10,000
“We have employees in a lot of
locations, some very remote. This distance has led to teams
making use of a variety
applications and services for communication. We are
always looking to unify our communication strategy for
better cross-team
collaboration.”
Manager of information
technology, utilities

6 | The Total Economic Impact™ Of Microsoft 365 On End User Productivity
Key Results
The interviews revealed that key results from the Microsoft 365 investment include:
› Increased ability for end users to organize and locate files. OneDrive enabled multiple team members to make edits to a document and edit in real time simultaneously when needed. As a result, teams could easily see which document was most up to date or needed to be worked on. SharePoint provided infrastructure teams to build mini sites for projects to save shared documents and
conversations from Microsoft Teams.
› Reduced time spent sending emails and increased real-time communication. Once end users moved over to Teams from Skype, they used it more often for group chats because the conversations could be saved for later reference. In addition, usage of coauthoring in Word and PowerPoint encouraged further collaboration among teams. The increase in real-time communication among workers effectively
reduced the number of email chains and long-form emails sent.
› Increased productivity while on the go among mobile workers. Microsoft’s switch from per-device to per-user licensing of 365 for organizations produced an uptick in mobile usage. End users could now access Microsoft applications through any compatible device they
chose.
› Fewer end user technical problems and help desk tickets. Microsoft 365’s automation of security updates to users’ devices ensured that workers’ devices were up to date and less susceptible to time-consuming PC crashes. Interviewees reported a drop in the number of help desk tickets being sent by workers since deploying
Microsoft 365.
Composite Organization
Based on the interviews, Forrester constructed a TEI framework, a composite company, and an associated ROI analysis that illustrates the areas financially affected. The composite organization is representative of the four companies that Forrester interviewed and is used to present the aggregate financial analysis in the next section. The composite organization that Forrester synthesized from the customer interviews has the following characteristics:
Description of composite. The composite organization is a global organization with most of its business operations in North America and Europe. The organization has 7,000 employees, 5,000 of whom are knowledge or information workers who use Microsoft 365; the remaining 2,000 employees don’t need access to Microsoft 365 for their roles. Among the 5,000 knowledge and employment workers, 900 were mobile workers as well.
Deployment characteristics. The organization deploys Microsoft 365 E3 licenses to its 5,000 users in phases over 18 months. Planning, testing, and piloting begin with IT workers before a companywide launch of Microsoft 365. The organization migrates to Enterprise Mobility + Security (EMS), Windows 10, and Office 365 E3, which includes Office 365 ProPlus.
Key assumptions
5,000 end users
900 mobile workers
Microsoft 365 E3 license
users
“It’s important for us to have a
fast option to get in contact
with the right resources. Not having to rely on email for
reaching out to colleagues is
incredibly valuable.”
CTO of environment
infrastructure, B2B
“Having OneDrive on your
mobile to quickly check on
documents is something that was not possible before. That
feature alone is driving high mobile usage of 365 at our
company.”
Project and product manager,
telco
7 | The Total Economic Impact™ Of Microsoft 365 On End User Productivity
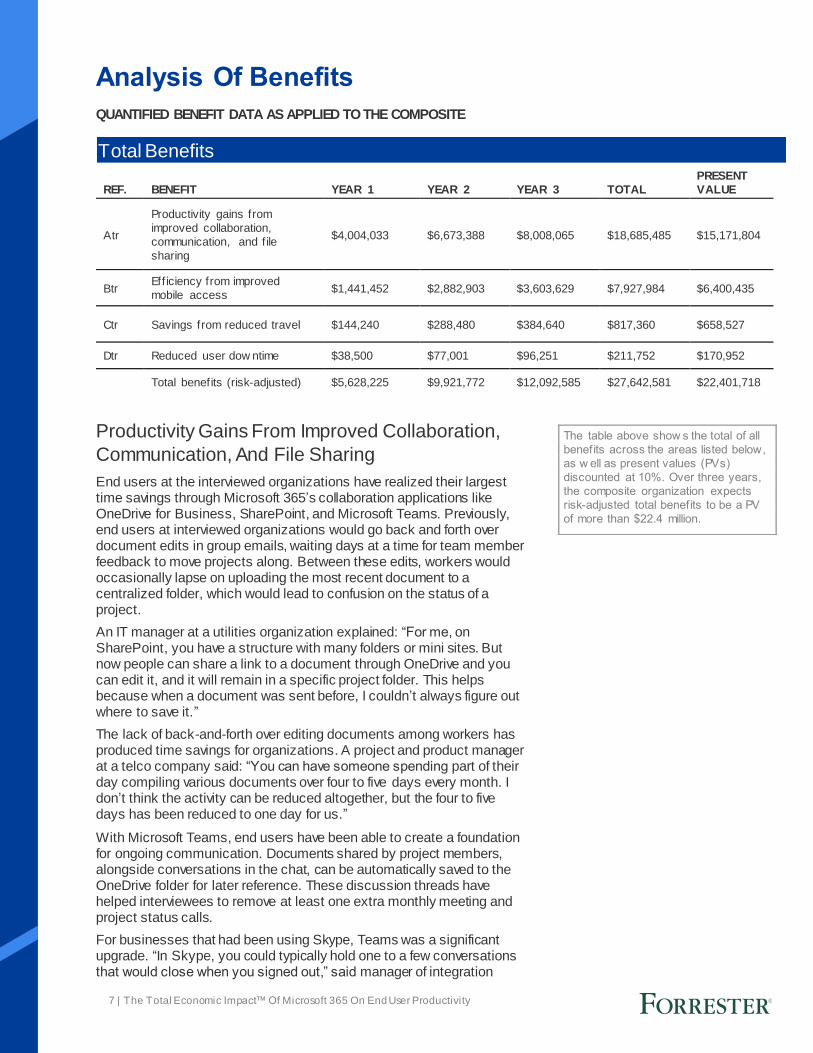
The table above show s the total of all
benefits across the areas listed below,
as w ell as present values (PVs)
discounted at 10%. Over three years,
the composite organization expects
risk-adjusted total benefits to be a PV
of more than $22.4 million.
Analysis Of Benefits
QUANTIFIED BENEFIT DATA AS APPLIED TO THE COMPOSITE
Productivity Gains From Improved Collaboration,
Communication, And File Sharing
End users at the interviewed organizations have realized their largest time savings through Microsoft 365’s collaboration applications like OneDrive for Business, SharePoint, and Microsoft Teams. Previously, end users at interviewed organizations would go back and forth over document edits in group emails, waiting days at a time for team member feedback to move projects along. Between these edits, workers would occasionally lapse on uploading the most recent document to a centralized folder, which would lead to confusion on the status of a project.
An IT manager at a utilities organization explained: “For me, on SharePoint, you have a structure with many folders or mini sites. But now people can share a link to a document through OneDrive and you can edit it, and it will remain in a specific project folder. This helps because when a document was sent before, I couldn’t always figure out where to save it.”
The lack of back-and-forth over editing documents among workers has produced time savings for organizations. A project and product manager at a telco company said: “You can have someone spending part of their day compiling various documents over four to five days every month. I don’t think the activity can be reduced altogether, but the four to five days has been reduced to one day for us.”
With Microsoft Teams, end users have been able to create a foundation for ongoing communication. Documents shared by project members, alongside conversations in the chat, can be automatically saved to the OneDrive folder for later reference. These discussion threads have helped interviewees to remove at least one extra monthly meeting and project status calls.
For businesses that had been using Skype, Teams was a significant upgrade. “In Skype, you could typically hold one to a few conversations that would close when you signed out,” said manager of integration
Total Benefits
REF. BENEFIT YEAR 1 YEAR 2 YEAR 3 TOTAL
PRESENT
VALUE
Atr
Productivity gains from
improved collaboration,
communication, and f ile
sharing
$4,004,033 $6,673,388 $8,008,065 $18,685,485 $15,171,804
Btr Eff iciency from improved
mobile access $1,441,452 $2,882,903 $3,603,629 $7,927,984 $6,400,435
Ctr Savings from reduced travel $144,240 $288,480 $384,640 $817,360 $658,527
Dtr Reduced user dow ntime $38,500 $77,001 $96,251 $211,752 $170,952
Total benefits (risk-adjusted) $5,628,225 $9,921,772 $12,092,585 $27,642,581 $22,401,718

8 | The Total Economic Impact™ Of Microsoft 365 On End User Productivity
Impact risk is the risk that the business
or technology needs of the organization may not be met by the
investment, resulting in low er overall
total benefits. The greater the
uncertainty, the w ider the potential
range of outcomes for benefit
estimates.
technology at a utilities company. “With Teams, it’s easy to collaborate and to send communications to a large number of folks. As much as 50% of our Microsoft workers are on Teams. After we educated them on how you can form a team, store your files, and keep everything in a container, they were in.”
Forrester made the following assumptions for the composite analysis:
› In Year 1, the composite begins rolling out Microsoft 365 in phases, reaching 5,000 Microsoft 365 desktop users. The composite staggers the rollout of specific Microsoft 365 features like SharePoint and Teams as it phases out similar previous solutions. As a result, only
half of the time savings benefits are realized in Year 1.
› End users at the composite save 1.5 hours per week through features like document sharing and coauthoring over OneDrive in Year 1. The introduction of SharePoint and Teams over Years 2 and 3
increases the time savings to 2.5 and 3 hours, respectively.
› End users recapture one-quarter of time saved from the collaboration features to rededicate to labor activities. The remaining time saved is allocated to nonwork activities like socializing or personal time. The time savings are slightly on the lower end because a collaboration tool
like Microsoft Teams encourages socializing that is nonwork related.
› The average knowledge worker fully burdened cost (including all benefits and taxes) is $45.63 per hour, or $94,940 annually.
The following risks can affect this benefit estimate:
› End user time savings from the collaboration tools will vary based on previous state of the organization. Businesses that already use third-party office communication tools or file-sharing services may not realize as dramatic of a jump in time savings as one not currently using
those services.
› The realization for time saving benefits will be impacted by how long organizations take to roll out Microsoft 365 and its applications like OneDrive and Microsoft Teams. Following the rollout, it may take employee education on the value of the applications before organizations see workers saving time on their daily activities. As a result, some organizations may see a greater productivity benefit out of certain applications than others because they have made more use of
them.
› Some interviewees noted that because documents could be worked on by any team member at a given time, occasionally a worker would overwrite a document version, resulting in more work to determine
what had changed.
› Time savings for organizations will vary depending on the office culture
and whether work tasks are more siloed than collaborative.
To account for these risks, Forrester adjusted this benefit downward by 10%, yielding a three-year risk-adjusted total PV of $15,171,804.
The number of hours
saved in productivity from
collaboration tools climbs
from 1.5 hours per week
in Year 1 to 3 hours per
week in Year 3.

9 | The Total Economic Impact™ Of Microsoft 365 On End User Productivity
Efficiency from improved mobile access: 29% of
total benefits
three-year benefit PV
$6.4 million
Efficiency From Improved Mobile Access
According to interviewed product managers, mobility was a point of emphasis for adopting Microsoft 365. “One of the barometers in the long-term outlooks we had as an organization was the ability to work on any device anywhere. Through OneDrive and Microsoft 365, we saw roughly 2 hours in time savings per year among all of the organization,” said the IT manager at a utilities company.
Whereas previous Microsoft licenses were sold on a per-device basis, licensing through Microsoft 365 is now per user, enabling users to access applications on multiple devices under one username. End users could now work freely when on the go from smartphones or tablets by connecting through their organizations’ portals to Microsoft applications. The licensing change allowed employees to get work done that would otherwise be handled in-office on their work PCs.
“Access to Microsoft applications on the go has kept us close to our data. Whereas if I needed to pull up a specific number and I couldn’t when on a call somewhere, it’s more realistic that I can do that now,” said the project and product manager at a telco company.
Workers were able to pick up where they left off on projects and carry through with them on mobile devices. Common times when workers were able to continue working were when they otherwise wouldn’t be while traveling and during meetings. “Usage while traveling varies based on the internet connection. But on our teams that tend to travel a lot, specifically consultants, their productivity has improved by as much as 20% to 25%,” said the CTO at a B2B company.
For the composite organization, Forrester assumes that:
› Nine hundred workers are mobile users who use multiple devices to access Microsoft 365 applications. Mobile users are among the first to receive Office 365, hence the number staying even throughout the
three-year period.
Productivity Gains From Improved Collaboration, Communication, And File Sharing: Calculation Table
REF. METRIC CALC. YEAR 1 YEAR 2 YEAR 3
A1 Number of Microsoft 365 desktop users Interview s 5,000 5,000 5,000
A2 Weekly time savings (hours) Interview s 1.5 2.5 3.0
A3 Productivity capture Assumption 25% 25% 25%
A4 User fully loaded hourly compensation Assumptions $45.63 $45.63 $45.63
At Productivity gains from improved collaboration,
communication, and f ile sharing
A1*A2*52
w eeks*A3*A4 $4,448,925 $7,414,875 $8,897,850
Risk adjustment ↓10%
Atr Productivity gains from improved collaboration, communication, and f ile sharing (risk-adjusted)
$4,004,033 $6,673,388 $8,008,065

10 | The Total Economic Impact™ Of Microsoft 365 On End User Productivity
› Time spent using mobile devices for work purposes doubles from 1 hour in Year 1 to 2 hours Year 2 through the introduction of SharePoint and Microsoft Teams for project management. In addition, workers becoming more comfortable completing tasks through their mobile
device drives further efficiency.
› Mobile users recapture 75% of their time spent on mobile devices for work activities. This high rate is due to end users having access to their work tools from their mobile devices, thus allowing them to work outside of their offices when they otherwise couldn’t. Therefore, this
productivity is mostly net new.
› The average knowledge worker fully burdened cost (including all benefits and taxes) is $45.63 per hour, or $94,940 annually.
The following risk can affect this benefit estimate:
› The productivity capture rate may come in lower for some organizations depending on whether end users rely on smartphone and tablet devices for protracted periods of time every week, lending the devices to usage for leisure activities like watching videos or
checking social media.
› Mobile access to Microsoft’s applications requires user authentication through Microsoft Intune, which eased three interviewees’ concerns over potential security threats. However, one interviewee explained that the security system the company used prevented it from taking
advantage of using Microsoft applications on the go.
To account for these risks, Forrester adjusted this benefit downward by 5%, yielding a three-year risk-adjusted total PV of $6,400,435.
Savings From Reduced Travel
Traveling employees at the interviewed organizations were able to avoid time spent on the road thanks to Microsoft 365. Microsoft Teams’ videoconferencing abilities, particularly when used in conjunction with coauthoring tools, helped employees to participate in remote meetings in their home offices and avoid traveling for in-person working sessions. “We’ll never completely dismiss travel because there’s actual value in face-to-face interaction. However, we’ve seen employees reduce their number of trips to some overseas locations for long working sessions by
Efficiency From Improved Mobile Access: Calculation Table
REF. METRIC CALC. YEAR 1 YEAR 2 YEAR 3
B1 Number of Microsoft 365 mobile users Interview s 900 900 900
B2 Weekly time savings (hours) Interview s 1.0 2.0 2.5
B3 Productivity capture Assumption 75% 75% 75%
B4 User fully loaded hourly compensation $45.63 $45.63 $45.63
Bt Eff iciency from improved mobile access B1*B2*52
w eeks*B3*B4 $1,601,613 $3,203,226 $4,004,033
Risk adjustment ↓10%
Btr Eff iciency from improved mobile access
(risk-adjusted) $1,441,452 $2,882,903 $3,603,629

11 | The Total Economic Impact™ Of Microsoft 365 On End User Productivity
one or two per year,” said the manager of information technology at a utilities company.
For the composite organization, Forrester assumes that:
› The composite’s employees avoid 150 business trips in Year 1, 300 in Year 2, and 400 in Year 3 due to improved communication between
teams.
› Each trip avoided would cost on average $1,000 from airfare, hotel, and other expenses.
› The average round trip of time spent traveling is 6 hours.
› The productivity recaptured from each of the avoided trips reaches 25% to account for the assumption that many knowledge workers
already used travel time to work.
› The average knowledge worker fully burdened cost (including all
benefits and taxes) is $45.63 per hour, or $94,940 annually.
The following risk can affect this benefit estimate:
› The amount of time saved will vary based on how much business trips factor into business operations and if there have already been travel
reductions made for cost savings.
This benefit may be smaller if an organization has already reduced travel costs to where no additional costs can be cut. To account for these risks, Forrester adjusted this benefit downward by 10%, yielding a three-year
risk-adjusted total PV of $658,527.
Reduced User Downtime
Interviewed IT managers reported a reduction in user downtime since deploying Microsoft 365. Updates for software are automated and pushed out to all users at an organization simultaneously. As a result,
Savings From Reduced Travel: Calculation Table
REF. METRIC CALC. YEAR 1 YEAR 2 YEAR 3
C1 Total number of avoided trips 150 300 400
C2 Average cost per trip Assumption $1,000 $1,000 $1,000
C3 Average time spent traveling per business
trip (hours) Assumption 6 6 6
C4 Total hours saved from avoided travel C1*C3 900 1,800 2,400
C5 Productivity capture Assumption 25% 25% 25%
C6 User fully loaded hourly compensation $45.63 $45.63 $45.63
Ct Savings from reduced travel C4*C5*C6+C1*C2 $160,267 $320,534 $427,378
Risk adjustment ↓10%
Ctr Savings from reduced travel (risk-adjusted) $144,240 $288,480 $384,640
Hours saved from
avoided travel:
Year 1 — 900 hours
Year 3 –—2,400 hours

12 | The Total Economic Impact™ Of Microsoft 365 On End User Productivity
antivirus software has stayed up to date, and documents could be securely shared. “The help desk ticketing data shows operational improvement at the range of 30% to 40%. While it doesn’t account for the difficulty of resolving issues, that’s what we’re seeing,” said the CTO at a B2B company.
A few interviewees also noted the automation of document savings as a time saver. “In the past I had to hit control and ‘S’ to save my work; now I don’t even have to think about it. When my computer would crash previously, it would take 2 hours to recover my work. Now I don’t have to worry about it,” said the IT manager at a utilities company.
For the composite organization, Forrester assumes that:
› For each end user, three downtime events previously happened per year. With Microsoft 365, the number of downtime events eventually
decrease by 25% in Year 3.
› Each downtime incident lasts at least 2.5 hours.
› The average knowledge worker fully burdened cost (including all benefits and taxes) is $45.63 per hour, or $94,940 annually.
› End users are able to recapture 25% of the time they would have spent dealing with the downtime and dedicate it to work activities. The recapture rate is on the lower end to account for users who may use
the rare downtime event to take a break from their workdays.
The following risk can affect this benefit estimate:
› The number of events and downtime length in previous environments is highly variable based on security systems in place and if those
services were kept up to date.
To account for these risks, Forrester adjusted this benefit downward by
5%, yielding a three-year risk-adjusted total PV of $170,952.
Reduced User Downtime: Calculation Table
REF. METRIC CALC. YEAR 1 YEAR 2 YEAR 3
D1 Device dow ntime events avoided per year 3 events per user
per year 15,000 15,000 15,000
D2 Reduction in device dow ntime events Interview 10% 20% 25%
D3 Hours of dow ntime per incident Interview 2.5 2.5 2.5
D4 User fully loaded hourly compensation $45.63 $45.63 $45.63
D5 Productivity capture Assumption 25% 25% 25%
Dt Reduced user dow ntime C1*C2*C3*C4*C5 $42,778 $85,556 $106,945
Risk adjustment ↓10%
Dtr Reduced user dow ntime (risk-adjusted) $38,500 $77,001 $96,251
Reduction in device
downtime events:
Year 1 — 10%
Year 3 — 25%

13 | The Total Economic Impact™ Of Microsoft 365 On End User Productivity
Flexibility, as defined by TEI,
represents an investment in additional
capacity or capability that could be
turned into business benefit for a future
additional investment. This provides an
organization w ith the "right" or the ability to engage in future initiatives but
not the obligation to do so.
Unquantified Benefits
› Productivity savings assist in improving the employee experience. While end user time savings from usage of Microsoft 365 are discernable, there are qualitative benefits as well. For example, a reduction in the number of emails sent in a day — as a result of increased chatting and conferencing — can be quantified; however, the relief associated with not conducting a menial task is much more indiscernible. The value of this benefit primarily manifests itself in the quality of work. Workers may be more engaged brainstorming over Teams than via email. An employee who works while traveling may produce more focused, high-quality work than they do while in the office. Interviewed organizations had not measured improvements in work quality but noted that improved collaboration and mobility through
Microsoft 365 had improved attitudes in their offices.
A couple of the interviewees shared that the new collaborative tools appealed to younger employees at their businesses and may help in improving the employee experience for new hires. “It has to be taken into account that people are getting younger within our company and they are using some of these tools in college,” said a project and product manager at a telco company. “With their usage, it’s encouraging more people to use the newer applications like Teams.
We expect it to work its way up to some more senior employees.”
Flexibility
The value of flexibility is clearly unique to each customer, and the measure of its value varies from organization to organization. There are multiple scenarios in which a customer might choose to implement Microsoft 365 and later realize additional uses and business opportunities, including:
› Improved tracking of employee productivity. The interviewees noted that their current measurement of employee productivity could be improved. Aside from reported time tracking, managers lacked visibility on a granular level to which tasks were time-consuming for employees. Businesses that refine or develop a thorough tracking system for employee workflow will be more capable of assessing the impact of Microsoft 365’s products on time savings. Although Microsoft offers the application MyAnalytics for measuring employee productivity,
the interviewees had yet to use it.
› Increased usage of new time-saving Microsoft 365 solutions. IT managers reported that there were several new features of which users had yet to fully take advantage. For example, interviewees stated that the organizational tool Windows Timeline for workflow tracking was used by some employees, but a lack of companywide education on the tool slowed further worker usage. Similarly, AI features for streamlining searches through Cortana or translating documents presented clear productivity benefits but had generated low awareness among employees so far. Organizations could potentially realize benefits from these applications by investing in training from
Microsoft for education on use cases for their features.

14 | The Total Economic Impact™ Of Microsoft 365 On End User Productivity
The table above show s the total of all
costs across the areas listed below, as w ell as present values (PVs)
discounted at 10%. Over three years,
the composite organization expects
risk-adjusted total costs to be a PV of
more than $15.2 million.
Implementation risk is the risk that a
proposed investment may deviate from
the original or expected requirements,
resulting in higher costs than
anticipated. The greater the
uncertainty, the w ider the potential
range of outcomes for cost estimates.
Analysis Of Costs
QUANTIFIED COST DATA AS APPLIED TO THE COMPOSITE
License Costs
The composite organization purchases 5,000 Microsoft 365 E3 licenses at a cost of $35 per user per month. Initial costs account for six months of piloting and deployment of Microsoft 365. By Year 1, the entire organization uses the service; therefore, Year 1 represents the first full year of license costs.
The following risk factors may affect costs incurred by organizations:
› Microsoft 365 licensing costs vary based on service plan type, volume-
related discounts, and other products licensed from Microsoft.
To account for these risks, Forrester adjusted this cost upward by 5%, yielding a three-year risk-adjusted total PV of $6,586,009.
Planning, Implementation, And Deployment Costs
Costs related to planning, implementation, and deployment varied significantly based on the timeline for rollout, professional services used for migration, types of solutions deployed, and the number of devices. Organizations often used professional services to accelerate deployment time and to assist with configurations and integrations.
Total Costs
REF. COST INITIAL YEAR 1 YEAR 2 YEAR 3 TOTAL
PRESENT
VALUE
Etr License costs $1,102,500 $2,205,000 $2,205,000 $2,205,000 $7,717,500 $6,586,009
Ftr Planning, implementation
and deployment costs $3,205,146 $2,352,900 $545,100 $545,100 $6,648,246 $6,204,183
Gtr Training costs $880,770 $796,620 $536,580 $536,580 $2,750,550 $2,451,565
Total costs (risk-adjusted) $5,188,416 $5,354,520 $3,286,680 $3,286,680 $17,116,296 $15,241,757
License Costs: Calculation Table
REF. METRIC CALC. INITIAL YEAR 1 YEAR 2 YEAR 3
E1 Number of M365 users Interview s/survey 5,000 5,000 5,000 5,000
E2 M365 E3 license cost
$35 per user per
month, 6 months
initial
$210 $420 $420 $420
Et License costs E1*E2 $1,050,000 $2,100,000 $2,100,000 $2,100,000
Risk adjustment ↑5%
Etr License costs (risk-adjusted) $1,102,500 $2,205,000 $2,205,000 $2,205,000

15 | The Total Economic Impact™ Of Microsoft 365 On End User Productivity
› The composite rolls out Microsoft 365 over a 10-month initial period. During this time frame, the organization completes early testing and
deployments.
› The composite spends $1.8 million on professional services during the initial rollout and an additional $1,000,000 to complete deployment
during Year 1.
› Eight internal FTEs assist in implementation and deployment during the initial 10 months. Four FTEs finish the rollout during Year 1. The composite retains three FTEs for ongoing maintenance to support and configure Microsoft products, manage user accounts, and roll out new
product features.
› The average IT fully burdened costs (including all benefits and taxes)
is $143,000 annually.
› The migration requires $45,000 in annual additional tech infrastructure
spending, 75% of which is incurred in the initial period.
The following risk factors may affect costs incurred by organizations:
› Costs will scale based on the size and scope of the deployment, which will alter the number of FTEs and amount of professional services
needed.
To account for these risks, Forrester adjusted this cost upward by 15%, yielding a three-year risk-adjusted total PV of $6,204,183.
Planning, Implementation, And Deployment Costs: Calculation Table
REF. METRIC CALC. INITIAL YEAR 1 YEAR 2 YEAR 3
F1 Number of months Interview s 10 12 12 12
F2
Internal FTEs for
planning and
implementation
Interview s 8 4
F3 Professional services
costs Assumption $1,800,000 $1,000,000
F4 Additional technology
costs Interview s $33,750 $45,000 $45,000 $45,000
F5
Internal FTEs for
ongoing
management and
administration
Interview s 3 3 3
F6 IT fully loaded annual
compensation Assumption $143,000 $143,000 $143,000 $143,000
Ft
Planning,
implementation, and
deployment costs
((F1/12)*(F2+F5)*F6)+F3+F4 $2,787,083 $2,046,000 $474,000 $474,000
Risk adjustment ↑15%
Ftr
Planning,
implementation, and
deployment costs
(risk-adjusted)
$3,205,146 $2,352,900 $545,100 $545,100
Three FTEs
spend 100% of their time
on ongoing management
of Microsoft 365.

16 | The Total Economic Impact™ Of Microsoft 365 On End User Productivity
Training Costs
Both IT staff and end users require training on new features and functionality.
› The composite allocates $75,000 to produce initial training materials and another $15,000 per year to update training materials on new
features.
› Fifteen IT staff participate in training, including five days initially, three days in Year 1, and two days each year after deployment ends to train on new functionality. The average IT fully burdened cost (including all
benefits and taxes) is $550 per day, or $143,000 annually.
› All 5,000 end users participate in both formal and on-the-job training, including 3 hours initially, 2 hours in Year 1, and 1 hour per year after deployment ends to train on new features. The average knowledge worker fully burdened cost (including all benefits and taxes) is $45.63
per hour, or $94,910 annually.
The following risks can affect this cost estimate:
› Training efforts will vary based on the frequency of updates and the effort to encourage usage of new features. Ongoing training to accompany new feature updates is a key driver of ongoing productivity
benefits.
To account for these risks, Forrester adjusted this cost upward by 10%, yielding a three-year risk-adjusted total PV of $2,451,565.
Training Costs: Calculation Table
REF. METRIC CALC. INITIAL YEAR 1 YEAR 2 YEAR 3
G1 Development of training
materials Interview s/survey $75,000 $15,000 $15,000 $15,000
G2 Number of IT staff
participating in training Interview s/survey 15 15 15 15
G3 Days of IT training Interview s/survey 5 3 2 2
G4 IT fully loaded daily
compensation Assumption $550 $550 $550 $550
G5 Number of end users Interview s/survey 5,000 5,000 5,000 5,000
G6 Hours of end user
training Interview s/survey 3 3 2 2
G7 User fully loaded hourly
compensation Assumption $45.63 $45.63 $45.63 $45.63
Gt Training costs G1+G2*G3*G4+G5*G6*G7 $800,700 $724,200 $487,800 $487,800
Risk adjustment ↑10%
Gtr Training costs (risk-
adjusted) $880,770 $796,620 $536,580 $536,580

17 | The Total Economic Impact™ Of Microsoft 365 On End User Productivity
The financial results calculated in the
Benefits and Costs sections can be
used to determine the ROI, NPV, and
payback period for the composite
organization’s investment. Forrester
assumes a yearly discount rate of 10%
for this analysis.
Financial Summary
CONSOLIDATED THREE-YEAR RISK-ADJUSTED METRICS
Cash Flow Chart (Risk-Adjusted)
-$8.0 M
-$6.0 M
-$4.0 M
-$2.0 M
$2.0 M
$4.0 M
$6.0 M
$8.0 M
$10.0 M
$12.0 M
$14.0 M
Initial Year 1 Year 2 Year 3
Cashf low s
Total costs
Total benefits
Cumulative net benefits
These risk-adjusted ROI,
NPV, and payback period
values are determined by
applying risk-adjustment
factors to the unadjusted
results in each Benefit and
Cost section.
Cash Flow Table (Risk-Adjusted)
INITIAL YEAR 1 YEAR 2 YEAR 3 TOTAL
PRESENT
VALUE
Total costs ($5,188,416) ($5,354,520) ($3,286,680) ($3,286,680) ($17,116,296) ($15,241,757)
Total benefits $0 $5,628,225 $9,921,772 $12,092,585 $27,642,581 $22,401,718
Net benefits ($5,188,416) $273,705 $6,635,092 $8,805,905 $10,526,286 $7,159,961
ROI 47%
Payback period 21 months

18 | The Total Economic Impact™ Of Microsoft 365 On End User Productivity
Microsoft 365: Overview
The following information is provided by Microsoft. Forrester has not validated any claims and does not endorse Microsoft or its offerings.
• Unlocks creativity
o Create compelling content: Use AI-powered tools to create high-quality content that stands out — from impressive slides to animated 3D models and immersive mixed-reality experiences.
o Turn data into insight: Turn an ever-growing mass of data into actionable insights to transform your organization.
o Find what you need: Find people, data, and the information you need without leaving the flow of your work.
o Focus on what matters: Remove distractions and overcome information overload by focusing on what is most important.
o Work naturally across devices: Go from thought to content effortlessly on any device through more natural ways of working with voice, touch, and pen.
• Built for teamwork
o Bring together teams and resources all in one place: Get the hub for your teamwork with Microsoft Teams, where you can chat, hold meetings, and share files and apps. Connect people to content with file storage and sharing.
o Stay connected and organized on the go: Connect and collaborate wherever you go. Outlook for iOS and Android brings together email, calendar, contacts, and documents — securely — allowing you to share files, coordinate schedules, and book meetings.
o Connect the workplace with a mobile, intelligent intranet: Share resources, news, and apps across the organization with dynamic sites and portals. Transform internal communications with SharePoint — whether in the office or on the go.
o Engage and empower employees across your organization: Drive open conversation and improve employee engagement with Yammer. Build communities, conduct live and on-demand events, encourage sharing of knowledge and best practices, and crowdsource ideas
o Work together in real time with Office apps: Share your files securely with OneDrive for Business and cocreate in real time. See who’s working on a file with you and easily track changes with version history, using apps like Word and PowerPoint.
• Integrated for simplicity
o Windows 10, Office 365 ProPlus, and Microsoft Teams: Empower employees with the most productive tools and secure computing environment while lowering costs and simplifying IT.
o Flexible device management: Provision, deploy, and manage all your devices — from mobile devices running iOS, Android, or Windows Mobile, to PCs running Windows, Mac, or Linux. Increase your security posture by connecting you on-premises infrastructure to the cloud, all on your own terms.
o Integrated administration: Administer apps, services, data, devices, and users — all from one unified, web-based administration center. Quickly accomplish common tasks and retain the ability to dive deep from a central console.
o Built-in compliance: Easily assess your compliance risk, govern and protect your data, and efficiently respond to regulatory requirements.

19 | The Total Economic Impact™ Of Microsoft 365 On End User Productivity
• Intelligent security
o Secure access to your enterprise: Traditional security perimeters no longer apply. Identity is the new control plane. Protecting an enterprise requires defense in depth, which starts with a passwordless user authentication experience and automatic, policy-based rules for accessing sensitive information, regardless of location or device type.
o Defend your digital landscape: Protect your assets and empower your defenders with Microsoft Threat Protection Services.
o Safeguard your sensitive data: In this era of big data and strengthened privacy laws, an organization’s most valuable asset is data, yet most don’t understand what data is sensitive and how to control access. Protecting data and privacy requires automatic detection of sensitive information and protection that stays with a file, even when it travels outside of your network.
o Understand and improve your security posture: Increasingly sophisticated threats mean organizations must constantly reassess their security posture, but accurately and objectively measuring it is a challenge for most companies. Your security providers should help quantify your security posture and provide recommendations to improve it, including the user impact and level of effort required.
o Security beyond Microsoft products: Modern enterprises are adopting a variety of solutions to achieve digital transformation goals. Most organizations run workloads on different operating systems, use multiple cloud platforms, and rely on a variety of vendors. It ’s critical that security solutions work together — regardless of the vendor — to protect devices, products, and services.
Microsoft 365 empowers every employee from your first-line workforce all the way to your boardroom. Microsoft’s subscriptions offer complete, intelligent, and more secure solutions that will bring more value to your business and help transform your organization to drive innovation.
20 | The Total Economic Impact™ Of Microsoft 365 On End User Productivity
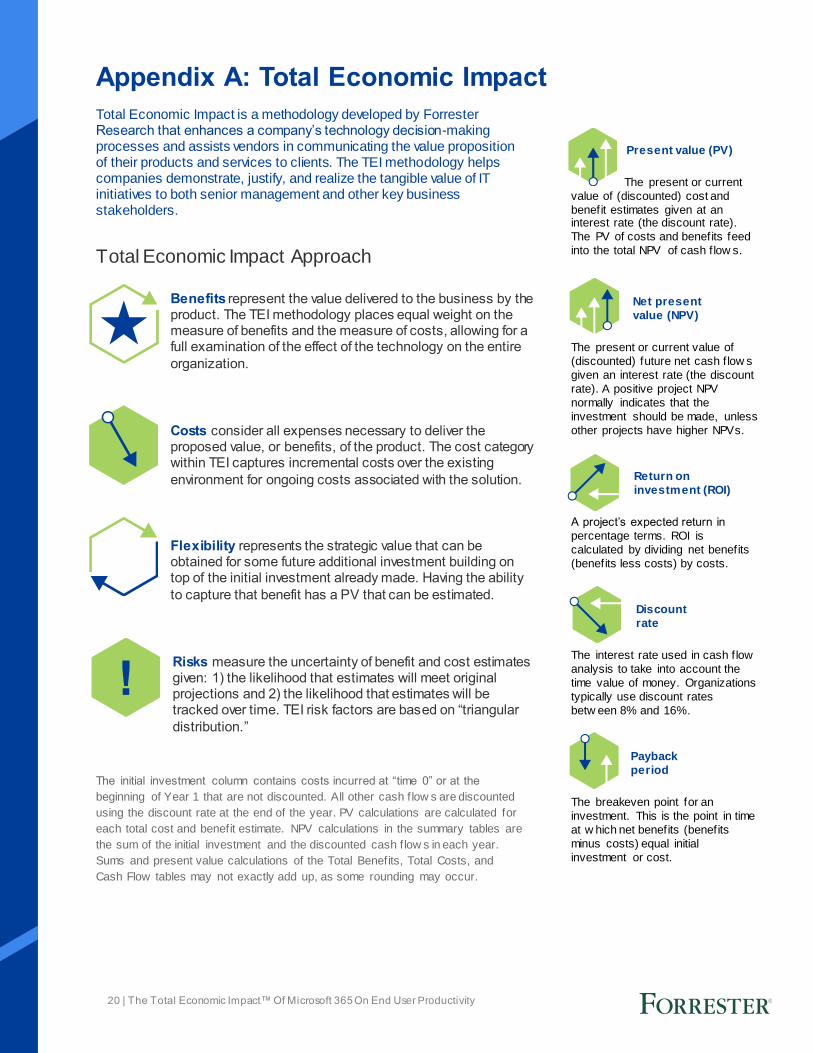
Appendix A: Total Economic Impact
Total Economic Impact is a methodology developed by Forrester Research that enhances a company’s technology decision-making processes and assists vendors in communicating the value proposition of their products and services to clients. The TEI methodology helps companies demonstrate, justify, and realize the tangible value of IT initiatives to both senior management and other key business stakeholders.
Total Economic Impact Approach
Benefits represent the value delivered to the business by the product. The TEI methodology places equal weight on the measure of benefits and the measure of costs, allowing for a full examination of the effect of the technology on the entire
organization.
Costs consider all expenses necessary to deliver the proposed value, or benefits, of the product. The cost category within TEI captures incremental costs over the existing
environment for ongoing costs associated with the solution.
Flexibility represents the strategic value that can be obtained for some future additional investment building on top of the initial investment already made. Having the ability
to capture that benefit has a PV that can be estimated.
Risks measure the uncertainty of benefit and cost estimates given: 1) the likelihood that estimates will meet original projections and 2) the likelihood that estimates will be tracked over time. TEI risk factors are based on “triangular
distribution.”
The initial investment column contains costs incurred at “time 0” or at the
beginning of Year 1 that are not discounted. All other cash f low s are discounted
using the discount rate at the end of the year. PV calculations are calculated for
each total cost and benefit estimate. NPV calculations in the summary tables are
the sum of the initial investment and the discounted cash f low s in each year.
Sums and present value calculations of the Total Benefits, Total Costs, and
Cash Flow tables may not exactly add up, as some rounding may occur.
Present value (PV)
The present or current
value of (discounted) cost and
benefit estimates given at an interest rate (the discount rate).
The PV of costs and benefits feed
into the total NPV of cash f low s.
Net present
value (NPV)
The present or current value of
(discounted) future net cash f low s
given an interest rate (the discount
rate). A positive project NPV
normally indicates that the
investment should be made, unless
other projects have higher NPVs.
Return on
investment (ROI)
A project’s expected return in
percentage terms. ROI is
calculated by dividing net benefits
(benefits less costs) by costs.
Discount
rate
The interest rate used in cash f low
analysis to take into account the
time value of money. Organizations
typically use discount rates
betw een 8% and 16%.
Payback
period
The breakeven point for an
investment. This is the point in time
at w hich net benefits (benefits
minus costs) equal initial
investment or cost.
21 | The Total Economic Impact™ Of Microsoft 365 On End User Productivity
Appendix B: Supplemental Material
Related Forrester Research
“The Total Economic Impact Of Microsoft 365,” Forrester Consulting report prepared for Microsoft, July 2019.
“The Total Economic Impact Of Microsoft Teams,” Forrester Consulting report prepared for Microsoft, April 2019.
“New Tech TEI: The Total Economic Impact of Microsoft 365 AI For Knowledge Workers ,” Forrester Consulting report prepared for Microsoft, February 2019.