The Top Companies for Leaders 10 Years Later · The Top Companies for Leaders 10 Years Later ......
6
The Top Companies for Leaders 10 Years Later Ten years after the 2005 study, how did these celebrated companies perform against their peers and the market? Did great talent practic- es actually sustain their success?
Transcript of The Top Companies for Leaders 10 Years Later · The Top Companies for Leaders 10 Years Later ......

The Top Companies for Leaders10 Years LaterTen years after the 2005 study, how did these celebrated companies perform against their peers and the market? Did great talent practic-es actually sustain their success?

Second place is good too, right?
We don’t think so either. Our clients want to win. They know that only the highest performing, most engaged talent can deliver what they’ve promised their customers and investors. They rely on The Talent Strategy Group to quickly elevate their company’s talent quality and to radically simplify their talent building practices.
Our global team of consultants (all former human resource executives) can help you to transform your company’s talent into a key competitive asset. We will work with you to create a talent strategy, identify high potential talent, accelerate talent development and elevate performance across your company.
We help the world’s largest and most successful companies to build better talent faster. Let’s talk about how we can get your talent into first place.
Visit us at www.talentstrategygroup.com or contact us at [email protected]

INSIGHTS 1
Why It StartedThe Top Companies for Leaders started as a marketing
idea after I joined Hewitt in 2000. We needed a “door opener” to kick-start the nascent leadership consulting practice and, knowing that everyone liked lists that ranked organizations, we decided to create a list of companies that excelled at building leaders. Our goal was to under-stand which factors differentiated companies with great earnings and great talent from their less well-performing brethren.
We took this approach to strike a direct contrast to the “best practice” research that then (and now) praises activ-ities without evaluating their impact on company success. We would look at the within-industry performance of the participating companies and try to understand if higher and lower performing organizations approached talent building differently.
The research process included soliciting participation from thousands of organizations around the globe, con-ducting a thorough but not arduous survey, selectively
There’s no shortage of lists that claim to differentiate the “best” companies. Whether you seek the best companies for diversity, working mothers, millennials or any other category, each list claims that their companies are superior based on their self-defined standards.
When my team and I started the Top Companies for Leaders1 (TCFL) process 13 years ago, our goal wasn’t to select companies that appealed to a sub-segment of the population or to use self-defined criteria to differ-entiate the “best.” We hoped instead to identify the few magic ingredients that allowed some companies to con-sistently produce great business results and highly ca-pable leaders. We thought that there should be some correlation, if not causality, between these two elements.
More importantly, we knew that the true measure of success would not just be those companies recent perfor-mance, but their ongoing success. It’s now been 10 years since we conducted the 2005 TCFL and it seems like a fair time to examine how those companies performed.
First, some context:
The Top Companies for Leaders 10 Years Laterby Marc Effron, President, The Talent Strategy Group
1 This study is now called the Aon Hewitt Top Companies for Leaders and is a registered trademark of Aon Hewitt. This article refers only to the 2005 study completed during my tenure at Hewitt Associates. I have no current relationship with Aon Hewitt or involvement with the current TCFL research.

INSIGHTS 2
interviewing organizations and having five neutral judges review the list of finalists to select the Top 20 Companies for Leaders.
We started the TCFL in 2002 and continued the process in 2003 and 2005. By 2005, we had refined the survey, interview and judging processes to the point where I felt extremely comfortable that our final TCFL’s were compa-nies whose talent practices would ensure their continued success. For that reason, I’ve used the 2005 list1 to analyze the performance of TCFL 10 years later.
The 2005 TCFL Companies & Research FindingsThe research identified three factors that seemed to
differentiate the Top Companies from the others (see the complete company list on p. 4). As stated in the 2005 TCFL Research Highlights:
• CEOs and Board of Directors Provide Leadershipand Inspiration. One of the key enablers of buildingleadership quality and depth is active involvementfrom the CEO and Board of Directors. This is certainlythe case among the Top 20 Companies, which boastCEOs and boards that are actively engaged in lead-ership development programs and are personally in-volved in the selection, review, and development oftheir best talent.
• Clear Differentiation of High-Potential Talent. TheTop 20 Companies are serious about investment intheir top talent. They more actively manage and de-velop their best talent as compared to other compa-nies. High-potential leaders at the Top 20 Companiesreceive clearly differentiated compensation, develop-ment, and exposure to senior leadership.
• The Right Programs, Done Right. Although compa-nies may have the right programs in place, it is theintegration and execution of these programs that makethe most difference. The Top 20 Companies differen-tiate themselves by effectively utilizing their practices
to develop leaders in support of their business strat-egy.2
The findings are described in detail in the book “Leading the Way.”
The 10-Year ResultsThere’s only one true test of a company’s long-term
performance: Did they beat the market? While a compa-ny can do their best to explain short-term fluctuations in stock price or earnings, over a 10-year period, if they hav-en’t delivered results that beat their competitors they aren’t worthy of the title “top company.”
So how did our 2015 TCFL companies do? In short, OK. On average they outperformed their industry by 18.7%3
and slightly outperformed the S & P 500 (1.7%) over that period. It would have been nice to have beaten the S&P 500 by a larger amount, but our list was not selected based on market-beating performance, just industry-beat-ing performance
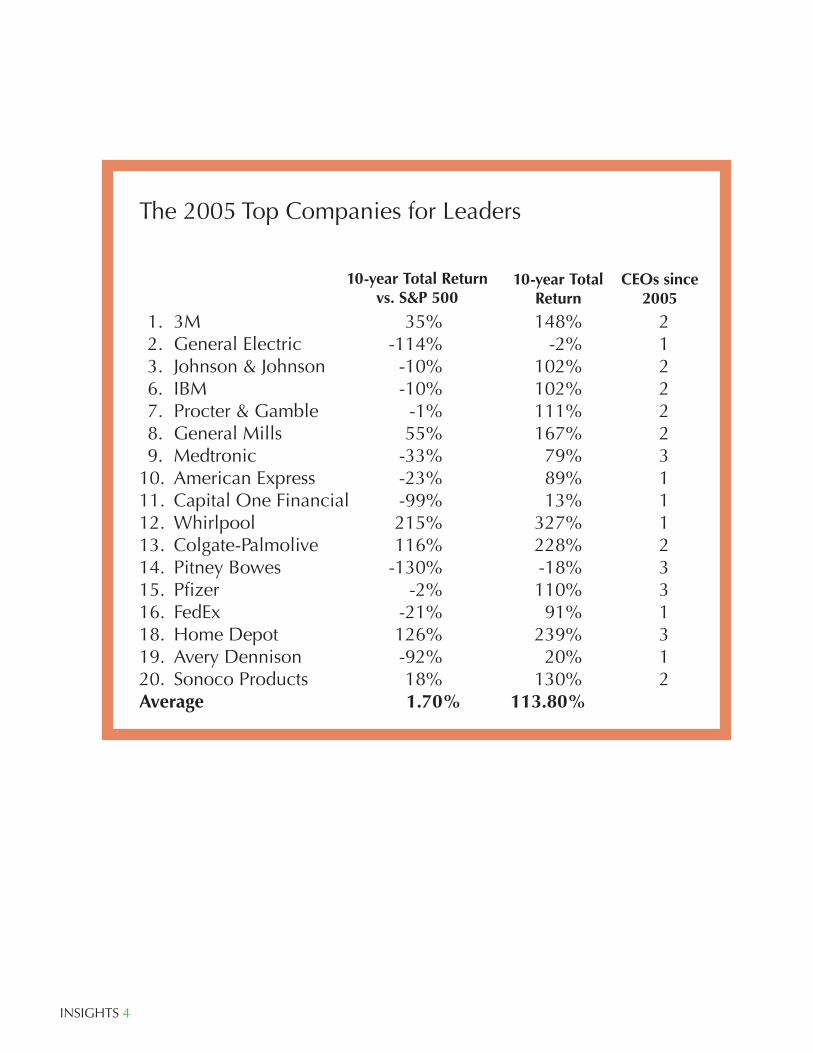
However, those reasonably good results hide tremen-dous performance variability among the TCFL. At the high end, Whirlpool boasts a 10-year total return of 327% and beat the S & P by 215%. Balancing those tremendous re-sults is Pitney Bowes whose 10-year total return is -18.3% and whose returns underperformed the S&P 500 by 130%.
Why Good But Not Great?Overall the 2005 TCFLs delivered a small win at the 10-
year mark. On average they beat their industry returns and the broader market – our original prediction. What’s chal-lenging is to explain why. The lower returns of some com-panies seem easily explainable (but not excused by) mac-
1 17 companies are included in this analysis. Dell went private in 2014. Washington Group International is a private company. Liz Claiborne sold most of its businesses and became Kate Spade
2 M. Effron, S. Greenslade, M. Salob. “How the Top 20 Companies Grow Great Leaders 2005” (Illinois: Hewitt Associates, 2005). 3 All figures are total stock returns from 2/17/2015 - 2/17/2015.
On average the Top Companies for Leaders outperformed their industry by 18.7% and slightly outperformed the S & P 500 (1.7%) over that period. However, those reasonably good results hide tremendous performance variability among companies.
INSIGHTS 3
roeconomic or industry factors. The fact that both Capital One Financial and American Express were in the bottom half of our top 20 performers is understandable given the financial crisis that dominated the 10-year period.
Companies like Pitney Bowes saw their core business (postage meters) decimated by the rise in electronic com-munication. Avery Dennison – still largely in the labeling business – was similarly affected by a shift from paper to electronic media. However, it’s fair to suggest that firms with superior talent should have quickly recognized these challenges and found ways to innovate away from these shrinking sectors.
Other lower performing companies have fewer excuses available. General Electric delivered a -2% return over 10 years, partially weighted down by GE Capital but still not benefiting from a broad portfolio of products and services. Given that this is a company previously lauded for its tal-ent practices, it’s somewhat disheartening not to see better results.
Macroeconomic factors didn’t seem to affect some companies that they potentially should have. Whirlpool and Home Depot should have been rocked by decreased consumer spending and the decimated home-building rates of the last six years. However, each company deliv-ered handsome above-market returns of 215% and 126% respectively.
Without a comprehensive look at how the 2005 TCFL’s managed talent over these 10 years, it’s impossible to un-derstand why their performance trended as it did. Howev-er, a few possible explanations are:
• The companies performed as they should have: These companies beat the market. The unprecedented economic factors in this period might have dampened the effect of great talent practices and great talent.
• We may have measured at the highest point: We used a historical three-year look at the participating organizations to help select them. While ideally their talent practices would have predicted high future re-turns, it is possible that we simply measured at the top of some organizations’ performance curve.
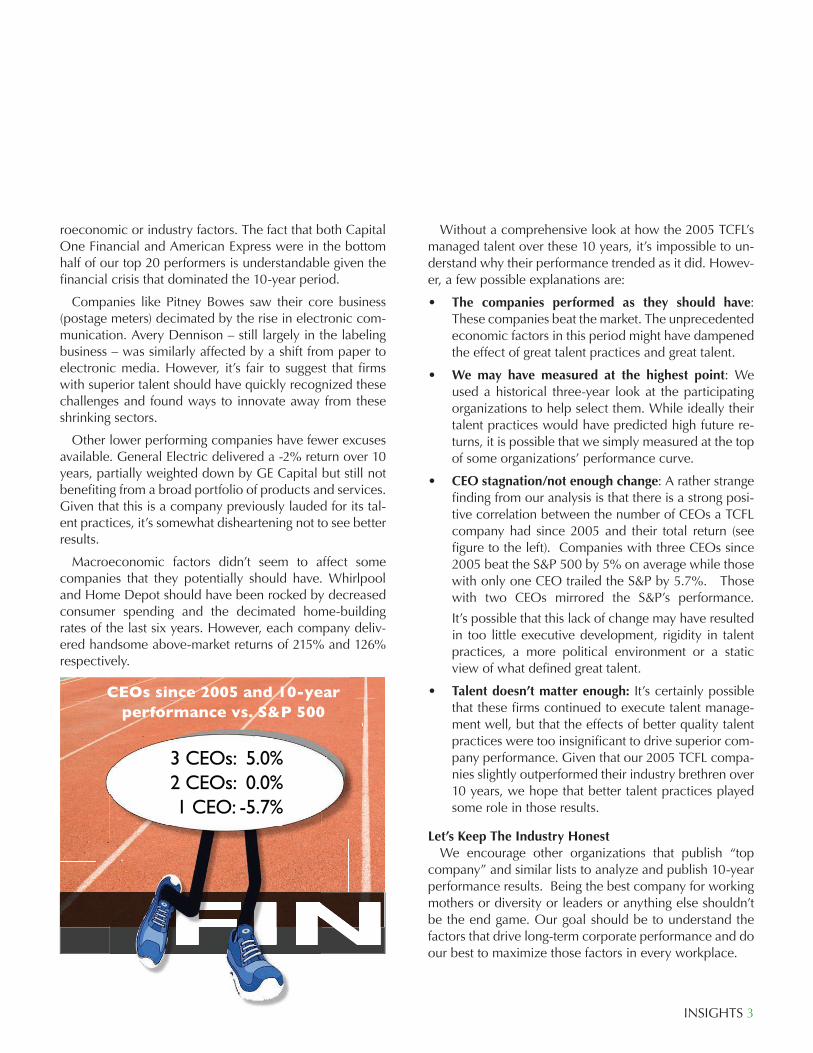
• CEO stagnation/not enough change: A rather strange finding from our analysis is that there is a strong posi-tive correlation between the number of CEOs a TCFL company had since 2005 and their total return (see figure to the left). Companies with three CEOs since 2005 beat the S&P 500 by 5% on average while those with only one CEO trailed the S&P by 5.7%. Those with two CEOs mirrored the S&P’s performance.
It’s possible that this lack of change may have resulted in too little executive development, rigidity in talent practices, a more political environment or a static view of what defined great talent.
• Talent doesn’t matter enough: It’s certainly possible that these firms continued to execute talent manage-ment well, but that the effects of better quality talent practices were too insignificant to drive superior com-pany performance. Given that our 2005 TCFL compa-nies slightly outperformed their industry brethren over 10 years, we hope that better talent practices played some role in those results.
Let’s Keep The Industry HonestWe encourage other organizations that publish “top
company” and similar lists to analyze and publish 10-year performance results. Being the best company for working mothers or diversity or leaders or anything else shouldn’t be the end game. Our goal should be to understand the factors that drive long-term corporate performance and do our best to maximize those factors in every workplace.
INSIGHTS 4
The 2005 Top Companies for Leaders
1. 3M 35% 148% 2 2. General Electric -114% -2% 1 3. Johnson & Johnson -10% 102% 2 6. IBM -10% 102% 2 7. Procter & Gamble -1% 111% 2 8. General Mills 55% 167% 2 9. Medtronic -33% 79% 3 10. American Express -23% 89% 1 11. Capital One Financial -99% 13% 1 12. Whirlpool 215% 327% 1 13. Colgate-Palmolive 116% 228% 2 14. Pitney Bowes -130% -18% 3 15. Pfizer -2% 110% 3 16. FedEx -21% 91% 1 18. Home Depot 126% 239% 3 19. Avery Dennison -92% 20% 1 20. Sonoco Products 18% 130% 2 Average 1.70% 113.80%
10-year Total Return vs. S&P 500
10-year Total Return
CEOs since 2005