The Three-Contingency Model of Self-Management
121
Western Michigan University Western Michigan University ScholarWorks at WMU ScholarWorks at WMU Dissertations Graduate College 4-2005 The Three-Contingency Model of Self-Management The Three-Contingency Model of Self-Management Holly C. Harrison Western Michigan University Follow this and additional works at: https://scholarworks.wmich.edu/dissertations Part of the Psychology Commons Recommended Citation Recommended Citation Harrison, Holly C., "The Three-Contingency Model of Self-Management" (2005). Dissertations. 1034. https://scholarworks.wmich.edu/dissertations/1034 This Dissertation-Open Access is brought to you for free and open access by the Graduate College at ScholarWorks at WMU. It has been accepted for inclusion in Dissertations by an authorized administrator of ScholarWorks at WMU. For more information, please contact [email protected].
Transcript of The Three-Contingency Model of Self-Management
Western Michigan University Western Michigan University
ScholarWorks at WMU ScholarWorks at WMU
Dissertations Graduate College
4-2005
The Three-Contingency Model of Self-Management The Three-Contingency Model of Self-Management
Holly C. Harrison Western Michigan University
Follow this and additional works at: https://scholarworks.wmich.edu/dissertations
Part of the Psychology Commons
Recommended Citation Recommended Citation Harrison, Holly C., "The Three-Contingency Model of Self-Management" (2005). Dissertations. 1034. https://scholarworks.wmich.edu/dissertations/1034
This Dissertation-Open Access is brought to you for free and open access by the Graduate College at ScholarWorks at WMU. It has been accepted for inclusion in Dissertations by an authorized administrator of ScholarWorks at WMU. For more information, please contact [email protected].
THE THREE-CONTINGENCY MODEL OF SELF-MANAGEMENT
By
Holly C. Harrison
A Dissertation Submitted to the
Faculty of The Graduate College in partial fulfillment of the
requirements for the Degree of Doctor of Philosophy
Department of Psychology Dr. Richard W. Malott, Advisor
Western Michigan University Kalamazoo, Michigan
April 2005
Reproduced with permission of the copyright owner. Further reproduction prohibited without permission.
THE THREE-CONTINGENCY MODEL OF SELF-MANAGEMENT
Holly C. Harrison, Ph.D.
Western Michigan University, 2005
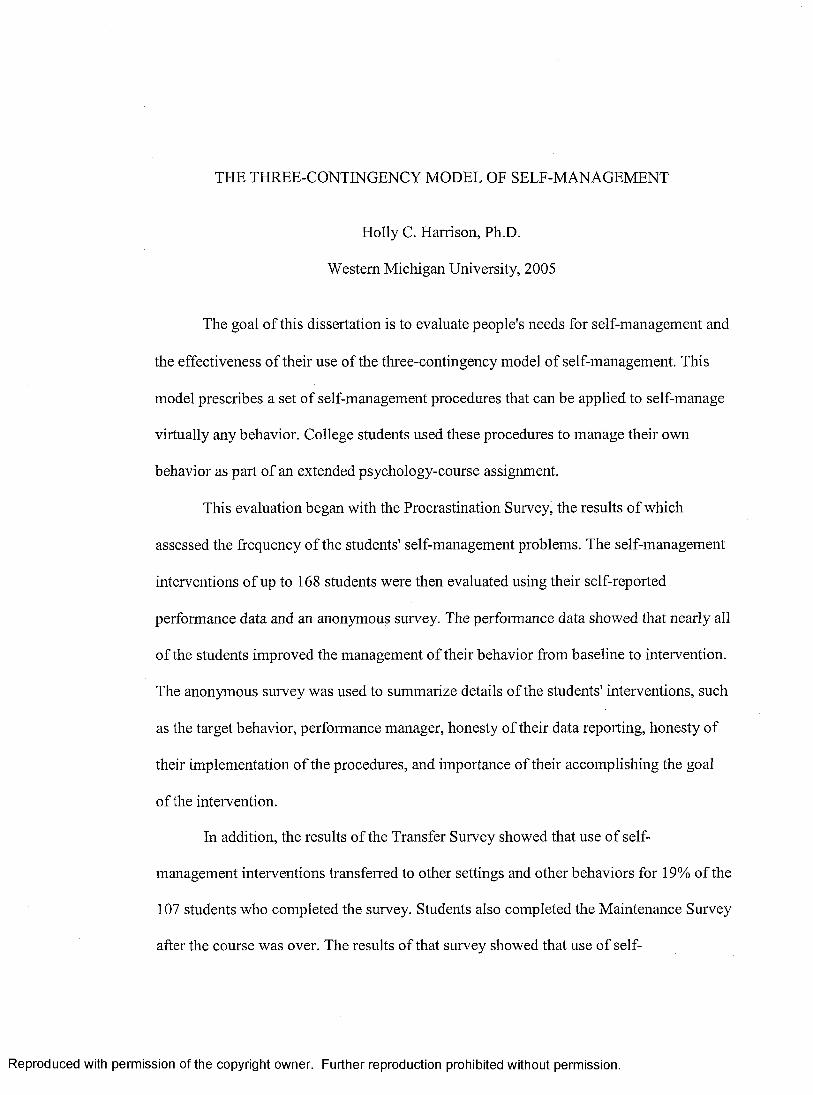
The goal of this dissertation is to evaluate people's needs for self-management and
the effectiveness of their use of the three-contingency model of self-management. This
model prescribes a set of self-management procedures that can be applied to self-manage
virtually any behavior. College students used these procedures to manage their own
behavior as part of an extended psychology-course assignment.
This evaluation began with the Procrastination Survey, the results of which
assessed the frequency of the students' self-management problems. The self-management
interventions of up to 168 students were then evaluated using their self-reported
performance data and an anonymous survey. The performance data showed that nearly all
of the students improved the management of their behavior from baseline to intervention.
The anonymous survey was used to summarize details of the students' interventions, such
as the target behavior, performance manager, honesty of their data reporting, honesty of
their implementation of the procedures, and importance of their accomplishing the goal
of the intervention.
In addition, the results of the Transfer Survey showed that use of self
management interventions transferred to other settings and other behaviors for 19% of the
107 students who completed the survey. Students also completed the Maintenance Survey
after the course was over. The results of that survey showed that use of self-
Reproduced with permission of the copyright owner. Further reproduction prohibited without permission.
management interventions maintained for 33% of the 72 students who completed the
survey.
Reproduced with permission of the copyright owner. Further reproduction prohibited without permission.
UMI Number: 3164164
INFORMATION TO USERS
The quality of this reproduction is dependent upon the quality of the copy
submitted. Broken or indistinct print, colored or poor quality illustrations and
photographs, print bleed-through, substandard margins, and improper
alignment can adversely affect reproduction.
In the unlikely event that the author did not send a complete manuscript
and there are missing pages, these will be noted. Also, if unauthorized
copyright material had to be removed, a note will indicate the deletion.
®
UMIUMI Microform 3164164
Copyright 2005 by ProQuest Information and Learning Company.
All rights reserved. This microform edition is protected against
unauthorized copying under Title 17, United States Code.
ProQuest Information and Learning Company 300 North Zeeb Road
P.O. Box 1346 Ann Arbor, Ml 48106-1346
Reproduced with permission of the copyright owner. Further reproduction prohibited without permission.

Copyright by Holly C. Harrison
2005
Reproduced with permission of the copyright owner. Further reproduction prohibited without permission.
ACKNOWLEDGEMENTS
I would first like to thank my committee members Dr. Alan Poling, Dr. John
Austin, and Dr. Maria Malott for their expertise and guidance during this dissertation and
throughout my career at Western Michigan University.
I cannot begin to express my gratitude to my advisor, Dr. Richard Malott. He has
been a major part of my life during the last 6 years. He has not only taught me how to be
an expert behavior analyst, he has taught me how to be a true professional. He has
dedicated so much of himself to making me the best that I can be. It is a true pleasure to
work with someone who is such an expert in interpersonal skills and a master of the art of
sincere appreciation. I hope I can continue to give him my most sincere appreciation.
I also want to thank all of the research assistants who put so much time and hard
work not only into the research studies, but also into serving as excellent performance
managers for my personal and professional self-management interventions: Nathifa
Davis, Allison Mueller, Carie Vella, Cheryl Paberzs, and James Macon.
I may never have heard of behavior analysis if it were not for Dr. Max Brill. I
thank him for getting me hooked on behavior analysis from the very first day of my very
first class with him. Not only is he an excellent teacher, he also went out of his way to get
me involved in the field and to get me to continue on to graduate school.
I am so very appreciative that I have such a loving and supportive family, without
whom I would not have developed the skills to get me to this point.
ii
Reproduced with permission of the copyright owner. Further reproduction prohibited without permission.
Acknowledgements—Continued
I would also like to thank my fiance, Shawn, for being the wonderful person that
he is. I am so lucky to have him in my life supporting me in every way and in everything
that I do. I am so grateful for his excellent editing skills and the time he spent proofing
the final versions of this dissertation; he is good.
I have to make a few final acknowledgements. Self-management interventions
have played a major role in my life over the past 6 years. In addition to studying the
interventions of others, I have been applying self-management procedures to many of my
own behaviors. I attribute a good part of my personal and professional success to my use
of self-management procedures. In combination with self-management, I have to
acknowledge caffeine, sugar, and the 24-hour McDonald’s for the additional support they
provided during the final days of completing this dissertation.
Most of all, I am so thankful that I am able to do what I love.
Holly C. Harrison
iii
Reproduced with permission of the copyright owner. Further reproduction prohibited without permission.
TABLE OF CONTENTS
ACKNOWLEDGMENTS.......................................................................................... ii
LIST OF TABLES...................................................................................................... vii
LIST OF FIGURES..................................................................................................... viii
CHAPTER
I. INTRODUCTION.......................................................................................... 1
Defining Self-Management................................................................... 1
Self-Management Techniques............................................................... 5
Self-Recording of Performance..................................................... 5
Self-Delivery of Reinforcers.......................................................... 6
Self-Selection of Target Behaviors and Goals for Those T arget Behaviors............................................................................. 7
Self-Instruction................................................................................ 8
Collateral Benefits of Self-Management.............................................. 9
Potential Collateral Benefits.......................................................... 9
Empirical Demonstrations of the Collateral Benefits.................. 10
The Current Research............................................................................. 13
Self-Management Procedures........................................................ 13
Self-Recorded Data......................................................................... 19
General Procedures......................................................................... 20
H. GENERAL CONTEXT OF THE STUDIES....................... 21
IE. STUDY 1: A SURVEY OF SELF-MANAGEMENT PROBLEMS 24
Introduction.................................................................................... 24
iv
Reproduced with permission of the copyright owner. Further reproduction prohibited without permission.
Table of Contents—Continued
CHAPTER
Method..................................................................................................... 24
Participants and Setting.................................................................. 24
Procedures....................................................................................... 24
Results and Discussion........................................................................... 24
IV. STUDY 2: SELF-MANAGEMENT INTERVENTIONS.......................... 35
Introduction............................................................................................. 35
The Self-Management-Intervention Data............................................. 35
Method............................................................................................. 35
Results and Discussion.................................................................. 36
The Self-Management Survey............................................................... 48
Method............................................................................................. 48
Results and Discussion.................................................................. 49
V. STUDY 3: TRANSFER................................................................................. 55
Introduction............................................................................................. 55
Method..................................................................................................... 55
Participants and Setting.................................................................. 55
Procedures....................................................................................... 55
Results and Discussion........................................................................... 56
VI. STUDY 4: MAINTENANCE...................................................................... 58
Introduction............................................................................................. 58
Method..................................................................................................... 58
Participants and Setting................................................................... 58
v
Reproduced with permission of the copyright owner. Further reproduction prohibited without permission.

Table of Contents—Continued
CHAPTER
Procedures....................................................................................... 58
Results and Discussion........................................................................... 59
VII. GENERAL DISCUSSION............................... 62
Vm. GENERAL CONCLUSION......................................................................... 64
REFERENCES........................................................................................................... 66
APPENDICES
A. Research Protocol Clearance........................................................................ 71
B. Initial Research.............................................................................................. 73
C. Materials Used in Initial Research............................................................... 85
D. Procrastination Survey.................................................................................. 89
E. Self-Management Survey.............................................................................. 98
F. Transfer Survey.............................................................................................. 101
G. Maintenance Survey....................................................................................... 103
BIBLIOGRAPHY......................................................................................................... 105
vi
Reproduced with permission of the copyright owner. Further reproduction prohibited without permission.

LIST OF TABLES
B1. Summary of results for all participants of Experiment..1................................ 78
B2. Summary of results for all participants of Experiment 2 .............................. 81
B3. Summary of results for participant of Experiment 3 ....................................... 83
vii
Reproduced with permission of the copyright owner. Further reproduction prohibited without permission.

LIST OF FIGURES
1. The three-contingency model of self-management applied to exercise 16
2. What is your opinion of your body weight?..................................................... 26
3. How many days per week do you drink caffeine?.......................................... 27
4. How many days per week do you drink alcohol?........................................... 27
5. How many days per week do you wish you drank alcohol for youroptimum health and wellbeing?........................................................................ 28
6. How many days per week do you use marijuana?......................................... 29
7. How many days per week do you wish you used marijuana for your optimum health and wellbeing?........................................................................ 29
8. What is your grade point average?................................................................... 30
9. What is your average grade on term papers?................................................... 31
10. How many hours per week do you study, outside of class?........................... 32
11. How many classes did you miss last semester because you just blewthem off?............................................................................................................ 32
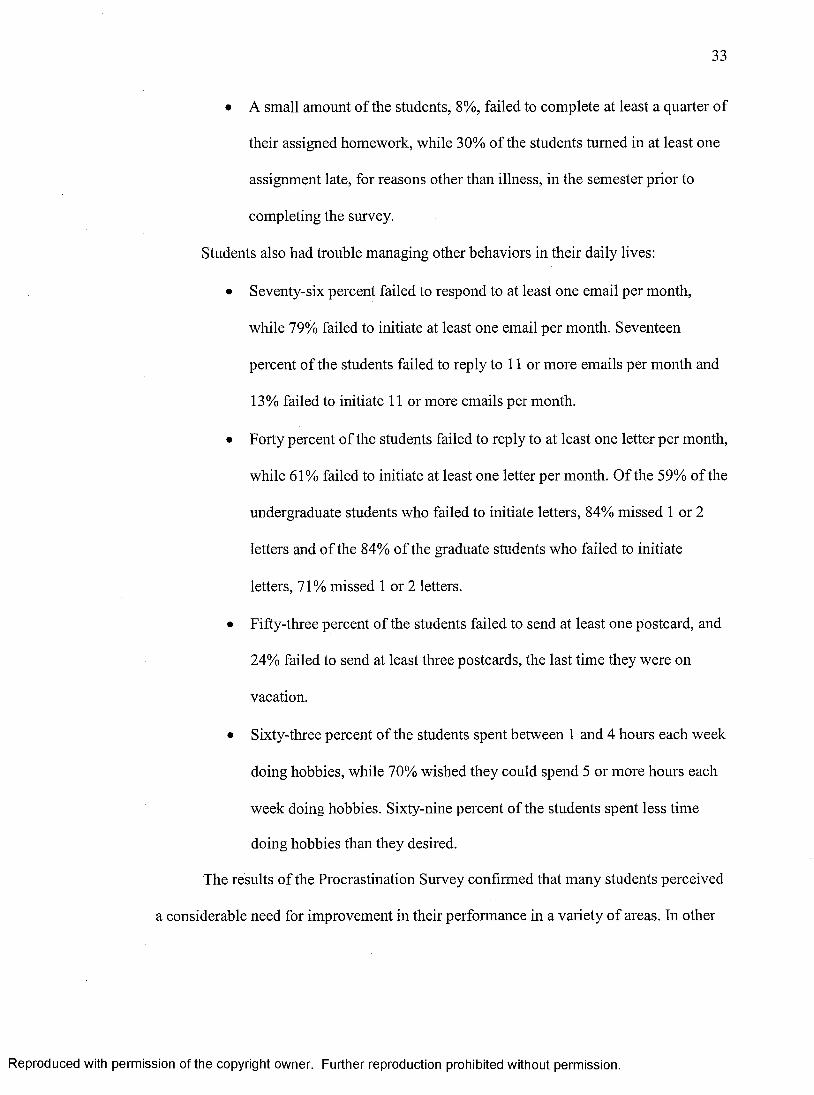
12. Student 1 ’s target-behavior graph of the number of days per week the knee-exercise goal was met............................................................................... 37
13. Student 1 ’s benefit-measure graph for doing knee exercises..................... 37
14. Student 2’s target-behavior graph for the number of hours spentpracticing songs on the guitar........................................................................... 38
15. Student 2’s benefit-measure graph for practicing songs on the guitar 39
16. Student 3’s target-behavior graph for number of cigarettes smoked perday....................................................................................................................... 40
17. Baseline and intervention mean amounts of target behavior for students whose goal was to increase behavior............................................................... 42
viii
Reproduced with permission of the copyright owner. Further reproduction prohibited without permission.

List of Figures—Continued
18. Baseline and intervention mean amounts of target behavior for students whose goal was to increase behavior and had a goal of 3 days per week 43
19. Baseline and intervention mean amounts of target behavior for students whose goal was to increase behavior and had a goal of 4 days per week 44
20. Baseline and intervention mean amounts of target behavior for students whose goal was to increase behavior and had a goal of 5 days per week 45
21. Baseline and intervention mean amounts of target behavior for students whose goal was to increase behavior and had a goal of 7 days per week 46
22. Baseline and intervention mean frequencies of target behavior forstudents whose goal was to decrease behavior................................................ 47
23. Percentage of weeks the goal was met during intervention for studentswho were decreasing behavior.......................................................................... 48
24. On what behavior did you do your self-management project?...................... 50
25. How important was accomplishing the goal of your self-management project?................................................................................................................ 51
26. In your opinion, was your self-management project successful in termsof helping you meet your goals?....................................................................... 51
27. How valuable was doing a self-management project in learning aboutthe management of human performance?........................................................ 52
28. Was your performance manager effective in keeping you on track withyour project?...................................................................................................... 53
29. How many weeks were you supposed to pay a fine?..................................... 54
30. How useful was self-management in helping you improve thosebehaviors?.......................................................................................................... 56
31. Why didn’t you continue using self-management procedures?.................... 60
32. What would encourage you to use self-management procedures andkeep them going?............................................................................................... 61
ix
Reproduced with permission of the copyright owner. Further reproduction prohibited without permission.

1
CHAPTER I
INTRODUCTION
Defining Self-Management
Self-management techniques allow people to modify their own behavior. Self
management is not a specific, unitary intervention, but rather a collection of techniques.
These techniques range from a person simply making a commitment to change to
completely designing and implementing an intervention. Regardless of the specific
elements, all self-management techniques are implemented to help people control their
own behavior with less reliance on outside behavior-change agents. Once learned, self
management techniques can then be applied to a wide variety of everyday behaviors.
Origins of the term self-management are typically traced back to Skinner
(Newman, Buffington, Hemmes, & Rosen, 1996). When he first began writing about the
topic, he called it self-control, rather than self-management (Skinner, 1953). Skinner
(1953) wrote, “When a man controls himself, chooses a course of action, thinks out the
solution to a problem, or strives toward an increase in self-knowledge, he is behaving. He
controls himself precisely as he would control the behavior of anyone else—through the
manipulation of variables of which behavior is a function” (p. 228). Skinner regards self-
control as controlling one’s own behavior, when that particular behavior produces
conflicting consequences. He uses an example of drinking alcohol. The behavior
produces the reinforcing consequences of less anxiety and increased ease of social
interactions and, at the same time, the aversive consequences of the physical illness and
the negative effects of irresponsible behaviors. Thus, there are both aversive and
reinforcing consequences to drinking alcohol.
Reproduced with permission of the copyright owner. Further reproduction prohibited without permission.

In his description of self-control, Skinner also describes a number of methods to
use. These methods involve using physical restraint or physical aid, manipulating an
eliciting or discriminative stimulus, manipulating an establishing operation, manipulating
emotional conditions, using aversive stimulation, using various drugs, using self
reinforcement, using punishment, and engaging in some competing response (Skinner,
1953). All of these self-control techniques are similar to the techniques a person would
use to control the behavior of others.
Eventually the terms self-control and self-management were used somewhat
interchangeably, though it is not clear when this shift occurred. The term self
management appeared in Skinner’s About Behaviorism in 1974 (Epstein, 1997).
Researchers in the 1970’s also used the term self-management, along with self-control, to
describe their studies. Brigham (1982) states that, “presently no general consensus exists
in the general area of research and treatment that dictates how each term should be used”
(p. 33). Some behavior analysts still use the two terms interchangeably, but others argue
for a distinction. Brigham (1982) argues that self-management is a better term because it
has connotations of behavior. Self-control was often used as a noun and referred to as a
cause of behavior or something inside the organism. Self-management has, therefore,
been viewed as a more precise, technical term by some in the field of behavior analysis.
This lack of agreement on the distinction between self-control and self-management is
only one issue in the attempt to define self-management.
Some differences appear in the research described as self-control versus that
described as self-management. The topic of self-control has been addressed in the basic
research literature, where these basic researchers often state the defining features of self
Reproduced with permission of the copyright owner. Further reproduction prohibited without permission.

3
control. Rachlin and Green (1972) present self-control as the delay of gratification. They,
along with other researchers, examine whether organisms behave in ways that produce
either immediate reinforcers or slightly delayed, larger reinforcers. Rachlin (1974) says,
“When subjects show self-control they prefer larger rewards in the future to smaller
rewards in the present or, symmetrically, avoid greater pain in the future in return for
lesser pain in the present” (p. 94-95). Though this characteristic of delayed versus
immediate consequences is common in the basic self-control literature, examples will be
given to show it is not always characteristic of the applied literature.
Other descriptions of self-control appear in the early, applied research. In their
review of applications of self-control procedures used by children, O’Leary and Dubey
(1979) write, “The term ‘self-control’ has been employed historically as a rubric for two
related, but theoretically distinct, areas of research. In one instance, the independent
variable (e.g., a modeling film) is implemented by the experimenter, and the dependent
variable is either a child behavior explicitly identified as a self-controlling behavior (e.g.,
self-administration of a reinforcer) or a behavior presumably mediated by a self
controlling behavior (e.g., delay of gratification)” (p. 449). In the applied research the
topic of self-control begins to address not only the delay of gratification, a dependent
variable, but also a variety of self-controlling behaviors, such as self-instructions and
self-reinforcement, which are independent variables. This change in the use of the term
self-control leads to characteristics related to self-management research.
Research described as using self-management has been limited to the applied
literature, whereas research described as self-control has crossed both the applied and
basic domains. Self-management has been consistently applied to human behavior, and
Reproduced with permission of the copyright owner. Further reproduction prohibited without permission.

not to the behavior of other animals. Applied research tends to study ways people can fix
their self-control problems. Basic research tends more to address the parameters of the
problems themselves and the variables of which they are a function. Therefore, the nature
of applied research probably causes the limitation of the term self-management to human
behavior. This applied research covers a broad range of self-management interventions.
The researchers do not define the term self-management. More often, they simply state
that self-management was used and then go on to describe the specific techniques used as
part of the self-management. These techniques range from self-monitoring to self
reinforcement. Such a broad range of self-management applications leads most readily to
a broad definition of self-management.
One of the broadest definitions of self-management is given by Kazdin (2001),
who, similar to Skinner (1953), defines self-management as the application of behavioral
principles to one’s own behavior. Kazdin (2001) says, “The techniques.. .represent
instances in which one individual (the behavior-change agent) manages the contingencies
to alter the behavior of another individual (the client). The client can apply many of the
techniques to control his own behavior. When techniques are applied to alter one’s own
behavior, they are referred to as self-control or self-management techniques” (p. 302). In
reviewing the wide array of techniques researchers classify as self-management, Kazdin’s
definition seems to best describe all of those techniques. This broad definition of self-
management encompasses all self-applications of behavior analysis, no matter how
specific or how all-encompassing. Though this definition may seem simplistic, it seems
to best represent the way behavior analysis, as an entire field, refers to self-management.
Reproduced with permission of the copyright owner. Further reproduction prohibited without permission.
5
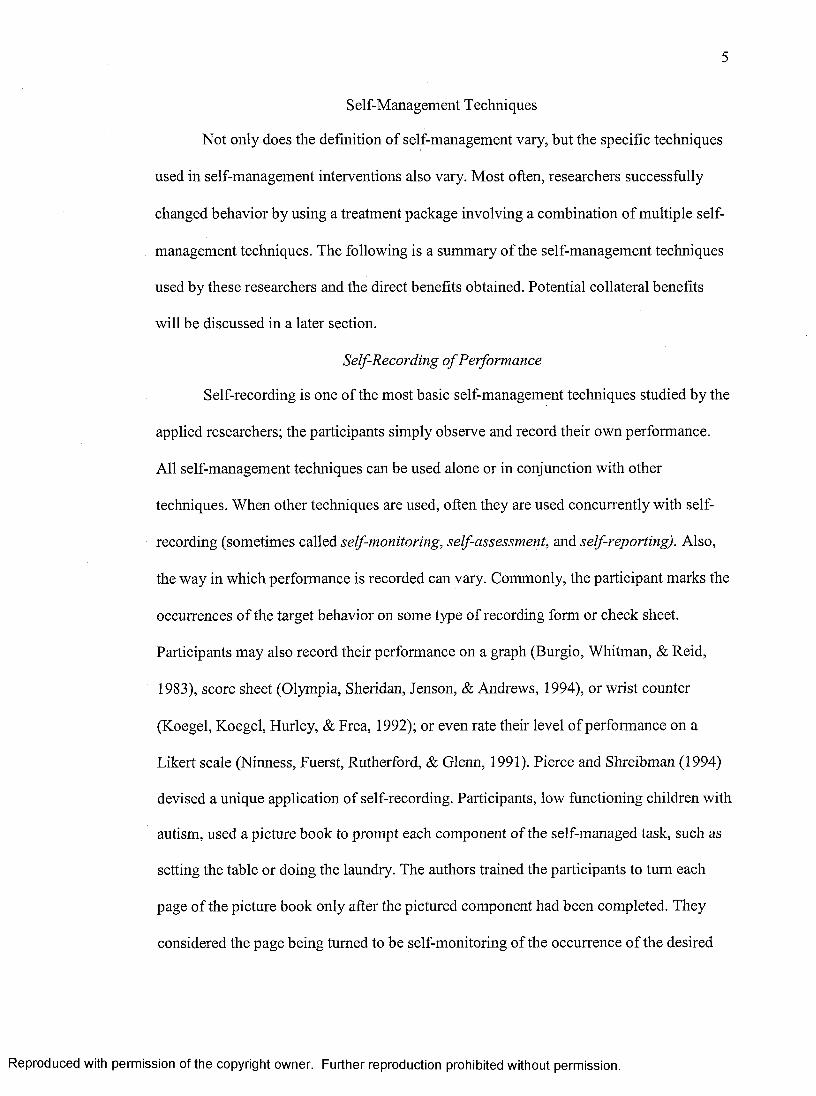
Self-Management Techniques
Not only does the definition of self-management vary, but the specific techniques
used in self-management interventions also vary. Most often, researchers successfully
changed behavior by using a treatment package involving a combination of multiple self
management techniques. The following is a summary of the self-management techniques
used by these researchers and the direct benefits obtained. Potential collateral benefits
will be discussed in a later section.
Self-Recording o f Performance
Self-recording is one of the most basic self-management techniques studied by the
applied researchers; the participants simply observe and record their own performance.
All self-management techniques can be used alone or in conjunction with other
techniques. When other techniques are used, often they are used concurrently with self-
recording (sometimes called self-monitoring, self-assessment, and self-reporting). Also,
the way in which performance is recorded can vary. Commonly, the participant marks the
occurrences of the target behavior on some type of recording form or check sheet.
Participants may also record their performance on a graph (Burgio, Whitman, & Reid,
1983), score sheet (Olympia, Sheridan, Jenson, & Andrews, 1994), or wrist counter
(Koegel, Koegel, Hurley, & Frea, 1992); or even rate their level of performance on a
Likert scale (Ninness, Fuerst, Rutherford, & Glenn, 1991). Pierce and Shreibman (1994)
devised a unique application of self-recording. Participants, low functioning children with
autism, used a picture book to prompt each component of the self-managed task, such as
setting the table or doing the laundry. The authors trained the participants to turn each
page of the picture book only after the pictured component had been completed. They
considered the page being turned to be self-monitoring of the occurrence of the desired
Reproduced with permission of the copyright owner. Further reproduction prohibited without permission.

behavior. This self-management treatment package produced a decrease in inappropriate
behavior and an increase in on-task behavior for all three participants.
Self-Delivery o f Reinforcers
Self-delivery of reinforcers includes true self-reinforcement and what researchers
often call self-reinforcement, though it is actually the delivery of reinforcers that follow
the behavior by too great a time to reinforce the behavior on which those reinforcers were
contingent. Self-delivery of reinforcers can not only be the delivery of reinforcers to
oneself, but also the recruitment of reinforcers. One example of the self-delivery of
reinforcers is provided by Ballard and Glynn (1975). They used a procedure in which
students in a regular, third-grade class awarded themselves points for achieving their
writing goals. These writing goals were based on the number of verbs, adjectives, and
sentences written in the students’ stories. Students could then exchange each point earned
for one minute of a self-selected activity reinforcer. This self-delivery of reinforcers
successfully increased the target behaviors. The number of verbs, adjectives, and
sentences each increased to more than twice its baseline level.
An example of recruitment of reinforcers can be seen in Connell, Carta, and
Baer’s (1993) study. Preschoolers with developmental delays learned to initiate
classroom transitions, such as cleaning up toys when playtime was nearing an end. The
children recorded correct behavior by marking a smiley face or recorded incorrect
behavior by marking a sad face on a posted recording form. They then recruited praise
from a treatment provider by saying, “I’m done” or recruited a hug by approaching the
treatment provider with arms outstretched. This combination of self-recording and
recruitment of reinforcers “generated upward trends in active engagement, appropriate
recruitment, and total teacher praise” (p. 349).
Reproduced with permission of the copyright owner. Further reproduction prohibited without permission.
7
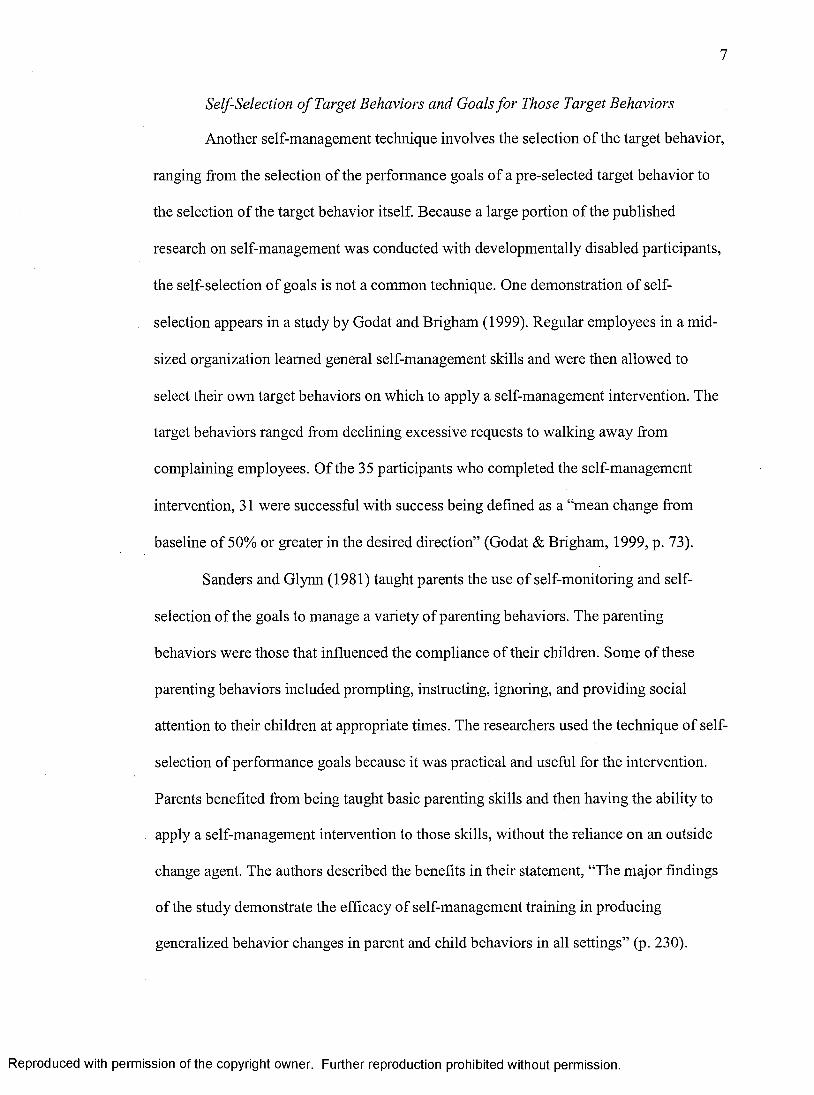
Self-Selection o f Target Behaviors and Goals for Those Target Behaviors
Another self-management technique involves the selection of the target behavior,
ranging from the selection of the performance goals of a pre-selected target behavior to
the selection of the target behavior itself. Because a large portion of the published
research on self-management was conducted with developmentally disabled participants,
the self-selection of goals is not a common technique. One demonstration of self
selection appears in a study by Godat and Brigham (1999). Regular employees in a mid
sized organization learned general self-management skills and were then allowed to
select their own target behaviors on which to apply a self-management intervention. The
target behaviors ranged from declining excessive requests to walking away from
complaining employees. Of the 35 participants who completed the self-management
intervention, 31 were successful with success being defined as a “mean change from
baseline of 50% or greater in the desired direction” (Godat & Brigham, 1999, p. 73).
Sanders and Glynn (1981) taught parents the use of self-monitoring and self-
selection of the goals to manage a variety of parenting behaviors. The parenting
behaviors were those that influenced the compliance of their children. Some of these
parenting behaviors included prompting, instructing, ignoring, and providing social
attention to their children at appropriate times. The researchers used the technique of self-
selection of performance goals because it was practical and useful for the intervention.
Parents benefited from being taught basic parenting skills and then having the ability to
apply a self-management intervention to those skills, without the reliance on an outside
change agent. The authors described the benefits in their statement, “The major findings
of the study demonstrate the efficacy of self-management training in producing
generalized behavior changes in parent and child behaviors in all settings” (p. 230).
Reproduced with permission of the copyright owner. Further reproduction prohibited without permission.
Another study, conducted by Burgio, Whitman, and Reid (1983), showed that
self-monitoring, self-selection of the goals, and self-reinforcement applied in an
institutional setting could produce changes in direct-care staff and resident behaviors.
Staff members used self-management to increase their interactions with residents and,
concurrently, residents’ appropriate behaviors increased. Though maintenance was
examined, treatment gains varied during this phase of the study.
Olympia, Sheridan, Jenson, and Andrews (1994) used self-monitoring, self-
instruction, self-reinforcement, and self-selection of the goals with the purpose of
determining whether this self-selection increases achievement of the goal. There was no
difference in students’ goal achievement of homework accuracy when those goals were
selected by the teachers, as compared to when they were selected by the students,
themselves. However, the students who selected their own goals for homework
completion met their goals more often than students whose goals were selected by the
teacher. These results may simply be accounted for by the documented fact that students
consistently selected lower goals for themselves than the teacher selected for them. Based
on this possible confound, it is not clear how important self-selection of performance
goals is in terms of goal achievement.
Self-Instruction
Christian and Poling (1997) used a combination of self-selection of goals, self-
instructions, self-recording, and self-delivery of reinforcers to help improve the job
performance of adults with developmental disabilities. Participants selected their own
goals for the amount of time in which the work tasks would be completed. They then
emitted self-descriptive verbalizations while they completed the work tasks, recorded the
frequency of the behavior in a notebook, and self-delivered reinforcers for their desired
Reproduced with permission of the copyright owner. Further reproduction prohibited without permission.

performance. The self-management intervention had a positive, but not always large,
effect on task performance. Though this study did not attempt to demonstrate long-term
maintenance, it did demonstrate that the improved performance maintained over a
maximum of five maintenance sessions. The participants, their coworkers, and their
supervisors all rated the intervention as acceptable. After treatment, both participants
were able to keep jobs that they were at risk of losing and one even earned a raise.
Therefore, as Christian and Poling pointed out, self-management techniques not only
produce direct benefits on the target behavior, they can also produce collateral benefits.
Collateral Benefits of Self-Management
This section contains a description of the various potential collateral benefits of
using self-management techniques and presents some of the empirical research
demonstrating these collateral benefits.
Potential Collateral Benefits
Maintenance
Researchers hypothesize that because self-management interventions place more
of the behavioral control with the individual, the intervention effects are more likely to
maintain after the behavior analyst or therapist has terminated the intervention. Based on
the principles of behavior, it might seem logical that self-management interventions
would more likely maintain once the behavior analyst is no longer present. However, this
assumes that the benefits of doing the self-managed behaviors are involved in some sort
of behavioral contingencies so that they will actually maintain those self-management
behaviors, perhaps through reinforcement or an analog to reinforcement. Empirical
demonstrations of the actual occurrence of maintenance will be presented in the
following section.
Reproduced with permission of the copyright owner. Further reproduction prohibited without permission.

10
Transfer
Researchers have also hypothesized that self-management interventions might
generate rules that can then transfer to other areas of the clients’ life. Burgio and Burgio
(1986) hypothesize that once self-management skills are acquired, they might then be
applied to a wide variety of behaviors and situations with little or no involvement of the
therapist. Empirical demonstrations of transfer will be discussed in the following section.
Cost
Additionally, researchers have hypothesized that cost could be greatly reduced by
teaching people to manage their own behavior, because it would require less participation
from outside change agents. People would be much more likely to receive services with
this decreased cost/effort, because implementation of the intervention becomes easier and
more practical for the behavior analysts or treatment providers. Cole (1992) hypothesized
that teachers could spend more time teaching the entire class, because they would not
need to spend so much of their time with one student who is having behavioral
difficulties. The empirical demonstrations of all of these benefits will be discussed below.
Empirical Demonstrations o f the Collateral Benefits
These collateral benefits are often merely hypothesized, rather than demonstrated
(e.g., Ballard & Glynn, 1975; Burgio & Burgio, 1986; Koegel et. al., 1992; Olympia et al.
1994). It may be overly optimistic to hypothesize about the extent to which these
collateral benefits will actually occur even when they are planned as part of the
intervention, let alone when they are hypothesized to occur spontaneously. However,
some of these benefits have been empirically demonstrated.
Brigham (1989) taught regular-education, middle-school students self-
management skills and then examined whether those students used the skills outside of
Reproduced with permission of the copyright owner. Further reproduction prohibited without permission.
the training environment without any further instruction or prompting to do so. Over a
period of 10 weeks, one group of students participated in a course on operant behavior
and self-management, while another group participated in a general psychology course.
Both groups then participated in the “Good Behavior Game” in their math class. The
“Good Behavior Game” is a system for providing consequences to the entire group based
on the behavior of the individuals in that group. The group of students with the least
number of disruptive behaviors at the end of class earned extra free time. During the
“Good Behavior Game” in their math class, the group of students who learned self-
management decreased their rate of disruptions to near zero, while the group of students
who did not learn self-management had a consistent rate of disruptions throughout the
intervention. None of the students reported realizing that the self-management or general
psychology courses were related to the math course where the “Good Behavior Game”
was used. Over half of the students reported attempting to use the self-management skills
to manage their disruptive behavior during the “Good Behavior Game.”
Koegel and Koegel (1990) showed that self-recording could be incorporated into
a treatment package that decreased the stereotypic behaviors of clients diagnosed as
autistic. They showed that the results maintained during 50 weeks of maintenance probes
with little involvement from service providers. This decreased involvement of service
providers made the intervention less costly, less timely, less effortful, and therefore, more
practical than interventions that require intensive involvement of service providers. The
authors discussed the benefit of transfer in terms of how fast participants could be trained
to use self-recording in settings other than the training setting. Though they did not get
Reproduced with permission of the copyright owner. Further reproduction prohibited without permission.

12
spontaneous application of the treatment in novel settings, participants were quickly
trained to apply the treatments in those settings.
Kissel, Whitman, and Reid (1983) demonstrated that a self-recording component
could be used to train staff members to interact with severely and profoundly
developmentally disabled clients in such a way that would increase the independent self-
care behaviors of those clients. The staff behaviors related to verbal instructions, physical
guidance, and reinforcement of client behaviors. The staff members appropriately and
consistently applied the self-management skills and the clients’ rate of independent self-
care behaviors also increased. The staff use of the self-management package transferred
to client behaviors other than those used in the training sessions and treatment gains
maintained for a maximum of 46 observation sessions conducted over a period of 6 to 8
weeks following the intervention. In addition, social validity was shown in the staffs
overall positive rating of the intervention. This high level of social validity may have
contributed to the high level of staff compliance with the intervention.
Sowers, Verdi, Bourbeau, and Sheehan (1985) had developmentally disabled
participants using a picture-cue system and self-monitoring to train initiation of various
work behaviors. The intervention was designed to help the participants function in typical
employment settings, where minimal supervision and reinforcement are the norm. The
self-management package resulted in high levels of independent task changes for all of
the participants. This means the participants no longer relied on constant supervision and
reinforcement, making their training more efficient and less costly for their supervisors
by requiring no more effort than is required with their typically functioning employees.
Reproduced with permission of the copyright owner. Further reproduction prohibited without permission.

The authors also found that the high levels of independent task changes maintained
during a month-long maintenance phase.
Because research on a variety of interventions addresses maintenance, it is the
most commonly demonstrated benefit in the self-management literature. However, all of
the potential benefits of maintenance, transfer, and cost were demonstrated in the
collection of studies described in this section. Various other studies have also
demonstrated at least one of the collateral benefits of using self-management techniques
(Burgio, Whitman, & Reid, 1983; Connell, Carta, & Baer, 1993; Dean, Malott, & Fulton,
1983; Pierce & Schreibman, 1994; Sanders & Glynn, 1981; Stahmer & Schreibman,
1992).
So, these studies demonstrate that interventions based on self-management of
performance can produce transfer, maintenance, and cost reduction. However, because
these interventions were not compared to general performance management, it is not
clear that self-management interventions are superior to general performance
management in terms of obtaining transfer, maintenance, and the resulting cost reduction.
In addition, the studies did not determine the value of each individual self-management
technique, as they all involved some sort of treatment package.
The Current Research
Self-Management Procedures
The self-management procedures used in this dissertation are based on the three-
contingency model of self-management (to be discussed shortly) and are described in I ’ll
Stop Procrastinating When I Get Around to It (Malott & Harrison, 2005), to be referred
to as Procrastination. The current researcher empirically evaluated and improved this
book as part of her Master’s thesis.
Reproduced with permission of the copyright owner. Further reproduction prohibited without permission.
14
Procrastination was designed to help university students acquire the skills
necessary to use behavior-analytic self-management procedures. As part of these self
management procedures, the book, both implicitly and explicitly, emphasized the
following behavioral systems analysis steps: 1) select a behavior to improve, 2) examine
the natural contingencies, 3) design an intervention that involves changing the current
contingencies, 4) implement the intervention, 5) evaluate the intervention, and 6) revise
the intervention until reaching the goal.
In conjunction with the six steps of behavioral systems analysis, the self
management procedures consisted of a package of several specific self-management
techniques. The self-management package included all of the techniques described earlier
(self-recording, self-delivery of the behavioral consequences, self-selection of the target
behaviors and goals, and self-instruction) along with recruiting a performance manager to
help support the intervention. The recruited performance manager was supposed to
provide support by meeting with the participant, at least weekly, to discuss whether the
performance goals were met and whether the self-management procedures were
implemented as planned. Most often the participants chose to lose money when they
failed to meet their performance goals; and most often their performance managers were
the people to whom they gave that money.
The essential feature of the self-management procedures is that they were
designed around the three-contingency model of se/f-management, which is an adaptation
of a more general model, the three-contingency model of performance management
(Malott & Trojan Suarez, 2004). The three-contingency model of self-management points
out that people can use delayed outcomes to control their behavior and points out the
Reproduced with permission of the copyright owner. Further reproduction prohibited without permission.
15
importance of having a deadline for the behavior. Unlike the three-contingency model of
performance management, in the three-contingency model of self-management, the
person whose behavior is being modified is the same person who selects the behavior,
selects the outcome for that behavior, provides the resources (outcomes), and works with
the performance manager.
The three contingencies are 1) the ineffective, natural contingency, 2) the
effective, indirect-acting, performance-management contingency, and 3) the effective,
inferred, direct-acting contingency. Figure 1 is an example of the three-contingency
model of self-management applied to the behavior of exercising and will be used to
explain the model.
The natural outcome of one instance of Jen’s exercise is only an infinitesimal
increase in her health. Though many instances of exercise will cumulate into the result of
a significant improvement of health, the outcome of each instance of exercise is too small
to control that instance of exercise.
This effective, explicitly designed performance-management contingency controls
behavior because the outcome of each instance of exercise is both sizable and probable;
this contingency can be effective whether its outcome is immediate or delayed. Most
often, with verbal human beings, the performance-management contingency is indirect
acting, as illustrated in Figure 1. An indirect-acting contingency controls behavior,
though the outcome is too delayed to directly reinforce or punish the response.
When the performance-management contingency is indirect acting, it is the
statement of the rule describing the performance-management contingency that indirectly
controls behavior by creating the inferred, direct-acting contingency (the third
Reproduced with permission of the copyright owner. Further reproduction prohibited without permission.

16
contingency in Figure 1). The statement of the rule makes noncompliance with the rule,
combined with proximity to the deadline, an aversive condition as reflected in the
inferred, direct-acting contingency. The outcome in the inferred contingency is
immediate and directly controls the target behavior. Failing to exercise (noncompliance
with the rule) produces various aversive states, commonly called fear, anxiety, etc.;
exercising (complying with the rule) immediately terminates the fear related to losing the
money.
Ineffective Natural ContingencyBefore Behavior After
Jen has a ----------- N Jen exercises . . . N Jen hasgiven level " ~ V for 30 minutes. V infinitesimallyof health. better health.
Performance-Management Contingency SD (Deadline): Before going to bed
Before Behavior AfterJen will lose $5 ---- N Jen exercises ---- N Jen won't lose
at the end of V for 30 minutes. V $5 at the end ofthe week. the week.
Inferred Direct-Acting ContingencyBehavior
Jen exercises for 30 minutes.
BeforeJen fears the loss of $5.
AfterJen doesn't fear the loss
of $5.Figure 1. The three-contingency model of self-management applied to exercise.
The important feature of both of the models is the analysis of why the natural
contingencies for supporting performance often fail. Malott and Trojan Suarez (2004)
have analyzed the cause of poor self-management in terms of the size and probability of
the natural outcome, rather than the delay of that outcome. They said, “Poor self
management results from poor control by rules describing outcomes that are either too
Reproduced with permission of the copyright owner. Further reproduction prohibited without permission.
17
small (though often of cumulative significance) or too improbable. The delay isn’t
crucial” (p. 418). Therefore, interventions in the present study involved adding outcomes
that were both sizable and probable, whether immediate or delayed.
This analysis contrasts with the traditional view, as exemplified by Rachlin and
Green (1972), who applied their analysis within the context of self-control. In their
laboratory experiments, smaller, immediate outcomes controlled behavior better than
larger, delayed outcomes, thereby demonstrating poor self-control. They also examined
what they called commitment. The pigeon could “make a choice” between two
alternatives by pecking the corresponding keys. The two alternatives were (1) a delay
followed by another opportunity to select either a small, immediate outcome or a larger,
delayed outcome and (2) a delay followed by the restriction to the large, delayed
outcome. By “choosing” the second alternative, the pigeon showed commitment. The
greater the delay between the initial “choice” and the opportunity to make the response
that produced the small, immediate or larger, delayed outcome, the better the commitment
and, therefore, the better the self-control.
Various problems arise when trying to use Rachlin and Green’s research to
understand real-world, human self-management problems. The delays occurring in
everyday human behavior are far greater than those used in the laboratory experiments
with nonhumans. Human behavior can be controlled by rules specifying outcomes
delayed by hours, weeks, or even years, whereas the nonhuman behavior in the laboratory
experiments was controlled by outcomes delayed by only seconds.
An additional, important feature of the three-contingency model of self
management is that the techniques are largely based on aversive control, whether
Reproduced with permission of the copyright owner. Further reproduction prohibited without permission.
designed to increase or decrease behavior. When decreasing behavior, aversive control is
used in the form of a punishment or analog-to-punishment contingency. When increasing
or maintaining behavior, aversive control is used in the form of an analog-to-avoidance
contingency. The problem with using reinforcement contingencies is that they do not stop
procrastination; the reinforcer can be obtained at any time no matter how long the
procrastination. To prevent procrastination, a deadline for the behavior needs to be added,
making the contingency an avoidance contingency. If the target behavior does not occur
before the deadline, the opportunity to obtain the reinforcer is lost (aversive control)
(Malott & Trojan Suarez, 2004). Though the researchers whose studies were described
earlier in this paper would describe their self-management techniques as using
reinforcement, the current researcher would describe those self-management techniques
as aversive control because there was an implied deadline for the behavior.
Most often the participants in this dissertation chose to lose a reinforcer they
already possessed. Loss of already-possessed reinforcers was most practical in this type
of non-institutional setting, because the researchers did not have additional reinforcers to
contribute. In some cases, participants also chose to present aversive conditions. They
presented aversive activities, like cleaning and doing exercise and aversive stimuli, like
the pain from the snap of a rubber band on the wrist and the aversive taste of a spoonful
of mustard.
Another important feature of the three-contingency model of self-management
was that the participants designed and implemented their own self-management
procedures with the weekly supervision of their course instructors. This level of
involvement of the participants differs from much of the previous research, where the
Reproduced with permission of the copyright owner. Further reproduction prohibited without permission.

19
participants received a pre-designed self-management intervention whose implementation
was closely supervised by a professional behavior analyst. This difference is most likely
due to the participant pool; whereas the previous research used self-management
predominantly with children in regular education and developmentally disabled people,
all of the self-management procedures in this research were used with normally
functioning college students. For more details on the self-management procedures used in
the current research, refer to Procrastination.
Self-Recorded Data
It should be pointed out that the participants in this research self-recorded all of
their self-management-intervention data. A potential problem arises when using self-
recorded data: the reliability/accuracy of those data is unknown. However, there is some
support for the reliability/accuracy of self-recorded data. Horn and Brigham (1996) cite
Barlow, Hayes, and Nelson’s book for their statement that “Research shows that clearly
defined salient responses that are reported on a daily or weekly basis can be very
accurately self-monitored” (p. 7). The responses recorded in this research are clearly
defined, salient, and recorded at least weekly, if not daily.
Often, in the research on self-management interventions used with average,
adolescent/adult participants where the target behavior occurs in non-institutional
settings, the performance data are self-recorded. These researchers acknowledge the
potential problems of using self-recorded data and attempt to assess, and in some cases,
increase their reliability/accuracy by (1) collecting anonymous survey data about the
honesty of the self-recorded data (Worthington, 1977), (2) making course points (when
the self-management is part of a college-course assignment) contingent on simply
completing the self-management intervention rather than demonstrating successful
Reproduced with permission of the copyright owner. Further reproduction prohibited without permission.

20
behavior change (Clements & Beidleman, 1981), (3) informing participants of the
explicit benefits of their successful use of self-management interventions (Worthington,
1979), and (4) measuring permanent products of the target behavior (Barlow, Hayes, &
Nelson, 1984; McGlynn, 1980, McLaughlin & Nays, 1975). The self-management
interventions used in this dissertation incorporated, to at least some extent, all four of
these techniques.
Also, some point out that self-recorded data have value in spite of their potential
lack of reliability/accuracy (Baldwin, 2000; Barlow et. al., 1984). Baldwin explains,
“There are cases where other data exist, but they are too difficult to obtain or the costs of
obtaining them are not worth the effort” (2000, p. 3).
General Procedures
The research in this dissertation consisted of a series of studies designed to
evaluate the effectiveness of the three-contingency model of self-management, as used by
college students, as part of an extended psychology-course assignment. A survey was
used to assess the students’ self-management problems. The details and overall effects of
the students’ self-management interventions were assessed with surveys and the students’
self-reported performance data. Also, transfer and maintenance of the use of self-
management procedures outside of the course requirements were evaluated using
surveys.
It should be noted that the research in this dissertation follows in the tradition of
much of the self-management research described earlier. This research also involved
treatment packages and did not do an individual component-analysis or a comparison of
self-management techniques and general performance management.
Reproduced with permission of the copyright owner. Further reproduction prohibited without permission.
CHAPTER II
GENERAL CONTEXT OF THE STUDIES
All of the studies described in this paper were conducted with students from
Richard Malott’s sections of Psychology 460: Survey of Behavior Analysis Research,
Psychology 610: Conditioning and Learning, and Psychology 598: Special Projects in
Psychology; the latter two being graduate courses predominantly for Malott’s students.
Because all of the data were collected within the regular course procedures, those course
procedures must be considered as part of the context in which the studies were
conducted. Therefore, the following is a description of the relevant parts of the general
procedures of these courses.
Self-management was a component of all three courses. The Psychology 460 and
Psychology 610 students read Procrastination and completed their own self-management
intervention. All Psychology 598 students had previously completed Psychology 610, so
they completed one or two additional self-management interventions for the Psychology
598 course, without rereading Procrastination. Throughout the semester, the students in
all three courses received additional instruction about self-management and feedback on
their specific self-management interventions from their course instructors. Because the
Psychology 598 course procedures differed somewhat from the procedures of the other
two courses, Psychology 598 will be discussed separately.
The Psychology 460 and Psychology 610 students read Procrastination as the
first assignments of the course. Prior to 2001, students read Procrastination
approximately 3 weeks after the semester had started. Students completed the
Procrastination Survey sometime at the beginning of the semester. Because this survey
was administered by various graduate students from 2001 to 2004, it is not known when
Reproduced with permission of the copyright owner. Further reproduction prohibited without permission.

22
the administration occurred in relation to reading Procrastination. Upon completing
Procrastination, students planned and implemented their own self-management
intervention. They presented their performance data weekly in class, at which time they
received feedback about their intervention from their instructor and peers. The duration
of the interventions ranged from 5 to 10 weeks, depending on the length of the semester.
Students began their self-management interventions by recording at least 1 week
of baseline performance. In some cases, the data reported during baseline were not
representative of performance prior to the start of data collection. In these cases, the self-
observation likely caused some level of reactivity. In order to account for reactivity
during baseline, students sometimes reported retrospective baseline data for low-
frequency behaviors or behaviors with a fairly stable frequency or duration. For example,
retrospective baseline data could be collected on exercise when students never exercised
in the weeks prior to baseline data collection and on eating fast food when students ate it
every day in the weeks prior to baseline data collection. Also, students who could easily
determine a retrospective baseline did not have to spend time recording baseline data as it
occurred and could, therefore, begin their intervention immediately. The use of
retrospective baseline data was introduced in recent semesters, so it is not known how
often students reported retrospective baseline data.
At the end of the semester, after completing between 4 and 10 weeks of
intervention, students concluded their self-management intervention. Though the surveys
were not given every semester, in general students in both classes completed the Self-
Management Survey and the Psychology 460 students also completed the Transfer
Survey at the end of the semester. During the last week of the semester, students gave a
Reproduced with permission of the copyright owner. Further reproduction prohibited without permission.

23
Microsoft PowerPoint presentation about their self-management intervention. They
turned those presentations and a corresponding paper in to their instructors before leaving
class on the day of the presentations.
Students were contacted after the course was over using contact information
collected by their instructors on the first day of class. Students were emailed and/or called
to administer the Maintenance Survey. The contact occurred during the fall 2004
semester and included all previous Psychology 460 and Psychology 610 students for
whom contact information could be obtained.
As discussed earlier, the Psychology 598 students had all previously completed
Psychology 610, so they simply began planning and implementing their self-management
interventions at the beginning of the semester. Some of these students chose to continue
managing the same target behavior as they managed in Psychology 610. Other than these
differences, the procedures of Psychology 598 were the same as those for the Psychology
610 class.
Reproduced with permission of the copyright owner. Further reproduction prohibited without permission.
24
CHAPTER III
STUDY 1: A SURVEY OF SELF-MANAGEMENT PROBLEMS
Introduction
This is the first of a series of studies on the use of self-management procedures to
help students achieve their self-management goals. Surveys were used to assess the
students’ views about areas of poor self-management that were of concern to them.
Though this study was conducted with university students, some, if not most, of the
results might generalize to larger populations.
Method
Participants and Setting
The Procrastination Survey was completed by the Psychology 460 students in the
spring and fall semesters from 2001 to 2004; and was completed by the Psychology 610
students in the summer semesters of 2001 and 2002. Though the survey was given to all
of the students in these classes, it is possible that a small number of students did not turn
in the survey. A total of 312 Psychology 460 students and 25 Psychology 610 students
turned in the survey.
Procedures
The Procrastination Survey (Appendix D) consisted of 55 Likert-scale-rating,
multiple-choice, and fill-in-the-blank questions. The students answered the questions by
marking and writing their answers on a mark-sense form. The surveys were completed
anonymously.
Results and Discussion
Generally, there were no important differences between the graduate and
undergraduate students, and in those cases the data were combined. Where there were
Reproduced with permission of the copyright owner. Further reproduction prohibited without permission.

25
differences, the data were not combined. Not every student answered every question on
the survey. So the number of answers for each question on the survey varied from 333 to
337.
The results of the Procrastination Survey showed that the students had problems
managing a variety of behaviors in different areas of their lives. The students reported
having problems managing daily behaviors that contributed to their health, such as
flossing, exercising, and eating healthful foods:
• Though 94% of the students reported that they knew they should floss,
41% never flossed and 34% flossed only once or twice a week.
• Though 72% of the students exercised at least 1 hour a week, 78% wished
they spent more time exercising.
• Sixty-five percent of the students were not happy with their body weight.
The more overweight the students perceived themselves to be, the less
happy they were with their weight. Figure 2 shows the students’ opinion
of their body weight.
• Although 86% of the students judged their muscle build as “all right,”
only 3% were “very happy” with their muscle build. And the less
muscular the students perceived themselves to be, the less happy they
were with their muscle build.
• Though the students’ frequency of consuming junk food was fairly evenly
distributed from 1 to 7 days a week, 81 % of the students wanted to
consume junk food no more than 2 days per week.
Reproduced with permission of the copyright owner. Further reproduction prohibited without permission.

26
100 -|
90 -
80</)£ 70a>■o3 60wo 50aa)2 40 -{c oe 30 -i<Da.
20
10
0
I Undergraduate □ Graduate
f c I i
Underweight Appropriate 1-5 lbs overweight
Body W eight
6-10 lbs overw eight
More than 10 lbs overweight
Figure 2. What is your opinion of your body weight? Undergraduate N = 311, Graduate N = 25.
• Though 41% wished they never consumed caffeine, 34% drank it every
day. A total of 293 students (88%) drank caffeine and of those students,
88% drank it more frequently than they desired. Figure 3 shows how often
the students drank caffeine.
• Of the 144 students (40%) who used nicotine, 85% used it every day and
81% wanted to never use it.
• Two hundred seventy-nine students (84%) drank alcohol and 41% of those
who drank were drinking it more frequently than they desired. Figures 4
and 5 show the number of days per week students drank alcohol and the
number of days per week students wished they drank alcohol, respectively.
Reproduced with permission of the copyright owner. Further reproduction prohibited without permission.

27
100
90
80 -
V 70 -
3 60 -
ooD)roc<uo
50 -
I Undergraduate □ Graduate
3-4
Number of Days
Figure 3. How many days per week do you drink caffeine? N = 334.
? 30
I Undergraduate □ Graduate
3-4 5-6
Number o f Days
Figure 4. Graduate
How many days per week do you drink alcohol? Undergraduate N = 308, N = 25.
Reproduced with permission of the copyright owner. Further reproduction prohibited without permission.

28
100 -
P 30 -
I Undergraduate □ Graduate
3-4
Number of Days
5-6
Figure 5. How many days per week do you wish you drank alcohol for your optimum health and wellbeing? Undergraduate N = 308, Graduate N = 25.
• Though only 89 of the students (27%) used marijuana, 44% used it more
frequently than they desired and, interestingly, 7% used it less frequently
than they desired. Figure 6 shows how many days per week the students
used marijuana, while Figure 7 shows how many days per week they
wished they used marijuana.
• None of the graduate students used hard drugs such as LSD, heroine, or
cocaine. Though only 25 of the undergraduate students (8%) used hard
drugs, 56% used them more frequently than they desired and 8% used
them less frequently than they desired.
Reproduced with permission of the copyright owner. Further reproduction prohibited without permission.

29
100
® 30
I Undergraduate □ Graduate
3-4
Number of Days
5-6
Figure 6. How many days per week do you use marijuana? Undergraduate N = 309, Graduate N = 25.
100 n
V)
I Undergraduate □ Graduate
1-2 3-4 5-6
N um ber o f Days
Figure 7. How many days per week do you wish you used marijuana for your optimum health and wellbeing? Undergraduate N = 309, Graduate N = 25.
Reproduced with permission of the copyright owner. Further reproduction prohibited without permission.

30
Students also reported having difficulty managing behaviors related to school,
such as studying, writing term papers, and achieving their desired grades:
• Seventy-eight percent of the students had a grade point average of 3.0 or
better (see Figure 8), and 40% of the students were not satisfied with their
grade point average.
100 i
90 -
80 -
•£ 70 -<1)~o2 60 -\ OTi 50o>roc 40
* 30
20 -
10 -
Undergraduate □ Graduate
N/A 4.0 - 3.5 3.49 - 3.0 2.99 - 2.5
Grade Point Average
Below 2.5
Figure 8. What is your grade point average? Undergraduate N = 310, Graduate N = 25.
• Fifty-two percent of the 310 undergraduate students and 20% of the 25
graduate students were not achieving their desired average grade on term
papers. Figure 9 shows the students’ average grades on term papers.
• Forty-five percent of the 311 undergraduate students and 44% of the 25
graduate students started working on term papers shortly before they were
due, “when there was not enough time to do a good job” on the paper.
Reproduced with permission of the copyright owner. Further reproduction prohibited without permission.

31
100
90 -
80 -■ Undergraduate □ Graduate
a>*o
o0)D)roc
a)a.
A B C D E
Grades
Figure 9. What is your average grade on term papers? Undergraduate N = 310, Graduate
• Also, 56% of the 311 undergraduate students and 38% of the 24 graduate
students spent fewer hours studying outside of class than they desired. The
graduate students were spending more time studying (see Figure 10),
which likely accounts for their lower percentage.
• Seventy-seven percent of the 294 undergraduate students and 43% of the
21 graduate students skipped at least 1 class, while 11% skipped 8 or more
classes. Figure 11 shows how many classes the students missed.
• In the semester prior to completing the survey, 53% of the 310
undergraduate students and 32% of the 25 graduate students failed to
complete at least a quarter of the assigned readings for their classes, while
24% of the 310 undergraduates and 12% of the graduates failed to
complete at least half of the assigned readings.
N = 25.
Reproduced with permission of the copyright owner. Further reproduction prohibited without permission.

32
100 -,
90 -
80 -
V 70U3 60 f in
I 30
50 -
40 -
20 -
10
0
I Undergraduate □ Graduate
Hours
12 or more
Figure 10. How many hours per week do you study, outside of class? Undergraduate N = 311, Graduate N = 24.
100
90 -
80 -
■£ 700 TJ3 60 </>0UiTO*■»CO)oL_0
CL
50 -
40 -
30 -
20 -
10 -
I Undergraduate □ Graduate
II l~l In ■N/A 1-3
Classes
4-7 8 or more
Figure 11. How many classes did you miss last semester because you just blew them off? Undergraduate N = 310, Graduate N = 25.
Reproduced with permission of the copyright owner. Further reproduction prohibited without permission.
33
• A small amount of the students, 8%, failed to complete at least a quarter of
their assigned homework, while 30% of the students turned in at least one
assignment late, for reasons other than illness, in the semester prior to
completing the survey.
Students also had trouble managing other behaviors in their daily lives:
• Seventy-six percent failed to respond to at least one email per month,
while 79% failed to initiate at least one email per month. Seventeen
percent of the students failed to reply to 11 or more emails per month and
13% failed to initiate 11 or more emails per month.
• Forty percent of the students failed to reply to at least one letter per month,
while 61% failed to initiate at least one letter per month. Of the 59% of the
undergraduate students who failed to initiate letters, 84% missed 1 or 2
letters and of the 84% of the graduate students who failed to initiate
letters, 71% missed 1 or 2 letters.
• Fifty-three percent of the students failed to send at least one postcard, and
24% failed to send at least three postcards, the last time they were on
vacation.
• Sixty-three percent of the students spent between 1 and 4 hours each week
doing hobbies, while 70% wished they could spend 5 or more hours each
week doing hobbies. Sixty-nine percent of the students spent less time
doing hobbies than they desired.
The results of the Procrastination Survey confirmed that many students perceived
a considerable need for improvement in their performance in a variety of areas. In other
Reproduced with permission of the copyright owner. Further reproduction prohibited without permission.

34
words, they were suggesting a failure to manage their own performance to achieve their
personal life goals. This failure to achieve their goals suggests a need for self-
management interventions.
Reproduced with permission of the copyright owner. Further reproduction prohibited without permission.

35
CHAPTER IV
STUDY 2: SELF-MANAGEMENT INTERVENTIONS
Introduction
Prior to this research, no attempts had been made to examine the Psychology 460,
Psychology 610, and Psychology 598 students’ self-management interventions, as a
whole. This study was divided into two parts: analysis of the self-management-
intervention data and analysis of survey data. The survey was used to gather additional
information about the details of the students’ interventions, such as what target behavior
they selected, how successful they felt their intervention was, and how honest they were
when reporting their data. By conducting the survey and intervention-data analysis with
these students, their interventions could be compared and contrasted, and the overall
nature and effectiveness of their self-management procedures could be determined.
The Self-Management-Intervention Data
Method
Participants and Setting
As stated earlier, all of the students completed a self-management intervention. A
total of 168 students’ interventions from 1999 to 2004 were analyzed.
Procedures
This study consisted of the students’ self-management-intervention data and
focused on analyzing the overall effectiveness of the students’ self-management
interventions.
Reproduced with permission of the copyright owner. Further reproduction prohibited without permission.

36
Results and Discussion
Sample Individual Interventions
This section contains some samples of actual performance data from 3 students
whose data are included in the group analysis. In addition to recording performance of
the target behavior, 2 of the students included a benefit measure. The benefit measure is
used to show the effect (or in some cases, the permanent products) of the target behavior.
For example, a benefit measure for the behavior of exercise is weight loss. In recent
semesters, a small number of students included a benefit measure in their self-
management interventions.
Figures 12 and 13 are the self-recorded data of Student 1, an undergraduate
student, whose target behavior was doing knee exercises. As shown in her baseline data,
she was not doing the exercises at all before the intervention. During intervention, her
goal was to increase knee-exercise frequency to 7 days per week. She implemented an
analog-to-avoidance contingency: For every day she exercised before the deadline of
going to bed, she avoided having to give $1 to her roommate at the end of the week. She
successfully reached her goal on 58% of the weeks during intervention.
She wanted to do the knee exercises because her doctor told her they would help
decrease the pain caused by a knee injury. Because pain was difficult for her to quantify,
her benefit measure was the number of days per week she took Tylenol for the pain.
Figure 13 shows a marked decrease in her taking Tylenol during the intervention phase.
She was even able to decrease to no Tylenol taken during 4 of the weeks.
Reproduced with permission of the copyright owner. Further reproduction prohibited without permission.
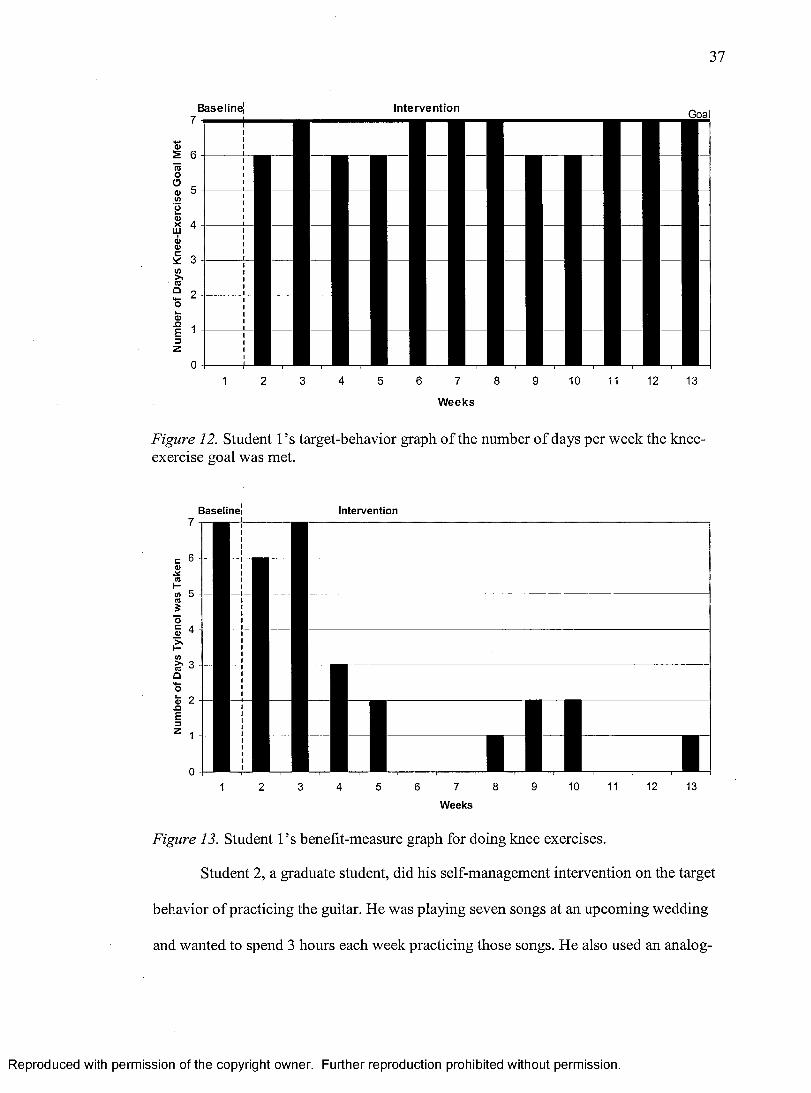
37
Baselinej In te rve n tion Goal
W eeks
Figure 12. Student 1 ’s target-behavior graph of the number of days per week the knee- exercise goal was met.
Baseline
6 -ca><31-w 5<3so1 4</)S' 3
unE
Intervention
6 7
Weeks
1 1 110 11 12 13
Figure 13. Student l ’s benefit-measure graph for doing knee exercises.
Student 2, a graduate student, did his self-management intervention on the target
behavior of practicing the guitar. He was playing seven songs at an upcoming wedding
and wanted to spend 3 hours each week practicing those songs. He also used an analog-
Reproduced with permission of the copyright owner. Further reproduction prohibited without permission.

38
to-avoidance contingency: For every hour spent practicing the guitar each week, he
avoided giving $5 to his roommate at the end of the week. As shown in Figure 14, he
went from not practicing at all during baseline to meeting or exceeding his goal every
week of the intervention. The wedding took place during week 7 of the intervention,,
which likely accounts for the large increase in hours that week.
Baseline . Intervention
1 2 3 4 5 6 7
Weeks
Figure 14. Student 2’s target-behavior graph for the number of hours spent practicing songs on the guitar.
He also recorded a benefit measure. The benefit of practicing the songs was a
decrease in the number of errors. To measure how well he played the seven songs, he did
a weekly “test,” in which he played each song and counted the number of errors made in
that song. He conducted these “tests” during 3 weeks of the intervention and his data are
shown in Figure 15. He achieved 0 errors on all but 2 of the songs.
Reproduced with permission of the copyright owner. Further reproduction prohibited without permission.
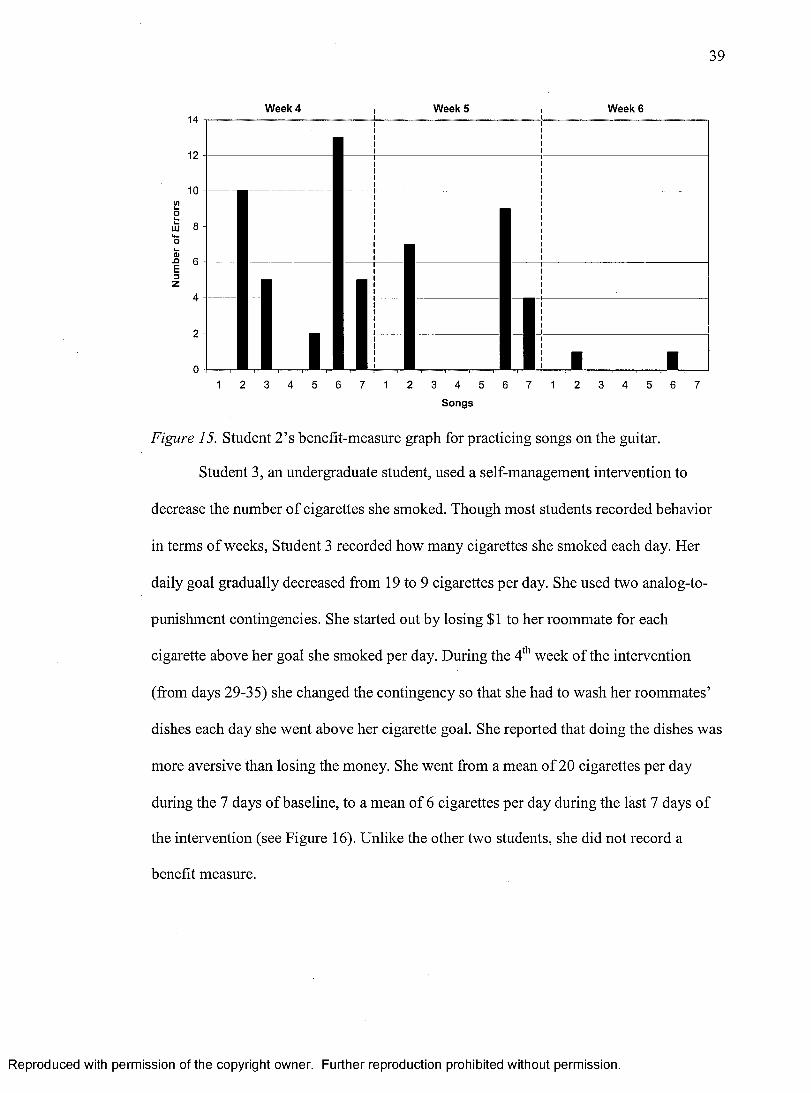
39
14
12
10inUOLU 8 »♦—0u0)1 63
Week 4 Week 5 Week 6
|
1 ■I
I I 1| 1 L . .....................1.....1 2 3 4 5 6 7 1 2 3 4 5 6 7 1
Songs
2 3 4 5 6 7
Figure 15. Student 2’s benefit-measure graph for practicing songs on the guitar.
Student 3, an undergraduate student, used a self-management intervention to
decrease the number of cigarettes she smoked. Though most students recorded behavior
in terms of weeks, Student 3 recorded how many cigarettes she smoked each day. Her
daily goal gradually decreased from 19 to 9 cigarettes per day. She used two analog-to-
punishment contingencies. She started out by losing $1 to her roommate for each
cigarette above her goal she smoked per day. During the 4th week of the intervention
(from days 29-35) she changed the contingency so that she had to wash her roommates’
dishes each day she went above her cigarette goal. She reported that doing the dishes was
more aversive than losing the money. She went from a mean of 20 cigarettes per day
during the 7 days of baseline, to a mean of 6 cigarettes per day during the last 7 days of
the intervention (see Figure 16). Unlike the other two students, she did not record a
benefit measure.
Reproduced with permission of the copyright owner. Further reproduction prohibited without permission.
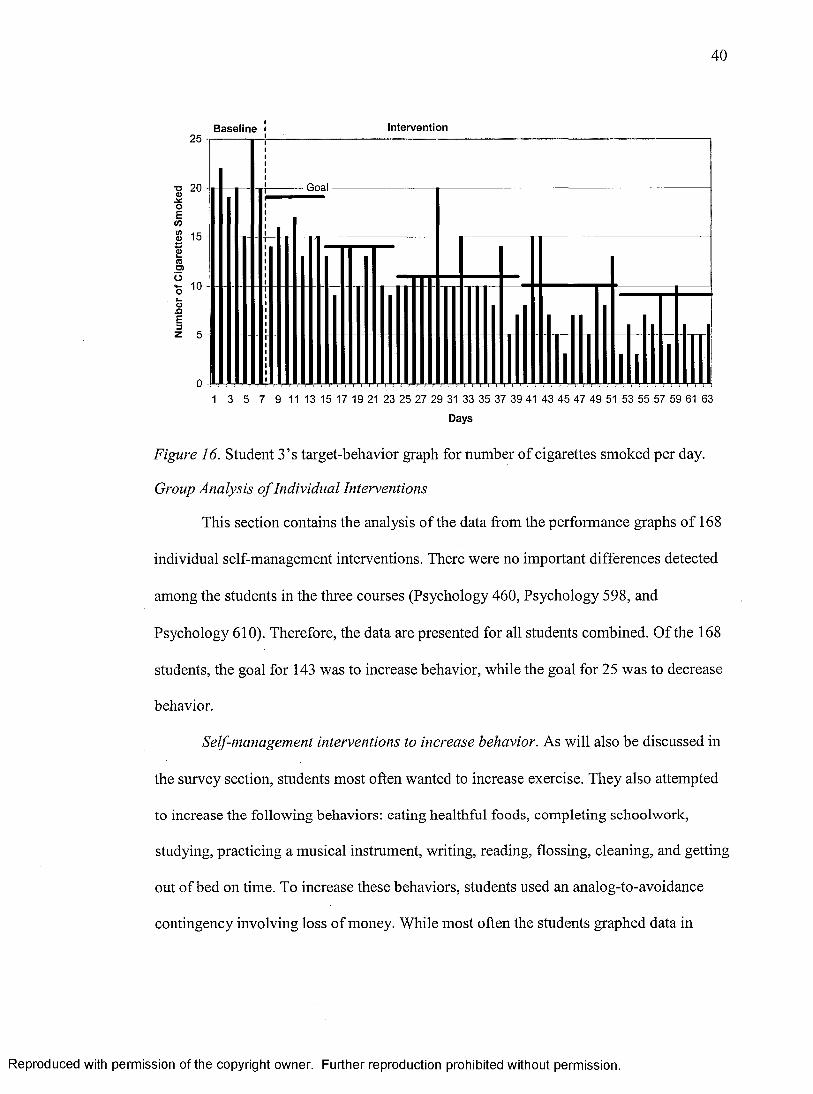
40
25
■o 2 0Q)oEco</> o
Baseline
15
roO)O
10
5 -
0 4
Intervention
• Goal
Ymr mr mr mr
1 3 5 7 9 11 13 15 17 19 21 23 25 27 29 31 33 35 37 39 41 43 45 47 49 51 53 55 57 59 61 63
Days
Figure 16. Student 3’s target-behavior graph for number of cigarettes smoked per day.
Group Analysis o f Individual Interventions
This section contains the analysis of the data from the performance graphs of 168
individual self-management interventions. There were no important differences detected
among the students in the three courses (Psychology 460, Psychology 598, and
Psychology 610). Therefore, the data are presented for all students combined. Of the 168
students, the goal for 143 was to increase behavior, while the goal for 25 was to decrease
behavior.
Self-management interventions to increase behavior. As will also be discussed in
the survey section, students most often wanted to increase exercise. They also attempted
to increase the following behaviors: eating healthful foods, completing schoolwork,
studying, practicing a musical instrument, writing, reading, flossing, cleaning, and getting
out of bed on time. To increase these behaviors, students used an analog-to-avoidance
contingency involving loss of money. While most often the students graphed data in
Reproduced with permission of the copyright owner. Further reproduction prohibited without permission.

41
terms of the number of days per week that their performance goal was met, some also
graphed the amount of behavior per day or week, for example the number of hours spent
practicing the guitar each week.
Of the 143 students who were attempting to increase behavior, 18 either did not
record baseline data or did not indicate which data were recorded during baseline versus
intervention. Therefore, those 18 students’ interventions could not be evaluated. Of the
125 students’ interventions, 95% actually increased the mean weekly amount of their
target behavior from baseline to intervention. It should be noted that data are presented in
terms of amount of behavior. The term amount was used so that all of the students’
weekly mean behavior could be compared regardless of whether those data were in terms
of frequency or duration of behavior per week.
Figure 17 shows the mean weekly amounts of the target behavior for baseline and
for intervention. Each bar of the graph shows both the weekly mean amount of behavior
for baseline and the weekly mean amount of behavior for intervention, for each student.
A few of the students’ behaviors changed in an undesired direction. To indicate the
direction of change, Figures 17 through 22 use a white bar when behavior increased from
baseline to intervention and a black bar when behavior decreased from baseline to
intervention. For the white bars, the bottom value of the bar indicates the mean for
baseline and the top value of the bar indicates the mean for intervention. For the black
bars, it is the opposite. For example, student 1 in Figure 17 had a baseline mean of 0 and
an intervention mean of 1.25, and student 125 had a baseline mean of 142 and an
intervention mean of 240. In Figure 17, students 52, 90, 103, 104, 106, and 109 showed
behavior change in an undesired direction; the weekly mean amount of behavior
Reproduced with permission of the copyright owner. Further reproduction prohibited without permission.
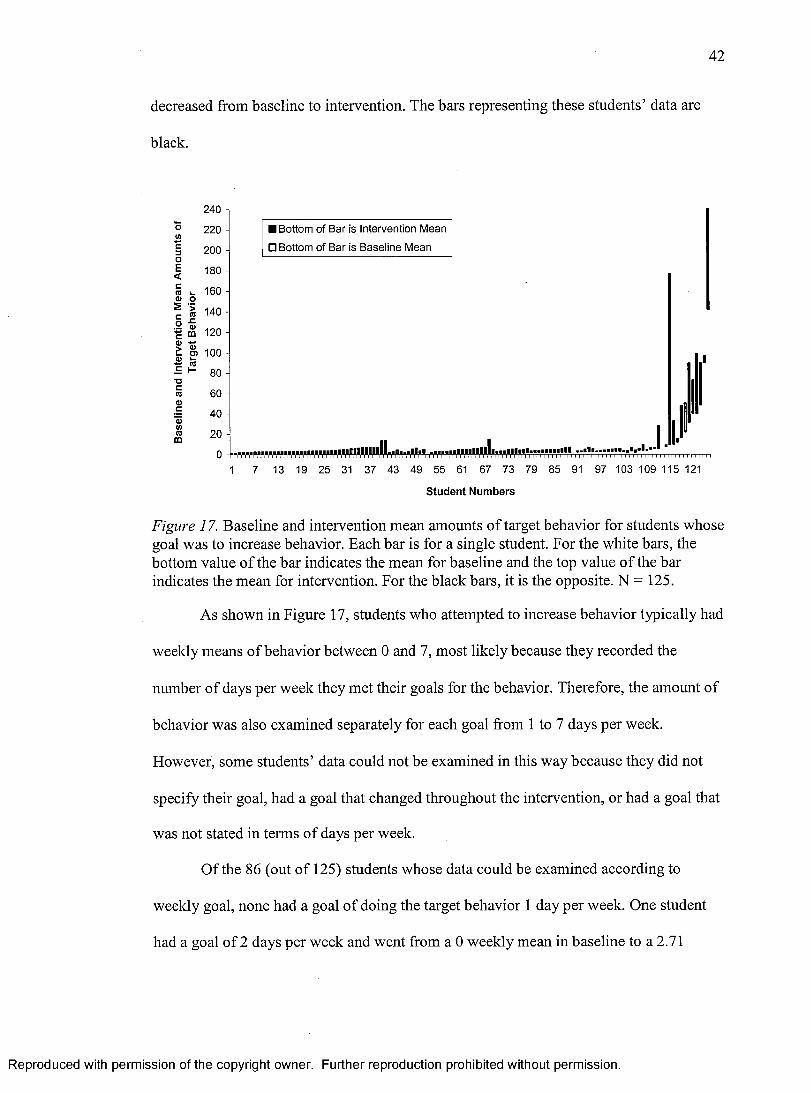
42
decreased from baseline to intervention. The bars representing these students’ data are
black.
240
220
200
180 4
oVi4-1c 3o E <ra l. 160 H <u o
140
m 120c
I P» 100
■DCra80 -
60 -
40 -
£ 20 - CO
■ Bottom of Bar is Intervention Mean
□ Bottom of Bar is Baseline Mean
rrrrm - - - - - .. . .I . . . . . . . . . . . . . . . ■. . . . . . . . . . . . . . . . .1 7 13 19 25 31 37 43 49 55 61 67 73 79 85 91 97 103 109 115 121
Student Numbers
Figure 17. Baseline and intervention mean amounts of target behavior for students whose goal was to increase behavior. Each bar is for a single student. For the white bars, the bottom value of the bar indicates the mean for baseline and the top value of the bar indicates the mean for intervention. For the black bars, it is the opposite. N = 125.
As shown in Figure 17, students who attempted to increase behavior typically had
weekly means of behavior between 0 and 7, most likely because they recorded the
number of days per week they met their goals for the behavior. Therefore, the amount of
behavior was also examined separately for each goal from 1 to 7 days per week.
However, some students’ data could not be examined in this way because they did not
specify their goal, had a goal that changed throughout the intervention, or had a goal that
was not stated in terms of days per week.
Of the 86 (out of 125) students whose data could be examined according to
weekly goal, none had a goal of doing the target behavior 1 day per week. One student
had a goal of 2 days per week and went from a 0 weekly mean in baseline to a 2.71
Reproduced with permission of the copyright owner. Further reproduction prohibited without permission.
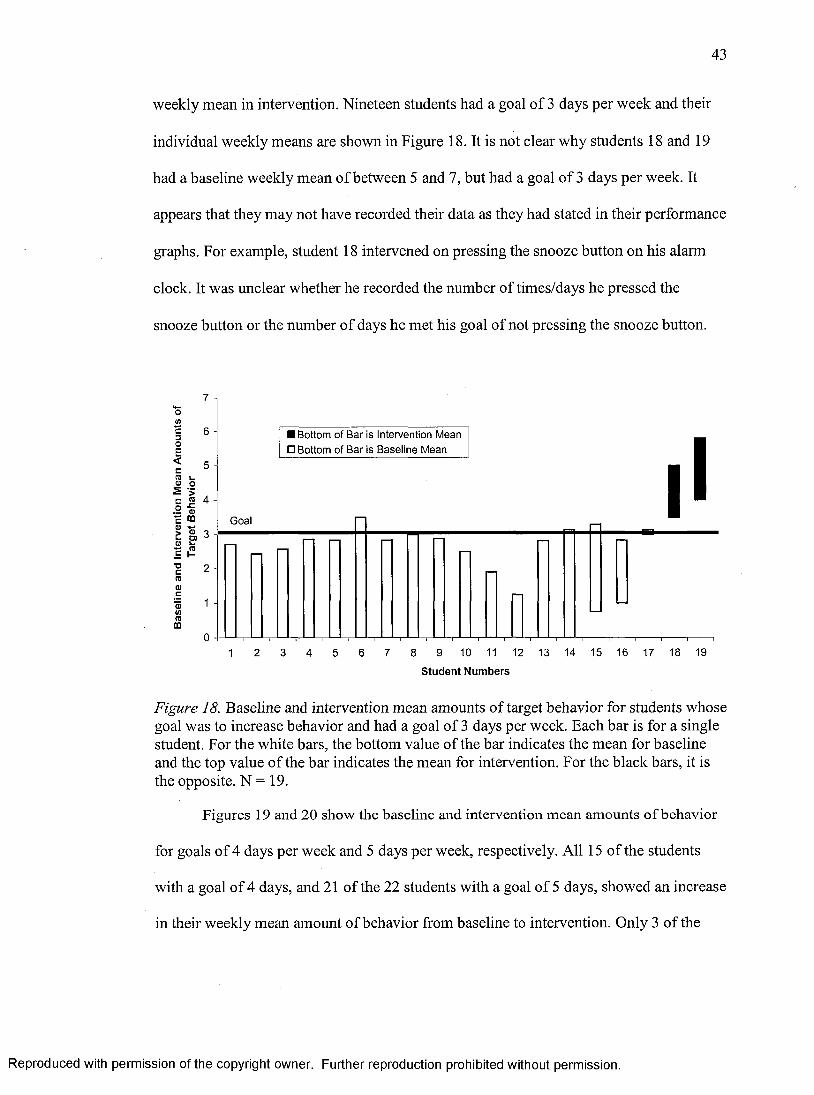
weekly mean in intervention. Nineteen students had a goal of 3 days per week and their
individual weekly means are shown in Figure 18. It is not clear why students 18 and 19
had a baseline weekly mean of between 5 and 7, but had a goal of 3 days per week. It
appears that they may not have recorded their data as they had stated in their performance
graphs. For example, student 18 intervened on pressing the snooze button on his alarm
clock. It was unclear whether he recorded the number of times/days he pressed the
snooze button or the number of days he met his goal of not pressing the snooze button.
■ Bottom of Bar is Intervention Mean □ Bottom of Bar is Baseline Mean
Goal
1 2 3 4 5 6 7 8 9 10 11 12 13 14 15 16 17 18 19
Student Numbers
Figure 18. Baseline and intervention mean amounts of target behavior for students whose goal was to increase behavior and had a goal of 3 days per week. Each bar is for a single student. For the white bars, the bottom value of the bar indicates the mean for baseline and the top value of the bar indicates the mean for intervention. For the black bars, it is the opposite. N = 19.
Figures 19 and 20 show the baseline and intervention mean amounts of behavior
for goals of 4 days per week and 5 days per week, respectively. All 15 of the students
with a goal of 4 days, and 21 of the 22 students with a goal of 5 days, showed an increase
in their weekly mean amount of behavior from baseline to intervention. Only 3 of the
oWc3OE<cra02coc0t0
6 -
5 -
■oc00
3 -
0 1 (/)0 ffl
Reproduced with permission of the copyright owner. Further reproduction prohibited without permission.
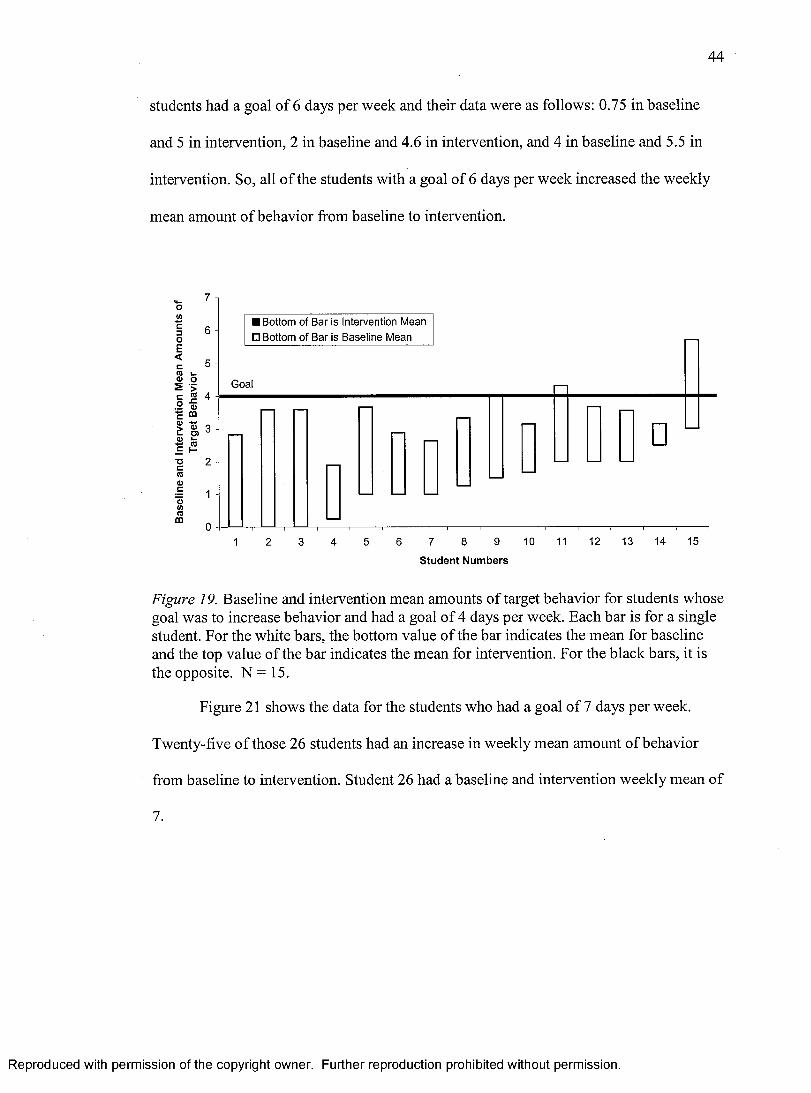
44
students had a goal of 6 days per week and their data were as follows: 0.75 in baseline
and 5 in intervention, 2 in baseline and 4.6 in intervention, and 4 in baseline and 5.5 in
intervention. So, all of the students with a goal of 6 days per week increased the weekly
mean amount of behavior from baseline to intervention.
O(ft■*->c3O£<crea>Sco3E<D£Q
6 -
5 -i_o>re 4
(DGQ% 3
£ I-
? 2rere™ 1Qtore
CO
■ Bottom of Bar is Intervention Mean □ Bottom of Bar is Baseline Mean
Goal
□
10 11 12 13 14 15
Student Numbers
Figure 19. Baseline and intervention mean amounts of target behavior for students whose goal was to increase behavior and had a goal of 4 days per week. Each bar is for a single student. For the white bars, the bottom value of the bar indicates the mean for baseline and the top value of the bar indicates the mean for intervention. For the black bars, it is the opposite. N = 15.
Figure 21 shows the data for the students who had a goal of 7 days per week.
Twenty-five of those 26 students had an increase in weekly mean amount of behavior
from baseline to intervention. Student 26 had a baseline and intervention weekly mean of
7.
Reproduced with permission of the copyright owner. Further reproduction prohibited without permission.

45
o<A+■*C3OE<cre l.<D o5 >c reo .c0)c m0)£ <D050) b.4—> rec h-■ocreocQ</)reOQ
7
6
5
2 1
1
0
■ Bottom of Bar is Intervention Mean □ Bottom of Bar is Baseline Mean
Goal
I
1 2 3 4 5 6 7 8 9 10 11 12 13 14 15 16 17 18 19 20 21 22
Student Numbers
Figure 20. Baseline and intervention mean amounts of target behavior for students whose goal was to increase behavior and had a goal of 5 days per week. Each bar is for a single student. For the white bars, the bottom value of the bar indicates the mean for baseline and the top value of the bar indicates the mean for intervention. For the black bars, it is the opposite. N = 22.
In addition to weekly frequency, goal achievement was analyzed. Because some
students failed to report their goals for the target behavior, goal achievement could be
determined for 115 of the 143 students (80%). Ninety percent of those students had an
increase in percentage of weeks they met their goal from baseline to intervention.
Self-Management Interventions to Decrease Behavior. Students most often
attempted to decrease smoking cigarettes. Students also attempted to decrease the
following behaviors: consuming unhealthy food or drinks, swearing, saying “dude,”
killing insects, biting their nails, and leaving the room before closing the cabinets.
Students most often used an analog-to-penalty contingency involving the loss of money,
though some used a direct-acting punishment contingency such as snapping a rubber
band on their wrist. When attempting to decrease behavior, students recorded their data in
terms of frequency of behavior per week or day.
Reproduced with permission of the copyright owner. Further reproduction prohibited without permission.

46
Goal7 -io
E
D• o 2 -c<0
■ Bottom of Bar is Intervention Mean □ Bottom of Bar is Baseline Mean
1 2 3 4 5 6 7 8 9 10 11 12 13 14 15 16 17 18 19 20 21 22 23 24 25 26
Student Numbers
Figure 21. Baseline and intervention mean amounts of target behavior for students whose goal was to increase behavior and had a goal of 7 days per week. Each bar is for a single student. For the white bars, the bottom value of the bar indicates the mean for baseline and the top value of the bar indicates the mean for intervention. For the black bars, it is the opposite. N = 26.
Figure 22 shows the results of all of the interventions that involved decreasing
behavior. Each bar of the graph shows the weekly mean amount of behavior for baseline
and for intervention, for each student. For all of the students in Figure 22, the bottom
value of the bar indicates the mean for intervention and the top value of the bar indicates
the mean for baseline. For example, student 1 in Figure 22 had a baseline mean of 4 and
an intervention mean of 0.71, and student 25 had a baseline mean of 112.67 and an
intervention mean of 5.33. All of the students who attempted to decrease their target
behavior showed an actual decrease in the mean weekly frequency of their behavior from
baseline to intervention.
Reproduced with permission of the copyright owner. Further reproduction prohibited without permission.
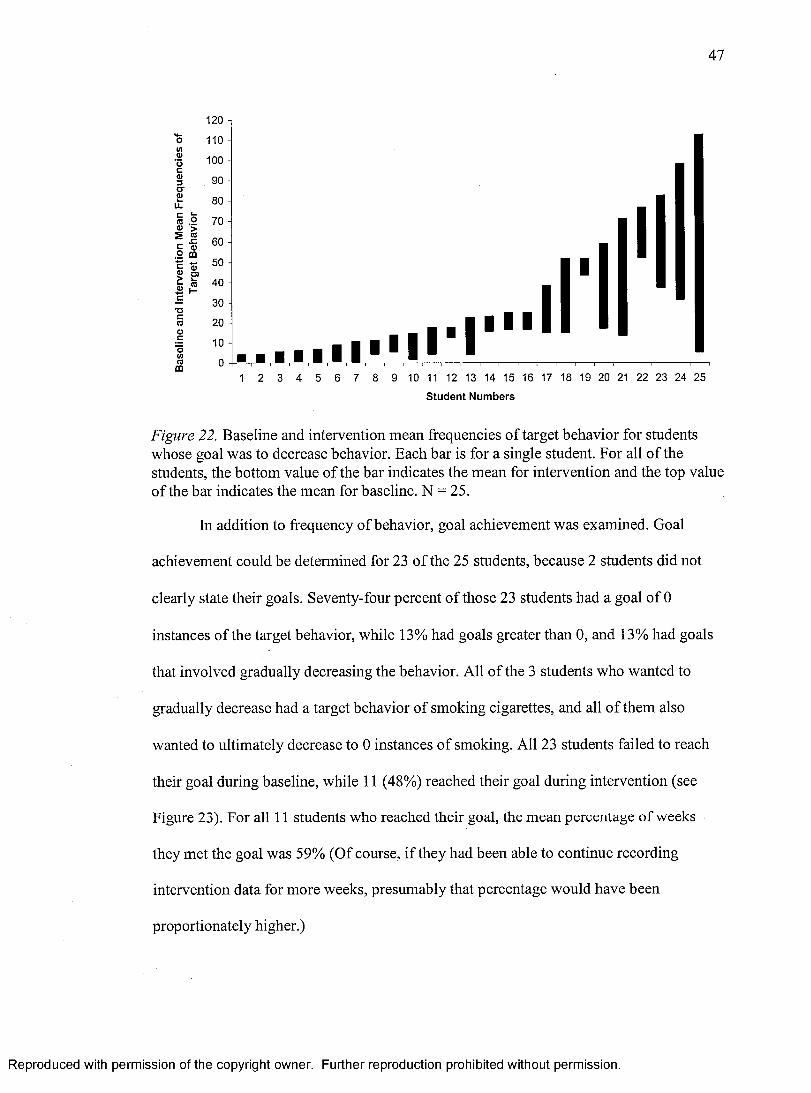
47
M-0
120
110 -V) <D O 100 -Co3 90 -O’£
LL 80 -Cm
L_0 70 -0) •>m
60 -c <\>o QQc bO -<1> n>£ L_m 40 -
Hc 30 -T3Cro 20 -0)c 10 -otoCOcn 0 - ......................... .....
i l l
1 2 3 4 5 6 7 8 9 10 11 12 13 14 15 16 17 18 19 20 21 22 23 24 25
Student Numbers
Figure 22. Baseline and intervention mean frequencies of target behavior for students whose goal was to decrease behavior. Each bar is for a single student. For all of the students, the bottom value of the bar indicates the mean for intervention and the top value of the bar indicates the mean for baseline. N = 25.
In addition to frequency of behavior, goal achievement was examined. Goal
achievement could be determined for 23 of the 25 students, because 2 students did not
clearly state their goals. Seventy-four percent of those 23 students had a goal of 0
instances of the target behavior, while 13% had goals greater than 0, and 13% had goals
that involved gradually decreasing the behavior. All of the 3 students who wanted to
gradually decrease had a target behavior of smoking cigarettes, and all of them also
wanted to ultimately decrease to 0 instances of smoking. All 23 students failed to reach
their goal during baseline, while 11 (48%) reached their goal during intervention (see
Figure 23). For all 11 students who reached their goal, the mean percentage of weeks
they met the goal was 59% (Of course, if they had been able to continue recording
intervention data for more weeks, presumably that percentage would have been
proportionately higher.)
Reproduced with permission of the copyright owner. Further reproduction prohibited without permission.

1 2 3 4 5 6 7 8 9 10 11 12 13 14 15 16 17 18 19 20 21 22 23 24 25
Student Numbers
Figure 23. Percentage of weeks the goal was met during intervention for students who were decreasing behavior. The goal was unknown for Students 21 and 23. The student numbers correspond to Figure 22. N = 25.
Overall, examination of the effectiveness of the students’ self-management
interventions showed that virtually all of the students had some level of success in
improving their behavior problems. Even in cases where students failed to meet their
goals for the behavior, they still managed to change their behavior to at least some degree
in the desired direction.
The Self-Management Survey
Method
Participants and Setting
The Self-Management Survey was completed by 58 Psychology 460 students in
the winter 2000, fall 2001, winter 2002, and fall 2004 semesters, and 24 Psychology 610
students in the summer 2001 and summer 2004 semesters. Because these surveys were
administered, and their data kept by, a number of graduate students over a period of 5
years, some of the data were lost or never collected.
Reproduced with permission of the copyright owner. Further reproduction prohibited without permission.

49
Procedures
The Self-Management Survey (see Appendix E) consisted of 27 Likert-scale-
rating, multiple-choice, and fill-in-the-blank questions. The students answered the
questions by marking and writing their answers on the survey form. The surveys were
completed anonymously.
Results and Discussion
The Self-Management Survey was used to gather data on various aspects of the
students’ self-management interventions. The highlights of the results of the survey are
presented in this section. One aspect of the self-management interventions addressed on
the survey was the basic design of the interventions. As shown in Figure 24, exercise was
the most commonly selected target behavior (at 51%) and other, rarer, examples of target
behaviors included doing good deeds, going to bed on time, and wearing a seatbelt (all of
which are in the other category in Figure 24). The exercise category included a variety of
specific behaviors such as running, weight lifting, and doing pilates. The diet-related
category included behaviors such as drinking water, restricting calorie intake, eating three
meals a day, and consuming foods containing Omega-3 acids.
Forty percent of the students reported recording a benefit measure in addition to
recording the target behavior. Sixty-five percent of the students contracted to meet with
their performance managers once a week, with the remaining 35% contracted to meet
more than once a week. Eighty-six percent of the students chose money as their
consequence, with 9% using aversive activities, and 5% using loss of other reinforcers.
Eighty-five percent of the students chose a roommate, friend, family member, or
significant other as their performance manager, while the remaining 15% chose
Reproduced with permission of the copyright owner. Further reproduction prohibited without permission.

50
classmates, coworkers, or one of Malott’s graduate students who was working on self
management research.
5% 3% ■ Exercising (51%)
^O th e r (18%)
□ Diet-related (12%)
B Studying for GRE (6%)
□ Studying/schoolwork (5%)
B Flossing (5%)
□ Smoking (3%)
Figure 24. On what behavior did you do your self-management project? N = 78.
Another aspect of the students’ interventions was their level of importance and
success. Though students had varying opinions about how important it was to accomplish
the goal of their interventions (see Figure 25), almost all of them described their
interventions as successful to some degree (see Figure 26). Students’ ratings of the value
of completing their interventions in terms of learning about the management of human
performance varied (see Figure 27).
Another aspect of the interventions was the problems that students encountered.
Over half (57%) of the students made improvements to their interventions sometime
during the semester. Commonly, problems related to the performance managers; 80% of
the students rated their performance manager as being at least somewhat effective (see
Figure 28).
Reproduced with permission of the copyright owner. Further reproduction prohibited without permission.

51
5 Not important at all
1 Very important
Ratings of Importance
Figure 25. How important was accomplishing the goal of your self-management project? N = 120.
5 Unsuccessful1 Successful
Ratings o f Success
Figure 26. In your opinion, was your self-management project successful in terms of helping you meet your goals? N = 80.
Reproduced with permission of the copyright owner. Further reproduction prohibited without permission.

52
60
50
</>4-J
| 40355o 30 oU)TO<5 20 oO
CL
10
01 Very valuable 2 3 4 5 Not valuable at
all
Ratings o f Value
Figure 27. How valuable was doing a self-management project in learning about the management of human performance? N = 119.
The survey also addressed the accuracy of the students’ self-reported data and the
treatment integrity of their interventions. Sixty-seven percent of the students reported that
they were completely honest when recording and presenting their data, while no one
reported being completely dishonest.
Of the 47 undergraduate students who responded to the relevant question (out of
the 58 who completed the survey), 72% indicated that they never reported false data or
overestimated their accomplishments. Most of the students in the remaining 28%
indicated that they reported false data or overestimated their accomplishments only once
or twice during the intervention, while one student indicated that he reported false data 8
times and another student indicated that he reported false data 75% of the time. Of the 21
graduate students who responded to the relevant question (out of the 22 who completed
the survey), 95% indicated that they never reported false data or overestimated their
accomplishments.
Reproduced with permission of the copyright owner. Further reproduction prohibited without permission.

53
1 Very much so 2 3 4 5 Not at all
Ratings o f Effectiveness
Figure 28. Was your performance manager effective in keeping you on track with your project? N = 75.
Of the 59 students for whom we could compare their planned and actual meetings
with their performance managers, 85% reported meeting for as many weeks as planned.
The remaining 15% met from 1 to 7 weeks less than planned. Ninety percent of the
students met with their performance managers for at least as many days per week as they
had contracted to meet.
Out of the 63 students who responded to the relevant questions, 83% paid their
fines every time they were supposed to. The remaining 17% failed to pay their fines on
from 1 to 10 of the weeks they were supposed to. Figure 29 shows how often students
were supposed to pay fines.
Reproduced with permission of the copyright owner. Further reproduction prohibited without permission.

54
60 -i
50 -u>I 40 -
55
0 1-2 3-4 5-6 7-9 10 or more Every weekor almost
every w eek
W eeks
Figure 29. How many weeks were you supposed to pay a fine? N = 68.
In conclusion, the survey data were consistent with the group analysis. The data
suggest that the students were generally successful in their use of self-management
interventions. The data also suggest that the interventions had a fair amount of reliability
and treatment integrity.
Reproduced with permission of the copyright owner. Further reproduction prohibited without permission.
55
CHAPTER V
STUDY 3: TRANSFER
Introduction
One of the hypothesized collateral benefits of using self-management techniques
is that once learned, those procedures can be applied to virtually any behavior. The
transfer evaluation focused on whether students were doing more than one self-
management intervention while taking Psychology 460. For class, those students were
already required to apply self-management procedures to one behavior, so using those
procedures on more than one behavior would show that the use of self-management
procedures had transferred to other, less-structured settings where no class-point
contingencies were used to support the implementation of self-management procedures.
Method
Participants and Setting
The transfer evaluation was conducted in three semesters of Psychology 460, fall
2003, spring 2004, and summer 2004. Though all of the Psychology 460 students during
the three semesters were given the survey, it is possible that a few did not complete the
survey; however 107 students did complete the survey.
Procedures
The Transfer Survey (see Appendix F) was an anonymous questionnaire that
consisted of three questions about the students’ use of self-management procedures
outside of the course requirements. Students spent approximately 5 minutes filling out the
questionnaire in class at the end of the semester.
Reproduced with permission of the copyright owner. Further reproduction prohibited without permission.

56
Results and Discussion
Twenty of the 107 Psychology 460 students reported using self-management on
more than one behavior, a transfer rate of 18.69%. Those students reported managing the
following behaviors: preparing for the GRE (2), completing homework (2), writing a
thesis (1), eating healthful food (2), exercising (5), smoking (3), getting out of bed on
time (1), doing laundry (1), writing letters (1), drinking alcohol (1), house cleaning (2),
and managing their children’s behaviors (2). Of those 20 students, all but one reported
that the self-management was useful to some degree in helping them improve the target
behavior (see Figure 30).
100
90 -
80 -
■£ 70
5 60OTOd)O)ro
50
40
o 30Q.
1 Extremely Useful 3
Ratings
□ Fall 2003
□ Spring 2004
0 Summer 2004
5 Completely Useless
Figure 30. How useful was self-management in helping you improve those behaviors? Fall 2003 N = 8, Spring 2004 N = 7, Summer 2004 N = 5.
The point contingencies of the Psychology 460 class acted as effective
performance-management contingencies that supported using the self-management
procedures on one behavior. Without the support of the performance-management
Reproduced with permission of the copyright owner. Further reproduction prohibited without permission.

57
contingencies, it seemed unlikely that self-management procedures would be used. The
18.69% transfer rate may have been influenced by additional performance-management
contingencies. Students earned optional, extra class points for doing additional self
management interventions. Also, students who used self-management procedures on
studying for the GRE may have been enrolled in a one-credit Self-Management/GRE
class involving point contingencies for using those self-management procedures. Without
these potential added performance-management contingencies, the transfer rate may have
been lower.
Based on some of the responses to the survey, it appeared that students may have
misinterpreted the questions. They may have answered the questions based on their use of
self-management techniques or performance management on another person’s behavior.
The Transfer Survey has been revised so that if it is used in the future, these
misinterpretations will be less likely to occur.
Nineteen percent of the students used self-management procedures in addition to
the ones required as part of the self-management intervention for the course. These
transfer data do suggest that transfer actually occurred to other behaviors and, to some
extent, to other contexts. However, it is not clear to what extent the transfer was
supported by other performance-management contingencies, such as course points, or the
extent to which the transfer would have occurred spontaneously without the additional
support, whatever it was.
Reproduced with permission of the copyright owner. Further reproduction prohibited without permission.
58
CHAPTER VI
STUDY 4: MAINTENANCE
Introduction
Another potential collateral benefit of using self-management techniques is that
they will more readily maintain once the behavior analyst has gone. Maintenance, after
completing the courses, was measured to determine whether students continued their
original self-management intervention or implemented any new interventions on other
behaviors.
Method
Participants and Setting
The participants were 159 former students who had completed a self-management
intervention in the Psychology 460, Psychology 610, and Psychology 598 classes. At the
time they completed their self-management interventions, 58 were graduate students and
101 were undergraduate students. The participants completed the survey at various
locations depending on where they received the email or phone call containing the
survey.
Procedures
In the fall 2004 semester, the participants were given a short survey, the
Maintenance Survey (see Appendix G), by email and/or by phone after they had
completed the courses and were no longer required to use self-management procedures.
First, all 159 participants were emailed the survey. The email appeared to be deliverable
for 142 of the participants, however delivery of the email did not guarantee that the
participants ever saw the email. For example, some participants may not have continued
to check their WMU email accounts after graduating. Attempts were then made to call
Reproduced with permission of the copyright owner. Further reproduction prohibited without permission.

the participants whose emails were undeliverable and the participants who, though their
email was deliverable, failed to reply within two weeks. A total of 47 participants
completed the survey by email. Attempts were made to contact 105 of the participants by
phone, some of them may have completed the survey by email after receiving the phone
message. Out of the 37 participants for whom seemingly functioning phone numbers
were obtained, 23 participants completed the survey by phone. For the remaining 12 (of
the 37) participants, the researchers left one phone message. In a few of these 12 cases, it
was not clear if the phone number was correct. An additional two participants were
WMU students at the time of the study and completed the survey in person after their
emails were undeliverable. As a result, surveys were completed by 72 (34 former
graduate students and 38 former undergraduate students) of the 159 participants.
Results and Discussion
Contacting the participants was difficult. The more time that had passed since
they had taken the courses, the more likely it was that their contact information was no
longer valid. Despite these difficulties, 72 of the 159 participants were successfully
contacted by email, by phone, or in person. There were no important differences between
the former graduate and former undergraduate students, so the data have been combined
for both groups.
Of the 72 participants who completed the survey, 24 used self-management
procedures after the class, a maintenance rate of 33.33%. The 24 who continued to use
self-management procedures were asked why they continued. Their responses to this
open-ended question were divided into four categories: the intervention worked and they
still wanted to do the behavior (16), for health reasons (4), it was for another class (3),
had more free time to do self-management (1). The same participants were also asked if
Reproduced with permission of the copyright owner. Further reproduction prohibited without permission.
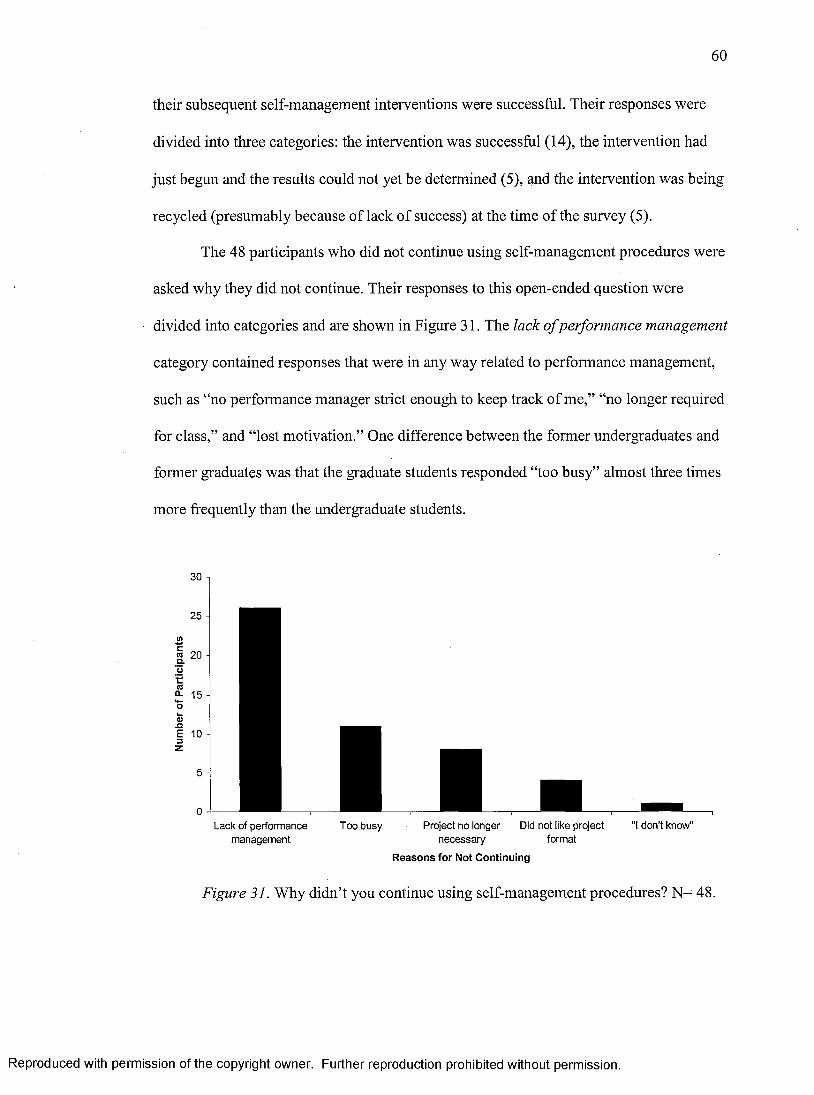
60
their subsequent self-management interventions were successful. Their responses were
divided into three categories: the intervention was successful (14), the intervention had
just begun and the results could not yet be determined (5), and the intervention was being
recycled (presumably because of lack of success) at the time of the survey (5).
The 48 participants who did not continue using self-management procedures were
asked why they did not continue. Their responses to this open-ended question were
divided into categories and are shown in Figure 31. The lack o f performance management
category contained responses that were in any way related to performance management,
such as “no performance manager strict enough to keep track of me,” “no longer required
for class,” and “lost motivation.” One difference between the former undergraduates and
former graduates was that the graduate students responded “too busy” almost three times
more frequently than the undergraduate students.
Lack of performance Too busy Project no longer Did not like project "I don't know"management necessary format
Reasons fo r Not Continuing
Figure 31. Why didn’t you continue using self-management procedures? N= 48.
Reproduced with permission of the copyright owner. Further reproduction prohibited without permission.

When asked if they would consider continuing in the future, 41 of these 48
students who did not continue responded “yes” or “maybe.” The same 48 students’
responses to what would encourage them to continue are shown in Figure 32. Similar to
the categories in Figure 31, the i f there was more performance management category
contained responses that were in any way related to performance management, such as “if
it was a requirement for class” and “effective performance manager and [a] good
consequence.”
If there was more If they had more time If they had more of a need "Unsure"/other responseperformance management to change their behavior
Reasons to Continue
Figure 32. What would encourage you to use self-management procedures and keep them going? N = 48.
It is not clear how representative these data are for the students who did not
complete the survey. It is possible that those who did continue using self-management
procedures were more likely to complete the survey because they wanted to report their
success. However, regardless of whether the data are representative, this study
demonstrated that a third of the 72 participants used self-management procedures after
completing the courses and 58% were successful in doing so.
Reproduced with permission of the copyright owner. Further reproduction prohibited without permission.
62
CHAPTER VII
GENERAL DISCUSSION
Though the studies in this dissertation have demonstrated that the students
successfully changed their behavior with self-management interventions completed as
part of the classes, in most cases, additional performance management is needed to get
the students to continue using self-management or to use it outside of the class
requirements. Analyzing, and attempting to maximize, the contingencies that support the
use of self-management procedures would be a valuable line of research.
Also, attempts were made to determine the reliability and treatment integrity for
some of the Psychology 460 students’ self-management interventions. Because the
current researcher consistently encountered more procedural difficulties than anticipated
across three semesters of improved replications, this sequence of studies has been placed
in Appendix B, rather than the body of this dissertation. Though the goal of the three
experiments was to determine the natural reliability and treatment integrity of the
interventions, the natural setting and elements of the students’ self-management
interventions had to be changed in order for them to be studied. Students had to provide
consent for the collection of reliability data and detailed information about their
performance managers for the collection of treatment integrity data, so they had to be
made aware of the ongoing observation. Also, to most effectively collect treatment
integrity data the researcher acted as the performance manager; however, this made the
interventions atypical of what is experienced by the average student who has a less
experienced performance manager. Also, getting good reliability and treatment integrity
data in situations where people know they are being observed does not provide
information about what is going in the real world. All of the difficulties described here
Reproduced with permission of the copyright owner. Further reproduction prohibited without permission.

seem inevitable when trying to do an empirical study like this, especially one that has not
been done before. Also, anonymous survey data may be the best way to study the natural
reliability and treatment integrity of these kinds of self-management interventions.
Reproduced with permission of the copyright owner. Further reproduction prohibited without permission.

CHAPER VIII
GENERAL CONCLUSION
The studies in this dissertation successfully examined various aspects of the self
management interventions of college-level psychology students. Students showed
discrepancies between their actual and desired performance in their professional and
personal lives, suggesting a failure to manage their behavior and a need for self
management interventions.
Anonymous survey data were used to develop a summary of the details of the
students’ self-management interventions, showing patterns in the design and effects of
those interventions. The students’ self-management-intervention data were examined to
determine the effectiveness of the interventions in terms of amount of behavior and goal
achievement. These studies showed that almost all of the students experienced at least
some improvement in their behavior from baseline to intervention. Studies on self
management’s potential collateral benefits also showed a fair amount of both transfer and
maintenance of the use of the self-management procedures.
Overall, the research in this dissertation demonstrated the value of self-
management procedures in improving the behavior problems that regular people
experience in their day-to-day life. Future research would be most valuable if focused on
two areas: the “natural” reliability and treatment integrity of these types of self-
management interventions and contingencies supporting the use of self-management
interventions. By examining reliability and treatment integrity, researchers might better
understand self-management used with regular people in non-institutional settings. Even
more importantly, by examining the contingencies relevant to doing self-management,
Reproduced with permission of the copyright owner. Further reproduction prohibited without permission.

65
researchers might be able to get more people to use self-management interventions to
achieve their personal and professional life goals.
Reproduced with permission of the copyright owner. Further reproduction prohibited without permission.
66
REFERENCES
Baldwin, W. (2000). Information no one else knows: The value of self-report. In A.
Stone, J. Turkkan, C. Bachrach, J. Jobe, H. Kurtzman, & V. Cain (Eds.), The
Science o f Self-Report: Implications for Research and Practice (pp.3-7). Mahwah,
NJ: Lawrence Erlbaum Associates.
Ballard, K., & Glynn, T. (1975). Behavioral self-management in story writing with
elementary school children. Journal o f Applied Behavior Analysis, 8, 387-398.
Barlow, D., Hayes, S., & Nelson, R. (1984). The scientist practitioner. New York:
Pergamon Press.
Brigham, T. (1982). Self-management: A radical behavioral perspective. In P. Karoly &
F. Kanfer (Eds.), Self-Management and Behavior Change: From Theory to
Practice (pp. 32-59). New York: Pergamon Press.
Brigham, T. (1989). Self-management for adolescents: A skills training program. New
York: The Guilford Press.
Burgio, L., & Burgio, K. (1986). Behavioral gerontology: Application of behavioral
methods to the problems of older adults. Journal o f Applied Behavior Analysis,
19, 321-328.
Burgio, L., Whitman, T., & Reid, D. (1983). A participative management approach for
improving direct-care staff performance in an institutional setting. Journal o f
Applied Behavior Analysis, 16, 37-53.
Christian, L., & Poling, A. (1997). Using self-management procedures to improve the
productivity of adults with developmental disabilities in a competitive
employment setting. Journal o f Applied Behavior Analysis, 30, 169-172.
Reproduced with permission of the copyright owner. Further reproduction prohibited without permission.

67
Clements, C., & Beidleman, W. (1981). Undergraduate self-management projects: A
technique for teaching behavioral principles. Academic Psychology Bulletin, 3,
451-460.
Cole, C. (1992). Self-management interventions in the schools. School Psychology
Review, 21, 188-192.
Connell, M., Carta, J., & Baer, D. (1993). Programming generalization of in-class
transition skills: Teaching preschoolers with developmental delays to self-assess
and recruit contingent teacher praise. Journal o f Applied Behavior Analysis, 26,
345-352.
Dean, M. R., Malott, R. W., & Fulton, B. J. (1983). The effects of self-management
training on academic performance. Teaching o f Psychology, 10, 77-81.
Epstein, R. (1997). Skinner as self-manager. Journal o f Applied Behavior Analysis, 30,
545-568.
Godat, L., & Brigham, T. (1999). The effect of a self-management training program on
employees of a mid-sized organization. Journal o f Organizational Behavior
Management, 19, 65-83.
Horn, P., & Brigham, T. (1996). A self-management approach to reducing AIDS risk in
sexually active heterosexual college students. Behavior and Social Issues, 6, 3-21.
Kazdin, A. (2001). Behavior modification in applied settings. Belmont, CA:
Wadsworth/Thomson Learning.
Reproduced with permission of the copyright owner. Further reproduction prohibited without permission.
Kissel, R., Whitman, T., & Reid, D. (1983). An institutional staff training and self
management program for developing multiple self-care skills in
severely/profoundly retarded individuals. Journal o f Applied Behavior Analysis,
16, 395-415.
Koegel, L., Koegel, R., Hurley, C., & Frea, W. (1992). Improving social skills and
disruptive behavior in children with autism through self-management. Journal o f
Applied Behavior Analysis, 25, 341-353.
Koegel, R., & Koegel, L. (1990). Extended reductions in stereotypic behavior of students
with autism through a self-management treatment package. Journal o f Applied
Behavior Analysis, 23, 119-127.
Koegel, R. & Frea, W. (1993). Treatment of social behavior in autism through the
modification of pivotal social skills. Journal o f Applied Behavior Analysis, 26,
369-377.
Malott R., & Harrison, H. (2005). I ’ll stop procrastinating when I get around to it.
Manuscript submitted for publication. (This book can be obtained from the WMU
Copy Desk.)
Malott, R., & Trojan Suarez, E. (2004). Principles o f behavior. Upper Saddle River, NJ:
Prentice Hall.
McGlynn, F. (1980). Successful treatment of anorexia nervosa with self-monitoring and
long distance praise. Journal o f Behavior Therapy and Experimental Psychiatry,
11, 283-286.
McLaughlin, J. G., & Nay, W. R. (1975). Treatment of trichotillomania using positive
coverants and response cost: A case report. Behavior Therapy, 6, 87-91.
Reproduced with permission of the copyright owner. Further reproduction prohibited without permission.

Newman, B., Buffington, D., Hemmes, N., & Rosen, D. (1996). Answering objections to
self-management and related concepts. Behavior and Social Issues, 6, 85-95.
Ninness, H., Fuerst, J., Rutherford, R., & Glenn, S. (1991). Effects of self-management
training and reinforcement on the transfer of improved conduct in the absence of
supervision. Journal o f Applied Behavior Analysis, 24, 499-508.
O’Leary, S., & Dubey, D. (1979). Applications of self-control procedures by children: A
review. Journal o f Applied Behavior Analysis, 12, 449-465.
Olympia, D., Sheridan, S., Jenson, W., & Andrews, D. (1994). Using student-managed
interventions to increase homework completion and accuracy. Journal o f Applied
Behavior Analysis, 27, 85-99.
Pierce, K., & Schreibman, L. (1994). Teaching daily living skills to children with autism
in unsupervised settings through pictorial self-management. Journal o f Applied
Behavior Analysis, 27, 471-481.
Rachlin, H. (1974). Self-control. Behaviorism, 2, 94-107.
Rachlin, H., & Green, L. (1972). Commitment, choice, and self-control. Journal o f the
Experimental Analysis o f Behavior, 17, 15-22.
Sanders, M., & Glynn, T. (1981). Training parents in behavioral self-management: An
analysis of generalization and maintenance. Journal o f Applied Behavior
Analysis, 14, 223-237.
Skinner, B. (1953). Science and human behavior. New York: The Free Press.
Sowers, J., Verdi, M., Bourbeau, P., & Sheehan, M. (1985). Teaching job independence
and flexibility to mentally retarded students through the use of a self-control
package. Journal o f Applied Behavior Analysis, 18, 81-85.
Reproduced with permission of the copyright owner. Further reproduction prohibited without permission.
Stahmer, A., & Schreibman, L. (1992). Teaching children with autism appropriate play in
unsupervised environments using a self-management treatment package. Journal
o f Applied Behavior Analysis, 25, 447-459.
Worthington, E. (1977). Honesty and success in self-modification projects for a college
class. Teaching o f Psychology, 4, pp. 78-82.
Worthington, E. (1979). Behavioral self-control and the contract problem. Teaching o f
Psychology, 6, 91-94.
Reproduced with permission of the copyright owner. Further reproduction prohibited without permission.
Appendix A
Research Protocol Clearance
Reproduced with permission of the copyright owner. Further reproduction prohibited without permission.

72
- P M _ r \ i n
‘C e n te n n ia l
Human Subjects Institutional Review Board
1903-2003 C e le b ra t io n
Date: M ay 20, 2004
To: Richard Malott, Principal InvestigatorHolly Harrison, Student Investigator for dissertation Carie Vella, Student Investigator for honors thesis Cheryl Paberzs. Student Investigator o f honors thesis Allison Meuller. Student Investigator o f honors thesis
Re: HSIRB Project Number: 04-01-34
This letter will serve as confirmation that your research project entitled "Behavior Analysis Training System - Self-M anagement & Procrastination Book” has been ap p roved under the exem pt category o f review by the Human Subjects Institutional Review Board. The conditions and duration o f this approval are specified in the Policies o f W estern M ichigan University. You may now begin to implement the research as described in the application.
Please note that you may only conduct this research exactly in the form it was approved. You must seek specific board approval for any changes in this project. You must also seek reapproval if the project extends beyond the term ination date noted below. In addition if there are any unanticipated adverse reactions or unanticipated events associated with the conduct o f this research, you should im m ediately suspend the project and contact the Chair o f the HSIRB for consultation.
The Board wishes you success in the pursuit o f your research goals.
Approval Termination: May 20, 2005
From: M ary Lagerwev, Ph.D., Chair
W alw ood H all, K a la m a z o o , Ml 4 9 0 0 8 - 5 4 5 6 phone: (2 6 9 ) 3 8 7 - 8 2 9 3 PM: (2 6 9 ) 3 8 7 - 3 2 7 6
Reproduced with permission of the copyright owner. Further reproduction prohibited without permission.

Appendix B
Initial Research
Reproduced with permission of the copyright owner. Further reproduction prohibited without permission.

74
DIRECT OBSERVATION OF SELF-MANAGEMENT INTERVENTIONS
Introduction
The essential feature of self-management procedures is that the individual
manages his own performance. The self-management procedures used in this dissertation
required that the students recorded their performance data and implemented the
interventions themselves. Because the data were self-recorded, it was not possible to
ascertain their reliability with complete confidence. Also, though the students enlisted a
performance manager to help them adhere to their self-management intervention, it was
not clear if the interventions were being implemented as planned. Therefore, this study
examined the reliability and treatment integrity of some of the Psychology 460 students’
self-management interventions.
The study consisted of three experiments with improvements made to the methods
of assessing reliability and/or treatment integrity with each subsequent experiment. By
frequently observing and interacting with the participants, the current researcher may
have imposed subtle, unintended performance-management contingencies that influenced
the effectiveness of the self-management interventions of these students. Attempts were
made to keep the observation procedures of these experiments as unobtrusive as possible.
However, efforts to improve the procedures of the experiments may have resulted in
increased obtrusiveness. Because each experiment involved slight changes to its
procedures, the methods and results will be presented separately for each experiment.
Reproduced with permission of the copyright owner. Further reproduction prohibited without permission.

75
Experiment 1
Method
Participants and Setting
Out of 41 students in Psychology 460 during the fall semester of 2003, 6 qualified
as participants. All 6 participated for a maximum of 40 extra class points which could be
used to replace missed assignments. The extra class points were given not for doing the
self-management intervention, but rather for allowing the current researcher and research
assistants to collect data on the interventions5 reliability and treatment integrity. Only 5 of
the 6 participants completed the study.
Procedures
All students in Psychology 460 completed a one-page form (see Participant
Information Form in Appendix C) as soon as they finished designing their self
management intervention. The purpose of this form was to gather information about the
students5 interventions in order to determine if they were possible participants for this
study. Only those students whose self-management target behavior was exercising at the
Student Recreation Center (SRC) at WMU were eligible to participate. This participant
pool was selected because the students5 self-recorded performance data could be
compared to their attendance records at the SRC.
Students who chose to participate signed a consent form (see Informal Consent
Form in Appendix C) and completed the Contact Information Form (see Appendix C)
describing how their performance managers could be contacted. Copies of the consent
forms were given to the director of the SRC and the study began.
The reliability of the participants5 performance data was checked by comparing
their data to the SRC5s attendance records. All patrons of the SRC needed to scan their
Reproduced with permission of the copyright owner. Further reproduction prohibited without permission.

76
student identification card when entering the exercise rooms. Though entrance to the -
SRC did not guarantee that the participants exercised while they were there, it was highly
likely that they did exercise each time they entered the SRC. In the spring 2005 semester,
attempts were made to contact the participants in all three of the experiments. Five out of
the 13 participants were successfully contacted, and 4 exercised every time they entered
the SRC. On one occasion, 1 participant entered the SRC and left without exercising
because his friend was not able to enter with him.
Participants recorded their data in terms of how many days per week they
exercised. The reliability was assessed in terms of the percentage of agreement between
the number of days of exercise reported by the participants and the number of days they
entered the SRC. These reliability checks occurred randomly at a minimum of 25% of the
total weeks the self-management intervention was in effect. The weeks were randomly
selected by drawing numbers. To evaluate treatment integrity, the researcher or research
assistants contacted the participants’ performance managers by phone or by email on the
same weeks as the reliability checks. To avoid imposing additional performance
management, there was minimal contact between the participant and the researchers
during the study.
Unfortunately, this effort at minimal contact sometimes resulted in missing
information and incomplete data. As described earlier, the participants gave the
researcher information about their self-management interventions at the beginning of the
experiment, using the Participant Information Form and the Contact Information Form
(see Appendix C). This information was used to plan which weeks to verify the data with
the SRC and to plan the contact with the performance managers. Incorrect information
Reproduced with permission of the copyright owner. Further reproduction prohibited without permission.
77
about the participants’ interventions and about how to contact the participants and their
performance managers was discovered throughout the study, causing delays and loss of
data. Also, it was difficult to get participant compliance on the recording procedures. If
the participants also exercised at locations other than the SRC, they were instructed to
record the location on their weekly graph. The researchers observed the participants’
weekly self-management presentations in class and gave feedback about the correctness
of the participants’ recording. Despite this feedback and even loss of the extra class
points, some participants continued to fail to record the location of the behavior. It was
likely that the points were not powerful reinforcers for some of the participants.
Another problem related to comparing the participant data to the SRC data.
Reliability was checked on only 25% of the total weeks of the intervention. In other
words, the SRC attendance data were not collected over the entire intervention.
Participants recorded data weekly and determined the day that the weeks would start and
end. The SRC data were collected to correspond to a particular week in the participant’s
intervention. At the end of the semester, participants turned in their final report and their
self-recorded data were compared to the SRC data. Some participants had recorded data
differently than they had planned at the beginning of the semester, making it impossible
to compare the two sets of data. For example, at the beginning of the semester, a
participant reported that she would be recording data in terms of the frequency of
exercise per week, with her weeks running from Monday to Sunday. Therefore, the SRC
data were collected for 25% of those Monday-to-Sunday weeks. However, when the data
were compared, it was discovered that the participant’s weeks had been recorded as
Reproduced with permission of the copyright owner. Further reproduction prohibited without permission.

78
running from Wednesday to Tuesday. Therefore, reliability could not be determined for
that participant.
Results and Discussion
A total of five out of 6 participants completed the study. However, as discussed
earlier, participant 5 a gave inaccurate information about the day on which her weeks
started. It was not possible to determine the reliability of her data. Of the remaining four
participants, participant 4a chose not to participate in the treatment integrity component
and participant 2a was using another student’s identification card to enter the SRC.
Though he was asked repeatedly about the discrepancy between his data and the SRC
data, he did not tell the researchers about the card until the end of the study. (The
reliability and treatment integrity data for all 6 participants are summarized in Table Bl.)
Participants
Baseline Mean Weekly
Frequency of Exercise
Intervention Mean Weekly Frequency of
Exercise
Reliability TreatmentIntegrity
la 1 day of exercise 4.63 days of exercise 100% 100%
2a 7 days of exercise
7 days of exercise
Used another student’s ID to
get into the SRC100%
3a 0 days of exercise
1.25 days of exercise
Never attended the SRC 33%
4a 1.5 days of exercise
3.11 days of exercise 90%
Chose not to participate in the treatment
integrity component
5a 0 days of exercise
2.82 days of exercise
Could not compare student
and SRC data
100%
6a Unknown Unknown Dropped out of study 100%
Table B l. Summary of results for all participants of ixperiment 1.
Reproduced with permission of the copyright owner. Further reproduction prohibited without permission.
79
Four of the participants were successfully contacted after the experiment ended.
All four reported that they felt their self-management intervention was successful. Three
of those 4 participants said completing the intervention improved their health and
impacted their lives in terms of weight loss (3), a better figure (1), feeling better about
themselves (2) and sleeping better (1).
In conclusion of Experiment 1, 4 of the 5 participants for whom it was possible to
obtain the relevant data showed 100% treatment integrity. Of the 2 participants for whom
it was possible to obtain reliability data, both showed between 90% and 100% reliability.
Experiment 2
Method
Participants and Setting
Out of 33 students in Psychology 460 during the spring semester of 2004, 13
students qualified as participants. Of the 13 students who qualified, 6 chose to participate
for a maximum of 40 extra class points. A total of 3 participants completed the study.
Procedures
Experiment 2 used the same methods as Experiment 1, with the exception of one
major improvement. The SRC data had previously been collected for only 25% of the
total weeks of the intervention. Those data were collected on a daily basis by emailing a
contact person at the SRC. In Experiment 2, the SRC data were collected in the form of a
semester-long report. This change eliminated the need to send frequent emails to the SRC
and eliminated some of the problems related to comparing the participant and SRC data.
Results and Discussion
Despite this improvement, some of the difficulties involving the lack of contact
with the participants and lack of powerful reinforcers remained. Again, despite feedback
Reproduced with permission of the copyright owner. Further reproduction prohibited without permission.
and loss of the extra class points, participants failed to record when they exercised
somewhere other than the SRC. This problem was worse in Experiment 2 than it had
been in the previous experiment. Two of the participants (lb and 2b) failed to record the
location of the exercise, making it impossible to compare their self-recorded data to the
SRC’s data. Another participant (3b) recorded his data in terms of hours of exercise,
rather than days of exercise, making it impossible to compare his data to the SRC’s data.
Also, a confound was discovered related to the treatment-integrity component of
the study. In all three experiments, the participants’ performance managers were often
their friends or relatives and may have reported the participants’ compliance with the
intervention more favorably than it really was. This did occur at least once during the
study, as reported later by that participant.
The data for all of the participants are summarized in Table B2. Also, two of the
participants were successfully contacted after the experiment ended. Both reported that
their self-management interventions were successful and that the interventions improved
their health. One of the participants specified that he lost weight, felt more fit, and felt
better about himself.
Reproduced with permission of the copyright owner. Further reproduction prohibited without permission.

81
Participants
Baseline Mean Weekly
Frequency of Exercise
Intervention Mean Weekly Frequency of
Exercise
Reliability TreatmentIntegrity
lb 1.33 day of exercise
3.33 days of exercise
13% (Probably due to incorrect
recording)100%
2b 3 days of exercise
3.3 days of exercise
44% (Probably due to incorrect
recording)100%
3b 0 hours of exercise
2.33 hours of exercise
Could not compare SRC and
student data100%
4b Unknown Unknown Dropped out of study 100%
5b Unknown Unknown Dropped out of study 0%
6b Unknown Unknown Dropped out of study 100%
Table B2. Summary of results for all participants of experiment 2.
In conclusion of Experiment 2, 5 of the 6 participants showed 100% treatment
integrity, while 1 participant had 0% treatment integrity. The 2 participants for whom
reliability could be assessed, showed low levels of reliability, most likely because of a
failure to record when they exercised at locations other than the SRC. The most valuable
result of Experiment 2 was that it indicated improvements to be made in Experiment 3.
Experiment 3
Method
Participants and Setting
Out of 25 students in Psychology 460 during the fall semester of 2004, 3 students
qualified as participants. Of the 3 students who qualified, 1 chose to participate for a
maximum of 50 extra class points.
Reproduced with permission of the copyright owner. Further reproduction prohibited without permission.

82
Procedures
Once again, the methods of Experiment 3 remained the same as the previous
experiments with the exception of a few changes. The changes in this final experiment
involved more contact with the participant. The participant emailed her data to the
researcher every week and the SRC reports were compared to the participants’ self
recorded data every week. These changes made it possible to detect and intervene on
failure to record the location of the behavior throughout the semester. The weekly, one-
on-one email contact may have also imposed more social contingencies that supported
correct recording. Because the weekly emails required slightly more effort from the
participant than in the previous experiments, the extra class points were increased to 50,
as opposed to 40 in the previous experiments.
Also, to increase the chances of the performance managers giving accurate
information, Experiment 3 involved asking the performance managers more questions
than in the previous studies. The earlier experiments involved asking the performance
managers if they met with the participant that week. This was a simple yes or no answer,
making it hard to determine if the performance manager was giving false information.
The final experiment involved asking the performance manager when he met with the
participant that week, how many times the participant did the behavior during the week,
how much money the participant was supposed to pay, and how much money the
participant actually paid. If the performance manager could answer the questions and the
answers matched the participant’s data, it was more likely the performance manager had
met with the participant that week and was giving accurate information.
In the 9th week of the self-management intervention (which was the 5th week of
the intervention phase), the current researcher became the participant’s performance
Reproduced with permission of the copyright owner. Further reproduction prohibited without permission.
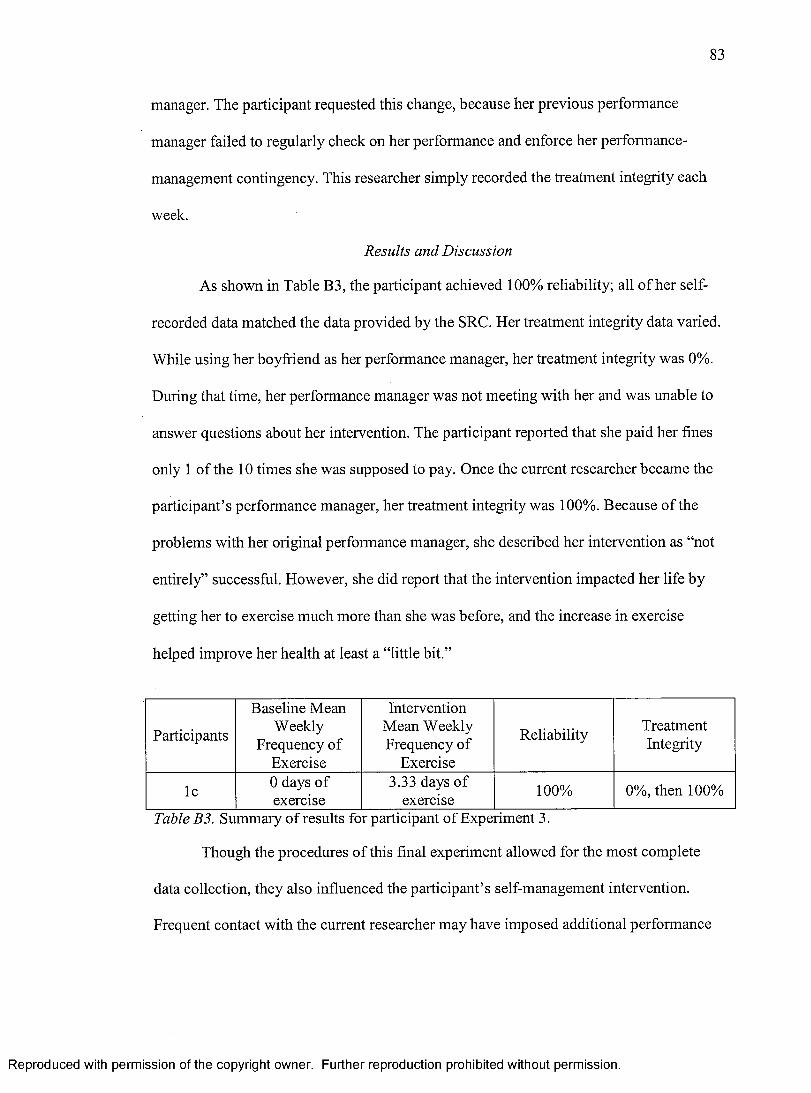
83
manager. The participant requested this change, because her previous performance
manager failed to regularly check on her performance and enforce her performance-
management contingency. This researcher simply recorded the treatment integrity each
week.
Results and Discussion
As shown in Table B3, the participant achieved 100% reliability; all of her self
recorded data matched the data provided by the SRC. Her treatment integrity data varied.
While using her boyfriend as her performance manager, her treatment integrity was 0%.
During that time, her performance manager was not meeting with her and was unable to
answer questions about her intervention. The participant reported that she paid her fines
only 1 of the 10 times she was supposed to pay. Once the current researcher became the
participant’s performance manager, her treatment integrity was 100%. Because of the
problems with her original performance manager, she described her intervention as “not
entirely” successful. However, she did report that the intervention impacted her life by
getting her to exercise much more than she was before, and the increase in exercise
helped improve her health at least a “little bit.”
Participants
Baseline Mean Weekly
Frequency of Exercise
Intervention Mean Weekly Frequency of
Exercise
Reliability TreatmentIntegrity
lc 0 days of exercise
3.33 days of exercise 100% 0%, then 100%
Table B3. Summary of results for participant of Experiment 3.
Though the procedures of this final experiment allowed for the most complete
data collection, they also influenced the participant’s self-management intervention.
Frequent contact with the current researcher may have imposed additional performance
Reproduced with permission of the copyright owner. Further reproduction prohibited without permission.

management on the target behavior and the behaviors related to using the self
management procedures. The frequent contact made the reliability checks more obtrusive
in this experiment, possibly increasing the participant’s reactivity and increasing the
reliability of her self-recorded data. Also, having the researcher as the performance
manager made the intervention more of the ideal, rather than the typical, scenario. So, the
results would not generalize to the other student interventions that did not have
“professional” performance managers.
Reproduced with permission of the copyright owner. Further reproduction prohibited without permission.
Appendix C
Materials Used in Initial Research
Reproduced with permission of the copyright owner. Further reproduction prohibited without permission.
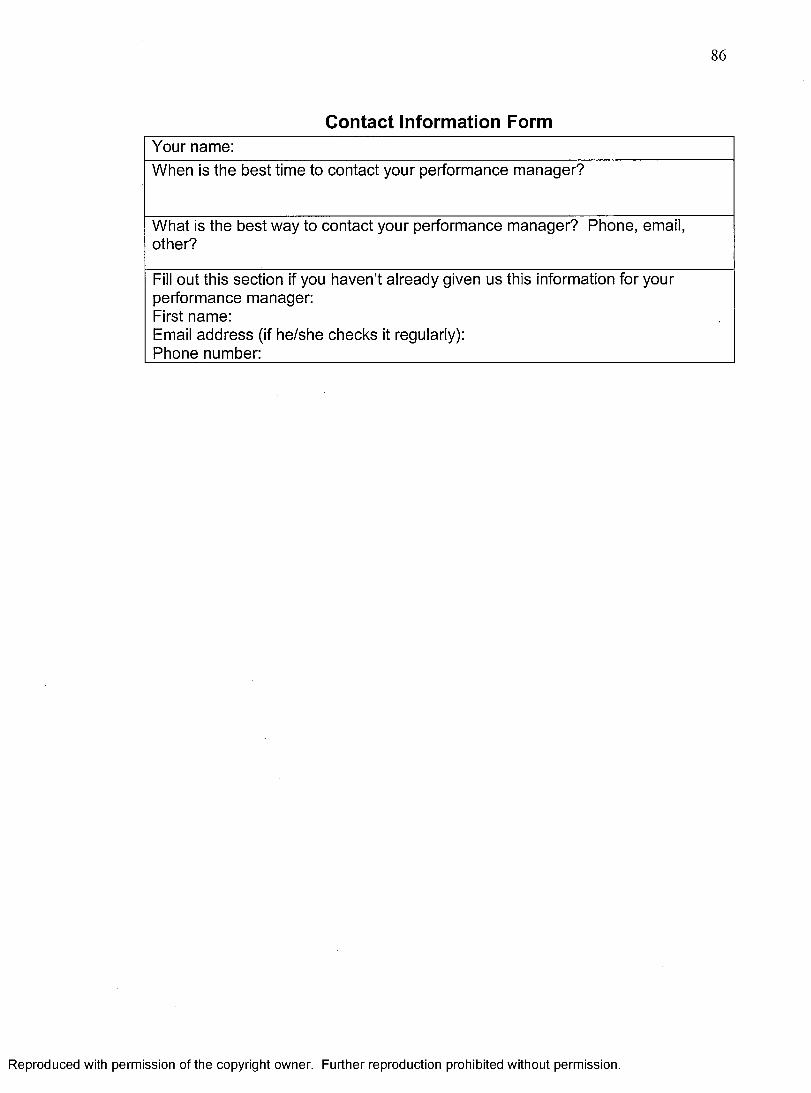
Contact Information Form
86
Your name:When is the best time to contact your performance manager?
What is the best way to contact your performance manager? Phone, email, other?
Fill out this section if you haven’t already given us this information for your performance manager:First name:Email address (if he/she checks it regularly):Phone number:
Reproduced with permission of the copyright owner. Further reproduction prohibited without permission.

87
Partipant Information Form
Please fill out this form as accurately as possible. We will use the information to determine if you are eligible to participate in a self-management study. If you are eligible, you will have the opportunity to earn OAPs for participating. Feel free tocontact Holly Harrison if you have any questions.___________________________Name:
Behavior:
What are your goals for the behavior (example: run for 30 minutes, 3 times a week)?Where will you do the behavior?
If you will exercise at the rec center, would you give me permission to check their records to see when you were there?
When will you do the behavior?
Will there be any proofs of your behavior? If yes, list them.
When will/did your baseline start (date)?When will your intervention start (date)?
On what day of the week will your weeks start?
What will be your performance-management contingency for the behavior?SD (Deadline):
Before Behavior After
When will you meet with your performance manager?
Who will be your performance manager?
Can I contact your performance manager?
If yes, please give us the following information for your performance manager (if you’d prefer, you can leave this part blank and we will get the info from you later if you participate):First name:Email address (if he/she checks it regularly):Phone number:
Reproduced with permission of the copyright owner. Further reproduction prohibited without permission.

88
Informal Consent Form
Psychology 460:Self-Management Optional Activity Points Project
I am completing the self-management optional activity points project as part of the regular assignments for my Psychology 460 class. As part of this project, Holly Harrison will check my attendance at the Student Recreation Center for the entire Fall 2004 semester. My signature below shows that I give my permission for Holly to view the records that show when I swiped my identification card at the Student Recreation Center during the Fall 2004 semester.
Printed Name Date
Signed Name Date
Reproduced with permission of the copyright owner. Further reproduction prohibited without permission.

Appendix D
Procrastination Survey
Reproduced with permission of the copyright owner. Further reproduction prohibited without permission.

90
Procrastination Survey
I ’ll Stop Procrastinating when I Get Around to ItAnonymous Questionnaire
1. In which class are you taking this questionnaire?a. PSY 100 Hb. PSY 360c. PSY 460c. PSY 610d. other
2. How many days per week do you floss?a. 0b. 1-2c. 3-4d. 5-6e. 7
3. How many cavities do you have?a. 0b. 1-3c. 4-7d. 8-11e. 12 or more
4. Did you know you should floss daily before you read the procrastination book? (If you have not read the procrastination book, do you know you should floss daily?)a. yesb. no
5. On average, how many emails per month do you fail to reply to?a. 0b. 1-10c. 10-50d. 51-100e. More than 100
6. On average, how many emails have you failed to initiate per month (messages that you should have written, but were not reply messages)?a. 0b. 1-10c. 10-50d. 51-100e. more than 100
Reproduced with permission of the copyright owner. Further reproduction prohibited without permission.
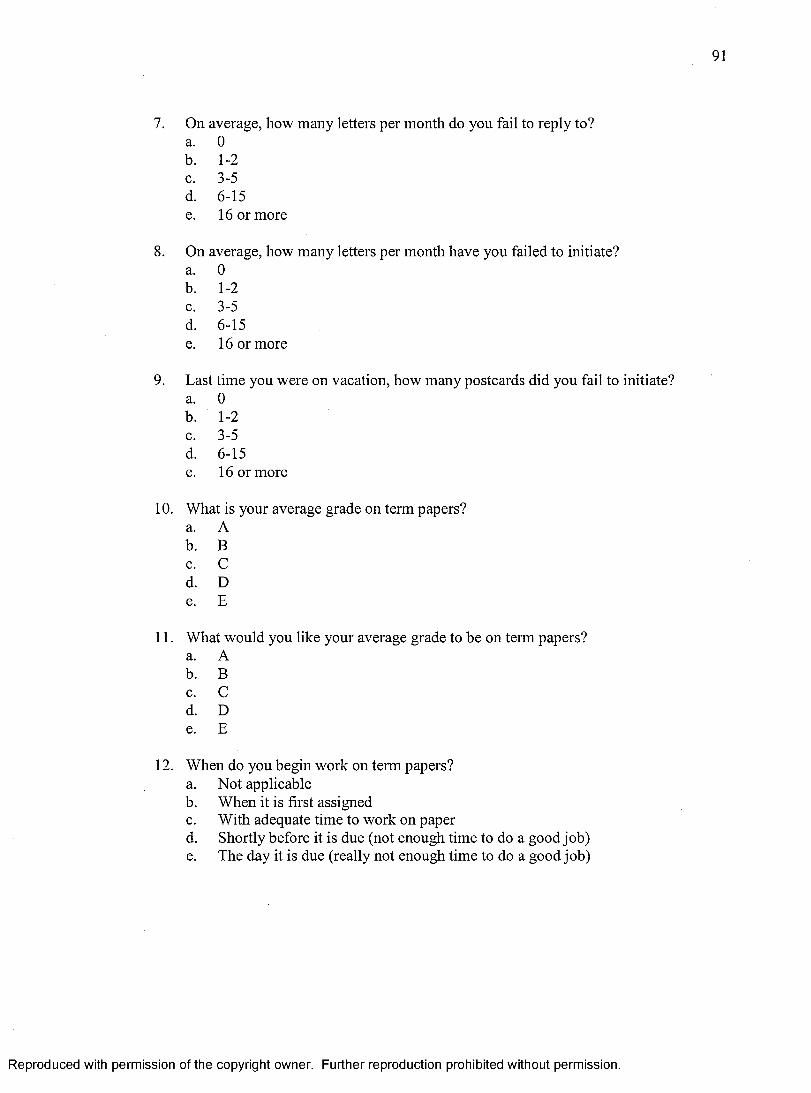
7. On average, how many letters per month do you fail to reply to?a. 0b. 1-2c. 3-5d. 6-15e. 16 or more
8. On average, how many letters per month have you failed to initiate?a. 0b. 1-2c. 3-5d. 6-15e. 16 or more
9. Last time you were on vacation, how many postcards did you fail to initiate?a. 0b. 1-2c. 3-5d. 6-15e. 16 or more
10. What is your average grade on term papers?a. Ab. Bc. Cd. De. E
11. What would you like your average grade to be on term papers?a. Ab. Bc. Cd. De. E
12. When do you begin work on term papers?a. Not applicableb. When it is first assignedc. With adequate time to work on paperd. Shortly before it is due (not enough time to do a good job)e. The day it is due (really not enough time to do a good job)
Reproduced with permission of the copyright owner. Further reproduction prohibited without permission.

13. How many credits do you have this semester?a. 0b. 1-6c. 7-12d. 13-16e. >16
14. How many hours per week do you study, outside of class?a. 0b. 1-3c. 4-7d. 8-11e. 12 or more
15. If you really had your act together how many hours do you wish you studied?a. 0b. 1-3c. 4-7d. 8-11e. 12 or more
16. How many hours per week do you exercise?a. 0b. 1-3c. 4-7
. d. 8-11e. 12 or more
17. How many hours do you wish you were exercising per week?a. 0b. 1-3c. 4-7d. 8-11e. 12 or more
18. What is your opinion of your body weight?a. underweightb. appropriatec. 1-5 lbs. overweightd. 6-10 lbs. overweighte. more than 10 lbs. overweight
Reproduced with permission of the copyright owner. Further reproduction prohibited without permission.

19. How happy are you with your body weight?a. very happyb. happyc. so-sod. unhappye. very unhappy
20. How satisfied are you with your muscle build?a. too muscularb. a little bit too muscularc. all rightd. a little too weake. too weak
21. How happy are you with your muscle build?a. very happyb. happyc. so-sod. unhappye. very unhappy
22. How much time per week do you spend doing hobbies?a. 0 hoursb. 1-4 hoursc. 5-8 hoursd. 9-12 hourse. 13 hours or more
23. How much time do you wish you could spend doing hobbies each week?a. 0 hoursb. 1-4 hoursc. 5-8 hoursd. 9-12 hourse. 13 hours or more
24. How many days per week do you consume junk food?a. 0b. 1-2c. 3-4d. 5-6e. 1
Reproduced with permission of the copyright owner. Further reproduction prohibited without permission.

94
25. How many days per week would you like to consume junk food to achieve your optimum health and well-being? Yes, you can either increase or decrease the days/week.a. 0b. 1-2c. 3-4d. 5-6e. 7
The following answers apply to questions 26-37.a. 0b. once in a while, but not once a weekc. 1-3d. 4-5e. 6-7
26. How many days per week do you take Aspirin?27. How many days per week do you wish you took Aspirin for your optimum health
and well-being?28. How many days per week do you drink caffeine?29. How many days per week do you wish you drank caffeine for your optimum health
and well-being?30. How many days per week do you smoke or chew nicotine?31. How many days per week do you wish you smoked or chewed nicotine for your
optimum health and well-being?32. How many days per week do you drink alcohol?33. How many days per week do you wish you drank alcohol for your optimum health
and well-being?34. How many days per week do you use marijuana?35. How many days per week do you wish you used marijuana for your optimum health
and well-being?36. How many days per week do you use hard drugs (LSD, cocaine, heroine, etc)?37. How many days per week do you wish you used hard drugs for your optimum health
and well-being?
38. What level are you in school?a. Freshmanb. Sophomorec. Juniord. Seniore. Graduate student
Reproduced with permission of the copyright owner. Further reproduction prohibited without permission.

95
39. What final degree do you want to get?a. N/A or noneb. Associatesc. Bachelorsd. Masterse. Doctorate
40. What is your GPA?a. N/Ab. 3.5-4.0c. 3.0 - 3.49d. 2.5 - 2.99e. below 2.5
41. If you are less than very satisfied with your GPA, what is the lowest GPA with which you would be very satisfied?a. N/A (currently satisfied)b. 3 .5-4.0c. 3.0-3.49d. 2.5 - 2.99e. below 2.5
42. If you are less than very satisfied with your current GPA, how many extra hours per week are you willing and able to spend studying to achieve the GPA with which you would be very satisfied, assuming you had the self-management/time-management skills that would help you to do so?a. 0b. 1-3c. 4-7d. 8-11e. 12 or more
43. Last semester, how many hours per week did you study, outside of class?a. 0b. 1-3c. 4-7d. 8-11e. 12 or more
44. Last semester, how many hours per week did you work (i.e. for $, as a parent, as a homemaker, etc)?a. 0-10b. 11-20c. 21-30d. 31-40e. >40
Reproduced with permission of the copyright owner. Further reproduction prohibited without permission.

96
45. Could you have afforded to go to school, if you had not worked?a. Not applicableb. Yesc. No
46. How many classes did you miss last semester because you just blew them off?a. Not applicableb. 0c. 1-3d. 4-7e. 8 or more
47. What percentage of your assigned readings did you complete last semester?a. N/Ab. 0-25c. 26-50d. 51-75e. 76-100
48. What percentage of your assigned homework did you complete last semester?a. N/Ab. 0-25c. 26-50d. 51-75e. 76-100
49. How many assignments did you turn in late, for reasons other than illness last semester?a. Not applicableb. 0c. 1-3d. 4-7e. 8 or more
50. How many times did you make flashcards before you took a course w/Malott?a. N/Ab. 0c. 1-3d. 4-7e. 8 or more
Reproduced with permission of the copyright owner. Further reproduction prohibited without permission.
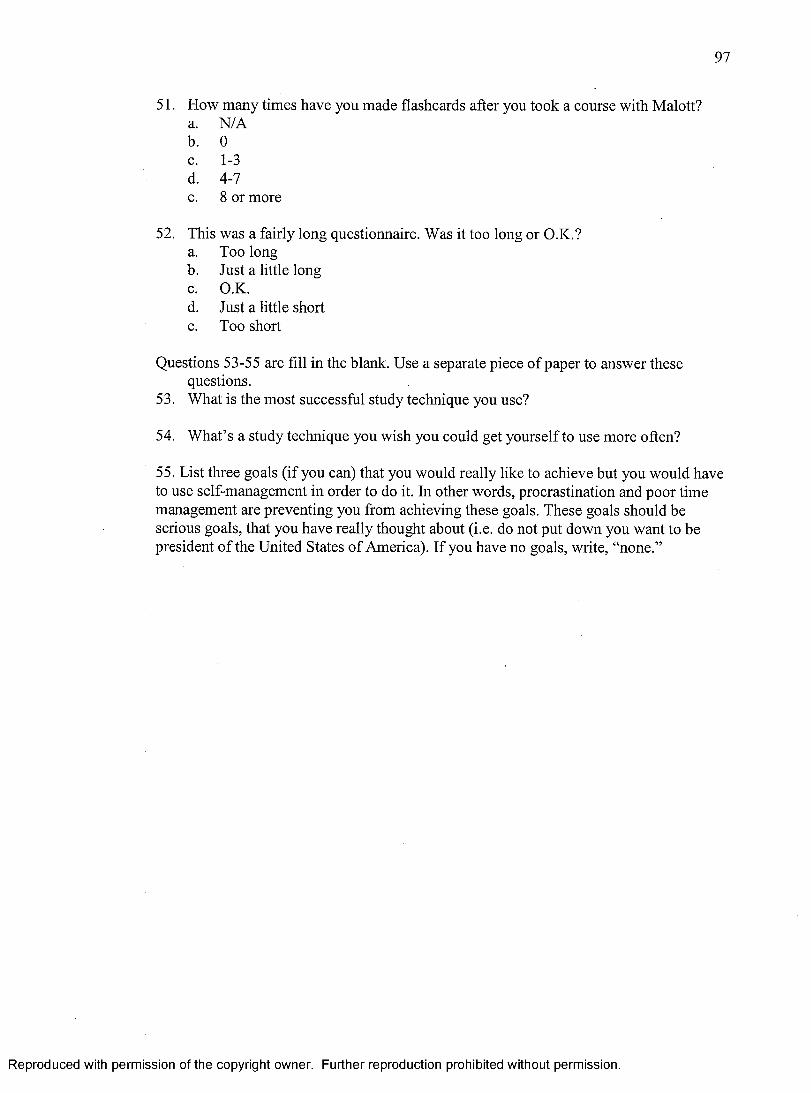
97
51. How many times have you made flashcards after you took a course with Malott?a. N/Ab. 0c. 1-3d. 4-7e. 8 or more
52. This was a fairly long questionnaire. Was it too long or O.K.?a. Too longb. Just a little longc. O.K.d. Just a little shorte. Too short
Questions 53-55 are fill in the blank. Use a separate piece of paper to answer these questions.
53. What is the most successful study technique you use?
54. What’s a study technique you wish you could get yourself to use more often?
55. List three goals (if you can) that you would really like to achieve but you would have to use self-management in order to do it. In other words, procrastination and poor time management are preventing you from achieving these goals. These goals should be serious goals, that you have really thought about (i.e. do not put down you want to be president of the United States of America). If you have no goals, write, “none.”
Reproduced with permission of the copyright owner. Further reproduction prohibited without permission.

Appendix E
Self-Management Survey
Reproduced with permission of the copyright owner. Further reproduction prohibited without permission.
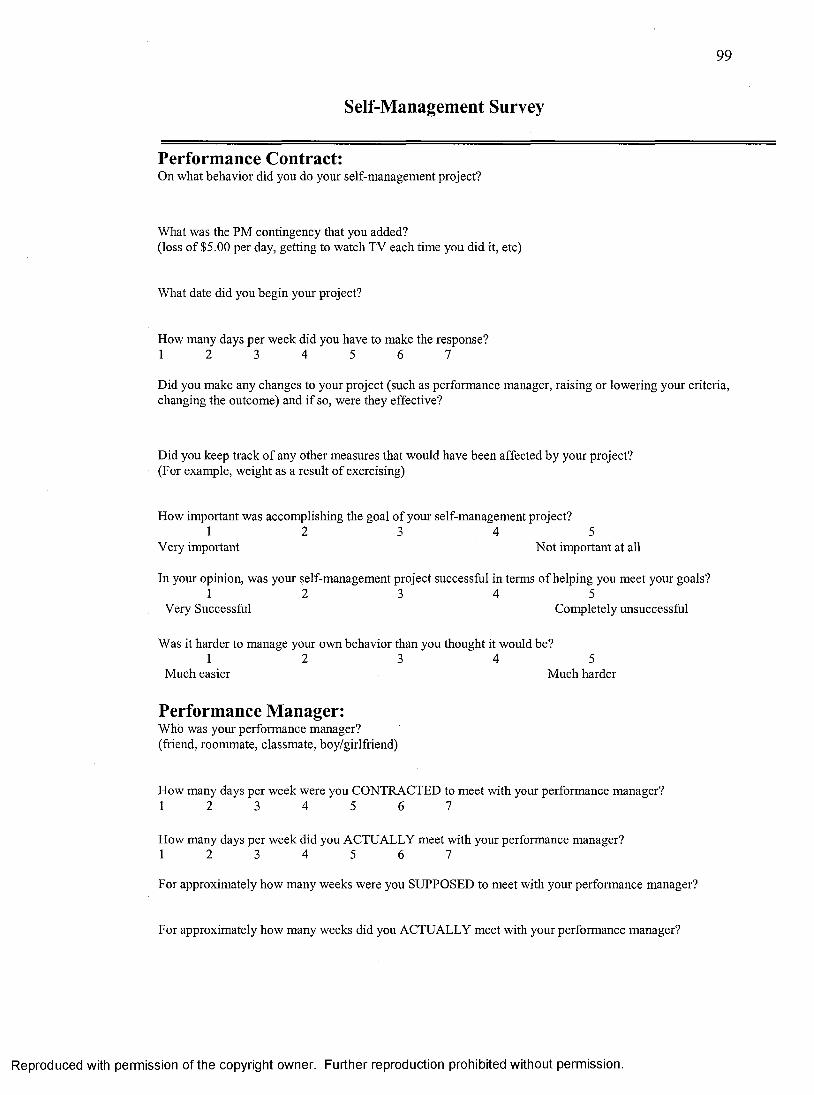
99
Self-Management Survey
Performance Contract:On what behavior did you do your self-management project?
What was the PM contingency that you added?(loss o f $5.00 per day, getting to watch TV each time you did it, etc)
What date did you begin your project?
How many days per week did you have to make the response?1 2 3 4 5 6 7
Did you make any changes to your project (such as performance manager, raising or lowering your criteria, changing the outcome) and if so, were they effective?
Did you keep track o f any other measures that would have been affected by your project?(For example, weight as a result o f exercising)
How important was accomplishing the goal of your self-management project?1 2 3 4 5
Very important Not important at all
In your opinion, was your self-management project successful in terms o f helping you meet your goals? 1 2 3 4 5
Very Successful Completely unsuccessful
Was it harder to manage your own behavior than you thought it would be?1 2 3 4 5
Much easier Much harder
Performance Manager:Who was your performance manager?(friend, roommate, classmate, boy/girlfriend)
How many days per week were you CONTRACTED to meet with your performance manager?1 2 3 4 5 6 7
How many days per week did you ACTUALLY meet with your performance manager?1 2 3 4 5 6 7
For approximately how many weeks were you SUPPOSED to meet with your performance manager?
For approximately how many weeks did you ACTUALLY meet with your performance manager?
Reproduced with permission of the copyright owner. Further reproduction prohibited without permission.
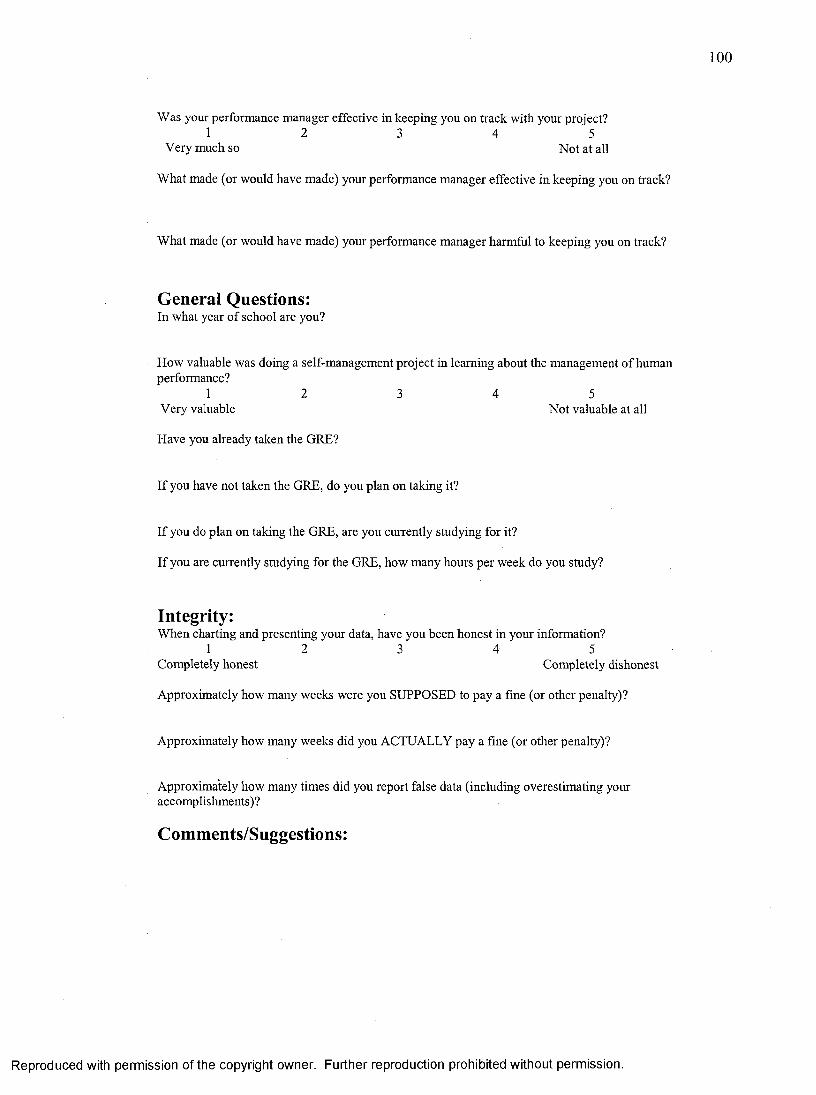
Was your performance manager effective in keeping you on track with your project?1 2 3 4 5
Very much so Not at all
What made (or would have made) your performance manager effective in keeping you on track?
What made (or would have made) your performance manager harmful to keeping you on track?
General Questions:In what year o f school are you?
How valuable was doing a self-management project in learning about the management o f human performance?
1 2 3 4 5Very valuable Not valuable at all
Have you already taken the GRE?
If you have not taken the GRE, do you plan on taking it?
If you do plan on taking the GRE, are you currently studying for it?
If you are currently studying for the GRE, how many hours per week do you study?
Integrity:When charting and presenting your data, have you been honest in your information?
1 2 3 4 5Completely honest Completely dishonest
Approximately how many weeks were you SUPPOSED to pay a fine (or other penalty)?
Approximately how many weeks did you ACTUALLY pay a fine (or other penalty)?
Approximately how many times did you report false data (including overestimating your accomplishments)?
Comments/Suggestions:
Reproduced with permission of the copyright owner. Further reproduction prohibited without permission.

Appendix F
Transfer Survey
Reproduced with permission of the copyright owner. Further reproduction prohibited without permission.

102
Transfer Survey
At any time during this semester, did you do any self-management projects other than the one that’s required for this class?
Yes No
If yes, what behavior(s) did you manage?
If yes, how useful is self-management in helping you improve those behaviors? 1 2 3 4 5
extremely completelyuseful useless
Reproduced with permission of the copyright owner. Further reproduction prohibited without permission.

Appendix G
Maintenance Survey
Reproduced with permission of the copyright owner. Further reproduction prohibited without permission.
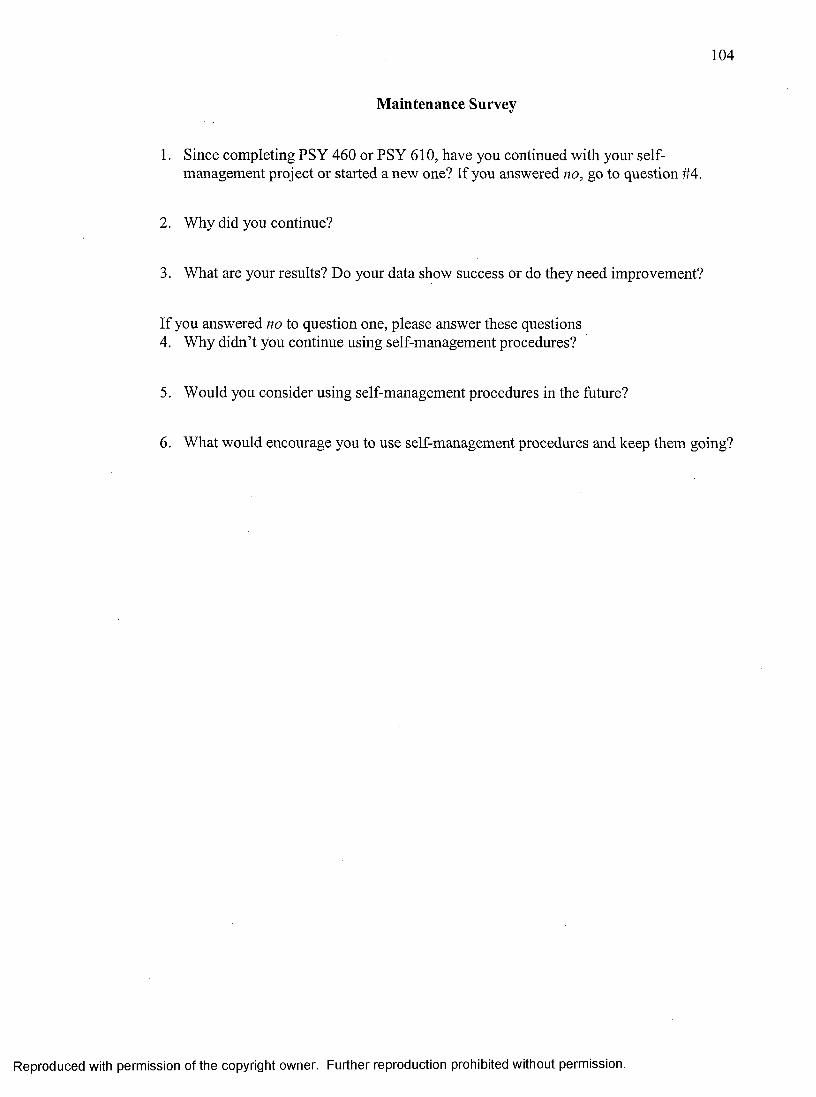
104
Maintenance Survey
1. Since completing PSY 460 or PSY 610, have you continued with your selfmanagement project or started a new one? If you answered no, go to question #4.
2. Why did you continue?
3. What are your results? Do your data show success or do they need improvement?
If you answered no to question one, please answer these questions4. Why didn’t you continue using self-management procedures?
5. Would you consider using self-management procedures in the future?
6. What would encourage you to use self-management procedures and keep them going?
Reproduced with permission of the copyright owner. Further reproduction prohibited without permission.

BIBLIOGRAPHY
Brigham, T., Hopper, C., Hill, B., De Armas, A., & Newsom, P. (1985). A self
management program for disruptive adolescents in the schools: A clinical
replication analysis. Behavior Therapy, 16, 99-115.
Burgio, L., Engel, B., Hawkins, A., McCormick, K., Scheve, A., & Jones, L. (1990). A
staff management system for maintaining improvements in continence with
elderly nursing home residents. Journal o f Applied Behavior Analysis, 23, 111-
118.
Emmett, R. (2000). The procrastinator’s handbook: Mastering the art o f doing it now.
New York: Walker & Company.
Fiore, N. (1989). The now habit: A strategic program for overcoming procrastination
and enjoying guilt-free play. Los Angeles: Jeremy P. Tarcher.
Fixsen, D., Phillips, E., & Wolf, M. (1972). Achievement place: The reliability of self-
reporting and peer-reporting and their effects on behavior. Journal o f Applied
Behavior Analysis, 5, 19-30.
Frea, W., & Hughes, C. (1997). Functional analysis and treatment of social-
communicative behavior of adolescents with developmental disabilities. Journal
o f Applied Behavior Analysis, 30, 701-704.
Foxx, R. M. & Brown, R. A. (1979). Nicotine fading and self-monitoring for cigarette
abstinence or controlled smoking. Journal o f Applied Behavior Analysis, 12, 111-
125.
Johnson, S., Welsh, T., Miller, K., & Altus, D. (1991). Participatory management:
Maintaining staff performance in a university housing cooperative. Journal o f
Applied Behavior Analysis, 24, 119-127.
Reproduced with permission of the copyright owner. Further reproduction prohibited without permission.
Kanfer, F. (1975). Self-management methods. In F. Kanfer & A. Golstein (Eds.), Helping
People Change (pp. 309-355). New York: Pergamon Press.
Kazdin, A. (1975). Behavior modification in applied settings. Homewood, IL: Dorsey
Press.
Knaus, W. (1998). Do it now!: Break the procrastination habit. New York: John Wiley &
Sons.
Knaus, W. & Ellis, A. (2002). The procrastination workbook: Your personalized
program for breaking free from the patterns that hold you back. Oakland, CA:
New Harbinger.
Krause, W. & Knaus, W. (1977). Overcoming procrastination; Or how to think and act
rationally in spite o f life's inevitable hassles. New York: Institute for Rational
Living.
Meier, S., Brigham, T., & Gilbert, B. (1998). Analyzing methods for increasing
designated driving. Journal o f Prevention & Intervention in the Community, 17,
1-14.
Olympia, D., Sheridan, S., Jenson, W., & Andrews, D. (1994). Using student-managed
interventions to increase homework completion and accuracy. Journal o f Applied
Behavior Analysis, 27, 85-99.
Schroder, K., Carey, M., & Vanable, P. (2003). Methodological challenges in research on
sexual risk behavior: II. Accuracy of self-reports. Annals o f Behavioral Medicine,
26, 104-123.
Skinner, B. (1974) About behaviorism. New York: Random House.
Reproduced with permission of the copyright owner. Further reproduction prohibited without permission.

107
Stevenson, H., & Fantuzzo, J. (1984). Application of the generalization map to a self-
control intervention with school-aged children. Journal o f Applied Behavior
Analysis, 17, 193-212.
Thomas, J. (1976). Accuracy of self-assessment of on-task behavior by elementary school
children. Journal o f Applied Behavior Analysis, 9, 199-210.
Thoresen, C., & Mahoney, M. (1974). Behavioral self-control. New York: Hart, Rinehart,
& Winston.
Tracy, B. (2001). Eat that frog! 21 great ways to stop procrastinating and get more done
in less time. San Francisco: Berrett-Koehler.
Tuckman, B. W. (1979). Evaluating instructional programs. Boston: Allyn and Bacon.
Watson, D. L. & Tharp, R. G. (1997). Self-directed behavior: Self-modification for
personal adjustment (7th ed). Pacific Grove, CA: Brooks/Cole.
Reproduced with permission of the copyright owner. Further reproduction prohibited without permission.


![Winter Contingency Plan 2019 - PDMA Contingency... · 2020. 12. 24. · [KHYBER PAKHTUNKHWA WINTER CONTINGENCY PLAN 2019-20] Winter Contingency Plan 5 | Page utilizing PAF strategic](https://static.fdocuments.in/doc/165x107/611400065caf3c03a80f7591/winter-contingency-plan-2019-pdma-contingency-2020-12-24-khyber-pakhtunkhwa.jpg)


