The third factor Effect modification Confounding factor FETP India.
60
The third factor Effect modification Confounding factor FETP India
-
Upload
martin-phillips -
Category
Documents
-
view
230 -
download
0
Transcript of The third factor Effect modification Confounding factor FETP India.

The third factor
Effect modificationConfounding factor
FETP India

Competency to be gained from this lecture
Identify and describe an effect modification
Eliminate a confounding factor

Key elements
• Describing an effect modification• Eliminating a confounding factor

Stratification
• Sub-groups can be defined according to various characteristics in a population Age Sex Socio-economic status
• An association between a risk factor and an outcome may be studied within these various strata

Key elements
• Describing an effect modification• Eliminating a confounding factor
Effect modification

Spotting effect modification in a stratified analysis
• Effect modification (= Interaction) occurs when the answer about a measure of association is: “it depends”
• Examples: Efficacy of measles vaccine
• Variation according to the age Risk of myocardial infarction among women
taking oral contraceptives• Variation according to smoking habits
Effect modification
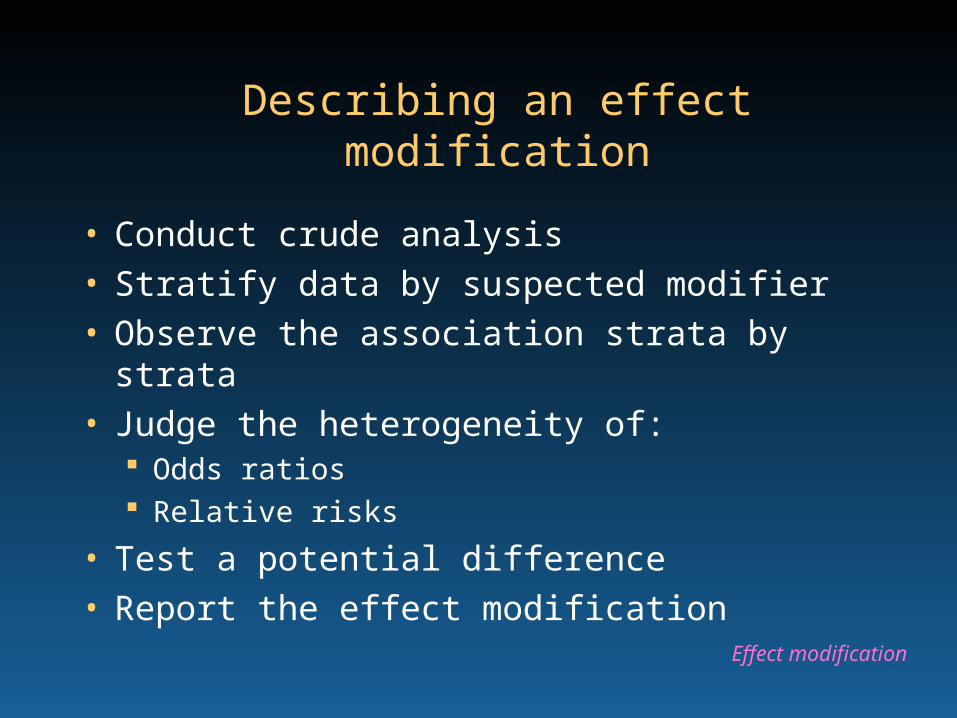
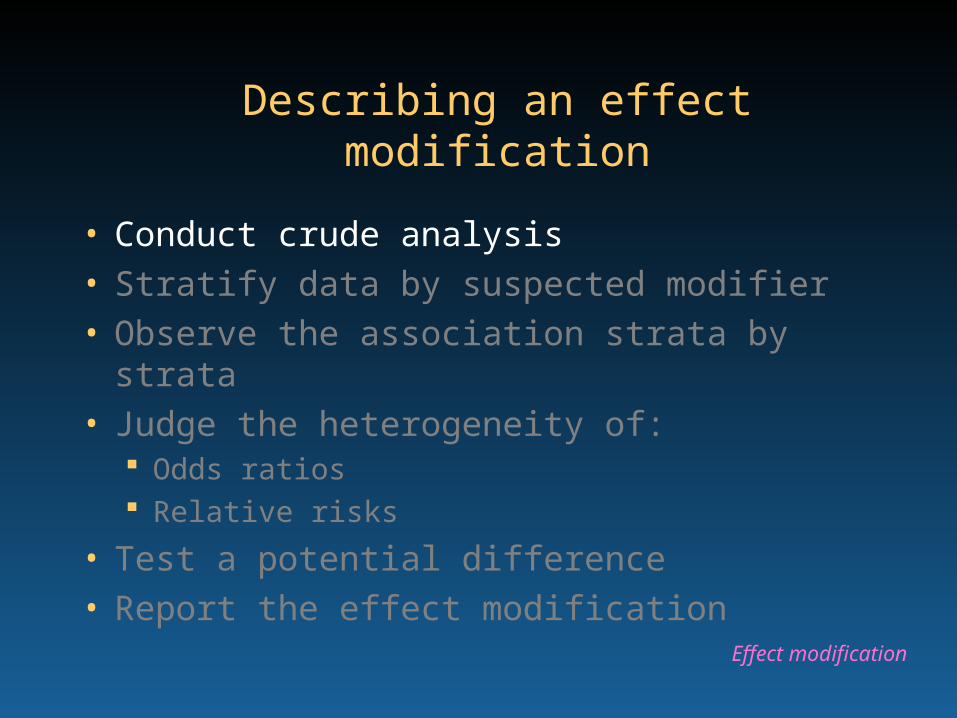
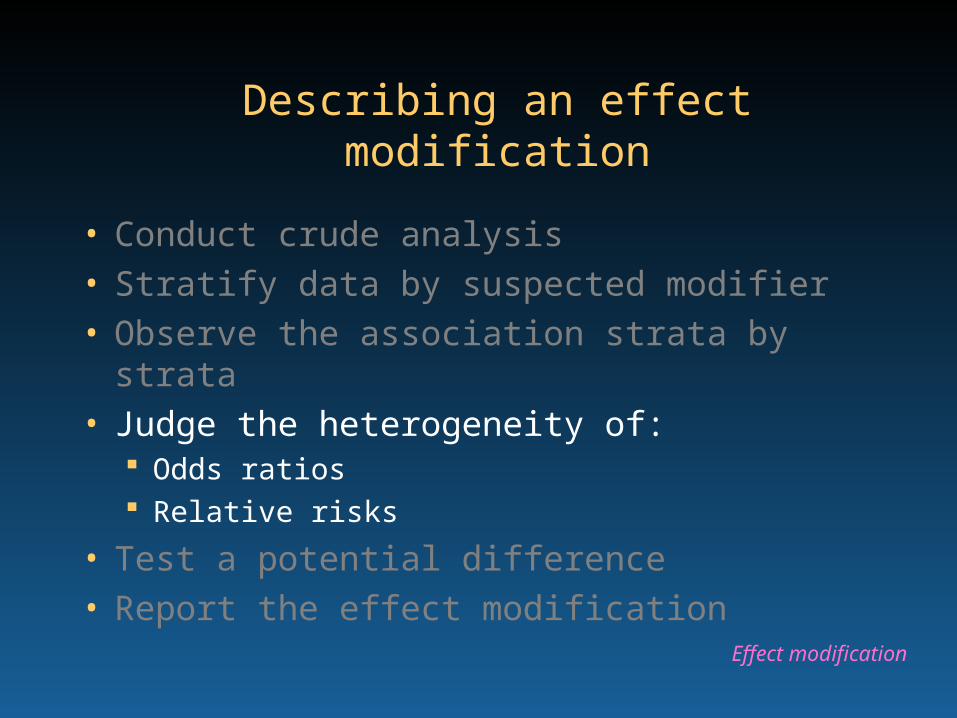
Describing an effect modification
• Conduct crude analysis• Stratify data by suspected modifier• Observe the association strata by strata• Judge the heterogeneity of:
Odds ratios Relative risks
• Test a potential difference• Report the effect modification
Effect modification

Describing an effect modification
• Conduct crude analysis• Stratify data by suspected modifier• Observe the association strata by strata• Judge the heterogeneity of:
Odds ratios Relative risks
• Test a potential difference• Report the effect modification
Effect modification
Describing an effect modification
• Conduct crude analysis• Stratify data by suspected modifier• Observe the association strata by strata• Judge the heterogeneity of:
Odds ratios Relative risks
• Test a potential difference• Report the effect modification
Effect modification

Diarrhoea Controls Total
No breastfeeding 120 136 256
Breastfeeding 50 204 254
Total 170 340 510
Death from diarrhoea according to breast- feeding, Brazil, 1980s
(Crude analysis)
Odds ratio: 3.6; 95% CI: 2.4- 5.5; p < 0.0001
Effect modification
Describing an effect modification
• Conduct crude analysis• Stratify data by suspected modifier• Observe the association strata by strata• Judge the heterogeneity of:
Odds ratios Relative risks
• Test a potential difference• Report the effect modification
Effect modification
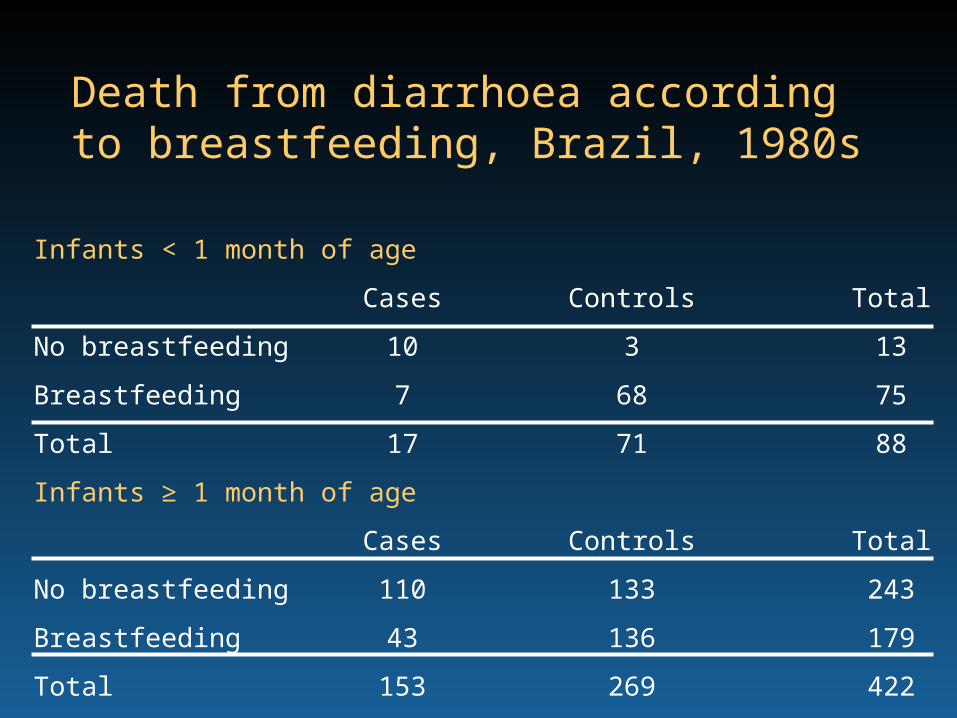
Infants < 1 month of age
Cases Controls Total
No breastfeeding 10 3 13
Breastfeeding 7 68 75
Total 17 71 88
Infants ≥ 1 month of age
Cases Controls Total
No breastfeeding 110 133 243
Breastfeeding 43 136 179
Total 153 269 422
Death from diarrhoea according to breastfeeding, Brazil, 1980s

Describing an effect modification
• Conduct crude analysis• Stratify data by suspected modifier• Observe the association strata by strata• Judge the heterogeneity of:
Odds ratios Relative risks
• Test a potential difference• Report the effect modification
Effect modification

Cases Controls Total
No breastfeeding 10 3 13
Breastfeeding 7 68 75
Total 17 71 88
Death from diarrhoea according to breast feeding, Brazil, 1980s:
Analysis among infants < 1 month of age
Odds ratio: 32.4; 95% CI: 6- 203; p < 0.0001
Effect modification

Cases Controls Total
No breastfeeding 110 133 243
Breastfeeding 43 136 179
Total 153 269 422
Death from diarrhoea according to breast feeding, Brazil, 1980s:
Analysis among infants ≥ 1 month of age
Odds ratio: 2.6; 95% CI: 1.7- 4.1; p < 0.0001
Effect modification
Describing an effect modification
• Conduct crude analysis• Stratify data by suspected modifier• Observe the association strata by strata• Judge the heterogeneity of:
Odds ratios Relative risks
• Test a potential difference• Report the effect modification
Effect modification

Judge the heterogeneity of the measures of association
• To be a difference, a difference should make a difference Review public health implications
• Odds ratios in the specific example: Strata 1: OR = 32; 95% CI: 6.0- 200 Strata 2: OR = 2.6; 95% CI: 1.7- 4.1
Effect modification

Describing an effect modification
• Conduct crude analysis• Stratify data by suspected modifier• Observe the association strata by strata• Judge the heterogeneity of:
Odds ratios Relative risks
• Test a potential difference• Report the effect modification
Effect modification

Woolf’s test for heterogeneity of the odds ratios
• Statistical testing of the heterogeneity of the odds ratios
• Lacks statistical power• Calculation:
In statistical textbooks In the software’s analysis output
• Judgement is important
Effect modification

Handling heterogeneous measures of association
Eff ect modifi cat ion
ORs / RRs 95% C. I.do not overlap
Eff ect modifi cat ion
Wool f 's test signifi cant
Discuss lack of powerof Wol lf 's test
Eff ect modifi cat ionunl ikely
Wool f 's test not signifi cant
Use Wool f 's test
ORs / RRs C. I.do overlap
ORs / RRs arediff erent across st rata

Describing an effect modification
• Conduct crude analysis• Stratify data by suspected modifier• Observe the association strata by strata• Judge the heterogeneity of:
Odds ratios Relative risks
• Test a potential difference• Report the effect modification
Effect modification

Conclusion of the Brazilian case-control study on breastfeeding
and death from diarrhoea • The protective efficacy of breastfeeding
is more marked among infants under the age of one month
• This may correspond to a biological phenomenon that must be reported as part of the results
Effect modification

Reporting results in the presence of an effect modification
• Once the effect modification was detected the study population is split
• Results for the risk factor considered are reported stratum by stratum
Effect modification
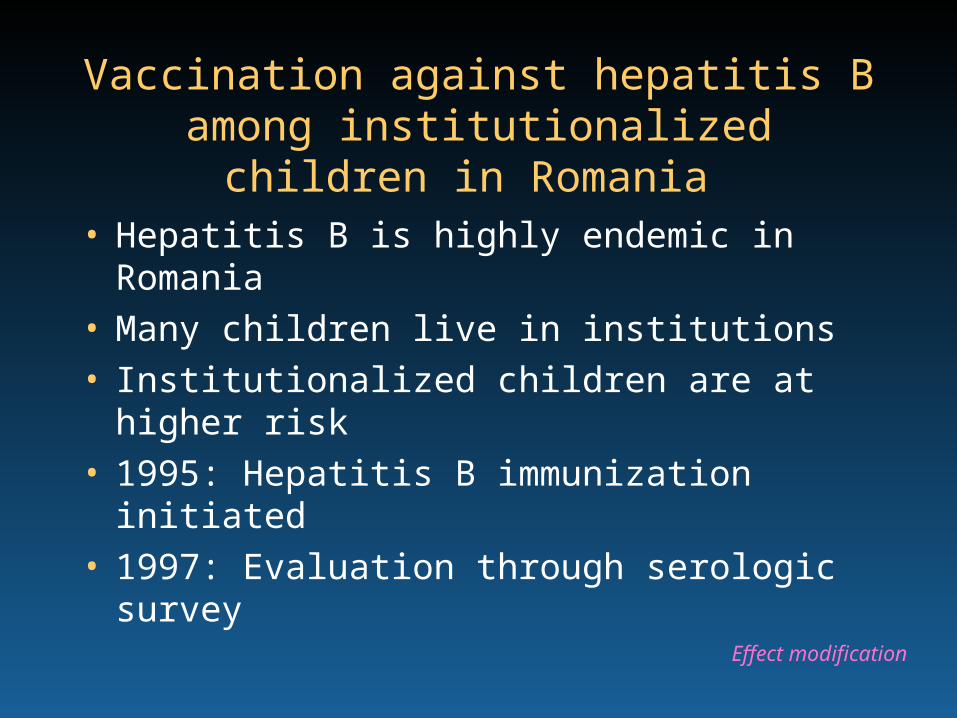
Vaccination against hepatitis B among institutionalized children in
Romania • Hepatitis B is highly endemic in
Romania• Many children live in institutions• Institutionalized children are at higher
risk• 1995: Hepatitis B immunization initiated• 1997: Evaluation through serologic
survey
Effect modification

Hepatitis B vaccine efficacy among institutionalized children over 6 months of age *, Romania, 1997
Anti-HBc (+) Anti-HBc (-) RR 95% C.I.
3 doses 15 383 0.48 0.17-1.4
< 3 doses 4 47 Ref.
* Born after implementation of routine vaccination
Vaccine efficacy, 52%, 95% CI 0-83%
HBVVaccine
Effect modification

Hepatitis B vaccine efficacy among institutionalized children over 6
months of age *, by district, Romania, 1997
Anti-HBc (+) Anti-HBc (-) RR 95% C.I.3 doses 12 61 2.0 0.28-14< 3 doses 1 11 Ref.
3 doses 3 322 0.12 0.0-0.6< 3 doses 3 36 Ref.
Wolf test for evaluation of interaction: p = 0.03
* Born after implementation of routine vaccination
Dis
tric
t X
Oth
ers
Effect modification

Hepatitis B vaccine efficacy among Romanian children in institutions:
Conclusions• The protective efficacy of hepatitis B
vaccine appears low overall• This overall low efficacy does not
correspond to a biological phenomenon• In fact, the efficacy is:
Normal in most districts (88%) Low in district X
• This points towards programme errors that must be identified and prevented
Effect modification

Describing an effect modification:Summary
• The analysis plan: Anticipates effect modifiers to collect data
• The analysis: Looks for effect modification to test it
• The report: Breaks down the population in strata to
report the effect modification
Effect modification

Key elements
• Describing an effect modification• Eliminating a confounding factor
Confounding factor

What may explain an association between a risk factor and an
outcome?? Chance? Bias? Third factor? Causal association
Confounding factor

What may explain an association between a risk factor and an
outcome?? Chance? Bias? Third factor? Causal association
Confounding factor

Exposure
Characteristics of a third, confounding factor
• Associated with the exposure Without being a consequence of exposure
• Associated with the outcome Independently from the exposure
Outcome
Confounding factor
Confounding factor

The nuisance introduced by confounding factors
• May simulate an association • May hide an association that does exist• May alter the strength of the association
Increased Decreased
Confounding factor

Outcome
Example of confounding factor
Exposure 1Apparent association
Confounding factor
Confounding factor

Pneumonia
Example of confounding factor (1)
EthnicityApparent association
Crowding
Confounding factor

Pneumonia
Example of confounding factor (2)
CrowdingAltered strength of
association
Malnutrition
Confounding factor

Eliminating confounding in the pneumonia example
• Estimate the strength of the association between malnutrition and pneumonia
• Estimate the strength of the association between crowding and pneumonia Adjusted for the effect of malnutrition
• Eliminate the confounding effect of crowding on the false association between ethnicity and pneumonia
Confounding factor
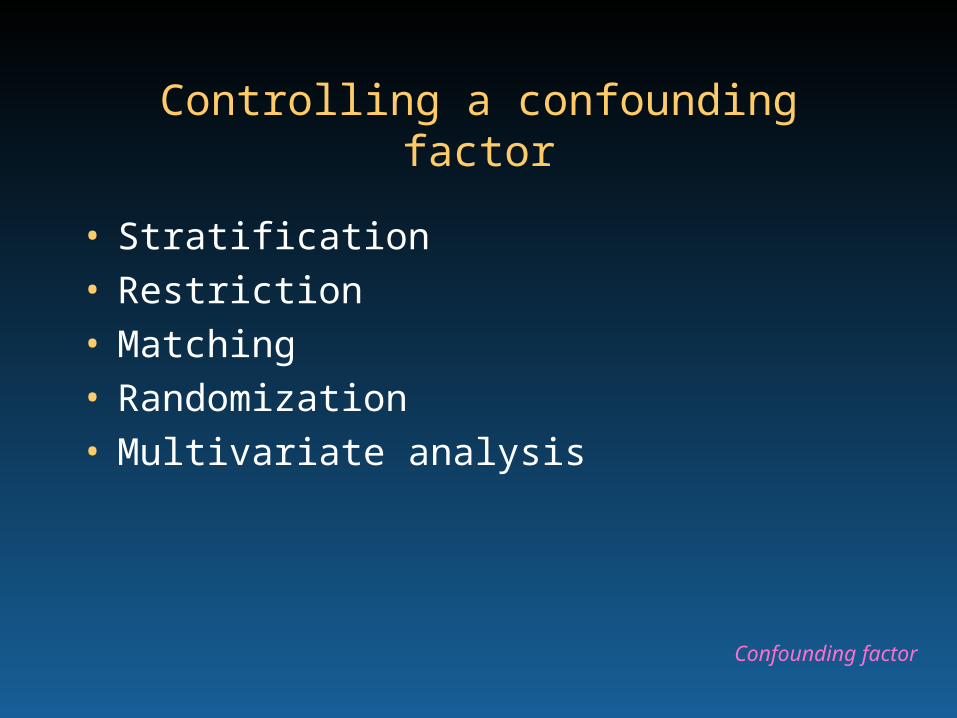
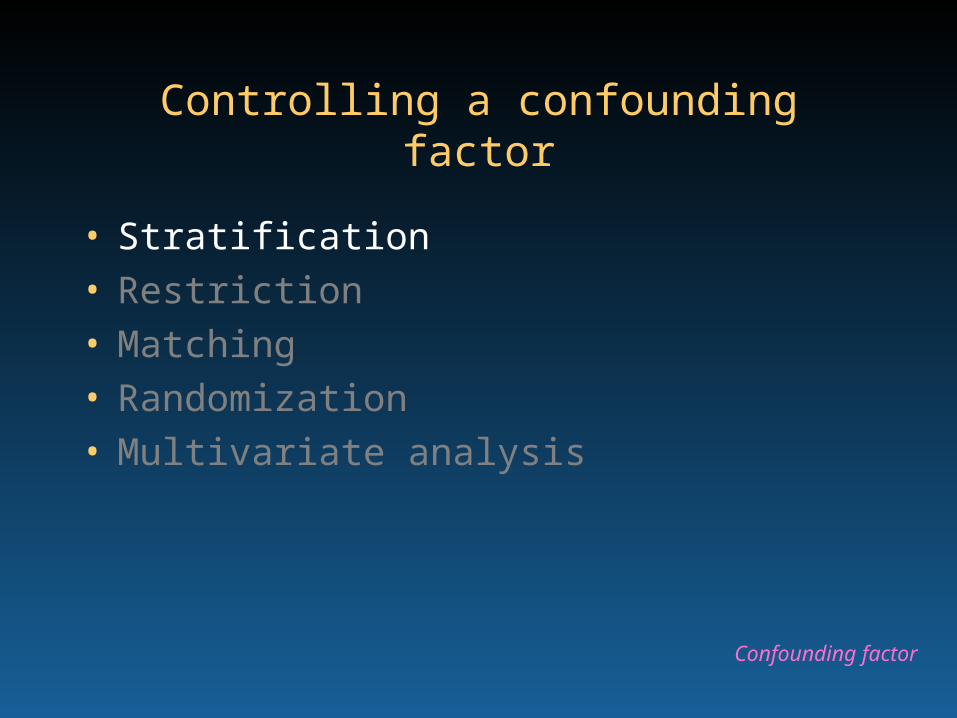
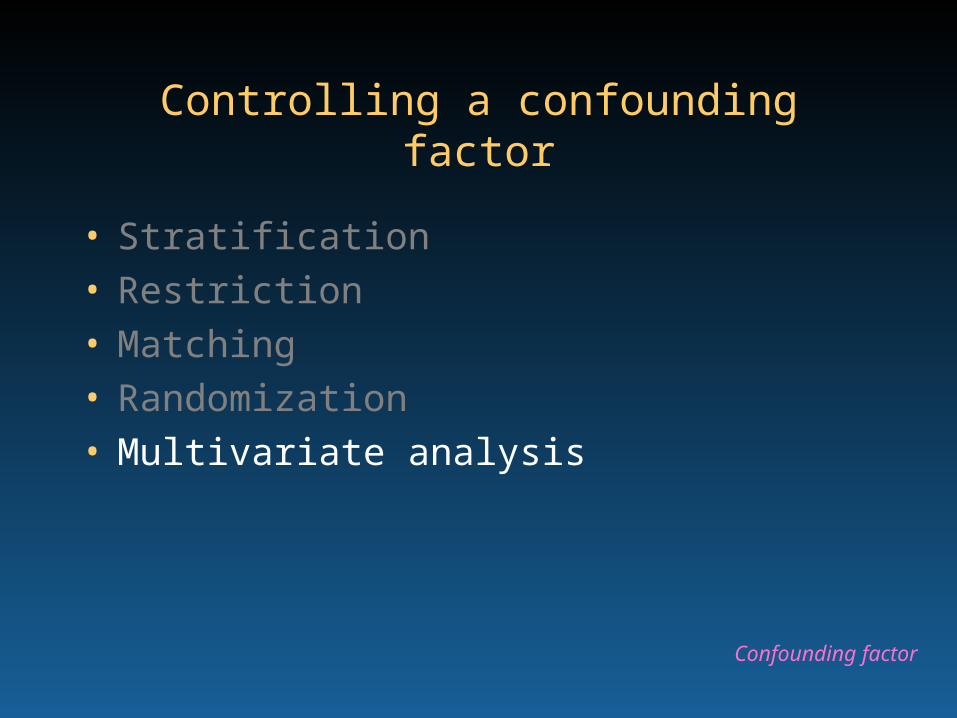
Controlling a confounding factor
• Stratification• Restriction• Matching • Randomization • Multivariate analysis
Confounding factor
Controlling a confounding factor
• Stratification• Restriction• Matching • Randomization • Multivariate analysis
Confounding factor
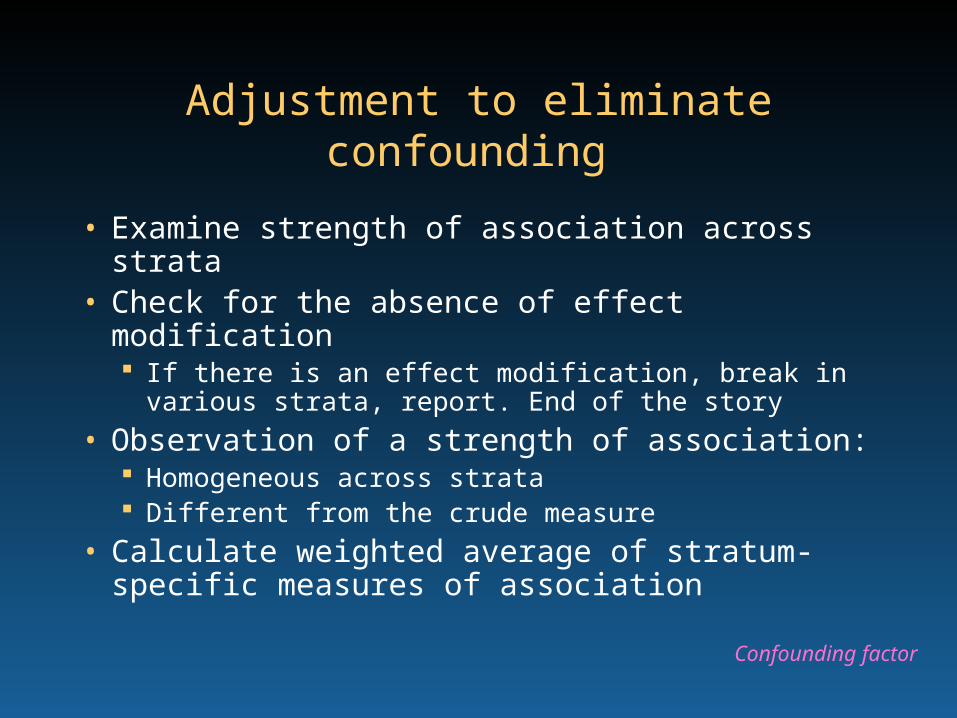
Adjustment to eliminate confounding
• Examine strength of association across strata
• Check for the absence of effect modification If there is an effect modification, break in
various strata, report. End of the story• Observation of a strength of association:
Homogeneous across strata Different from the crude measure
• Calculate weighted average of stratum-specific measures of association
Confounding factor
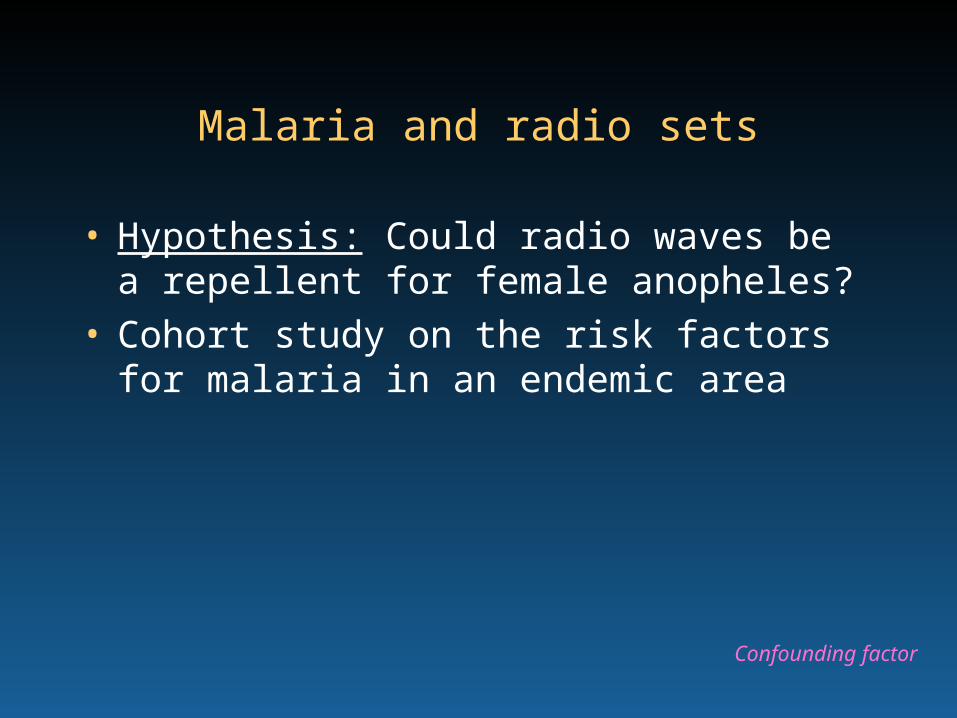
Malaria and radio sets
• Hypothesis: Could radio waves be a repellent for female anopheles?
• Cohort study on the risk factors for malaria in an endemic area
Confounding factor
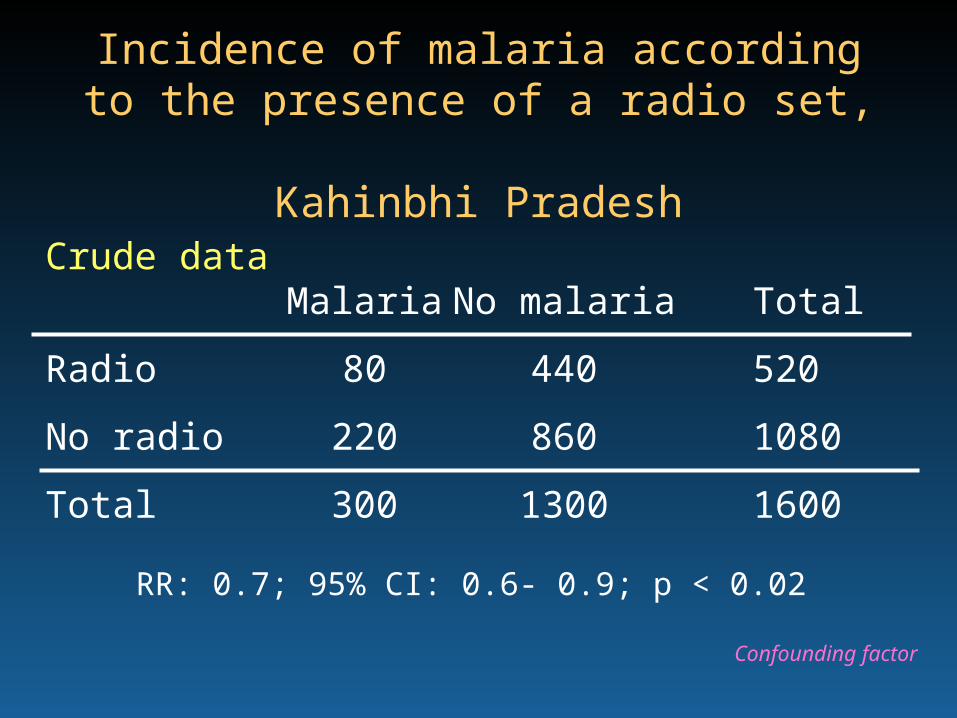
Incidence of malaria according to the presence of a radio set,
Kahinbhi Pradesh
Crude dataMalaria No malaria Total
Radio 80 440 520
No radio 220 860 1080
Total 300 1300 1600
RR: 0.7; 95% CI: 0.6- 0.9; p < 0.02
Confounding factor

Incidence of malaria according to the presence of a radio set,
Kahinbhi Pradesh
Strata 1: Sleeping under a mosquito netMalaria No malaria Total
Radio 30 370 400
No radio 50 630 680
Total 80 1000 1080
RR: 1.02; 95% CI: 0.7- 1.6; p < 0.97Confounding factor
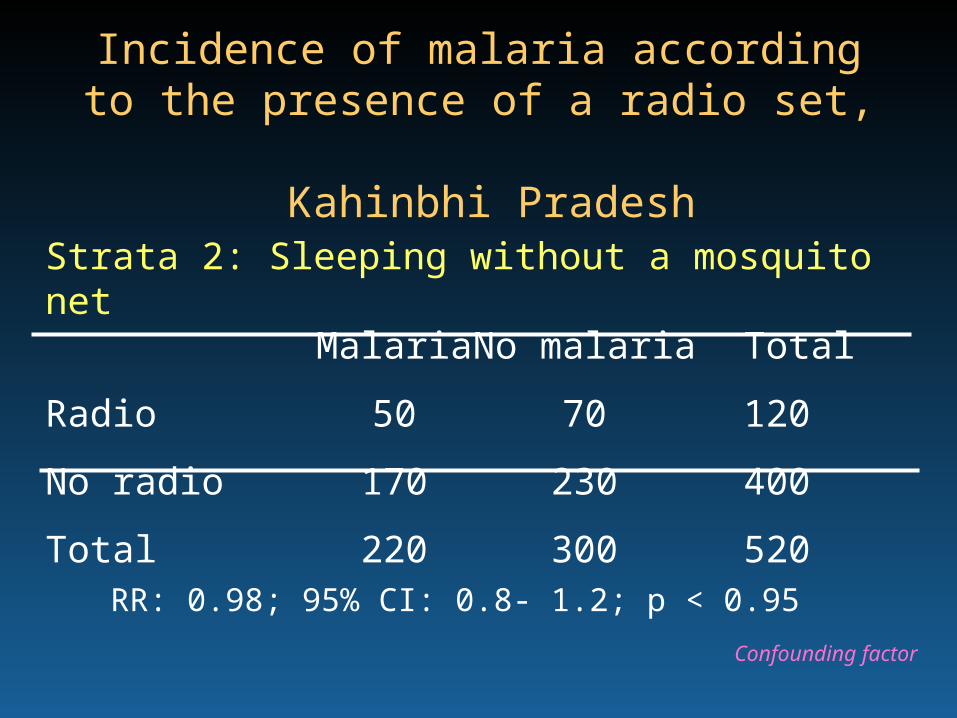
Incidence of malaria according to the presence of a radio set,
Kahinbhi Pradesh
Strata 2: Sleeping without a mosquito net Malaria No malaria Total
Radio 50 70 120
No radio 170 230 400
Total 220 300 520
RR: 0.98; 95% CI: 0.8- 1.2; p < 0.95
Confounding factor

Mantel-Haenszel adjusted relative risk
RR M-H=aixL0i) / Ti]
ci xL1i) / Ti]
Confounding factor

Malaria and radio sets: Conclusion
• No association between radio and malaria within each strata
• The new adjusted relative risk replaces the crude one
MalariaRadio setsApparent association
Mosquito nets
Confounding factor

OR M-H=ai.di) / Ti]
bi.ci) / Ti]
Mantel-Haenszel adjusted odds ratio
Confounding factor

Controlling a confounding factor
• Stratification• Restriction• Matching • Randomization • Multivariate analysis
Confounding factor

Hepatitis B and blood transfusion in Moldova
• Hepatitis B virus infection is highly endemic in Moldova
• Routes of transmission are unknown• A case control study was initiated to
assess potential modes of transmission
Confounding factor

Cases Controls Total
Transfusion 3 1 4
Non-transfusion 69 189 258
Total 72 190 262
Odds ratio: 8.2; 95% CI : 0.8-220
Acute hepatitis B and receiving a transfusion in Moldova, 1994-1995
Confounding factor

Acute hepatitis B and receiving a transfusion in Moldova, 1994-1995 (According to receiving injections)
Case Control Total
Transfusion 3 1 6
No transfusion 22 6 28
Total 25 7 32
Case Control Total
Transfusion 0 0 0
No transfusion 47 183 230
Total 47 183 230
Odds ratio: -
Injections No injections
Odds ratio: 0.8,
95% CI: 0.1-24.9
Confounding factor

Controlling a confounding factor
• Stratification• Restriction• Matching • Randomization • Multivariate analysis
Confounding factor

Matching
• Stratification conducted initially at the stage of the study design of a case control study
• Stratified analysis (matched) necessary
Confounding factor

Controlling a confounding factor
• Stratification• Restriction• Matching • Randomization • Multivariate analysis
Confounding factor

Randomization
• Distribution of exposure of interest at random in the study population for a prospective cohort
• An association between an exposure and a confounding factor will be: Secondary to chance alone Improbable
Confounding factor
Controlling a confounding factor
• Stratification• Restriction• Matching • Randomization • Multivariate analysis
Confounding factor

Multivariate analysis
• Mathematical model• Simultaneous adjustment of all
confounding and risk factors • Can address effect modification
Confounding factor

Taking into account a third factor in practice
1. Think of potential confounding factors 2. Collect accurate data on them 3. Conduct crude analysis4. Stratify5. Look for effect modification
• Are the RR or OR different to each other?
6. If effect modification: • Report• Do not adjust
7. Control confounding factors through adjustment• If applicable
Before the study
During the analysis

Analyzing a third factor
Report ONE crude OR/ RR
Third factor does not play a role
Strata ORs / RRs similar to crude(Crude value fal ls between strata)
El iminate the confoudingReport ONE adj usted OR / RR
Adj ust using theM-H technique
Confounding factor
Strata ORs / RRs diff erent f rom crude(Crude value does not fal l between strata)
Ident ical ORs / RRs across strata
Report MULT IPLE ORs / RRs for each stratum
Stop the analysis.DO NOT adj ust!
Eff ect modifi cat ion
Diff erent ORs / RRs across strata
Examine ORs / RRs in each st ratum
Examine crude OR / RR

Take-home messages
• Describe effect modifications The analysis must TEST for their
occurrences
• Control confounding factors The analysis must ELIMINATE their influence