Civil types of foundations for different soil characteristics (2) - copy

В Е С Т Н И К П Н И П У
2014 Строительство и архитектура № 3
9
S. Varaksin1, B. Hamidi
2, J. Racinais
3
1Chairman, ISSMGE TC211,
2Curtin University,
3Menard
THE THIN LINE BETWEEN DEEP FOUNDATIONS
AND SOIL IMPROVEMENT ABSTRACT
Deep foundations have been the historical and conventional solution to support heavy loads in
poor capacity soils; however during the past decades ground improvement has successfully been able
to provide competitive and economical technical foundation solutions by increasing the ground mechan-
ical properties, and thereby increasing bearing capacity, and reducing total, differential, and creep set-
tlements. More recent ground improvement techniques, such as Controlled Modulus Columns (CMC),
that are based on the concept of introducing cementitious columnar inclusions into soft grounds are
often confused with in-situ piling methods. This paper will discuss the concept of CMC, its design phi-
losophy, the way it behaves and a case study will be presented to demonstrate its application.
Keywords: Controlled Modulus Columns, CMC, ground improvement, rigid inclusion, arching,
Eurocode, ASIRI
Introduction
Historically, deep foundations have been designed and constructed to
support heavy loads in poor and unfavorable ground conditions. The main
purpose of these foundations is to transfer the full load of the structure
through pile caps, structural slabs, or grade beams to competent subsoil by
“bridging” the compressible soft soils.
The notion of soil improvement has been subject to relatively rapid
developments in the last half century. More recently, Chu et al. [1] have cat-
egorized and described the various ground improvement techniques in the
State of the Art report of ISSMGE TC211 that was published at the 17th
In-
ternational Conference of Soil Mechanics and Geotechnical Engineering in
2009. Category C of Table 1 refers to ground improvement techniques with
admixtures or inclusions. In these methods, columnar inclusions are in-
stalled in the ground, and the loads are distributed between the in-situ soft
soil and inclusions through a superficial transition layer or load transfer plat-
form (LTP) by arching [2]. Thus, as load concentration is reduced the super-
structure does not have to connect to the inclusions by structural elements,
and the LTP will efficiently suffice. Each technique in this category has its
benefits and limitations, for example dynamic replacement is a very cost
effective ground improvement technique, but is applicable to treatment of
soft ground to depths of approximately 5 m, and stone columns can be in-
stalled to greater depths, but may bulge due to insufficient peripheral in-situ
soil restraining [3].

S. Varaksin, B. Hamidi, J. Racinais
10
One of the ground improvement techniques in Category C that was
developed by Menard in 1994 [1], and is being implemented in more and
more projects throughout the world is called Controlled Modulus Columns,
which is frequently abbreviated to CMC. This technology is composed of
rigid cementitious columnar inclusions that are not bound by very soft
ground conditions that cannot provide lateral constraint. Due to the installa-
tion equipment, the appearances of the columns, which resemble unrein-
forced piles, and their superior ability in limiting settlements compared to
other ground improvement techniques with inclusions, such as stone col-
umns, CMC are frequently and erroneously referred to as piles, but their
concept, design and behavior distinguishes them from piles.
Controlled Modulus Columns
CMC are installed in soft ground using a specially designed auger
that, as shown in Fig. 1, is composed of a penetrating helical tip and a pseu-
do-cylindrical hollow stem follow-up section. As the auger penetrates the
soil by screwing, the pseudo-cylindrical section displaces the soil laterally,
and reduces the amount of spoil that is generated by this technology to neg-
ligible amounts compared to cast in-situ piling solutions such as CFA or
bored piles. During the auger extraction process, grout is pumped through
the hollow auger to form a columnar inclusion with a diameter that is usual-
ly 250 to 450 mm.
Fig. 1. CMC auger
Unlike stone columns whose stability relies on the horizontal con-
tainment of the soil or deep soil mixing where column strength is dependent
on the in-situ soil properties, CMC do not rely on external parameters for
lateral stability nor is their strength affected by the surrounding soil. In fact
column strength can be fully controlled simply by varying the strength of
the grout. Thus, this method can reduce settlements more efficiently com-
pared to other techniques in which inclusions are installed in the soil.
As the deformation modulus of CMC are typically 50 to 3,000 times
that of the weakest soil stratum [4] it is possible to greatly reduce ground

The thin line between deep foundations and soil improvement abstract
11
settlements using a lower replacement ratio (which is the ratio of an inclu-
sion area to total unit cell area [5, 6]) when comparing with inclusions are
composed of granular material.
The amount of vibration that is generated by CMC installation is
comparable with CFA piling as the installation process itself is vibration
free, and measured vibrations originate from the base machine. This charac-
teristic can make CMC the preferred choice over other Category C ground
improvement techniques such as dynamic replacement in which granular
inclusions are dynamically driven into the ground by dropping a heavy
pounder from considerable height or stone columns in which granular inclu-
sions are formed by water jetting and vibrating a vibroflot.
The CMC rig should be able to provide a continuous down pull with a
high torque in rotation. The torque is typically in the range of 20 tm, contin-
uous pull down is in the range of 20 t, and rotation speed is in the order of
15 rpm. Further enhancements to the equipment can include a radio control
unit to allow the rig operator to directly command the concrete pump from
his control panel. The control panel displays torque, speed, depth, down pull
force, grout pressure and volume of pumped grout. Fig. 2 shows the installa-
tion of CMCs in two projects in France.
Fig. 2. Installation of CMC columns in two projects in France

S. Varaksin, B. Hamidi, J. Racinais
12
The main advantages of CMC can thus be summarized as:
CMC strength is independent of the in-situ soil.
With similar replacement ratios, the magnitude of settlement reduc-
tion using CMC is much larger than in ground improvement methods that
use granular material for inclusions.
CMC does not rely on external parameters for lateral stability.
CMC installation process is vibration free, and measured vibrations
solely originate from the rig.
CMC are installed by laterally displacing the soil; hence negligible
volumes of spoil is produced that makes this foundation solution attractive
when work is carried out in contaminated sites or when spoil removal is ex-
pensive.
CMC installation rate is very high.
Design and Recent Advances
Combarieu [7] has studied the behavior of rigid inclusions that are in-
stalled in soft ground. As shown in Figure 3, A compressible ground of
thickness H that is subjected to an embankment load with intensity qo will
ultimately settle an amount on the surface that can be denoted by Ws(o).
Likewise the settlement at any depth can be denoted by Ws(z).
Fig. 3. Ground section without rigid inclusion [7]
Combarieu then examined the equilibrium conditions of a single rigid
inclusion after complete stabilization. The soil conditions at distances away
from the single inclusion are identical to untreated ground shown in Fig. 3.
However, the stress and deformations change around the immediate vicinity

The thin line between deep foundations and soil improvement abstract
13
of the inclusion. The Inclusion settles by an amount equal to Wp(z) due to
the loading plus a further small amount due to its own compression (since it
is not infinitely rigid). Obviously, the settlement would be higher for the
case shown in Fig. 4 where the rigid inclusion is resting on soft soil com-
pared to Fig. 5 where the rigid inclusion is resting on hard soil.
Fig. 4. Ground section with rigid inclusion in soft ground [7]
Fig. 5. Ground section with rigid inclusion in hard ground [7]
The top of the inclusion punches through the embankment by an
amount that is equal to Ws(o) – Wp(o). At this level the head of the inclusion
behaves like an anchor plate that is embedded in the thickness of the em-
bankment, and develops traction forces from the surface.
At the lower part of the inclusion where z > hc, the settlement of the
soil is smaller than the inclusion settlement and inclusion compression;
however the opposite is true in the upper part where z < hc. Soil and inclu-
sion settlement are equal at z = hc.

S. Varaksin, B. Hamidi, J. Racinais
14
Ultimately, as shown in Fig. 6, the four forces acting along the inclu-
sion at equilibrium are:
Driving forces: The vertical load Q acts on the head of the inclusion,
akin to an anchor, and the resultant negative friction, Fn, acts along the in-
clusion segment with length hc.
Resisting forces: Positive friction, Fp, is mobilized in lower part of the
inclusion and along a segment with length L - hc, and Qp acts at the base of
the inclusion. The balance of the forces is Q + Fn = Fp + Qp.
Fig. 6. Forces acting on the rigid inclusion [7]
The combined effect of a cementitious columnar inclusion with no rig-
id connection to the structure has been the object of a French nationwide
research program called ASIRI (Améliorations de Sols par Inclusions
RIgides, which translates to Soil Improvement by Rigid Inclusions) [8], in
which the Bridges and Highways Administration, consultants and specialty
contractors have jointly carried out a detailed investigation to understand the
behavior of rigid inclusions that support slabs or embankments. Two major
parts in the ASIRI are dedicated to the behavior of the load transfer platform
and the determination of the limiting pressure at the top of the inclusions
and the design of slab on grades supported by soil that has been reinforced
with rigid inclusions. LTP behavior and limiting pressures at the top of the
inclusions will be reviewed in this paper.
L
Fn
Fp
hc
Qp
Q

The thin line between deep foundations and soil improvement abstract
15
Behavior of the Load Transfer Platform
As shown in Fig. 7, it is assumed that rigid inclusions with diameter
D = 2rp are installed in a square grid of dimension s. LTP thickness is de-
noted by HM and is defined by its characteristics (cohesion c’, friction angle
φ’ and volumetric weight γ). The uniformly distributed external load qo is
applied to the LTP.
Fig. 7. Section showing ground improved by rigid
inclusions, LTP and uniform loading [8]
ASIRI has shown that while the actual equilibrium diagram depends
on the geometry and nature of the loading, as shown in Fig. 8, two failure
mechanisms are possible.
(a) (b)
Fig. 8. (a) Prandtl failure mechanism for slabs on grade, rafts or footings and thick em-
bankments and (b) punching failure for thin embankments [8]

S. Varaksin, B. Hamidi, J. Racinais
16
The Prandtl mechanism [9] occurs when the LTP is covered by a rigid
structural element such as a slab on grade, raft or footings or when the em-
bankment thickness is sufficient to avoid the punching failure mechanism.
HM < 0,7(s – D).
The punching failure mechanism corresponds to the realization of a
shear cone in the LTP’s surface, for example in the case of a thin road em-
bankment. ASIRI implies that an embankment is considered thin when.
Prandtl’s Failure Mechanism
As shown in Fig. 8, (a), Prandtl’s failure diagram includes a Rankine
active limit state domain (I) above the inclusion head that is delimited by a
logarithmic spiral arc domain (II) and a Rankine passive limit state domain
(III) that is located beyond the inclusion head. In this figure qp+ is the stress
at the inclusion head and qs+ is the stress on the in-situ soil.
ASIRI has been developed in line with Eurocode. The maximum load
that can be applied to the inclusion head qp+ is therefore calculated in ULS
(Ultimate Limit State) condition. This verification is performed by imple-
menting Eurocode 7 [10] Design Approach 2 with the combination of partial
factors being A1 + M1 + R2 (A for Action, M for Material and R for Re-
sistance), which means that load factors on dead and live loads are respec-
tively 1.35 and 1.50 and that no partial factor is applied to the materials. Ac-
cording the Prandtl’s diagram, qp+ can be determined from the stress applied
on the supporting soil and the intrinsic parameters of the LTP:
,'
'
p
c
ccsqqр rNsc
NsqNsq (1)
Nq, Nc and N are coefficients that are a function of the friction angle of the
LTP, and can be calculated from Eq to Eq.
,
2
/'
4tan '/'tan'2
eNq (2)
,'
cot)1('
qc NN (3)
,'
tan)1(2'
qNN (4)

The thin line between deep foundations and soil improvement abstract
17
c’, ’, and are the material partial factors and equal to 1.
The LTP’s weight is typically neglected for a relatively thin platform,
and the superficial (third) term in Eq is omitted.
For purely granular LTP, cohesion is zero, and the related term be-
comes null. Hence, Eq is becomes:
, sqqр qNsq (5)
For axisymmetric or plane-strain conditions, sq = 1, and a relationship
is established in the form of Equation 6 between qp and qs that is only
a function of φ’.
, sqр qNq (6)
Solving the problem and determining the values of qp and qs requires a
second equation. Using load conservation:
,)1( 0qqq sр (7)
= replacement ratio [5, 6].
,sc
c
AA
A
(8)
Ac= area of inclusion; As= area of soil; From Equations 6 and 7 will yield:
,)1(1 0
q
N
Nq
q
q
p (9)
.)1(1
10
q
Nq
q
s (10)
Research on the Prandtl’s failure mechanism has been further carried
out by centrifugal testing with various LTP thicknesses, rigid inclusion
spacing and replacement ratios within the ASIRI program. Centrifuge test
results are compared with limiting pressures calculated from Prandtl’s theo-
ry in Figure 5. Plotted points would fall on the bisecting line if there is a
perfect agreement between measurements and theory. Using the friction an-
gle at critical state, i.e. the red points in Figure 5), it can be observed that
there is indeed a very close agreement.
The Prandtl approach was also investigated by performing finite ele-
ment calculations for various uniformly distributed loads. In Fig. 10 the

S. Varaksin, B. Hamidi, J. Racinais
18
pressure acting on the soil and the pressure on the inclusion head are respec-
tively shown on the abscissa and ordinate. The blue curve shows Eq, the
slanted black lines correspond to Eq, and the pink line is derived from finite
element calculations. This figure also presents the graphical solution of de-
termining the stresses on the soil and inclusion head by intersecting Eq and
Eq and the value that can be mobilized at the head of the inclusion.
Fig. 9. Comparison of measured limiting pressures with theoretical
values calculated from Prandtl’s theory [8]
Fig. 10. Comparison of limiting pressures calculated from finite element
analyses and Prandtl’s theory [8]

The thin line between deep foundations and soil improvement abstract
19
During the investigation, using the same principle as moving the mobile
bottom plate of centrifuge test, the Young modulus of the compressive soil was
reduced for each uniform loading until the LTP failed. It was observed that at
the last step prior to failure the stress at the inclusion head approached Prandtl
limit but did not intersect it. Prandtl’s failure mechanism can also be visualized
by the distribution of the plastic points shown as red dots Fig. 10.
Punching Shear Failure Mechanism
As shown in Fig. 8(b) the second failure mechanism can be modeled
by the realization of a vertical cone within the LTP layer. This mechanism
exists only for thin LTP that are not covered by rigid structural elements,
and is associated with the peak friction angle of the material.
According to Eurocode 7 Design Approach 2 and from the shear cone
geometry, the limit stress at the inclusion head is determined using the ap-
plied external load, qo, the LTP’s thickness, and the platform parameters.
In Fig. 11 and Fig. 12:
,'
tan'
Mpс HRR (11)
.
s
R (12)
As before c’, ’, and are the material partial factors and equal to 1.
If, as shown in Fig. 11, the shear cones do not overlap; i.e. if HM < Hc, where:
.'tan
p
с
rRH (13)
Fig. 11. Non-overlapping failure cones [8]

S. Varaksin, B. Hamidi, J. Racinais
20
Then qp+= weight of the cone plus the external load applied on the top
circular side of the cone. Thus:
.'
1'tan
11
3 '
2
2
2
2
2
2
cp
c
p
c
p
c
p
cMр
c
r
Rq
r
R
r
R
r
RHq
(14)
If, as shown in Fig. 12, the shear cones overlap; i.e.
If HM > Hc, where:
,'tan
rRH c
с (15)
and Rc = R, then qp+ = weight of the cone, weight of the soil cylinder above
it and the external load multiplied by the unit cell area. As before, partial
factors from Eurocode 7 are included in these relations.
.'
1'tan
1
)(13
'
2
2
02
2
2
2
2
2
cp
pp
cM
p
c
p
cMр
c
r
R
qr
R
r
RHH
r
R
r
RHq
(16)
Fig. 12. Overlapping failure cones [8]

The thin line between deep foundations and soil improvement abstract
21
ULS Stress Domain
When failure is by Prandtl’s mechanism, regardless of the load level,
the stress domain in the LTP is firstly limited by the Prandtl line, which was
presented in Eq. The stress on the in-situ soil, qs+, is limited at ULS by the
allowable stress v;d, which can be determined with the appropriate partial
factors from PLM, the limit pressure of Menard pressuremeter test. Also, qp+
is limited by the load-bearing capacity of the inclusion as well as by the al-
lowable stress in the inclusion material. The first limitation is the load bear-
ing capacity as per Eurocode 7 and the second limitation, fcd, is the allowa-
ble stress in the material as per Eurocode 2 [12]. The stress domain is graph-
ically presented in Fig. 13.
,;375,1375,1
min
;min
2
2
,,
max
cd
c
sb
cd
c
dRssdRbb
p
fR
RR
fR
RRq
(17)
.68,12,14,1,;
;
LMpLMp
dRvR
LMp
dv
PkPkPk
(18)
Fig. 13. ULS stress domain [8]
When the LTP is not covered by a rigid structural element, this do-
main may be partially limited. For example, as shown in Fig. 14 in the
case of a thin LTP without rigid structural elements in which the failure

S. Varaksin, B. Hamidi, J. Racinais
22
cones do not overlap, the stress domain is further limited by the dashed
blue line that corresponds to Eq. As a second example that is shown in,
further limitations that are shown as dashed red lines (Eq) are applied
when the failure cones overlap, 15.
Fig. 14. ULS stress domain when LTP is thin, without rigid structural
elements and with non-overlapping failure cones [8]
Fig. 15. ULS stress domain when LTP is thin, without a rigid structural element,
and failure cones overlap [8]
The thin line between deep foundations and soil improvement abstract
23
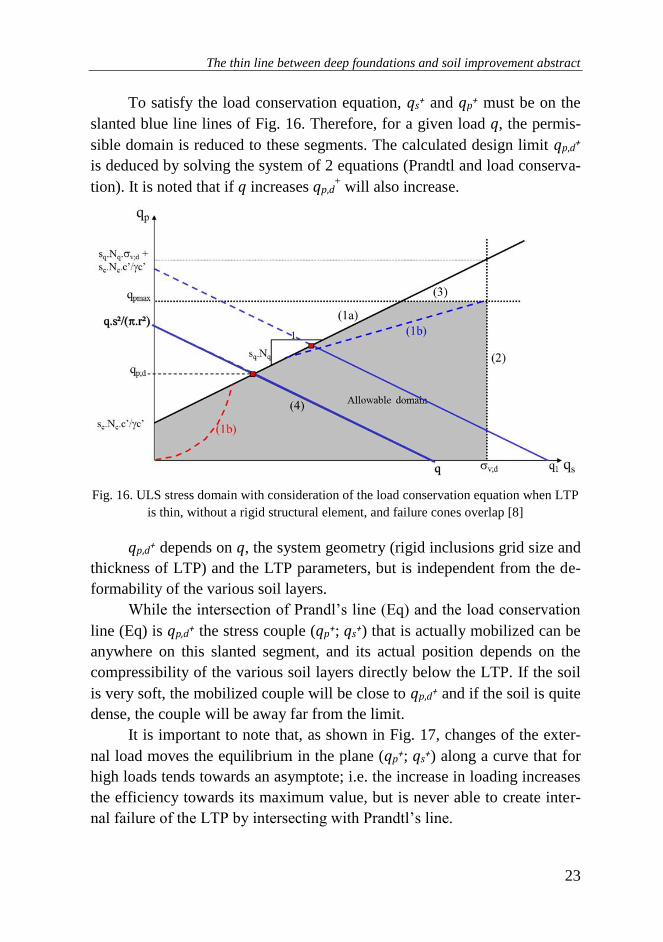
To satisfy the load conservation equation, qs+ and qp+ must be on the
slanted blue line lines of Fig. 16. Therefore, for a given load q, the permis-
sible domain is reduced to these segments. The calculated design limit qp,d+
is deduced by solving the system of 2 equations (Prandtl and load conserva-
tion). It is noted that if q increases qp,d+ will also increase.
Fig. 16. ULS stress domain with consideration of the load conservation equation when LTP
is thin, without a rigid structural element, and failure cones overlap [8]
qp,d+ depends on q, the system geometry (rigid inclusions grid size and
thickness of LTP) and the LTP parameters, but is independent from the de-
formability of the various soil layers.
While the intersection of Prandl’s line (Eq) and the load conservation
line (Eq) is qp,d+ the stress couple (qp+; qs+) that is actually mobilized can be
anywhere on this slanted segment, and its actual position depends on the
compressibility of the various soil layers directly below the LTP. If the soil
is very soft, the mobilized couple will be close to qp,d+ and if the soil is quite
dense, the couple will be away far from the limit.
It is important to note that, as shown in Fig. 17, changes of the exter-
nal load moves the equilibrium in the plane (qp+; qs+) along a curve that for
high loads tends towards an asymptote; i.e. the increase in loading increases
the efficiency towards its maximum value, but is never able to create inter-
nal failure of the LTP by intersecting with Prandtl’s line.

S. Varaksin, B. Hamidi, J. Racinais
24
Edge Behavior
The focus of the previous sections of this paper was on the general
behavior of the reinforced ground within the loading zone, away from the
loading boundaries and where the Prandtl failure mechanism fully devel-
oped. As shown in Fig. 18. The horizontal length of the Prandtl curve, L, is:
Fig. 17. qp,d+ and deformability of various soil layers [8]
.2'4cos
2'4cos 2)'tan(
DeL (19)
Fig. 18. Fully developed Prandtl spiral [8]

The thin line between deep foundations and soil improvement abstract
25
(a)
(b)
(c)
Fig. 19. Ground section at edge of rigid structural element [8]

S. Varaksin, B. Hamidi, J. Racinais
26
However, the distribution of stresses at the edge of the loading zone is
different. As shown in Fig. 19(a), for cases in which the overhang of the
footing is greater than when L has fully developed to Lmax, and Prandtl’s
mechanism can fully develop in the LTP, the limit pressure at the inclusion
head is as discussed. In the extreme case, shown in Fig. 19(b), the edge of
the inclusion corresponds to the edge of the footing; i.e. overhang is zero,
and the load applied to the footing is nearly fully transmitted on the inclu-
sion head. The vertical stress on the peripheral soil is equal to H, which is
generated from the surrounding ground. ASIRI details the calculation pro-
cess of Nq* with consideration of a LTP that is limited to the footing foot-
print. Nq* is assessed based on the friction angle at critical state of both the
LTP (with φ1) and the surrounding soil (with φ2). Nq* values based on LTP
and surrounding soil friction angles are shown in.
As graphically shown in Fig. 20, when the footing overhang is between 0
and Lmax (refer to Fig. 19 (c)), the limiting pressure at the inclusion head can be
estimated using a linear interpolation between these two extreme values.
Fig. 20. Ground section at edge of rigid structural element [8]
Fig. 21. Edge effect combination, modified from ASIRI [8]

The thin line between deep foundations and soil improvement abstract
27
In the general case when more than one inclusion is installed beneath
the footing, the edge effect that has been described is applicable to only
a fraction of the inclusion depending on whether the inclusion is located at
a corner or side of the footing (see Fig. 21).
Single row inclusion (see Fig. 22):
The edge limit stress, qp+(L), is applicable only to the exterior portion
of the perimeter whereas the limit stress calculated from Prandtl’s failure
mechanism, qp+(P), applies to the interior portion of the inclusion. Hence,
the resulting value must be a weighted average of these two terms.
By analogy with the distribution of negative friction within a group of
piles, ASIRI proposes the following weighting relationships to determine
the limit stress values on the inclusion head at different locations of the in-
clusions under the footing.
Nq* values based on LTP and surrounding soil friction angles
LTP 1 Nq* (1) Soil 2= 15
o Soil φ2= 20
o Soil φ2= 25
o Soil φ2= 30
o
Nq* Nq* Nq* Nq*
30 18.4 6.98 9.45 13.08 18.43
33 26.1 7.86 10.64 14.71 20.88
35 33.3 8.52 11.53 16.01 22.67
38 48.9 9.68 13.05 18.11 25.80
40 64.2 10.54 14.29 19.71 28.04
,3
2)(
3
1,
LqPqq ppap (20)
.3
2)(
3
2,
LqPqq ppbp (21)
Fig. 22. Edge effect combination for single row of inclusions [8]
Multiple rows of inclusion (see Fig. 23):
),(, Pqq pip (22)

S. Varaksin, B. Hamidi, J. Racinais
28
),(12
5)(
12
7, LqPqq ppap
(23)
).(6
1)(
6
5, LqPqq ppbp
(24)
Fig. 23. Edge effect combination for multiple rows of inclusions [8]
It is to be noted that, as applicable to any geotechnical calculation, the
accuracy of calculations is dependent on the value of the involved parame-
ters, and inaccurate, scattered or unrepresentative values that may be chosen
for cohesion, friction angle, unit weight, etc. will impact the results. Field
tests that are carried out on site for verification of the results do not measure
any of the parameters that have been described and the required values can
only be estimated by correlation; therefore it may be beneficial to develop
design procedures that are based directly on measured parameters such as
the pressuremeter limit pressure and deformation modulus.
Case Study: Oil Tanks on the Banks of the Mississippi River
As part of the development program of an oil terminal located on the
banks of the Mississippi River in New Orleans five steel tanks, each 12.8 m
high are being constructed [13] Three tanks have diameters of 39.6 m and
the other two tanks’ diameters are 45.7 m. The tanks will exert a maximum
pressure of 130 kPa to the ground, and elevating the ground level to tank
level will impose an additional 16 kPa of pressure.
Below a superficial fill layer of approximately 0.15 to 1.2 m soft to
medium stiff silty clays with some trace of organic matter and localized
sand pockets extend down to a depth of 4 to 6 m. This layer is followed by
very soft clay with silt and sand which reach depths of 20 to 24 m. A thin
sand layer has also been identified at an approximate depth of 21 m. Medi-
um stiff to stiff clay with fine sand pockets and shell fragments are observed
to depths of up to 32 m followed by stiff to very stiff silty to sandy clays

The thin line between deep foundations and soil improvement abstract
29
over a very dense layer of silty sands at depth of about 34 m. Groundwater
level is quite high and at less than 1 m below ground level.
Project specification stipulated that the tanks’ maximum and central
settlements be limited to respectively 200 and 100 mm and additionally 50%
of settlements allowed by American Petroleum Institute [14] three years af-
ter hydrotesting. However these criteria could not be satisfied due to the
poor ground conditions and consequently a ground improvement contract
was awarded to a specialist geotechnical contractor.
As the soil investigation indicated a reduction in compressibility at the
depth of about 21 m at the level of the thin sand layer it was decided to in-
stall CMC with a higher replacement ratio down to the depth of the sand
layer and a with a reduced replacement ratio down to the maximum treat-
ment depth at about 34 m.
Due to the variations in the soil profile it was necessary to design each
tank individually. Analyses included three dimensional digital modeling of a
quarter of a tank, three dimensional modeling of a thin slice of the tank and
manual calculations of rafts on floating piles.
CMC diameters for columns installed to approximately 21 m and 34 m
were respectively 318 and 470 mm (see Fig. 24 for installation). Installation
depth was variable for each tank due to variations in the site’s soil profile.
Fig. 24. Installation of 34 m long CMC
To confirm design, a large scale zone load test was carried out on site
on an area of 13.7 by 13.7 m2 loaded to the maximum design load. Vibrating

S. Varaksin, B. Hamidi, J. Racinais
30
wire piezometers, vibrating wire rebar strain gages, multi depth settlement
gages, horizontal extensometer, inclinometers and settlement plates were
used to measure ground behavior for a period of slightly less than three
months. Maximum settlement measured at the top of the load transfer plat-
form was 107 mm for a settlement plate located in between two columns,
and minimum settlement was 64 mm for a settlement plate placed directly
on top of a column at the bottom of the load transfer platform level. Maxi-
mum differential settlement was measured to be 43 mm between a CMC
and the grid centre.
Further numerical modeling was carried out to compare actual meas-
urements with calculated figures. Numerical analysis suggested a maximum
settlement of 97 mm during the trial period which was in good agreement
with actual measurements.
Conclusion
CMC is a modern ground improvement technology with numerous
advantages, which include independence of column strength from in-situ
soil parameters, independence of column lateral stability from in-situ soil
parameters, ability to reduce settlements more than competing alternative
columnar inclusion techniques with the same replacement ratio, vibration-
less penetration auger that also produces negligible amounts of spoil per in-
clusion, and high production rates.
This technology utilizes a load transfer platform to distribute the loads
between the columns and the in-situ ground. Column loads can be deter-
mined by numerous methods. More recently, the French developed a na-
tional research program called ASIRI to analyze ground behavior and load
distribution for grounds improved with columnar inclusions in a variety of
cases. ASIRI methods are based on Mohr-Columb parameters that are not
directly measured by field tests, and it is proposed that further research be
carried out to formulate calculation methods based on field measured pa-
rameters such as the pressuremeter limit pressure and deformation modulus.
References
1. Chu, J., Varaksin, S., Klotz, U. & Mengé, P. State of the Art Report:
Construction Processes. 17th International Conference on Soil Mechanics &
Geotechnical Engineering: TC17 meeting ground improvement, Alexandria,
Egypt, 7 October 2009. p. 130 .

The thin line between deep foundations and soil improvement abstract
31
2. Hamidi, B., Nikraz, H. & Varaksin, S. Arching in Ground
Improvement. Australian Geomechanics Journal, 2009, no. 4 (44), pp. 99-108.
3. Barksdale, R. D. & Bachus, R. C. () Design and Construction of Stone
Columns, 1983, vol. 1, FHWA/RD-83/026. 194 s.
4. Masse F., Pearlman S.L., Taube M.G. Controlled Modulus Columns
for Support of above Ground Storage Tanks. 40th Ohio River Valley Soil
Seminar (ORVSS), 2009, Lexington, Kentucky, November 13.
5. Murayama, S. Vibro-Compozer Method for Clayey Ground (in
Japanese). Mechanization of Construction Work, 1962. no. 150, pp. 10-15.
6. Aboshi H., Ichimoto E., Harada K. The Compozer: A Method to
Improve Characteristics of Soft Clays by Inclusion of Large Diameter Sand
Columns. International Conference on Soil Reinforcement; Reinforced Earth
and Other Techniques, 2, Paris, 1979, 20-22 March, pp. 211–216.
7. Combarieu, O. Amélioration des sols par inclusions rigides verticales.
application à l'édification de remblais sur sols médiocres. Revue Française de
Géotechnique, 1988, no. 44, pp. 57-79.
8. IREX Recommandations pour la conception, le dimensionnement,
l’exécution et le contrôle de l’amélioration des sols de fondation par inclusions
rigides, 2012, ASIRI 384, Presses des Ponts.
9. Prandtl, L. Uber Die Härte Plastischer Körper, Nachrichten von Der
Königlichen Gesellschaft Der Wissenschaften, Gottingen, Math.- Phys. Klasse,
1920, pp74-85.
10. European Standard EN 1997-1: 2004, Eurocode 7: Geotechnical
Design - Part 1: General Rules 171. 2004
11. Okyay, U. S. Etude expérimentale et numérique des transferts de
charge dans un massif renforcé par inclusions rigides. application à des cas de
chargements statiques et dynamiques. Civil and Environmental Engineering.
2010, Lyon, Institut National des Sciences Appliquées de Lyon, 402 s.
12. European Standard BS EN 1992-1-1, Eurocode 2: Design of
Concrete Structures – Part 1-1: General – Common Rules for Building and
Civil Engineering Structures. 2004
13. Buschmeier, B., Masse, F., Swift, S. & Walker, M. Full Scale
Instrumented Load Test for Support of Oil Tanks on Deep Soft Clay Deposits

S. Varaksin, B. Hamidi, J. Racinais
32
in Louisiana Using Controlled Modulus Columns. International Symposium on
Ground Improvement (IS-GI) Brussels, 2012, no. 3, Brussels, 31 May – 1 June,
pp. 359-372.
14. American Petroleum Institute API Standard 653: Tank Inspection,
Repair, Alteration, and Reconstruction, 3rd Edition, 2001, 112 s.
About the authors
Varaksin Serge (Clamart, France) – Vice-Chairman TC211 ISSMGE;
e-mail: [email protected]
Babak Hamidi (Perth, Australia) – Ph.D. in Technical Sciences, candi-
date, M Sc Soil Mechanics, Curtain university; e-mail: [email protected]
Jerome Racinais (France) – M Sc, design office manager Menard
SNC; e-mail: [email protected]
Получено 15.03.2014