The Thermodynamic of Manufacturing Processes Timothy G. Gutowski.
59
The Thermodynamic of Manufacturing Processes Timothy G. Gutowski
-
Upload
kristian-simon -
Category
Documents
-
view
221 -
download
0
Transcript of The Thermodynamic of Manufacturing Processes Timothy G. Gutowski.

The Thermodynamic of Manufacturing Processes
Timothy G. Gutowski

Overview
1. Review of Basics
2. Intro to Exergy (Available Energy)
3. Analysis of Materials Transformation Processes
4. Results for Manufacturing Processes

References
• Thermodynamics Revisited; de Swaan
Arons et al (handout)
• Thermodynamics Analysis of Mfg
Processes; Gutowski et al (on webpage)
• Gyftopoulos and Beretta, Dover 2005

1st Law
• U = internal energy of molecules and atoms
• E = U + K.E. + P.E. = U + ½mv² + mgz• “isolated” systems ∆E=0, or ∆U=0 (v=const, z=const)
• “closed” system ∆U = Qin – Wout
• “open system” can exchange energy and mass

The 1st Law
outin
outin
WQdU
WQU
0dWdQ

Heat Engine
in
outin
in
out
Q
Q
W
TH
TL
Qin
Qout
outinout QQW

Carnot
in
out
in
out
Q
Q
Q
W 1
H
L
T
T 1
H
L
in
out
T
T
Q
Q
),( LH TTfη

“Available Energy”
• Work and Heat are no longer equivalent
• Exergy, “B” is the available energy w.r.t. a reference environment, T0, and P0…
• B(work) = W; B (heat) = Q(1-T0/T)
)1(max
H
Linout T
TQW

2nd law efficiency
)1(H
Lin
out
inputs
outputII
TT
Q
W
B
B

Properties or State Variables
• T = temperature• P = pressure• V = volume• U = internal energy• E = energy• B = exergy• H = enthalpy (H = U + PV)• S = entropy
intensive variables
extensiveand
intensivevariables

State Variables
0dU
0T
dQ 0)( PVUd
1
2
1
2 d

Enthalpy H=U+PV
Here the Work done is W = P(V2 – V1)
The First Law can be written as Q = (U+PV)2 – (U + PV)1
The quantity in parenthesis is Enthalpy H = U + PV
The First Law can be written as Qin = H
Constant Pressure Equilibrium Process

Energy, E and Exergy, B
B1-B2 = E1-E2 reversible process
B1-B2 > E1-E2 irreversible process
E1, B1
E2, B2
Ref: Gyftopoulos and Beretta
Properties for two different statesof the system shown by the boxes.This change may come about due to spontaneous changes or due to heator work interaction, or mass transfer.

Entropy
• They show CR = TR = T0
• Entropy is a Property
• Entropy is a measure of something lost
)(1
121212 BBEEC
SSR
Ref: Gyftopoulos and Beretta

Example, Heat Interaction
E2 = E1 +Q
B2 = B1 + Q(1-T0/T)
S = (1/T0)(Q – Q + Q(T0/T)) = Q/T
S = Q/T
Q, T
T0

Example, Work Interaction
E2 = E1 +W
B2 = B1 + W
S = (W - W) = 0
W

Open System with H, S
Consider the Work to bring the system from the reference environment at standard conditions, To, po to the state at T, p
po, To
p, T
W
Q, To
H, S
H, S

0 inoutoutin WQHH
0 generatedo
outoutin S
T
QSS
generatedoo STSTH W
From EQ 1 & 2, de Swaan Arons
Steady State Work to bring system from Po, To to P, T

Minimum Work = Exergy
)()( ,,,,
min
oooo TpTpoTpTp
orev
SSTHH
STHm
WW
ooo STHSTHB )()(
outinrev BB
m
WW
min

Exergy
System State
Reference State
Maximum work obtainablebetween System and ReferenceStates; or minimum work neededto raise System from the referencestate to the System State

Exergy
System State
Reference State
Maximum work obtainablebetween System and ReferenceStates.

Definition of Exergy “B”
“Exergy is the amount of work obtainable when some matter is brought to a state of thermodynamic equilibrium with the common components of the natural surroundings by means of reversible processes, involving interaction only with the above mentioned components of nature” [Szargut et al 1988].

Manufacturing Systemsas open thermodynamicsystems

Balances for Mfg Process
MFiiouti
MFiiini
MF MNMNdt
dm
1
,1
, )()(
res
MF
prod
MF
mat
MF
MF
ECMF
MFMF
ECMFi
MF
HHH
WQQdt
dE
0
MFirr
res
MF
prod
MF
mat
MF
MF
i
MF
ECMF
i
MF SSSST
Q
T
Q
dt
dS,
0
0
Mass
Energy
Entropy

Work Rate for Mfg Process in Steady State
MFirrMFECMF
i i
matMF
resMF
prodMF
matMF
resMF
prodMF
MFECMF
STQT
T
SSST
HHHW
,00
0
0
1
))((
))((

Exergy and Work
ooo STHSTHB )()(
MFirrMFECMF
i i
matMF
resMF
prodMF
MFECMF
STQT
T
BBBW
,00
01
))((
Bra
nh
am
et
al I
EE
E I
SE
E 2
00
8
Examples: plastic work, melting, vaporizing etc.

Mfg Process Use of Electricity
1. Machining
2. Grinding
3. Casting
4. Injection Molding
5. Abrasive Waterjet
6. EDM
7. Laser DMD
8. CVD
9. Sputtering
10. Thermal Oxidation

Energy Requirements at the Machine Tool
Jog (x/y/z) (6.6%)
Machining (65.8%)
Computer and Fans (5.9%)
Load
Constant (run time) (20.2%)
Variable (65.8%)
Tool Change (3.3%)
Spindle (9.9%)
Constant (startup) (13.2%)
Carousel (0.4%)
Unloaded Motors (2.0%)
Spindle Key (2.0%)Coolant Pump (2.0%)
Servos (1.3%)
Jog (x/y/z) (6.6%)
Machining (65.8%)
Computer and Fans (5.9%)
Load
Constant (run time) (20.2%)
Variable (65.8%)
Tool Change (3.3%)
Spindle (9.9%)
Constant (startup) (13.2%)
Carousel (0.4%)
Unloaded Motors (2.0%)
Spindle Key (2.0%)Coolant Pump (2.0%)
Servos (1.3%)
Production Machining Center Automated Milling Machine
From Toyota 1999, and Kordonowy 2002.

Electric Energy Intensity for Manufacturing Processes
processedvo VkPP
Pow
er
(kW
)
Process Rate (cm3/sec)
physics
auxiliary equipment & infrastructure
Process Rate (cm3/sec)Spe
cific
Ene
rgy
(MJ/
cm3)
V
Ek
V
P
V
Pv
o

All-electric vs. hybrid
0
20
40
60
80
100
120
0 1 2 3 4 5 6 7 8 9 10 11 12 13 14Time (seconds)
Po
wer
Req
uir
ed (
kW)
MM 550 Hybrid NT 440 All-Electric
PlasticizeInject high
Clamp open-close
Inject low
ton
Cool
Ton Buildup
The hydraulic machine would be even higher than the hybrid curve
Source: [Thiriez]

All-electric vs. hybrid
0
20
40
60
80
100
120
0 1 2 3 4 5 6 7 8 9 10 11 12 13 14Time (seconds)
Po
wer
Req
uir
ed (
kW)
MM 550 Hybrid NT 440 All-Electric
PlasticizeInject high
Clamp open-close
Inject low
ton
Cool
Ton Buildup
The hydraulic plot would be even higher than the hybrid curve
Source: [Thiriez]
Injection Molding Machines
0
1
2
3
4
5
6
7
8
0 50 100 150 200Throughput (kg/hr)
SE
C
(MJ/
kg)
HP 25HP 50HP 60HP 75HP 100Low Enthalpy - Raise Resin to Inj. Temp - PVCHigh Enthalpy - Raise Resin to Inj. Temp - HDPE
Variable Pump Hydraulic Injection Molding Machines.
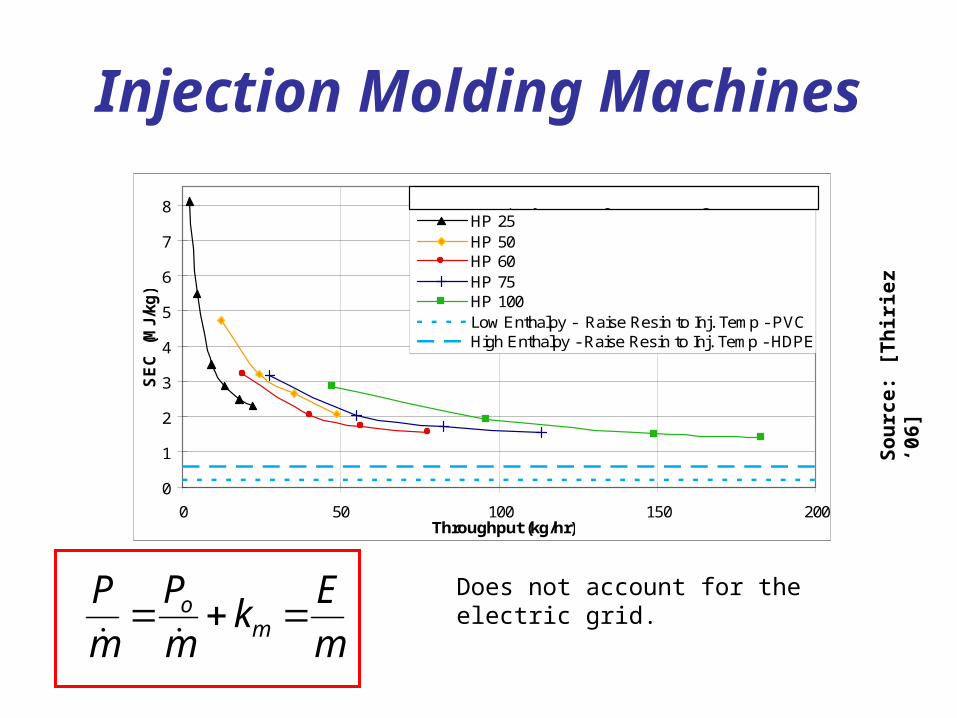
Does not account for the electric grid.
So
urc
e:
[Th
irie
z ‘0
6]
m
Ek
m
P
m
Pm
o

Thermal Oxidation, SiO2
Ref: Murphy et ales&t 2003

Power Requirements
Ref: Murphy et ales&t 2003

Injection Molding 10.76 - 71.40 3.76 - 50.45of polymer processed
1.75E+03 - 3.41E+03 [Thiriez 2006]
Machining 2.80 - 194.80 0.35 - 20.00of material removed
3.50E+03 - 1.87E+05[Dahmus 2004], [Morrow, Qi &
Skerlos 2004] & [Time Estimation Booklet 1996]
Finish Machiningof material removed
[Morrow, Qi & Skerlos 2004] & [Time Estimation Booklet
1996]
CVD 14.78 - 25.00 6.54E-05 - 3.24E-03of material
deposited on wafer area
4.63E+06 - 2.44E+08
[Murphy et al. 2003], [Wolf & Tauber 1986, p.170], [Novellus
Concept One 1995b] & [Krishnan Communication
2005]
Sputtering 5.04 - 19.50 1.05E-05 - 6.70E-04of material
deposited on wafer area
7.52E+06 - 6.45E+08[Wolf & Tauber 1986] &
[Holland Interview]
Grinding 7.50 - 0.03 1.66E-02 - 2.85E-02of material removed
6.92E+04 - 3.08E+05[Baniszewski 2005] & [Chryssolouris 1991]
Waterjet 8.16 - 16.00 5.15E-03 - 8.01E-02of material removed
2.06E+05 - 3.66E+06 [Kurd 2004]
Wire EDM 6.60 - 14.25 2.23E-03 - 2.71E-03of material removed
2.44E+06 - 6.39E+06 [Sodick], [Kalpakjian &
Schmid 2001], & [AccuteX 2005]
Drill EDMof material removed
[King Edm 2005] & [McGeough, J.A. 1988]
Laser DMDof material removed
[Morrow, Qi & Skerlos 2004]
Thermal Oxidation 21.00 - 48.00 4.36E-07 - 8.18E-07of material
deposited on wafer area
2.57E+10 - 1.10E+11 [Murphy et al. 2003]
Process Name ReferencesPower Required
kW
Electricity Required
J/cm3
9.59 2.05E-03 4.68E+06
Process Rate
cm3/s
2.63 1.70E-07 1.54E+10
80.00 1.28E-03 6.24E+07

In General, over manymanufacturing processes,
/seccm 1 /seccm 10
Rates Process Material
and
505
Power Idle
337
V
kWPkW o

1.E+02
1.E+03
1.E+04
1.E+05
1.E+06
1.E+07
1.E+08
1.E+09
1.E+10
1.E+11
1.E+12
1.E-07 1.E-05 1.E-03 1.E-01 1.E+01 1.E+03
Process Rate [cm3/s]
Injection Molding Machining Finish Machining
CVD Sputtering GrindingAbrasive Waterjet Wire EDM Drill EDM
Laser DMD Oxidation Upper BoundLower Bound
Ele
ctrici
ty R
equirem
ents
[J/
cm3 ]
Sp
ecifi
c E
nerg
y R
eq
uir
em
en
ts
J/cm
3
for
Vari
ou
s M
fg P
rocesses
Gut
owsk
i et
alIE
EE
, IS
EE
200
7

1.E+02
1.E+03
1.E+04
1.E+05
1.E+06
1.E+07
1.E+08
1.E+09
1.E+10
1.E+11
1.E+12
1.E-07 1.E-05 1.E-03 1.E-01 1.E+01 1.E+03
Process Rate [cm3/s]
Injection Molding Machining Finish Machining
CVD Sputtering GrindingAbrasive Waterjet Wire EDM Drill EDM
Laser DMD Oxidation Upper BoundLower Bound
Ele
ctrici
ty R
equirem
ents
[J/
cm3 ]
Sp
ecifi
c E
nerg
y R
eq
uir
em
en
ts
J/cm
3
for
Vari
ou
s M
fg P
rocesses
ConventionalProcesses
AdvancedProcesses
Micro/Nano
8 or
ders
of
mag
nitu
de
Gut
owsk
i et
alIE
EE
, IS
EE
200
7

1.E+05
1.E+06
1.E+07
1.E+08
1.E+09
1.E+10
1.E+11
1.E+12
1.E+13
1.E+14
1.E-06 1.E-04 1.E-02 1.E+00 1.E+02 1.E+04
Process Rate [kg/hr]Injection Molding Machining Finish Machining
CVD Sputtering Grinding
Abrasive Waterjet Wire EDM Drill EDM
Laser DMD Oxidation Melters
Ele
ctric
ity R
equi
rem
ents
[J/k
g]
Gut
owsk
i et
alIE
EE
, IS
EE
200
7

Keep in Mind
• This is intensity not total used
• This is at the device
– loses at energy conversion not included
– investment into materials not included
– infrastructure not included
• Suggestive of efficiency

Why are these energy intensities so high?
• stable and declining energy prices
• demand for small devices
• vapor phase processes with slow deposition rates
• efficiency used to enhance performance
• never the less, the trajectory of individual processes is toward faster rates and lower energy intensities

All Electric Vs Hydraulic Injection Molding Machines
0
1
2
3
4
5
6
7
8
9
0 5 10 15 20Throughput (kg/hr)
All-Electric - 85 tons
Hydraulic - 85 tons
SE
C (
MJ/
kg)
Material: PP
Source: [Thiriez 2006]

Exergy Analysis including Chemical Composition
• B = Bph + Bch
• Bph(T=To, P=Po) =0– this is the “restricted dead state*”
• when B = Bph = 0, and
• Bch(o) = 0– this is the “dead state”
ooo STHSTHB )()(

Exergy Accounting
lostoutin BBB
Bin
Bout
Blost
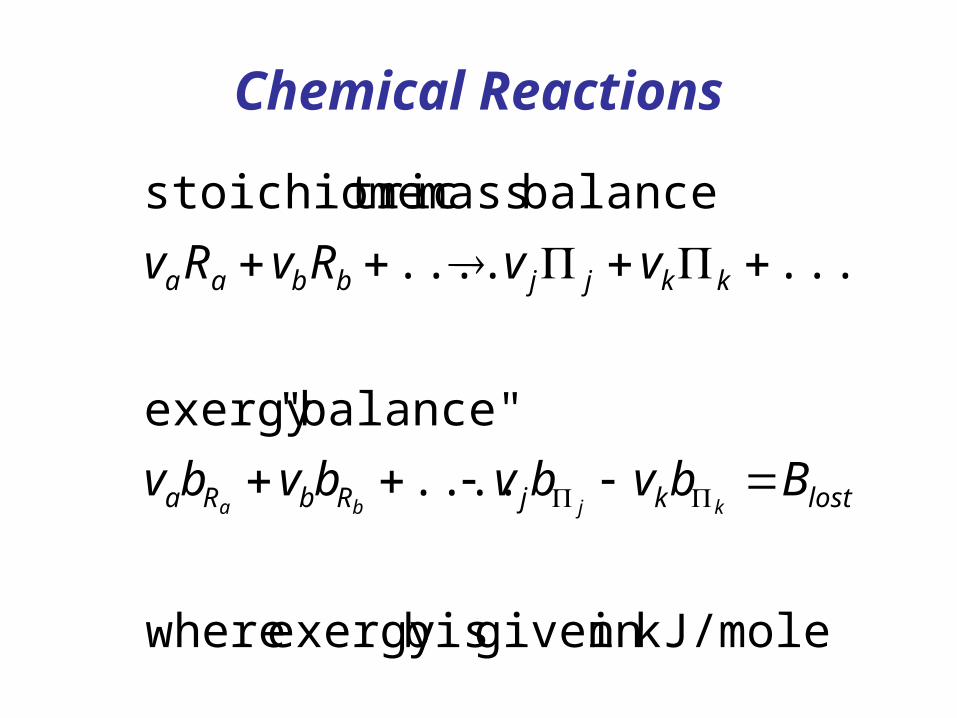
Chemical Reactions
kJ/molein given is bexergy where
....
balance""exergy
.......
balance mass tricstoichiome
lostkjRbRa
kkjjbbaa
Bbvbvbvbv
vvRvRv
kjba

Example: Burning Carbon
C + O2 CO2
BC + BO2 - BCO2 = B
410.3 kJ + 3.97 kJ – 19.9 kJ = 394.4kJ
mole mole mole
The maximum work you can get out of one mole of carbon is
394.4 kJ = 32.9 MJ
mole of carbon kg

Chemical Properties referenced to the “environment”
Crust
Oceans
Atmosphere
T0 = 298.2 K, P0 = 101.3 kPA

Exergy Reference System
pure metal, element
oxides, sulfides…
crustal component
earth’s crust (ground state)
chemical reactions
extraction

Example; making pure iron from the crust
Fe (c = 1) 376.4 kJ/mole
reduction
Fe2O3 (c=1) 16.5 kJ/mole
extraction
Fe2O3 (c = 1.3 x 10⁻³) 0 kJ/mole (ground)

Work Rate for Mfg Process
MFirrMFECMF
i i
matMFi
n
i
chi
resMFi
n
i
chi
prodMFi
n
i
chi
phmatMF
resMF
prodMF
MFECMF
STQT
TNb
NbNb
BBBW
,00
0
1
11
1)(
)()(
))((
Here all chemical exergy terms (bch) are at To, Po
Branham et al IEEE ISEE 2008

Efficiency Measures:Degree of Perfection
in
outputusefulp B
B

Batch Induction Melter Inputs and Outputs
Ductile Iron – Batch Electric Induction Exergy Analysis
Ductile Iron Melt1000 kg
Slag40 kg
Metallic Input Materialsand Alloys1024 kg
Input Electricity5,393 MJ
Boundaries are drawn around the entire facility so that all components are at standard pressure and temperature
Dust0.26 kgNatural Gas Preheater
0.025 kg

Batch Induction Melter Exergy Analysis*
Material Amount (kg) Weight PercentStandard Chemical
Exergy (MJ/kg) Exergy (MJ)Percent Total
Exergy
Steel Scrap 439 42.85% 6.89 3022.25 15.39%Pig Iron 1.6 0.16% 8.18 13.43 0.07%Ductile Iron Remelt 535 52.25% 8.44 4513.98 22.99%65% Silicon Carbide Briquettes 4.3 0.42% 31.73 137.62 0.70%75% Ferrosilicon 3.0 0.29% 24.51 72.46 0.37%5% MgFeSi 14.8 1.44% 19.09 282.30 1.44%Copper 1.7 0.17% 2.11 3.69 0.02%Tin 0.005 0.00% 1.13 0.01 0.00%62% Fe-Molybdenum 6.2 0.61% 7.28 45.35 0.23%Carbon 9012 18 1.80% 34.16 628.45 3.20%Natural Gas Preheater 0.02 0.00% 51.84 1.27 0.01%Electricity 5418.00 55.59%
Total Inputs 1024 100.00% 14138.83 100.00%
Ductile Iron Melt 1000.2 96.69% 8.44 8436.45 99.29%Slag 33.9 3.28% 1.14 60.05 0.71%Dust 0.3 0.02% 0.26 0.07 0.00%
Total Outputs 1034 100.00% 8497 100.00%
Mass Difference -1.05%
Ductile Iron Batch Electric Induction Melting
Input Materials
Output Materials
*including losses at Utility

Batch Electric
Induction Melting
of 1 kg of melt
Total Exergy In
(Bin) = 11,155,000 JUseful Exergy Out (Bout) = 8,250,000J
Component Exergy in (J)Metallics 8,700,000Electricity* 2,455,000
Batch Electric Degree of Perfection
79.0000,420,10
000,250,8
J
JP
Degree of Perfection
inputsofExergy
productsusefulofExergyP
*not including utility losses

Plasma Enhanced Chemical Vapor Deposition (CVD)

Input Deposition Gases
Species Input mass (g)
Input moles or primary energy
Exergy (J) %Total Inputs
SiH4 0.95 0.029579mol 40928.6 0.749O2 0.49 0.015313mol 60.79
Ar 0.34 0.008511mol 99.5
N2 196.9 7.028779mol 4849.9
Input Cleaning Gases
CH4 69.41 4.326643mol 3598253 63.0NF3 31.06 0.437453mol 266931.6
Input Energy
Electricity 2220000J 2220000 36.2
Outputs
Undoped Silicate
Glass laye
0.0248 0.000414mol 3.2667
Pla
sm
a e
nh
an
ced
CV
D

Data from Sarah Boyd et. al. (2006)
Chemical Vapor
Deposition (CVD) of a
600nm Undoped
Silicate Glass (USG) layer at
400°C
Total Exergy In
(Bin) = 6,130,000J
Useful Exergy Out (Bout) = 3.3J
710*33.5123,131,6
267.3 J
JP
Component Exergy in (J)Input Gases 45,900Cleaning Gases 3,865,000Electricity* 2,220,000
Degree of Perfection
CVD Degree of Perfection
*not including utility losses

Reasons for a Low Efficiencies
• Use of high exergy and ultra-pure
materials, often with only a small fraction
going into the product
• Low yields
• Low processing rates
• Energy and Materials were inexpensive