The Texas Medication Algorithm Project - Schizophrenia Bulletin
22
The Texas Medication Algorithm Project: Clinical Results for Schizophrenia by Alexander L. Miller, M. Lynn Crismon, A. John Rush, John Chiles, T. Michael Kashner, Marcia Toprac, Thomas Carmody, Melanie Biggs, Kathy ShoreS'Wilson, Judith Chiles, Brad Witte, Christine BoW'Thomas, Dawn I. Velligan, Madhukar Trivedi, Trisha Suppes, and Steven Short Abstract In the Texas Medication Algorithm Project (TMAP), patients were given algorithm-guided treatment (ALGO) or treatment as usual (TAU). The ALGO intervention included a clinical coordinator to assist the physicians and administer a patient and family education program. The primary comparison in the schizophrenia module of TMAP was between patients seen in clinics in which ALGO was used (n = 165) and patients seen in clinics in which no algorithms were used (n = 144). A third group of patients, seen in clinics using an algorithm for bipolar or major depressive disorder but not for schizophrenia, was also studied (n = 156). The ALGO group had modestly greater improvement in symptoms (Brief Psychiatric Rating Scale) during the first quarter of treatment The TAU group caught up by the end of 12 months. Cognitive functions were more improved in ALGO than in TAU at 3 months, and this difference was greater at 9 months (the final cognitive assessment). In secondary comparisons of ALGO with the second TAU group, the greater improvement in cognitive functioning was again noted, but the initial symptom difference was not significant Keywords: Algorithm, guideline, medication, schizophrenia, symptoms. Schizophrenia Bulletin, 30(3):627-647,2004. A number of studies have found that the use of medica- tions in outpatients with schizophrenia frequently does not conform to expert recommendations (Lehman and Steinwachs 1998; Buchanan et al. 2002) and is often sub- optimal or poorly documented (Young et al. 1998; Cradock et al. 2001). These findings have given added impetus to efforts to develop medication guidelines and algorithms, based on the premise that they will reduce variability in medication practices, improve quality of care, and lead to better patient outcomes. Considerable evidence, however, indicates that, in the absence of spe- cific measures to promote physician adherence to the guideline or algorithm, actual practice behaviors are little affected by the adoption of guidelines or algorithms by behavioral health care organizations (see literature reviews in Gilbert et al. 1998; Rush et al. 1999; Bauer 2002). The Texas Medication Algorithm Project (TMAP) examined the effects of using medication algorithms for schizophrenia, bipolar disorder, and major depressive dis- order under conditions in which implementation of the algorithms was aided by provision of a clinical coordina- tor (CC) to work with physicians and to administer an educational program to patients and their families. The rationale and general outline of the project have been described previously (Gilbert et al. 1998; Rush et al. 1999). The results presented here are the clinical out- comes for patients with schizophrenia over their first 12 months of treatment. As detailed below (Methods) and elsewhere (Rush et al. 2003), TMAP consisted of a package of interventions that included treatment manuals, CCs, expert consulta- tions through conference calls and site visits, and an extensive multistep patient and family education program (Toprac et al. 2000). The principal analyses are of the effects of this package of interventions compared with treatment as usual (TAU). The duration of patient enroll- ment was 13 months. Following enrollment, patients par- ticipated in the study for 1 to 2 years, depending on when they enrolled. Because all patients potentially had at least 1 year of participation, the analyses focus on the clinical outcomes over the first 12 months following study entry. In keeping with usual clinical practice, the main focus of algorithm-guided treatment (ALGO) was on Send reprint requests to Dr. A.L. Miller, Department of Psychiatry, MS 7792, University of Texas Health Science Center at San Antionio, 7703 Floyd Curl Drive, San Antonio, TX 78229-3900; e-mail: millera@uth- scsa.edu. 627 Downloaded from https://academic.oup.com/schizophreniabulletin/article/30/3/627/1933275 by guest on 07 January 2022
Transcript of The Texas Medication Algorithm Project - Schizophrenia Bulletin

The Texas Medication Algorithm Project:Clinical Results for Schizophrenia
by Alexander L. Miller, M. Lynn Crismon, A. John Rush, John Chiles,T. Michael Kashner, Marcia Toprac, Thomas Carmody, Melanie Biggs,Kathy ShoreS'Wilson, Judith Chiles, Brad Witte, Christine BoW'Thomas,
Dawn I. Velligan, Madhukar Trivedi, Trisha Suppes, and Steven Short
Abstract
In the Texas Medication Algorithm Project (TMAP),patients were given algorithm-guided treatment(ALGO) or treatment as usual (TAU). The ALGOintervention included a clinical coordinator to assistthe physicians and administer a patient and familyeducation program. The primary comparison in theschizophrenia module of TMAP was between patientsseen in clinics in which ALGO was used (n = 165) andpatients seen in clinics in which no algorithms wereused (n = 144). A third group of patients, seen in clinicsusing an algorithm for bipolar or major depressivedisorder but not for schizophrenia, was also studied(n = 156). The ALGO group had modestly greaterimprovement in symptoms (Brief Psychiatric RatingScale) during the first quarter of treatment The TAUgroup caught up by the end of 12 months. Cognitivefunctions were more improved in ALGO than in TAUat 3 months, and this difference was greater at 9months (the final cognitive assessment). In secondarycomparisons of ALGO with the second TAU group, thegreater improvement in cognitive functioning wasagain noted, but the initial symptom difference wasnot significant
Keywords: Algorithm, guideline, medication,schizophrenia, symptoms.
Schizophrenia Bulletin, 30(3):627-647,2004.
A number of studies have found that the use of medica-tions in outpatients with schizophrenia frequently doesnot conform to expert recommendations (Lehman andSteinwachs 1998; Buchanan et al. 2002) and is often sub-optimal or poorly documented (Young et al. 1998;Cradock et al. 2001). These findings have given addedimpetus to efforts to develop medication guidelines andalgorithms, based on the premise that they will reducevariability in medication practices, improve quality of
care, and lead to better patient outcomes. Considerableevidence, however, indicates that, in the absence of spe-cific measures to promote physician adherence to theguideline or algorithm, actual practice behaviors are littleaffected by the adoption of guidelines or algorithms bybehavioral health care organizations (see literaturereviews in Gilbert et al. 1998; Rush et al. 1999; Bauer2002). The Texas Medication Algorithm Project (TMAP)examined the effects of using medication algorithms forschizophrenia, bipolar disorder, and major depressive dis-order under conditions in which implementation of thealgorithms was aided by provision of a clinical coordina-tor (CC) to work with physicians and to administer aneducational program to patients and their families. Therationale and general outline of the project have beendescribed previously (Gilbert et al. 1998; Rush et al.1999). The results presented here are the clinical out-comes for patients with schizophrenia over their first 12months of treatment.
As detailed below (Methods) and elsewhere (Rush etal. 2003), TMAP consisted of a package of interventionsthat included treatment manuals, CCs, expert consulta-tions through conference calls and site visits, and anextensive multistep patient and family education program(Toprac et al. 2000). The principal analyses are of theeffects of this package of interventions compared withtreatment as usual (TAU). The duration of patient enroll-ment was 13 months. Following enrollment, patients par-ticipated in the study for 1 to 2 years, depending on whenthey enrolled. Because all patients potentially had at least1 year of participation, the analyses focus on the clinicaloutcomes over the first 12 months following study entry.
In keeping with usual clinical practice, the mainfocus of algorithm-guided treatment (ALGO) was on
Send reprint requests to Dr. A.L. Miller, Department of Psychiatry, MS7792, University of Texas Health Science Center at San Antionio, 7703Floyd Curl Drive, San Antonio, TX 78229-3900; e-mail: [email protected].
627
Dow
nloaded from https://academ
ic.oup.com/schizophreniabulletin/article/30/3/627/1933275 by guest on 07 January 2022

Schizophrenia Bulletin, Vol. 30, No. 3, 2004 A.L. Miller et al.
symptom improvement. For schizophrenia, both positiveand negative symptoms were clinically monitored,because improvement in these symptoms with antipsy-chotic treatment has been most extensively evaluated(Miller et al. 1999). Because impairments in cognitivefunctioning have been shown to be very strongly relatedto poor adaptation and role functioning in schizophrenia(Green 1996; Velligan et al. 1997), we also included abrief battery of cognitive function tests.
Participating clinicians were given specific guidanceand prompting with regard to medication use and assess-ment of symptoms and side effects at each clinic visit.They were, however, free to exercise their own clinicaljudgment and to deviate from algorithm recommendationsif they felt that this was clinically indicated. The resultspresented here, therefore, reflect the effects of ALGO as itwas actually implemented.
The medication algorithms developed for the treat-ment of schizophrenia and related disorders have beendetailed elsewhere (Miller et al. 1999). They were basedin large part on the American Psychiatric Associationguidelines (APA 1997) and the first version of theExpert Consensus Guidelines (Frances et al. 1996) forschizophrenia. The antipsychotic algorithm was subse-quently modified to incorporate recommendations foruse of olanzapine and quetiapine when these antipsy-chotics were approved by the U.S. Food and DrugAdministration. Because evidence was, and still is,lacking on response rates to trials of subsequent atypi-cal antipsychotics after one has failed, the antipsychoticalgorithm gave clinicians the option of trying eachagent or skipping ahead to clozapine, depending onclinical judgment.
MethodsStudy Design. This multisite trial compared ALGO withTAU for schizophrenia and schizoaffective disorder(excluding bipolar type). Physicians in four clinics usedALGO, while physicians in eight matched clinics usedTAU. Four TAU clinics used no algorithms for any disor-der and had no augmentation of their clinical staff. Theother four TAU clinics used algorithms and had CCs toassist in administering the intervention packages fordepression or bipolar disorder but not schizophrenia(TAU-AC, treatment as usual in an algorithm clinic).Study assignment to ALGO or TAU was by clinic ratherthan by physician or patient. Study assignment (e.g., ran-domization) by patient rather than by clinic would haverequired physicians to follow ALGO with some patientsbut not others with the same diagnosis. Assignment byphysician would have required some physicians in thesame clinic to use ALGO while others would deliver
TAU. This method would require that physicians avoidsharing experiences with one another and not cover foreach other to avoid contaminating TAU with ALGO("water cooler" effect). A limited number of clinics wereavailable for study participation, and to reflect the geo-graphic and demographic diversity of Texas, the clinicswere chosen to be diverse by design.
Given these factors, study cell assignments byclinic were matched rather than randomized. When pos-sible, clinics were matched in order to have an ALGOclinic and a TAU clinic for the same disorder within thesame local mental health authority. This was often notpossible for rural authorities with limited numbers ofclinics. In such cases, we attempted to match an ALGOclinic with a similar-type TAU clinic (e.g., rural ALGOwith rural TAU). Finally, we tried to match a givenALGO clinic with a TAU clinic that was similar in eth-nic composition.
The primary test of the effects of ALGO versusTAU was the comparison between the ALGO group andthe TAU group seen in clinics in which no algorithmswere being used. The TAU-AC group provides an indi-cation of the possible impact of using an algorithm forone disorder on TAU for another disorder.
The study was conducted in accordance with inter-national guidelines for good clinical practice and theDeclaration of Helsinki. It was approved by theInstitutional Review Boards of the University of TexasSouthwestern Medical Center at Dallas and theUniversity of Texas at Austin. After entry into the study,symptoms, function, quality of life, side effect severityand burden, and utilization of health care and other pub-lic and private services were evaluated at baseline andquarterly for at least a 12-month period in all availableparticipants.
Patient participants gave written informed consentfor the research ratings and for access to their medicaland administrative records. For ALGO, patient consentwas obtained at the time of the decision to changeantipsychotic medication. The medication decisionswere not contingent upon agreement to participate inthe study. Potential TAU patients were identified asdescribed below. Individuals meeting TAU eligibilitycriteria were approached by a research coordinator toobtain written informed consent to the research proce-dures. Clinic personnel were not asked to give informedconsent. All were voluntary participants in the project.
ALGO Intervention. The primary goal of the ALGOintervention was to optimize pharmacotherapy andimprove clinical outcomes. Multiple tools were providedfor the physicians and the treatment team to enhance theiradherence to the algorithm. The primary aim of pharma-
628
Dow
nloaded from https://academ
ic.oup.com/schizophreniabulletin/article/30/3/627/1933275 by guest on 07 January 2022

The Texas Medication Algorithm Project Schizophrenia Bulletin, Vol. 30, No. 3, 2004
cotherapy was remission of symptoms. Each physicianimplemented the intervention in close collaboration with aCC, who assisted the physician by obtaining symptomand side effect measures at each visit, by providingpatient and family education, and by reminding the physi-cians of the ALGO guidelines.
The CCs were mental health professionals (nurses,social workers, psychologists, counselors) with at least2 years of experience. They and the ALGO physiciansreceived 2 days of training on the ALGO interventionsat the outset of the project, and ongoing consultationsfrom investigators (A.L.M., Jo.C, and M.L.C.) and thecoordinator (Ju.C). Additionally, the CCs were trainedon the brief rating scales of positive and negative symp-toms initially, with quarterly retraining on standardizedtapes.
The antipsychotic algorithm and algorithms for sideeffects and associated symptoms have been describedelsewhere (Miller et al. 1999). Figure 1 shows theantipsychotic algorithm used during the study. A clinicalprocedures manual was the basis for training and ongo-ing guidance of the physicians and CCs. The manualcontained specific recommendations for monitoringsymptoms and side effect burden to inform medicationdecisions at clinic visits. Critical decision points weredescribed in the manual for each medication step inorder to define recommended minimum and maximumtrial lengths. The manuals included recommended doseranges and criteria for adequacy of treatment of positiveand negative symptoms. Positive and negative symptomswere assessed at each clinic visit in ALGO with briefanchored rating scales using items taken from the BriefPsychiatric Rating Scale (BPRS; Ventura et al. 1993) orderived from the Scale for the Assessment of NegativeSymptoms (SANS; Andreasen 1982) and the NegativeSymptom Assessment (Alphs et al. 1989). The responsecriteria are discussed in Miller et al. (1999). The goalwas to achieve a virtual absence of positive symptomsand, on average, no greater than mild negative symp-toms. If these goals were not achieved after a medicationtrial of reasonable dose and duration, a medicationchange, based on the sequence in the algorithm, was rec-ommended. In addition, ALGO patients were evaluatedfor overall side effect burden, core symptom severity,associated symptom severity, and level of functioning bythe CC and physician before a decision was made tomaintain or change the medication regimen at eachclinic visit.
Each ALGO patient also received a multistep edu-cation program that provided information about the dis-ease and its treatment (Toprac et al. 2000). There wasno comparable program for TAU patients. The patienteducation package encouraged patient participation intreatment decisions and treatment adherence. ALGO
patients had an average of 4.9 visits (range 0-18) atwhich they received elements of the psychoeducationprogram. The basic educational materials were usuallycovered in the first three to six visits. Subsequently,patients had the option of participating in educationalgroup discussions about their illness and its treatment.
Patient Selection. Male and female outpatients 18 yearsor older with a clinical diagnosis, by their treating physi-cians, of schizophrenia or schizoaffective disorder (unlessspecifically of the bipolar subtype) were included in thestudy in either the ALGO group or the TAU group basedon their clinic assignments. Patients with clinical diag-noses of schizoaffective disorder, bipolar type, wereexcluded, based on the likelihood that their treatmentwould include long-term use of mood stabilizers and bemore like that recommended in the bipolar algorithm(Suppesetal. 2001).
Patients entered the ALGO group if their treatingphysician decided that an antipsychotic medicationchange was warranted because of lack of efficacy orbecause of side effects. Initially, TAU patients were tobe selected for inclusion in the same manner as ALGOpatients; that is, those patients with a diagnosis of schiz-ophrenia who had a change in antipsychotic medicationby their physician were eligible for enrollment in thestudy. However, it soon became apparent that it wasuncommon for TAU patients to have a change in theirantipsychotic medication and that an additional methodwould need to be used to define TAU study eligibility ifwe were to meet enrollment goals for the TAU group.Therefore, TAU patients were also recruited in an addi-tional manner. If a TAU patient's most recent routineclinic 24-item Brief Psychiatric Rating Scale (BPRS24)score was greater than the median for that mental healthcenter, then the patient was eligible for screening for thestudy. An alphabetical list of patients meeting this crite-rion during the prior 6 months was given to the researchcoordinators, who then contacted patients on the list,starting with those seen more recently. If the patient waswilling to be evaluated for the study, the research coor-dinator did a screening BPRS24- If the patient's score onthis BPRS was higher than one standard deviation (SD)below the mean for the ALGO group, then the patientwas eligible for entry into the TAU group. Only thoseindividuals meeting these criteria and providing writteninformed consent were entered into the TAU group.
There were minimal exclusion criteria for study entry.Patients were excluded if they were unable or unwilling togive voluntary informed consent to the research evalua-tions, or if they had gross intoxication due to substanceabuse at the initial visit. They were not, however,excluded on the basis of a history of substance abuse ordependence.
629
Dow
nloaded from https://academ
ic.oup.com/schizophreniabulletin/article/30/3/627/1933275 by guest on 07 January 2022

Schizophrenia Bulletin, Vol. 30, No. 3, 2004 A.L. Miller et al.
Figure 1. Antipsychotic algorithm
L Stage 1
Wo History of TypicalAntipsychotic Failure
Olanzapineor
Quetlapineor
Rispertdone
(Any stagefs) can be skippeddepending on the clinical picture.)
Acute ExacerbationFirst presentation or notnon-responder to olanzapine,quetlapine or rispertdone
History of TypicalAntipsychotic Failure
Olanzapineor
Queti spineor
Rlsperidone
Stage 2
Non-responderto One
L Stage 3
Non-responderto Two
Non-responseto one
UseAnother
Non-compliance
Non-responseto two
Use theThird
Non-responseto three
Haloperidol Decanoateor
FlupbenazineDecanoate
Non-compliance
Non-response
Use theThird
Non-response
1
Non-responseto one
UseAnother
Non-responseto two
Use theThird
Non-responseto three
Stage 4 TypicalAntipsychotic
Stage 5
Stage 5a
YNon-response
1Ctozapine
Partialw Response
Ciozapine + Augmenting Agent(Typical or atypical antipsychotic,
mood stabilizer, ECT. antidepressant)
Non-response
Non-responseor
ciozapinerefusal
StagesAtypical + Typical
Combination of Atypicats,Typical or Atypical + ECT
Note.—ECT " electroconvulslve therapy.
630
Dow
nloaded from https://academ
ic.oup.com/schizophreniabulletin/article/30/3/627/1933275 by guest on 07 January 2022

The Texas Medication Algorithm Project Schizophrenia Bulletin, Vol. 30, No. 3, 2004
Study Procedures. Study participants provided baselinedemographic and medical history. They underwent a com-plete evaluation at the baseline visit with a research coor-dinator. The evaluation battery included symptom testingwith the 24-item BPRS (Ventura et al. 1993), the Scale forthe Assessment of Negative Symptoms (SANS;Andreasen 1982), and the Calgary Depression Scale(Addington et al. 1993); function testing with the ShortForm Health Survey (SF-12) mental and physical (Wareet al. 1996); and cognitive testing with Trails A and B,Verbal Fluency (categories and letters), and the HopkinsVerbal Learning Test (Reitan 1955, 1958; Lezak 1995;Benedict et al. 1998; Cadle et al. 2002). These assess-ments were repeated quarterly for at least 12 months,except for the cognitive tests, which were administered atbaseline, 3 months, and 9 months.
Subjects were also asked about the burden of sideeffects from medication during the past month that "both-ered or interfered with daily functioning." Respondentswere considered to have no significant side effects if theyreported "no side effects" or "only mild side effects, notreally significant," and to have significant side effectswhen they reported that side effects "bothered me, butcould tolerate them," "really bothered me, I either need tochange my medication or take something for the sideeffects," or "were so severe I had to be hospitalized."
Demographic information was obtained from apatient questionnaire administered during the face-to-facebaseline interview. Alcohol use and drug use wereassessed quarterly using the Drug Abuse Screening Test(Skinner 1982) (> 5 indicates drug abuse) and theMichigan Alcoholism Screening Test (Selzer 1971) (S 5indicates alcohol abuse). The Patient Perception ofBenefits is a 10-item self-report developed for this study,ranging from 10 (belief) to 50 (disbelief) that the patientwill see improved functioning if he or she gets neededcare.
Research Assessments. The research assessments (seeStudy Procedures) were conducted over a maximumperiod of 18 months. Because the enrollment period was13 months and the followup period was 12 months, allpatients had the opportunity to participate for 12 months,whereas only earlier enrollees had the opportunity to par-ticipate for longer periods. Because the number of partici-pants fell markedly beyond 12 months, only results fromthe first 12 months are reported here, although data frombeyond 12 months, when available, were used in the sta-tistical modeling procedures. The assessors were initiallytrained in each of the assessments and had quarterlyretraining on the structured clinical interviews. The asses-sors contacted and assessed ALGO and TAU patientsindependently of the patients' clinical providers.
Outcomes. The primary research outcome measure wasthe 18-item BPRS (Overall and Gorham 1962), extractedfrom the 24-item BPRS. Secondary symptom measuresincluded the SANS (Andreasen 1982) and the CalgaryDepression Scale (Addington et al. 1993). Tests of cogni-tive functioning included Trails A and B (Reitan 1955,1958), Verbal Fluency (categories and letters) (Lezak1995), and the Hopkins Verbal Learning Test (Benedict etal. 1998). Functional outcomes were measured with theSF-12 (Ware et al. 1996). The population for the analysisof efficacy included all patients who were enrolled andhad complete 18-item BPRS data on at least one postbase-line quarterly assessment.
Adherence Variables. Charts were reviewed and dataextracted for medications prescribed at each visit. Thesedata were used to estimate frequencies and doses ofantipsychotic medications used. The number of patients inthe ALGO or TAU group who were prescribed theantipsychotic at any time during the study period wasdivided by the number in the group to calculate frequen-cies of use. Average doses were calculated using the high-est dose prescribed during the study. Because ALGOpatients had more antipsychotic medication changes (seebelow), their total frequencies of receiving differentantipsychotics are higher than the TAU group's.
Antipsychotic medication changes were part of thestandard documentation of ALGO treatment. TAUantipsychotic medication changes were inferred from thechart recording of a prescription for an antipsychotic notpreviously noted for that patient during the quarter.
Duration of availability of medications prescribed ata visit was based upon the following data (in decreasingorder of preference): actual number of pills if chart noteindicated number of pills, actual number of days if chartnote indicated number of days, or days until next clinicvisit if a clinic appointment was scheduled; if there wasno information, then 30 days was assumed. Becausepatients acquired their medications from multiplesources (Medicaid, local center pharmacy contracts,patient assistance programs, and samples), there was nopossibility of using pharmacy medication fill data tolook at actual medication possession. Thus, active orderswere used as a marker of potential medication posses-sion.
Statistical Analyses. Tests for differences betweengroups were based on 2-tailed tests with equal variancenot assumed for continuous measures (based on Levene'stest), chi-squares for discrete values, and chi-squares withcontinuity corrections for dichotomous measures.
As detailed elsewhere (Rush et al. 2003), hierarchicallinear models (HLMs) were adapted to assess the impact
631
Dow
nloaded from https://academ
ic.oup.com/schizophreniabulletin/article/30/3/627/1933275 by guest on 07 January 2022

Schizophrenia Bulletin, Vol. 30, No. 3, 2004 A.L. Miller et al.
of ALGO on patient outcomes based on declining effectsanalyses developed for this study by Kashner et al.(2003). This approach allowed investigators to compareseparately those changes that occurred initially (within 3months) and over time (12 months). Estimates for the ini-tial change in outcomes between baseline and the first 3-month followup were computed separately for ALGO andfor TAU. Following the initial change, we estimatedchanges in outcomes over the subsequent 9 months (i.e.,months 3-12). Differences between ALGO and TAU werecomputed for initial changes (initial effects) and growthrates (growth-rate effects).
Differences between ALGO and TAU in the value ofthe outcome measure assessed at baseline would factor-load onto any group differences observed over time. Thus,patient outcome measures were determined as changescores from baseline values.
Because groups differed on a number of variables thatcould potentially affect outcomes, statistical comparisonswere done using adjusted values. The basis and rationalefor the methodology are discussed in detail in Kashner etal. (2003) and Rush et al. (2003). In brief, raw data wereadjusted using covariates known to affect health outcomes,selecting items that were significantly associated with theprimary outcome variable (BPRSlg) in this study. For eachdomain, covariates included the most significant covariatethat was linearly associated with outcomes based on a uni-variate model. Additional variables were included pro-vided they were statistically significant at a 0.05 alphalevel. Thus, the covariate domains (items assessing them)were need (baseline symptom score, age), predisposition toseek care (years of education, patient perception of bene-fits), enabling factors (family size, disposable income), anddemographic items (ethnicity, race, sex).
Final estimates were insensitive to model respecifica-tion, because including or excluding other covariates inthe presence of the selected covariates did not change theresults of ALGO/TAU outcome comparisons. Moreover,high model reliability (> 75%), final HLM estimates thatwere very similar to their least squares starting estimates,and our use of robust standard errors, gave investigatorsconfidence that reported estimates were relatively free ofmisspecification error in either the estimated effects or therespective standard errors upon which significance testswere based.
Growth-rate effects were used to determine whetherinitial effects increased, remained constant, or declinedduring followup. Typical HLM analyses utilize a growtheffects model that is powered to detect growth in differ-ences between patients who receive a treatment and getbetter, and those in a control condition who either getworse, do not get better, or do not improve as much asthose in the intervention group. Initial examination of our
data, however, indicated an initial effect in favor of theALGO group and, at least with some analyses, a tendencyfor a declining effect over time (i.e., the control groupbegins to "catch up" with the intervention group overtime). This declining effect over time after an initial effectmay actually be expected in service intervention studiesfor chronic disease states where differences between inter-vention and control groups over time may be complex.Growth effect models do not consider initial effects sepa-rately from further growth, and they collapse differencesbetween treatment groups and controls over time into asingle parameter. Thus, they are not powered to detect adeclining effect. The declining effects model developedfor analysis of these data adds an additional parameter inthat it examines the initial effect and then the continuingeffect over time after the initial effect. Thus, it has greaterpower to detect a declining effect after an initial effect orno change after an initial effect and is a superior analyticmodel to use for these types of data (Kashner et al. 2003).
Specifically, time since baseline was entered as acontinuous variable in a time level I and patient level IIHLM. Dependent variables were patient outcomes mea-sured at 3-month intervals and computed as changescores by subtracting each followup assessment from therespective value determined at baseline. For each treat-ment group (ALGO and TAU), the initial change andgrowth rates were computed, respectively, by the regres-sion constant and time coefficient, while initial andgrowth-rate effects (ALGO-TAU) were computed bygroup indicator and time X group-indicator interaction.The group-indicator variable assumes the value of 1 forALGO patients and 0 for TAU patients.
For Trails A and B data, values were transformed tonatural logarithms to normalize distributions. To groupthe cognitive test results into a summary measure foreach patient, each score was converted into a z score,and the z scores were summed for each patient at eachtime point. Summary scores of cognition, using z scores,have proven to be sensitive measures of drug effects inschizophrenia and provide a measure of the overall mag-nitude of change (Purdon et al. 2000; Bilder et al. 2002;Green et al. 2002).
ResultsA total of 512 patients met the criteria for the study
and signed informed consent; of these, 9 did not completebaseline, 29 failed to report for any followup visit, and 9had a followup visit but did not complete at least one pri-mary symptom measure (BPRS]g). The remaining 465evaluable patients completed the primary symptom mea-sure at baseline and at least one followup visit, including165 patients from four ALGO clinics, 144 patients from
632
Dow
nloaded from https://academ
ic.oup.com/schizophreniabulletin/article/30/3/627/1933275 by guest on 07 January 2022

The Texas Medication Algorithm Project Schizophrenia Bulletin, Vol. 30, No. 3, 2004
four TAU clinics using no algorithms for any of the threedisorders, and 156 patients seen in TAU clinics using analgorithm for another disorder. The ALGO group and theTAU group seen in clinics not using other algorithms con-stituted the primary analytic sample (n — 309).
For the primary analytic sample, baseline BPRS18
was lower for ALGO than for TAU patients (38.75 [SD -11.15] vs. 45.38 [SD = 10.71], A = -6.63, t = 5.31, df =307, p < 0.001). With lower initial values in the ALGOgroup, regression to the mean bias would work againstfinding a favorable ALGO effect on outcome, and thus theanalytic approach is conservative.
The HLM analyses of the primary analytic sampleused all subjects with at least one postbaseline BPRSlg
rating. The percentages of subjects meeting this criterionat 3, 6, 9, and 12 months were 100 percent, 95 percent, 91percent, and 86 percent, respectively. Thus, retention ofsubjects in the study was excellent.
Table 1 lists the demographic characteristics of theprimary analytic sample (ALGO and TAU groups), aswell as the group of TAU patients seen in a clinic inwhich clinicians were using algorithms for bipolar ormajor depressive disorder (TAU-AC). The groups did notdiffer significantly from one another on most variables.Most covariates (see list in legend to table 2) were not sta-tistically significant predictors of change scores, and thuspotential biases introduced by these factors are expectedto be small. Initial BPRS18 scores and Hispanic statuswere significant predictors of BPRS ]8 change scores.BPRSlg change scores dropped by an average across sub-sequent time points of ABPRS,g = -0.55 (standard error[SE] = 0.05, t = 12.28, df = 269, p < 0.001) for eachBPRS,8 P° 'n t m a t baseline symptom scores were abovemean values, underscoring concerns for regression to themean biases. Compared with Caucasians, BPRS18 scoresdeclined more in Hispanic patients, by an average acrosspostbaseline time points of ABPRS18 = -3.81 (SE= 1.08, t= 3.52, df= 269, p< 0.001).
Table 2 presents unadjusted BPRS18 scores for allthree groups. Statistical analyses were done usingadjusted values.
Table 3 contains adjusted data on the main symptommeasures. The initial change is the change in score overthe first 3 months. The growth rate is the quarterly changein scores over the next 9 months. For the BPRS18, SANS,and Calgary Depression Scale, decreases in scores repre-sent improved symptoms. For the SF-12 mental andphysical, increases in scores indicate improvements inthese patient self-reports. On the primary symptom out-come measure, the BPRS18 both groups had significantdecreases in scores over the first 3 months (table 3). Thedecline was significantly greater in the ALGO group com-pared with the TAU group. Over the subsequent 9 months,
the TAU group had a further significant decline in symp-toms, catching up with the ALGO group in terms ofsymptom improvement. These results are illustrated infigure 2.
Negative symptoms, as measured by the SANS,declined significantly in both groups over the first 3months, but the two groups did not differ significantlyfrom one another (table 3).
The ALGO and TAU groups did not differ signifi-cantly in initial or subsequent changes in scores on theCalgary Depression Scale (table 3). Depressive symptomsdid improve significantly in both groups during the first 3months.
There were no overall group differences on the SF-12mental or physical (table 3).
Unadjusted cognitive test performance scores for allgroups are shown in table 4, with results at baseline, 3months, and 9 months. To put all scores on comparabledimensions, we converted them to z scores and computedthe z-score differences. Table 5 shows these results for theprimary comparison between ALGO and TAU groups.During the first quarter, the ALGO group had significantlygreater improvements than the TAU group in scores onTrails A and Verbal Fluency (letters). By the end of thethird quarter, Verbal Fluency (categories) was also signifi-cantly more improved in the ALGO group than in theTAU group. Results on the combined tests, expressed as zscores, were significantly more improved in the ALGOgroup at both 3 and 9 months after study entry. The com-bined z scores are shown in figure 3.
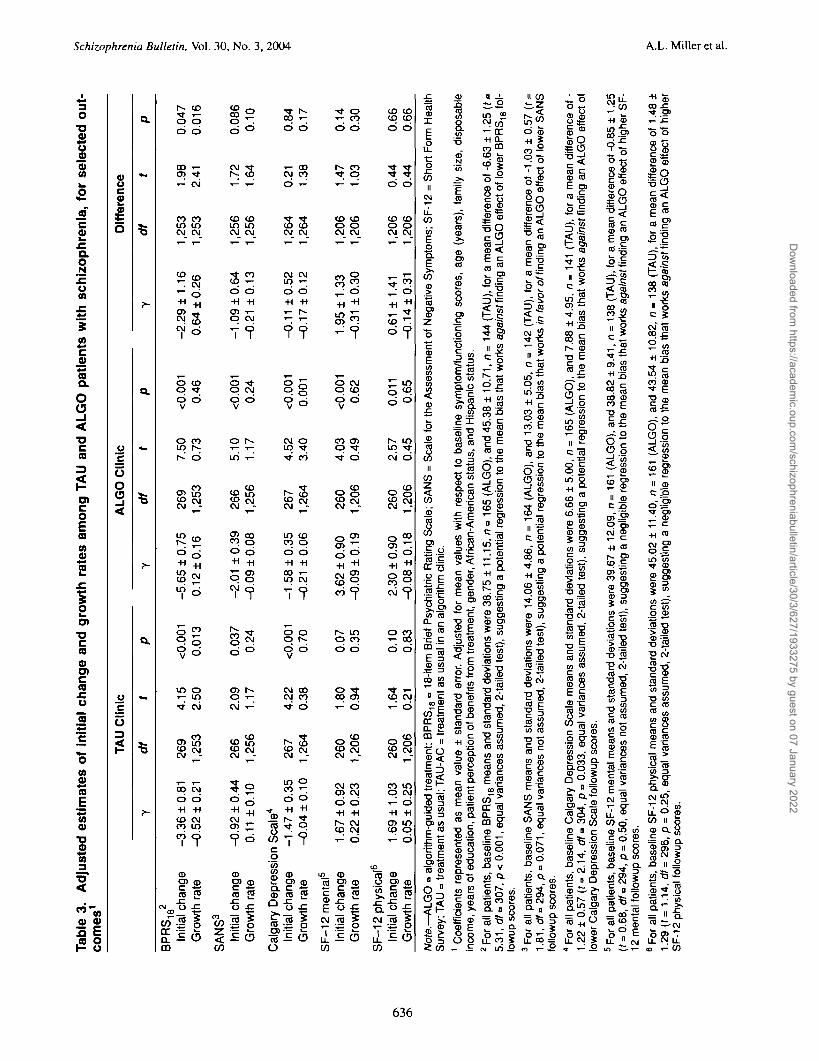
The TAU-AC group allowed secondary comparisonswith ALGO that could be compared with the results ofALGO comparisons with TAU. Secondary symptom com-parisons of the ALGO group with the TAU-AC group aresummarized in table 6. The greater initial decline inBPRS)8 score in the ALGO group was not found in thiscomparison, although significant initial effects favoringimprovement in the ALGO group were noted on the SF-12 mental and physical.
The greater improvements in cognitive function inthe ALGO group, found in the primary comparison, werereplicated in the comparison with the TAU-AC group.The z scores and differences between groups are shown intable 7.
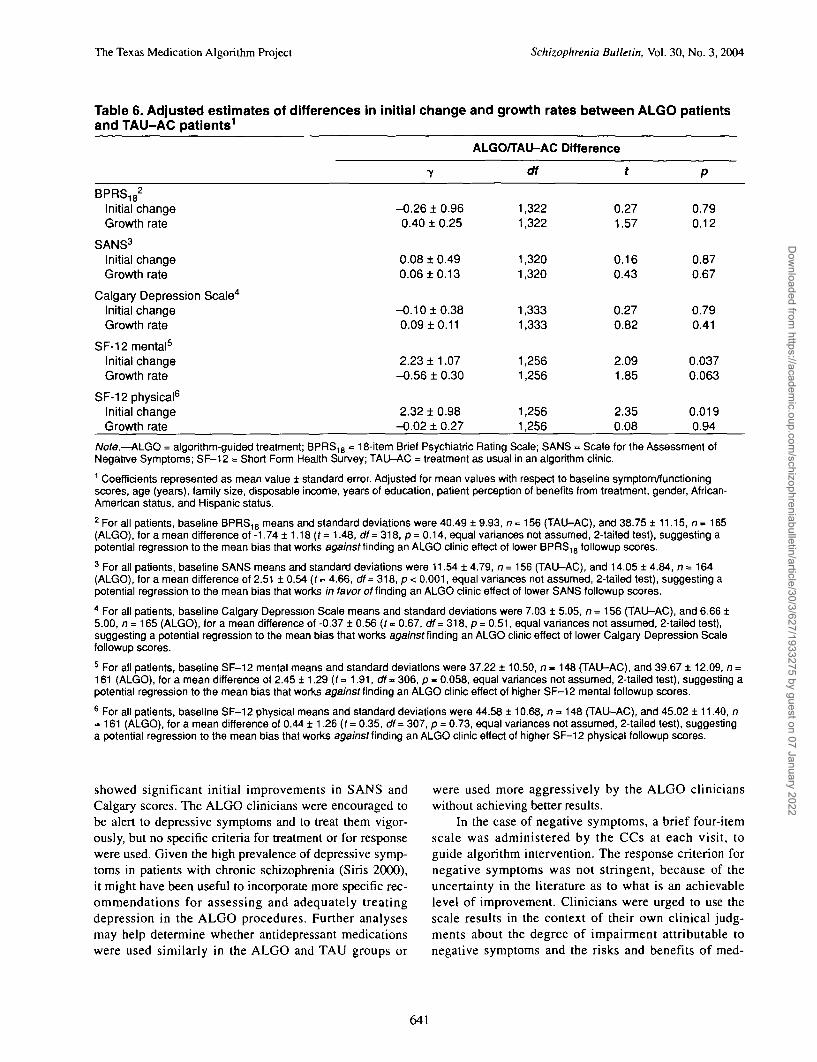
ALGO and TAU groups differed with respect tophysician behaviors that reflected the impact of ALGOimplementation. ALGO patients had more medicationchanges and more medication visits, especially in the firstquarter (table 8). The frequency of using different antipsy-chotics varied between groups and across time (table 9).Average doses were similar in most instances, with higherdoses of olanzapine in the ALGO group being the onlysignificant difference.
633
Dow
nloaded from https://academ
ic.oup.com/schizophreniabulletin/article/30/3/627/1933275 by guest on 07 January 2022

Schizophrenia Bulletin, Vol. 30, No. 3, 2004 A.L. Miller et al.
Table 1. Schizophrenia patients: Demographic characteristics assessed at baseline by treatmentgroup
Characteristic
Age, mean l SD (yrs)
Age, % (yrs)<rl920-2930-3940-4950-5960-69£70
Female, %
Ethnicity, %African-AmericanHispanicCaucasianOtherHigh school graduate
(or GED), %
Yrs in school, mean l SD
Marital status, %DivorcedMarriedSingle (never married)SeparatedWidowed
Employment, %Full-timePart-timeUnemployed
Receiving financialassistance, %2
Receiving Medicaid, %
Family size, mean i SD
Living alone, %
Disposable monthly income,mean ± SD3
Length of illness, mean1 SD (yrs)
Schizoaffective disorder(not bipolar), %
Significant medication sideeffect burden, %
Concurrent alcoholproblems, %4
Concurrent drug problems, %5
ALGO(n=165)
40.6110.7
1.812.336.230.714.13.71.2
38.8
18.251.529.70.6
61.8
10.713.0
20.216.055.85.52.5
4.89.7
85.5
62.4
70.3
2.5 1 2.2
14.6
439.7 1 444.4
15.8110.8
27.9
39.6
25.2
6.7
TAU(n=144)
41.2110.4
1.413.228.534.718.83.50.0
34.0
11.149.337.52.1
66.7
10.813.2
16.910.661.37.73.5
3.89.8
86.5
68.1
62.5
1.812.1
31.3
254.6 1 227.3
18.7111.1
27.8
45.1
34.7
8.4
TAU-AC(n=156)
41.0110.8
0.614.328.634.416.94.50.6
43.6
19.536.442.91.3
63.6
11.1 13.2
19.013.752.911.13.3
1.99.189.0
58.3
71.2
1.911.6
20.8
367.4 1 332.8
17.6110.7
23.1
35.7
57.5
11.3
Statistic
F(2,460) = 0.1
X2(12) = 6.2
X2(2) = 2.9
X2(6) = 13.4
X*(2) = 0.8
F(2,459) = 0.5
x2(8) = 6.7
X2(4) = 2.1
X2(2) = 3.0
X2(2) = 3.1
F(2,460) = 6.4
x2(2) = 12.6
F(2,429) = 10.0
F(2,461) = 2.8
X2(2)=1-2
X2(2) = 2.7
x2(2) = 36.3
X2(2) = 2.0
P
0.87
0.91
0.24
0.038
0.67
0.61
0.57
0.72
0.22
0.21
0.002
0.002
<0.001
0.02
0.55
0.26
<0.001
0.36
634
Dow
nloaded from https://academ
ic.oup.com/schizophreniabulletin/article/30/3/627/1933275 by guest on 07 January 2022

The Texas Medication Algorithm Project Schizophrenia Bulletin, Vol. 30, No. 3, 2004
Table 1. Schizophrenia patients: Demographic characteristics assessed at baseline by treatmentgroup—continued
Characteristic ALGO(n = 165)
TAU(n=144)
TAU-AC(n=156)
Statistic
56.320.810.412.5
42.928.216.712.2
Concurrent medical conditions, % X2(6) = 8.0 0.24None 43.61 27.32 14.53+ 14.5
Patient Perception of Benefitsscore, mean ± SD6 21.1 ±6.5 20.5 ± 6.7 21.8 ±7.9 F(2,457) = 1.3 0.28
Note.—ALGO = algorithm-guided treatment; SD = standard deviation; TAU - treatment as usual; TAU-AC = treatment as usual in analgorithm clinic.1 2 x 2 using chi-square with continuity correction.2 Includes food stamps.3 Total monthly income minus rent or mortgage payment.4 Scores of £5 indicate alcoholism on the Michigan Alcoholism Screening Test (Selzer 1971).5 Scores >5 indicate drug problems on the Drug Abuse Screening Test (Skinner 1982).6 Patient Perception of Benefits is a 10-item questionnaire ranging in score from 10 to 50, where 10 indicates that patients strongly agreeand 50 indicates that patients strongly disagree that they will obtain improved functioning if they get the care they need.
Table 2. BPRS18 scores at baseline and 3, 6, 9, and 12 months1
Time (mos)
Baseline
3
6
9
12
Group
ALGO
TAU
TAU-AC
ALGO
TAU
TAU-AC
ALGO
TAU
TAU-AC
ALGO
TAU
TAU-AC
ALGO
TAU
TAU-AC
n
165
144
156
159
140
152
149
130
141
141
127
140
134
119
133
Mean BPRS18
38.75
45.38
40.49
33.89
39.24
36.90
35.16
39.42
35.68
34.72
39.05
35.20
34.05
37.65
35.63
SD
11.15
10.71
9.93
9.95
9.94
9.34
11.47
11.84
9.97
10.56
11.60
9.67
10.70
10.30
11.17
Note.—ALGO » algorithm-guided treatment; BPRS18 = 18-item Brief Psychiatric Rating Scale; SD - standard deviation; TAU = treat-ment as usual; TAU-AC «treatment as usual in an algorithm clinic.1 Values shown are unadjusted BPRS)8 scores and SDs for each subject group at the times noted. For analytic purposes, scores wereadjusted for baseline patient characteristics as described in Methods.
635
Dow
nloaded from https://academ
ic.oup.com/schizophreniabulletin/article/30/3/627/1933275 by guest on 07 January 2022
Tab
le 3
. A
dju
ste
d e
sti
ma
tes
of
init
ial
ch
an
ge
an
d g
row
th r
ate
s a
mo
ng
TA
U a
nd
AL
GO
pati
en
ts w
ith
sc
hiz
op
hre
nia
, fo
r s
ele
cte
d o
ut-
com
es1
BP
RS
18
2
Initi
al c
hang
eG
row
th r
ate
SA
NS
3
Initi
al c
hang
eG
row
th r
ate
y
-3.3
6 ±
0.8
1-0
.52
± 0
.21
-0.9
2 ±
0.4
40.
11 ±
0.1
0
Cal
gary
Dep
ress
ion
Sca
le4
Initi
al c
hang
eG
row
th r
ate
SF
-12
men
tal5
Initi
al c
hang
eG
row
th r
ate
SF
-12
phys
ical
6
Initi
al c
hang
eG
row
th r
ate
-1.4
7 ±
0.3
5-0
.04
±0
.10
1.67
±0
.92
0.22
± 0
.23
1.69
± 1
.03
0.05
± 0
.25
df 269
1,25
3
266
1,25
6
267
1,26
4
260
1,20
6
260
1,20
6
t
4.15
2.50
2.09
1.17
4.22
0.38
1.80
0.94
1.64
0.21
P
<0.0
010.
013
0.03
70.
24
<0.0
010.
70
0.07
0.35
0.10
0.83
-5.6
50.
12
-2.0
1-0
.09
-1.5
8-0
.21
3.62
-0.0
9
2.30
-0.0
8
7 ±0
.75
±0
.16
±0
.39
±0
.08
±0
.35
±0
.06
±0
.90
±0
.19
±0
.90
±0
.18
df 269
1,25
3
266
1,25
6
267
1,26
4
260
1,20
6
260
1,20
6
t
7.50
0.73
5.10
1.17
4.52
3.40
4.03
0.49
2.57
0.45
P
<0.0
010.
46
<0.0
010.
24
<0.0
010.
001
<0.0
010.
62
0.01
10.
65
-2.2
90.
64
-1.0
9-0
.21
-0.1
1-0
.17
1.95
-0.3
1
0.61
-0.1
4
7 ±1
.16
±0
.26
±0
.64
±0
.13
±0
.52
±0
.12
±1
.33
±0
.30
±1
.41
±0
.31
1 1 1 1 1 1 1 1 1 1
df ,253
,253
,256
,256
,264
,264
,206
,206
,206
,206
t
1.98
2.41
1.72
1.64
0.21
1.38
1.47
1.03
0.44
0.44
P
0.04
70.
016
0.08
60.
10
0.84
0.17
0.14
0.30
0.66
0.66
iT
AU
Clin
ic
AL
GO
Clin
ic
Dif
fere
nce
3 I- to 5" £ © p
Not
e.—
ALG
O •»
alg
orith
m-g
uide
d tr
eatm
ent;
BP
RS
18
= 1
8-ite
m B
rief
Psy
chia
tric
Rat
ing
Sca
le;
SA
NS
= S
cale
for
the
Ass
essm
ent
of
Neg
ativ
e S
ympt
oms;
SF
-12
= S
hort
For
m H
ealth
Sur
vey;
TA
U =
trea
tmen
t as
usua
l; T
AU
-AC
= tr
eatm
ent
as
usua
l in a
n a
lgor
ithm
clin
ic.
1 Coe
ffici
ents
rep
rese
nted
as
mea
n va
lue
± s
tand
ard
erro
r. A
djus
ted
for
mea
n va
lues
with
res
pect
to
bas
elin
e sy
mpt
om/fu
nctio
ning
sco
res,
age
(ye
ars)
, fa
mily
siz
e, d
ispo
sabl
ein
com
e, y
ears
of e
duca
tion,
pat
ient
per
cept
ion
of b
enef
its fr
om t
reat
men
t, ge
nder
, Afr
ican
-Am
eric
an s
tatu
s, a
nd H
ispa
nic
stat
us.
2 For
all
patie
nts,
bas
elin
e B
PR
S1
8 m
eans
and
sta
ndar
d de
viat
ions
wer
e 38
.75
± 1
1.15
, n°
165
(ALG
O),
and
45.
38 ±
10.
71,
n=
144
(T
AU
), for a
mea
n di
ffere
nce
of-
6.6
3 ± 1
.25 (
f»5.
31,
df"
30
7, p
< 0
.001
, eq
ual v
aria
nces
ass
umed
, 2-t
aile
d te
st),
sug
gest
ing
a p
oten
tial r
egre
ssio
n to
the
mea
n bi
as t
hat
wor
ks a
gain
st f
indi
ng a
n A
LGO
effe
ct o
f lo
wer
BP
RS
18
fol-
low
up s
core
s.3 F
or a
ll pa
tient
s, b
asel
ine
SA
NS
mea
ns a
nd
sta
ndar
d de
viat
ions
wer
e 14
.06
± 4
.86,
n =
164
(ALG
O), a
nd
13.
03 ±
5.0
5, n
= 1
42
(TA
U), f
or
a m
ean
diffe
renc
e of
-1.0
3 ± 0
.57 (t =
1.81
, d
f**
294,
p =
0.0
71,
equa
l var
ianc
es n
ot
assu
med
, 2-t
aile
d te
st),
sug
gest
ing
a p
oten
tial r
egre
ssio
n to
the
mea
n bi
as th
at w
orks
/n
faiw
of f
indi
ng a
n A
LGO
effe
ct o
f low
er S
AN
Sfo
llow
up s
core
s.4 F
or a
ll pa
tient
s, b
asel
ine
Cal
gary
Dep
ress
ion
Sca
le m
eans
and
sta
ndar
d de
viat
ions
wer
e 6.6
6 ±
5.0
0, n
= 1
65 (A
LGO
), a
nd 7
.88 ±
4.9
5, n
-
141
(TA
U), for
a m
ean
diffe
renc
e of -
1.22
± 0
.57 (
(= 2
.14,
df"
30
4, p
= 0
.033
, eq
ual v
aria
nces
ass
umed
, 2-
taile
d te
st),
sug
gest
ing
a p
oten
tial
regr
essi
on t
o th
e m
ean
bias
tha
t w
orks
aga
inst
fin
ding
an
ALG
O e
ffect
of
low
er C
alga
ry D
epre
ssio
n S
cale
fol
low
up s
core
s.5 F
or a
ll pa
tient
s, b
asel
ine
SF
-12
men
tal m
eans
and
sta
ndar
d de
viat
ions
wer
e 39
.67
± 1
2.09
, n =
161
(A
LGO
), a
nd 3
8.82
± 9
.41,
n =
138
(T
AU
), fo
r a m
ean
diffe
renc
e of -
0.85
± 1
.25
(f =
0.6
8, o
¥= 2
94, p
= 0
.50,
equ
al v
aria
nces
not
assu
med
, 2-
taile
d te
st),
sug
gest
ing
a n
eglig
ible
reg
ress
ion
to th
e m
ean
bias
tha
t w
orks
aga
inst
find
ing
an A
LGO
effe
ct o
f hi
gher
SF
-12
men
tal f
ollo
wup
sco
res.
6 For
all
patie
nts,
bas
elin
e S
F-1
2 ph
ysic
al m
eans
and
sta
ndar
d de
viat
ions
wer
e 45
.02
± 1
1.40
, n =
161
(A
LGO
), a
nd 4
3.54
± 1
0.82
, n -
138
(TA
U), for
a m
ean
diffe
renc
e of
1.48
±
>1.
29 (
f =
1.1
4, d
f= 2
96, p
= 0
.25,
equ
al v
aria
nces
ass
umed
, 2-
taile
d te
st),
sug
gest
ing
a n
eglig
ible
reg
ress
ion
to th
e m
ean
bias
tha
t w
orks
aga
inst
fin
ding
an
ALG
O e
ffect
of
high
er
!""
SF
-12
phys
ical
fol
low
up s
core
s.
2 S EL
Dow
nloaded from https://academ
ic.oup.com/schizophreniabulletin/article/30/3/627/1933275 by guest on 07 January 2022

The Texas Medication Algorithm Project Schizophrenia Bulletin, Vol. 30, No. 3, 2004
Figure 2. Adjusted Mmean Ssymptoms (BPRS18): ALGO and TAU Groups
55-i
50-
co
0Q
45-
240-35-
30
25
-•-TAU(n=144)
-*-ALGO(n=165)
Baseline 1 2 3
Quarter
Note.—ALGO •= algorithm-guided treatment; TAU •= treatment as usual.
The likelihood of rinding documentation in the chartof an active order for an antipsychotic was 94 percent inthe ALGO group and 51 percent in the TAU group. Thelow number in the TAU group does not necessarily meanthat the patients were not taking an antipsychotic but doesmean that half the time there was insufficient informationin the chart to conclude or infer that patients had enoughantipsychotic medication to last until the next clinic visit.
Discussion
The results indicate some advantages of ALGO comparedwith TAU in the treatment of schizophrenia and schizoaf-fective disorder, but the differences are not uniform acrosstime or across outcome domain. This discussion willfocus first on the primary comparisons between theALGO intervention and TAU in clinics not using anyALGO interventions. The possible implications of theresults in the secondary TAU group, those seen in clinicsusing ALGO for another disorder, will then be discussed.
The magnitude of the symptom changes found in thisstudy of a population of typical public mental healthpatients was not large, in either the ALGO condition orthe TAU condition. There are surprisingly few studies oflong-term symptom outcomes in schizophrenia outpa-tients with which our results can be compared. In recentyears, since the advent of the atypical antipsychotics,most long-term studies using active comparators havebeen extensions of inpatient acute intervention studies.The pool of patients recruited into these extension studies
is quite different from the pool of outpatients in our study,as the former is selected for those already known to havebenefited from the inpatient treatment.
In a large multinational study comparing olanzapinewith haloperidol treatment of outpatients with schizophre-nia, Tollefson et al. (1997) found that observed casedecreases in BPRS18 scores at 6 weeks were 15.0 and 12.7points, respectively, beginning with mean baseline valuesof 51 to 52. The differences were statistically significant ina repeated measures analysis. The dropout rates were 30 to50 percent. In our study, the decreases at 3 months were5.65 and 3.36 in the ALGO and TAU groups, respectively,beginning with adjusted mean values of 42 (table 3). Thedropout rates were less than 10 percent. Thus, the overallimprovements were greater in the olanzapine study, but thisdifference may be partly attributable to different dropoutrates and more symptomatic patients at baseline. The differ-ence between the active treatment groups, 2.3 BPRS scalepoints, was identical in the two studies.
The magnitude of symptom changes observed in theBPRS18 in the current study can also be viewed in com-parison with another longer term outpatient study. Arecently published study of maintenance outpatient treat-ment for schizophrenia with risperidone or haloperidolfound that the rate of relapse was lower with risperidone(Csernansky et al. 2002). Using endpoint values, scoreson the Positive and Negative Syndrome Scale (Kay et al.1987) decreased, on average, 3.1 points in the risperidonegroup and rose, on average, 2.8 points in the haloperidolgroup, starting with baseline values of 65 and 67, respec-
637
Dow
nloaded from https://academ
ic.oup.com/schizophreniabulletin/article/30/3/627/1933275 by guest on 07 January 2022

Schizophrenia Bulletin, Vol. 30, No. 3, 2004 A.L. Miller et al.
Table 4. Mean cognitive function test scores, all groups1
Test
Trails A
Trails B
Verbal Fluency(letters)
Verbal Fluency(categories)
Hopkins VerbalLearning Test
Group
ALGO
TAU
TAU-AC
ALGO
TAU
TAU-AC
ALGO
TAU
TAU-AC
ALGO
TAU
TAU-AC
ALGO
TAU
TAU-AC
Baseline
79.0 (58.9)(n=158)
75.3 (48.2)(n= 134)
67.4 (43.7)(n=138)
169.9(91.9)(/7= 158)
168.4(86.8)(n=134)
134.4(68.2)(AJ= 139)
24.9(12.5)(n=158)
26.8(11.0)(n=138)
25.6(13.0)(n=152)
17.3(7.2)(n=>159)
18.4(6.0)(n=137)
18.7(8.0)(n=153)
15.0(6.5)(n=158)
15.1 (6.1)(n=138)
14.2(6.2)(n=152)
3 mos
64.6 (44.7)(n=148)
75.9 (58.4)(no 132)
62.4(47.1)(n=141)
152.8(89.1)(n=148)
151.2(80.8)(n=132)
133.7(81.8)(n=141)
26.8(12.4)(n=154)
26.9(11.5)(n=135)
26.9(13.6)(n=151)
19.1 (7.5)(n=155)
19.0(7.2)(n=137)
19.3(7.9)(n=151)
16.6(6.7)(n=154)
16.2(6.4)(n=136)
15.6(6.7)(n=151)
9 mos
61.5(42.1)(n=127)
66.4 (50.0)(n=113)
60.4(50.1)(n=124)
143.4(82.8)(n=127)
152.1 (86.9)(n=113)
134.0(80.6)(n=124)
28.3(13.2)(n=128)
26.1 (12.1)(n=117)
26.2(12.9)(n=137)
19.6(7.4)(n=131)
18.2(7.3)(n=117)
18.2(8.1)(n=137)
17.2(6.7)(n=130)
16.1 (6.6)(n=116)
16.4(7.2)(n=137)
Note.—ALGO = algorithm-guided treatment; TAU - treatment as usual; TAU-AC •= treatment as usual in an algorithm clinic.1 Values shown are mean (standard deviation) for each test and group at the times noted. For analytic purposes, scores were adjusted forbaseline patient characteristics as described in Methods.
tively. In our study, the 12-month decreases in BPRS18
scores were 5.3 and 4.9 points in the ALGO and TAUgroups, respectively. Because of very different entry crite-ria and rates of dropout, and because early endpoint val-ues are handled differently in our HLM analyses than inlast observation carried forward (endpoint) analyses, theresults of the two studies are not directly comparable.Nonetheless, both studies indicate that, over the course ofa year, overall reductions in symptomatology are modest,whether patients are followed in research centers (as in
the Csernansky et al. [2002] study) or in public mentalhealth clinics (as in this study). Much more dramaticeffects might have been found by enrolling acutely exac-erbated inpatients. This was not done because our prelimi-nary studies found that influencing inpatient medicationmanagement and coordinating the transition of medicationuse from inpatient to outpatient status was extraordinarilydifficult in our system.
Figure 2 shows that from 3 to 12 months the TAUpatients had further significant improvements in BPRSlg
638
Dow
nloaded from https://academ
ic.oup.com/schizophreniabulletin/article/30/3/627/1933275 by guest on 07 January 2022

Tab
le 5
. A
dju
sted
ch
ang
e sc
ore
s In
co
gn
itiv
e fu
nct
ion
ing a
t fi
rst
an
d th
ird
qu
arte
r p
ost
bas
elin
e fo
r A
LG
O a
nd
TA
U p
atie
nts
wit
hsc
hiz
op
hre
nia
1
ON \o
First
quart
er
TM
T-A
(In
sees)
TM
T-A
(se
es)
TM
T-B
(In
sees)
TM
T-B
(se
es)
VF
T (
cate
go
ries
)V
FT
(le
tters
)H
VLT
Tota
l z s
core
cha
ng
e
Th
ird q
uart
er
TM
T-A
(In
sees)
TM
T-A
(se
es)
TM
T-B
(In
sees)
TM
T-B
(se
es)
VF
T (
cate
go
ries
)V
FT
(le
tters
)H
VLT
Tota
l z
score
cha
ng
e
y
-0.0
2 ±
0.0
4-1
.5-0
.11 ±
0.0
4-1
5.0
0.5
9 ±
0.3
9-0
.44 ±
0.6
61
.16
±0
.44
0.2
6 ±
0.1
2
-0.1
4 ±
0.0
4-8
.6-0
.13 ±
0.0
4-1
7.3
0.3
3 ±
0.4
8-0
.35 ±
0.7
01.
22 ±
0.4
6
0.3
8 ±
0.1
3
TA
U
df
23
7
237
251
249
25
0
232
203
203
21
4213
212
199
t
-0.6
-2.8
1.5
-0.6
2.6
2.3
-3.8
-2.8
0.7
-0.5
2.6
2.9
P
0.5
2
0.0
05
0.1
30.5
10.0
08
0.0
22
<0.0
01
0.0
05
0.4
90.6
10.0
08
0.0
04
y
-0.1
9 ±
0.0
4-1
1.4
-0.1
2 ±
0.0
4-1
6.0
1.75
±0
.45
2.2
9 ±
0.7
31.
40 ±
0.4
5
0.7
3 ±
0.1
2
-0.2
5 ±
0.0
5-1
4.2
-0.2
0 ±
0.0
4-2
5.9
2.2
4 ±
0.4
62.9
2 ±
0.8
52.1
6 ±
0.5
4
0.9
8 ±
0.1
6
AL
GO
df
23
7
237
251
249
25
0
232
203
203
214
213
212
199
t
-5.0
-2.7
3.9 3.1
3.1 5.9
-5.4
-4.3
4.9
3.4
4.0
6.2
P
<0.0
01
0.0
07
<0.0
01
0.0
02
0.0
02
<0.0
01
<0.0
01
<0.0
01
<0.0
01
0.0
01
<0.0
01
<0.0
01
y
-0.1
7 ±
0.0
6-9
.8-0
.01 ±
0.0
6-1
.51.
16 ±
0.6
22.7
3 ±
1.0
50.2
4 ±
0.6
6
0.4
6 ±
0.1
8
-0.1
1 ±
0.0
7-5
.6-0
.07 ±
0.0
7-8
.61.
91 ±
0.6
83.2
7 ±
1.1
20.9
4 ±
0.7
4
0.6
0 ±
0.2
2
Dif
fere
nce
df
23
7
23
7
251
249
25
0
232
203
203
214
213
212
199
t
-3.0
0
-0.2
1.9
2.6
0.4 2.6
-1.6
-1.0
2.8
2.9 1.3
2.7
P
.003
0.8
5
0.0
60.0
10
0.7
2
0.0
09
0.1
1
0.3
0
0.0
05
0.0
04
0.2
1
0.0
07
xas N P B.
Q3 o 1" I 2
Not
e.—
ALG
O
- al
gori
thm
-gui
ded
trea
tmen
t; H
VLT
= H
opki
ns V
erba
l Le
arni
ng T
est;
TA
U -
tre
atm
ent
as
usua
l, T
MT
-A =
Tra
il M
akin
g Te
st,
Par
t A; T
MT
-B °
Tra
il M
akin
g Te
st,
Par
t B;
VF
T =
Ver
bal
Flu
ency
Tes
t.1 C
oeff
icie
nts
repr
esen
ted
as
mea
n ±
sta
ndar
d er
ror.
The
TM
T-A
and
TM
T-B
val
ues
(in
seco
nds)
wer
e co
nver
ted
to n
atur
al l
ogar
ithm
s (In
) fo
r st
atis
tical
ana
lyse
s. T
he v
alue
s sh
own
are
the
chan
ges
In th
e tim
e to
per
form
th
e ta
sk (
In v
alue
s) a
nd
the
chan
ges
conv
erte
d in
to s
econ
ds a
s e
xp (
g) ¥
exp
(bas
elin
e m
ean)
- e
xp (
base
line
mea
n).
Z s
core
s w
ere
com
- #
pute
d fo
r ea
ch o
f th
e th
ree
test
s a
nd
sum
med
. Th
e va
lues
sho
wn
are
for t
he c
hang
es i
n s
um z
sco
res.
Mea
n va
lues
wer
e ad
just
ed w
ith r
espe
ct t
o ba
selin
e B
PR
S1
8 sc
ore,
len
gth
of
2:
illne
ss (
year
s),
fam
ily s
ize,
dis
posa
ble
inco
me,
yea
rs o
f edu
catio
n, P
atie
nt P
erce
ptio
n o
f B
enef
its t
otal
sco
re,
an
d et
hnic
ity (
Afr
ican
-Am
eric
an a
nd
His
pani
c).
Sam
ple
size
s fo
r fir
st
.gqu
arte
r T
MT
-A a
nd T
MT
-B (
ALG
O:
n -
12
8; T
AU
: n =
120
); V
FT
(cat
egor
ies)
(A
LGO
: n =
136
; TA
U:
n =
126
); V
FT
(let
ters
) (A
LGO
: n -
13
5; T
AU
: n -
12
5);
HV
LT (
ALG
O:
n =
13
5;
a-
TA
U:
n-
126)
; and
z s
core
(A
LGO
: n-
126;
TA
U: n
= 1
17).
Sam
ple
size
s fo
r thi
rd q
uart
er T
MT
-A a
nd T
MT
-B (
ALG
O: n =
111
; TA
U: n
= 1
03);
VF
T (c
ateg
orie
s) (
AL
GO
:n=
117;
TA
U:
|n
= 1
08);
VF
T (le
tters
) (A
LGO
: 0
=1
15
; T
AU
: n -
109
); H
VLT
(A
LGO
: n
~ 1
15; T
AU
: n =
108
); a
nd z
sco
re (
ALG
O: n -
108;
TA
U: n
- 10
2).
Fo
r all
patie
nts,
bas
elin
e In
(T
MT
-A)
scor
es
5'
wer
e 4
.2 ±
0.6
(A
LGO
) a
nd
4.2
± 0
.5 (
TAU
) fo
r a
mea
n di
ffer
ence
of 0
.004
2 ±
0.5
(f-
0.1
, df-
29
0, p
° 0
.95,
equ
al v
aria
nces
ass
umed
, 2-
taile
d te
st).
Bas
elin
e In
(TM
T-B
) sc
ores
g>
wer
e 5
.0 ±
0.6
(A
LGO
) a
nd
5.0
± 0
.6 (
TAU
) fo
r a m
ean
diff
eren
ce o
f -0
.01
± 0
.6 (
f = -
0.2
, df =
290
, p =
0.8
9, e
qual
var
ianc
es a
ssum
ed,
2-ta
lled
test
). B
asel
ine
VF
T (c
ateg
orie
s)
jfsc
ores
wer
e 17
.3 ±
7.2
(ALG
O)
and
18.
4 ± 6
.0 (T
AU
) fo
r a
mea
n di
ffere
nce
of -
1.1
± 6
.7 (f =
-1
.4,
df<
= 2
93, p
- 0
.15,
equ
al v
aria
nces
not a
ssum
ed, 2
-tai
led
test
). B
asel
ine
VF
T (
let-
».
ters
) sc
ores
wer
e 24
.9 ±
12.5
(ALG
O)
and
26.
8 ±
11
.0 (
TAU
) fo
r a
mea
n di
ffere
nce
of -1
.9 ±
11.
8 (t
= -
1.4
, df"
29
4, p
•= 0
.16,
equ
al v
aria
nces
ass
umed
, 2-
taile
d te
st).
Bas
elin
e ^
HV
LT s
core
s w
ere
15.0
±6
.5 (A
LGO
) an
d 15
.1 ±
6.1
(TA
U)
fora
mea
n di
ffere
nce
of -
0.1
± 6
.3 (f =
-0
.2,
df-
29
4, p
-0.8
4,
equa
l var
ianc
es a
ssum
ed,
2-ta
iled
test
). B
asel
ine
tota
l z
gsc
ores
we
re-0
.2
±2
.5 (A
LGO
) an
d 0.
1 ±
2.1
(TA
U)
for a
mea
n di
ffere
nce
of-
0.3
± 2
.3 (f =
—1.
0, d
f' 28
5, p
= 0
.30,
equ
al v
aria
nces
not
ass
umed
, 2-t
aile
d te
st).
The
se b
asel
ine
drf-
^fe
renc
es s
ugge
st r
egre
ssio
n to
the
mea
n bi
ases
tha
t ei
ther
are
neg
ligib
le o
r wor
k ag
ains
t fin
ding
an
ALG
O e
ffect
. P o
Dow
nloaded from https://academ
ic.oup.com/schizophreniabulletin/article/30/3/627/1933275 by guest on 07 January 2022

Schizophrenia Bulletin, Vol. 30, No. 3, 2004 A.L. Miller et al.
Figure 3. Sum of cognitive test scores (z scores): ALGO and TAU Ggroups
2 i
••••TAU (n= 122)
-*-ALGO (n=137)
Baseline 3 Months 9 Months
Note.—ALGO - algorithm-guided treatment; TAU = treatment as usual.
scores and caught up with the ALGO patients. The factthat ALGO patients did not evidence further improvementhas multiple possible explanations, some of which may beable to be evaluated with further analyses. Because theALGO approach encouraged the treatment team to seek ahigh level of symptom response, particularly in terms ofreduction in positive symptoms, the lack of a betterresponse in this condition over the longer term couldmean that maximum benefit had already been achieved(ceiling effect) in this seriously and chronically ill patientpopulation, or it could signify that the ALGO clinicianswere sufficiently satisfied with the initial responses thatthey chose not to strive for further symptom reductionwith subsequent medication changes. Unidentified factorsin the service delivery system could have made it difficultfor the physicians to deliver more assertive treatment.Further analyses of ALGO physician adherence to thealgorithm's criteria for adequacy of response may helpresolve these questions.
Analyses of the impact of adherence to the interven-tion package are, unfortunately, not straightforward. It ismuch easier to adhere to guidance with respect to dosing,visit frequency, switching medications, and so on withcooperative and responsive patients than with uncoopera-tive or nonresponsive patients. Therefore, a strong rela-tionship of adherence to the intervention package withgood outcomes can be the result of good patient outcomesmaking adherence to the recommendations easier, ratherthan good adherence making patient outcomes better.
The results presented in tables 8 and 9 do indicatethat ALGO physicians saw their patients more frequentlyfor medication visits, made more antipsychotic medica-
tion changes, and had different prescribing profiles, ascompared with their TAU counterparts. Moreover, ALGOphysicians were much more likely to have active medica-tion orders in their charts. Thus, ALGO implementationdid affect important physician behaviors.
The presence of CCs in the clinics to assist physi-cians in caring for ALGO patients undoubtedly affectedphysicians' willingness to consider medication changesfor patients with less severe symptoms or side effects.Thus, enrollment of patients in ALGO clinics was rapid,whereas the rate of medication changes in TAU clinicswas so slow that it became clear that these physiciansmust be using different criteria for medication changesthan physicians in ALGO clinics. The change in ALGOclinic culture was desirable, in terms of the goals of theintervention, but resulted in baseline differences betweenpatient groups that could have confounded the compar-isons between ALGO and TAU. If one disregards theTAU data and, instead, examines the data in tables 3 and 5solely from the viewpoint of the impact of the interven-tion on ALGO patients, the picture that emerges is one ofinitial improvements in virtually all measures. Theseimprovements were sustained over time in the symptommeasures (table 3) and increased over time in the cogni-tive measures (table 5). That is, the initial positive effectsof the ALGO intervention did not dissipate, as might havebeen expected if they had resulted from short-term effectsof a novel treatment.
There were no overall significant group differences inchanges in negative symptoms (SANS), depressive symp-toms (Calgary Depression Scale), or patient-rated mentaland physical functioning (SF-12). Both TAU and ALGO
640
Dow
nloaded from https://academ
ic.oup.com/schizophreniabulletin/article/30/3/627/1933275 by guest on 07 January 2022
The Texas Medication Algorithm Project Schizophrenia Bulletin, Vol. 30, No. 3, 2004
Table 6. Adjusted estimates of differences In initial change and growth rates between ALGO patientsand TAU-AC patients1
ALGO/TAU-AC Difference
BPRS1 82
Initial changeGrowth rate
SANS3
Initial changeGrowth rate
Calgary Depression Scale4
Initial changeGrowth rate
SF-12 mental5
Initial changeGrowth rate
SF-12 physical6
Initial changeGrowth rate
Note.—ALGO = algorithm-guided treatment; BPRS18 = 18-item Brief Psychiatric Rating Scale; SANS ° Scale for the Assessment ofNegative Symptoms; SF-12 = Short Form Health Survey; TAU-AC = treatment as usual in an algorithm clinic.1 Coefficients represented as mean value ± standard error. Adjusted for mean values with respect to baseline symptom/functioningscores, age (years), family size, disposable income, years of education, patient perception of benefits from treatment, gender, African-American status, and Hispanic status.2 For all patients, baseline BPRS18 means and standard deviations were 40.49 ± 9.93, n = 156 (TAU-AC), and 38.75 ± 11.15, n - 165(ALGO), fora mean difference of -1.74 ± 1.18 (f = 1.48, df= 318, p = 0.14, equal variances not assumed, 2-tailed test), suggesting apotential regression to the mean bias that works against finding an ALGO clinic effect of lower BPRS18 followup scores.3 For all patients, baseline SANS means and standard deviations were 11.54 ±4.79, n= 156 (TAU-AC), and 14.05 ±4.84, n= 164(ALGO), for a mean difference of 2.51 ± 0.54 (f = 4.66, df= 318, p < 0.001, equal variances not assumed, 2-talled test), suggesting apotential regression to the mean bias that works in favor of finding an ALGO clinic effect of lower SANS followup scores.4 For all patients, baseline Calgary Depression Scale means and standard deviations were 7.03 ± 5.05, n = 156 (TAU-AC), and 6.66 ±5.00, n= 165 (ALGO), for a mean difference of-0.37 ±0.56 ( f -0 .67, df=318, p = 0.51, equal variances not assumed, 2-tailed test),suggesting a potential regression to the mean bias that works against finding an ALGO clinic effect of lower Calgary Depression Scalefollowup scores.5 For all patients, baseline SF-12 mental means and standard deviations were 37.22 ± 10.50, n - 148 (TAU-AC), and 39.67 ± 12.09, n =161 (ALGO), for a mean difference of 2.45 ± 1.29 (f = 1.91, df = 306, p - 0.058, equal variances not assumed, 2-tailed test), suggesting apotential regression to the mean bias that works against finding an ALGO clinic effect of higher SF-12 mental followup scores.
6 For all patients, baseline SF-12 physical means and standard deviations were 44.58 ± 10.68, n= 148 (TAU-AC), and 45.02 ± 11.40, n= 161 (ALGO), fora mean difference of 0.44 ± 1.26 (t = 0.35, df= 307, p = 0.73, equal variances not assumed, 2-tailed test), suggestinga potential regression to the mean bias that works against finding an ALGO clinic effect of higher SF-12 physical followup scores.
-0.26 ± 0.960.40 ± 0.25
0.08 ± 0.490.06 ±0.13
-0.10 ±0.380.09 ±0.11
2.23 ±1.07-0.56 ± 0.30
2.32 ± 0.98-0.02 ± 0.27
df
1,3221,322
1,3201,320
1,3331,333
1,2561,256
1,2561,256
t
0.271.57
0.160.43
0.270.82
2.091.85
2.350.08
P
0.790.12
0.870.67
0.790.41
0.0370.063
0.0190.94
showed significant initial improvements in SANS andCalgary scores. The ALGO clinicians were encouraged tobe alert to depressive symptoms and to treat them vigor-ously, but no specific criteria for treatment or for responsewere used. Given the high prevalence of depressive symp-toms in patients with chronic schizophrenia (Sins 2000),it might have been useful to incorporate more specific rec-ommendations for assessing and adequately treatingdepression in the ALGO procedures. Further analysesmay help determine whether antidepressant medicationswere used similarly in the ALGO and TAU groups or
were used more aggressively by the ALGO clinicianswithout achieving better results.
In the case of negative symptoms, a brief four-itemscale was administered by the CCs at each visit, toguide algorithm intervention. The response criterion fornegative symptoms was not stringent, because of theuncertainty in the literature as to what is an achievablelevel of improvement. Clinicians were urged to use thescale results in the context of their own clinical judg-ments about the degree of impairment attributable tonegative symptoms and the risks and benefits of med-
641
Dow
nloaded from https://academ
ic.oup.com/schizophreniabulletin/article/30/3/627/1933275 by guest on 07 January 2022

Schizophrenia Bulletin, Vol. 30, No. 3, 2004 A.L. Miller et al.
u1
•o
an
lent
patl
O
2,o
c
sell
(0**
OQ .
a>Ca3ex
Ird
nm
fir
CO
filn
gjn
ctl
oi
a>
iltiv
cO)oo"5.aoO)
_cCO
£oo0)
a
uste
d c
rTa
ble
7. A
dj
pat
ien
ts1
8ico
oo
o
<
-
Q.
CO
sd
pc\i
o-H
oV
CM
d+1or
OJoo
CO
CO
COCO
oo• < *
O
O> 00
CO i -
<7) 00cvj a>
oo
o+)COCOd
o+1CO
d
— CD i3 _S D> o ao c *- CT^^ CO t -T COm - C CD -C
m CD « ®
i= N
m
o
£ £1i-:
(D'Q O
< e £ a
& (D C
l
O T= ^ CD
2 S § |
•g ! i « !Jos>as
| l 2 ?35 „ t: <NCD c co f-;
•o ? 2 .°
c co >- s> ^:Q) CD O Q. j
. E "O ^ E ^ -H
& « lW CD
•I fa. "Z'•g « =
Ia.
00 P O 5 -H'a ® 5 CT°H
C/5^ CO ^ • = ^
DC £ - o ^
DD S 5 S O
CD CD
COCD CD .
£ S O N
fiCJ T3I
ication changes targeted at improving negative symp-toms.
The fact that there were greater improvements inoverall cognitive performance in the ALGO group wasespecially interesting because of the growing evidencethat cognitive deficits contribute substantially to the func-tional impairment characteristic of many patients withschizophrenia (Green 1996; Velligan et al. 1997). Abroader battery of tests administered at each quarter withthe other outcome measures would have been desirablebut was not feasible, because of resource limitations andthe burden on patients of extended assessments. TheHopkins Verbal Learning Test was selected because of itsease of administration and its availability in multipleequivalent forms. However, its sensitivity to change inpatients with schizophrenia has not been well demon-strated. This lack of sensitivity could have contributed tothe lack of group differences on this measure in this study.
The time course of improvement was not the samewith each cognitive test, although the overall trend wasfor greater improvements in the ALGO group across time(figure 3). Time to perform the Trails A test decreasedmost in the ALGO compared with the TAU group duringthe initial 3 months. Group differences in improvementson the Verbal Fluency tests (categories, letters) were, onthe other hand, greater over the 9-month period than overthe initial 3 months. This finding suggests a more endur-ing effect of ALGO on this complex measure of initiation,recall, and retrieval than was found in the clinical symp-tom measures.
Because ALGO was a multifaceted intervention, tar-geted mainly toward medication management and symp-tom improvement, it is difficult to ascribe the apparenteffects on cognition to any particular aspect of the inter-vention. The fact that the effect occurred in both groupcomparisons is somewhat reassuring as to its validity, butwe recognize the need for confirmation of the finding infuture studies, as well as the importance of experimentaldesigns that will permit identification of elements of theintervention that influence cognitive test performance.
Regarding the secondary comparisons between theALGO group and the TAU-AC group, results were some-what different than those found in the primary compar-isons, with regard to symptom measures. Significantlygreater improvement in BPRS scores in the ALGO groupduring the first 3 months was not found, but the SF-12mental and physical did improve more in the ALGOgroup during this time period (tables 3 and 6). These dif-ferences are not easily explained. Given the relativelysmall magnitude of the group differences on symptommeasures, however, it may not be too surprising that thesymptom findings were somewhat unstable across com-parison groups.
642
Dow
nloaded from https://academ
ic.oup.com/schizophreniabulletin/article/30/3/627/1933275 by guest on 07 January 2022
The Texas Medication Algorithm Project Schizophrenia Bulletin, Vol. 30, No. 3, 2004
Table 8. Medication changes and visits1
Medicationchanges1
Medicationvisits2
Group
ALGOTAU
ALGOTAU
1
52.419.0
5.67 (2.29)2.76(1.11)
Quarter
2
32.121.5
3.13(1.45)2.05(1.08)
3
23.422.6
2.70(1.39)1.81 (1.03)
4
24.117.4
2.56(1.24)1.57 (0.78)
Note.—ALGO = algorithm-guided treatment; BPRS18 » 18-item Brief Psychiatric Rating Scale; TAU = treatment as usual.1 Unadjusted values shown for medication changes are percentages of patients in each quarter for each group with at least one medica-tion change during the quarter, excluding medication changes at study entry. The data were dichotomized as presence/absence ofchange rather than the number of changes being counted because of the large number of zero changes. A binomial generalized hierar-chical linear model suitable for analyzing dichotomous data was used. The model contained terms for treatment group, quarter in study,and time-by-quarter interaction. The covariates were baseline BPRS18, age, family size, disposable income, years of education, patientperception of benefits, gender, African-American status, and Hispanic status. The treatment group-by-quarter effect was significant (f, 634= 16.3, p< 0.0001).2 Unadjusted values shown for medication visits are mean (standard deviation) for each group over the course of each quarter after studyenrollment. A Poisson generalized hierarchical linear model suitable for analyzing count data was used. The model contained terms fortreatment group, quarter in study, and time-by-quarter interaction. The covariates were baseline BPRS18, age, family size, disposableincome, years of education, patient perception of benefits, gender, African-American status, and Hispanic status. The treatmentgroup-by-quarter effect was significant (f3 %& = 18.2, p < 0.0001).
The cognitive function test results showed a moreconsistent pattern. All groups improved over time, withgreater improvements being sustained in the ALGO com-pared with both of the TAU groups (tables 5 and 7). Thesefindings of greater improvement in cognitive test scores inthe ALGO group are of great interest but should not beoverinterpreted. Further analyses will test whether therewere functional consequences in terms of resource utiliza-tion and need for unscheduled interventions.
One might argue that there was an "algorithm cul-ture" effect that encouraged clinicians using ALGO inter-ventions to be more aggressive in treating residual symp-toms. This could account for the greater initialimprovement in the BPRS in TAU-AC patients than inTAU patients. This conclusion is highly tentative, but itwould be interesting to design future studies that specifi-cally address the "halo effect" of changing the manage-ment of one disorder on management of other disorderstreated by the same clinicians.
This study enrolled outpatients in public mentalhealth clinics. It was not possible to blind clinicians orraters to the group assignments. Moreover, the ALGOclinicians were free to treat each patient as they saw fit,even though they were coached to follow the algorithmmanual. In addition, all patients in the ALGO group were"medication failures" (with regard to efficacy or sideeffects) based on individual physician judgment and had aprimary medication change at study entry, whereaspatients in the TAU group could be enrolled on the basisof either having a primary medication change or having ahigh level of symptomatology.
Thus, our findings reveal outcomes assessed by non-blinded but independent raters and reflect the actual (i.e.,less than perfect) levels of algorithm implementationachieved in participating clinics. It is possible that betterresults might have been found if it had been possible toensure that clinicians always followed the algorithm's rec-ommendations. It is also conceivable that rater bias infavor of ALGO could have influenced the results,although the fact that the research raters were not part ofthe clinical treatment teams makes this less of a concern,as does the observation that group differences in out-comes varied across outcome domains.
Because patients in the ALGO and TAU groups werenot randomly assigned or matched and were chosen onthe basis of somewhat different inclusion criteria, groupdifferences could have affected the results. The statisticalprocedures attempted to control for group differences bycontrolling for selected covariates, including need for ser-vices, predisposing factors, enabling factors, and otherdemographic variables. While caution is recommendedwhen statistical controls are used instead of randomassignment, the changes between unadjusted and adjustedestimates of initial and growth effects were small, indicat-ing that the declining effects model applied to these datais robust.
Last, we wish to reemphasize that the results pre-sented here are for ALGO and TAU as actually imple-mented in these two groups of patients. The results reflectwhat was achieved with relatively modest additionalresources in an underresourced system, using guidelinesthat clinicians likely implemented to varying degrees.
643
Dow
nloaded from https://academ
ic.oup.com/schizophreniabulletin/article/30/3/627/1933275 by guest on 07 January 2022
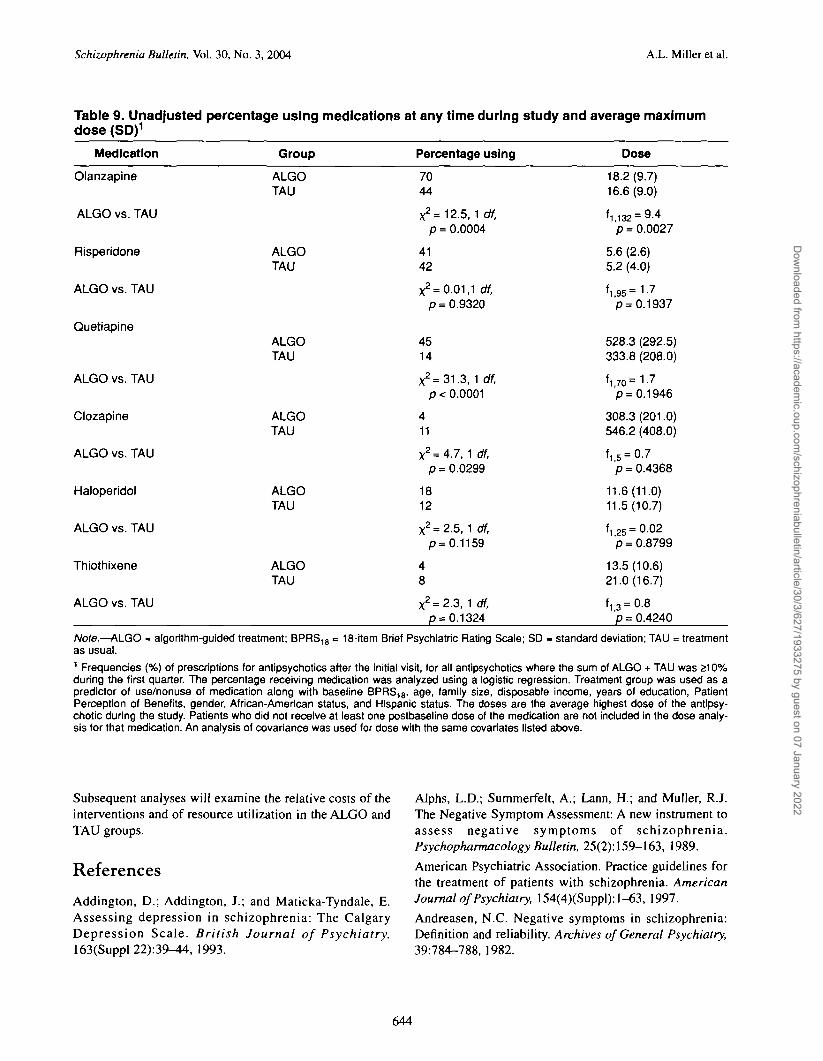
Schizophrenia Bulletin, Vol. 30, No. 3, 2004 A.L. Miller et al.
Table 9. Unadjusted percentage using medications at any time during study and average maximumdose (SD)1
Medication Group
Olanzapine ALGOTAU
ALGO vs. TAU
Risperidone ALGOTAU
ALGO vs. TAU
Quetiapine ALGOTAU
ALGO vs. TAU
Clozapine ALGOTAU
ALGO vs. TAU
Haloperidol ALGOTAU
ALGO vs. TAU
Thiothixene ALGOTAU
ALGO vs. TAU
Percentage using
7044
x2=12.5, 1 df,p = 0.0004
4142
X2= 0.01,1 df,p = 0.9320
4514
X2=31.3, 1 df,p< 0.0001
411
X2 = 4.7, 1 df,p = 0.0299
1812
X2 = 2.5, 1 df,p = 0.1159
48
X2 = 2.3, 1 df,p = 0.1324
Dose
18.2(9.7)16.6(9.0)
11,132 = 9-4p = 0.0027
5.6 (2.6)5.2 (4.0)
'1.95=1-7p = 0.1937
528.3 (292.5)333.8 (208.0)
Vo=1-7
p= 0.1946
308.3 (201.0)546.2 (408.0)
'1.5 = 0.7p = 0.4368
11.6(11.0)11.5(10.7)
'1,25 =0-02p = 0.8799
13.5(10.6)21.0(16.7)
f i 3 = 0.8p = 0.4240
Note.—ALGO - algorithm-guided treatment; BPRS18 = 18-item Brief Psychiatric Rating Scale; SD » standard deviation; TAU = treatmentas usual.1 Frequencies (%) of prescriptions for antipsychotics after the initial visit, for all antipsychotics where the sum of ALGO + TAU was 210%during the first quarter. The percentage receiving medication was analyzed using a logistic regression. Treatment group was used as apredictor of use/nonuse of medication along with baseline BPRS18, age, family size, disposable income, years of education, PatientPerception of Benefits, gender, African-American status, and Hispanic status. The doses are the average highest dose of the antipsy-chotic during the study. Patients who did not receive at least one postbaseiine dose of the medication are not included in the dose analy-sis for that medication. An analysis of covariance was used for dose with the same covariates listed above.
Subsequent analyses will examine the relative costs of the Alphs, L.D.; Summerfelt, A.; Lann, H.; and Muller, R.J.interventions and of resource utilization in the ALGO and The Negative Symptom Assessment: A new instrument toTAU groups. assess negative symptoms of schizophrenia.
Psychopharmacology Bulletin, 25(2): 159-163, 1989.
References American Psychiatric Association. Practice guidelines forthe treatment of patients with schizophrenia. American
Addington, D.; Addington, J.; and Maticka-Tyndale, E. Journal of Psychiatry, 154(4)(Suppl):l-63, 1997.Assessing depression in schizophrenia: The Calgary Andreasen, N.C. Negative symptoms in schizophrenia:Depression Scale. British Journal of Psychiatry, Definition and reliability. Archives of General Psychiatry,163(Suppl 22):39-44, 1993. 39:784-788, 1982.
644
Dow
nloaded from https://academ
ic.oup.com/schizophreniabulletin/article/30/3/627/1933275 by guest on 07 January 2022

The Texas Medication Algorithm Project Schizophrenia Bulletin, Vol. 30, No. 3, 2004
Bauer, M.S. A review of quantitative studies of adherenceto mental health clinical practice guidelines. HarvardReview of Psychiatry, 10:138-153, 2002.
Benedict, R.H.B.; Schretlen, D.; Groninger, L.; andBrandt, J. Hopkins Verbal Learning Test—Revised:Normative data and analysis of inter-form and test-retestreliability. Clinical Neuropsychologist, 12(1 ):43—55,1998.
Bilder, R.M.; Goldman, R.S.; Volavka, J.; Czobor, P.;Hoptman, M.; Sheitman, B.; Lindenmayer, J.P.; Citrome,L.; McEvoy, J.; Kunz, M.; Chakos, M.; Cooper, T.B.;Horowitz, T.L.; and Lieberman, J.A. Neurocognitiveeffects of clozapine, olanzapine, risperidone, andhaloperidol in patients with chronic schizophrenia orschizoaffective disorder. American Journal of Psychiatry,159:1018-1028,2002.
Buchanan, R.W.; Kreyenbuhl, J.; Zito, J.M.; and Lehman,A. Relationship of the use of adjunctive pharmacologicalagents to symptoms and level of function in schizophre-nia. American Journal of Psychiatry, 159(6): 1035-1043,2002.
Cadle, C D . ; Velligan, D.I.; DiCocco, M.A.; Bow-Thomas, C.C.; and Miller, A.L. The reliability and valid-ity of a brief cognitive assessment. [Abstract].Schizophrenia Research, 53(Suppl):125, 2002.
Cradock, J.; Young, A.S.; and Sullivan, G. The accuracyof medical record documentation in schizophrenia.Journal of Behavioral Health Services & Research,28(4):456-465, 2001.
Csernansky, J.G.; Mahmoud, R.; and Brenner, R. A com-parison of risperidone and haloperidol for the preventionof relapse in patients with schizophrenia. New EnglandJournal of Medicine, 346:16-22, 2002.
Frances, A.; Docherty, J.P.; and Kahn, D.A. Expert con-sensus guidelines series: Treatment of schizophrenia.Journal of Clinical Psychiatry, 57(Suppl 12B):5-58,1996.
Gilbert, D.A.; Altshuler, K.Z.; Rago, W.V.; Shon, S.P.;Crismon, M.L.; Toprac, M.G.; and Rush, A.J. TexasMedication Algorithm Project: Definitions, rationale, andmethods to develop medication algorithms. Journal ofClinical Psychiatry, 59:345-351, 1998.
Green, M.F. What are the functional consequences of neu-rocognitive deficits in schizophrenia? American Journalof Psychiatry, 153(3):321-330, 1996.
Green, M.F.; Marder, S.R.; Glynn, S.M.; McGurk, S.R.;Wirshing, W.C.; Wirshing, D.A.; Liberman, R.P.; andMintz, J. The neurocognitive effects of low-dose haloperi-dol: A two-year comparison with risperidone. BiologicalPsychiatry, 51(12):972-978, 2002.
Kashner, T.M.; Carmody, T.J.; Suppes, T.; Rush, A.J.;Crismon, M.L.; Miller, A.L.; Toprac, M.G.; and Trivedi,M.H. Catching-up on health outcomes: The TexasMedication Algorithm Project. Health Services Research,38:311-331,2003.
Kay, S.R.; Fiszbein, A.; and Opler, L.A. The Positive andNegative Syndrome Scale (PANSS) for schizophrenia.Schizophrenia Bulletin, 13(2):261-276, 1987.
Lehman, A.F., and Steinwachs, D.M. Translating researchinto practice: The Schizophrenia Patient OutcomesResearch Team treatment recommendations.Schizophrenia Bulletin, 24(1): 1-10, 1998.
Lezak, M.D. Neuropsychological Assessment. New York,NY: Oxford University Press, 1995.
Miller, A.L.; Chiles, J.A.; Chiles, J.K.; Crismon, M.L.;Rush, A.J.; and Shon, S.P. The Texas MedicationAlgorithm Project (TMAP) schizophrenia algorithms.Journal of Clinical Psychiatry, 60(10):649-657, 1999.
Overall, J.E., and Gorham, D.R. The Brief PsychiatricRating Scale. Psychological Reports, 10:799-812, 1962.
Purdon, S.E.; Jones, B.D.; Stip, E.; Labelle, A.;Addingtdn, D.; David, S.R.; Breier, A.; Tollefson, G.D.;and the Canadian Collaborative Group for Research inSchizophrenia. Neuropsychological change in early phaseschizophrenia during 12 months of treatment with olanza-pine, risperidone, or haloperidol. Archives of GeneralPsychiatry, 57:249-258, 2000.
Reitan, R.M. The relation of the trail making test toorganic brain damage. Journal of General Psychiatry,53:97-107, 1955.
Reitan, R.M. The validity of the trail making test as anindicator of organic brain damage. Perceptual and MotorSkills, 8:271-276, 1958.
Rush, A.J.; Crismon, M.L.; Kashner, T.M.; Toprac, M.G.Carmody, T.J.; Trivedi, M.H.; Suppes, T.; Miller, A.L.Biggs, M.M.; Shores-Wilson, K.; Witte, B.; Shon, S.P.Rago, W.V.; and Altshuler, K.Z. Texas MedicationAlgorithm Project, phase 3 (TMAP-3): Rationale andstudy design. Journal of Clinical Psychiatry, 64:357-369,2003.
Rush, A.J.; Rago, W.V.; Crismon, M.L.; Toprac, M.G.;Shon, S.P.; Suppes, T.; Miller, A.L.; Trivedi, M.H.;Swann, A.C.; Biggs, M.M.; Shores-Wilson, K.; Kashner,T.M.; Pigott, T.; Chiles, J.A.; Gilbert, D.A.; and Altshuler,K.Z. Medication treatment for the severely and persis-tently mentally ill: The Texas Medication AlgorithmProject. Journal of Clinical Psychiatry, 60:284-291,1999.
Selzer, M.J. The Michigan Alcoholism Screening Test:The quest for a new diagnostic instrument. AmericanJournal of Psychiatry, 127:89-95, 1971.
645
Dow
nloaded from https://academ
ic.oup.com/schizophreniabulletin/article/30/3/627/1933275 by guest on 07 January 2022

Schizophrenia Bulletin, Vol. 30, No. 3, 2004 A.L. Miller et al.
Siris, S.G. Depression in schizophrenia: Perspective in theera of "atypical" antipsychotic agents. American Journalof Psychiatry, 157:1379-1389,2000.Skinner, H.A. The drug abuse screening test. AddictiveBehaviors, 7:353-371, 1982.
Suppes, T.; Swann, A.C.; Dennehy, E.B.; Habermacher,E.D.; Mason, M.; Crismon, M.L.; Toprac, M.G.; Rush,A.J.; Shon, S.P.; and Altshuler, K.Z. Texas MedicationAlgorithm Project: Development and feasibility testing ofa treatment algorithm for patients with bipolar disorder.Journal of Clinical Psychiatry, 62:439^47, 2001.
Tollefson, G.D.; Beasley, CM.; Tran, P.V.; Street, J.S.;Krueger, CM.; Tamura, R.N.; Graffeo, K.A.; and Thieme,M.E. Olanzapine versus haloperidol in the treatment ofschizophrenia and schizoaffective and schizophreniformdisorders: Results of an international collaborative trial.American Journal of Psychiatry, 154{4):457-465, 1997.
Toprac, M.G.; Rush, A.J.; Conner, T.M.; Crismon, M.L.;Dees, M.; Hopkins, C ; Rowe, V.; and Shon, S.P. TheTexas Medication Algorithm Project Patient and FamilyEducation Program: A consumer-guided initiative.Journal of Clinical Psychiatry, 61:477^86, 2000.
Velligan, D.I.; Mahurin, R.K.; Diamond, PL.; Hazleton,B.C.; Eckert, S.L.; and Miller, A.L. The functional signifi-cance of symptomatology and cognitive function in schiz-ophrenia. Schizophrenia Research, 25:21-31, 1997.
Ventura, J.; Lukoff, D.; Nuechterlein, K.H.; Liberman, R.P.;Green, M.E; and Shaner, A. Manual for the expanded BriefPsychiatric Rating Scale. International Journal of Methodsin Psychiatric Research, 3:227-244, 1993.
Ware, J.E.; Kosinski, M.; and Keller, S.D. A 12-itemshort-form health survey (SF-12): Construction of scalesand preliminary tests of reliability and validity. MedicalCare, 34:220-233, 1996.
Young, A.S.; Sullivan, G.; Burman, M.A.; and Brook, R.Measuring the quality of outpatient treatment for schizo-phrenia. Archives of General Psychiatry, 55(7):611-617,1998.
Acknowledgments
Results of this study were presented in part at the annualmeeting of the American College of Neuropsychopharma-cology, San Juan, Puerto Rico, December 12, 2000, and atthe annual meeting of the American PsychiatricAssociation, New Orleans, LA, May 7, 2001.
This research was supported by National Institute ofMental Health Grant MH-53799, the Robert WoodJohnson Foundation, the Meadows Foundation, theLightner-Sams Foundation, the Nanny Hogan BoydCharitable Trust, the Texas Department of Mental Health
and Mental Retardation, the Center for Mental HealthServices, the Department of Veterans Affairs, a HealthServices Research and Development Research CareerScientist Award (RCS92^H)3) (T.M.K.), the Betty Jo HayDistinguished Chair in Mental Health and the RosewoodCorporation Chair in Biomedical Science (A.J.R.), theUnited States Pharmacopeia] Convention, Mental HealthConnections (a partnership of Dallas County and TexasState mental health authorities with the Department ofPsychiatry of the University of Texas SouthwesternMedical Center, funded by the Texas State Legislature andthe Dallas County Hospital District), the University ofTexas at Austin College of Pharmacy, and theSouthwestern Drug Corporation Centennial Fellowship inPharmacy (M.L.C.). The following pharmaceutical com-panies provided unrestricted educational grants: AbbottLaboratories, AstraZeneca, Bristol-Myers Squibb, EliLilly and Company, Forest Laboratories,GlaxoSmithKline, Janssen Pharmaceutica, Novartis,Organon, Pfizer, and WyethAyerst Laboratories.
We deeply appreciate the consultations provided byBarbara Bums, Ph.D., Robert Drake, M.D., Susan Essock,Ph.D., William Hargreaves, Ph.D., Teh-wei Hu, Ph.D.,Anthony Lehman, M.D., and Greg Teague, Ph.D., withoutwhose expertise this study could not have been accom-plished.
We also wish to thank the National and Texas Alliancefor the Mentally HI and the National and Texas Depressiveand Manic Depressive Association, for providing patientand family educational materials. We appreciate greatly theassistance of Gus Sicard, Ph.D., for his translation of theeducational, clinical, and research evaluation materials intoSpanish.
We thank Karla Starkweather, TMAP CommunicationsDirector, Texas Department of Mental Health and MentalRetardation, Austin, for invaluable assistance in the conductof this study. Most important, we wish to express our grati-tude to the personnel at each Community Mental HealthCenter for allowing us to conduct this research: AndrewsCenter, Tyler, Center for Health Care Services, San Antonio;Life Management Center, El Paso; Lubbock RegionalMHMR Center, MHMRA of Harris County, Houston; Tri-County MHMR Center, Conroe; and Tropical TexasMHMR Services, Edinburg, Harlingen, and Brownsville.We appreciate the secretarial support of FastWord (Dallas)and David Savage, and thank Andrew Sedillo, M.D., forestablishing the TMAP Web site (http://www.dshs.state.tx.us/rnhprograrns/TMAPtoc.shtm).
We would also like to thank the other AssistantModule Directors: Sherwood Brown, M.D., Ph.D., andTeresa Pigott, M.D.; and the Algorithm Management TeamCoordinators: Judith Chiles, B.S.N., Ellen Dennehy, Ph.D.,Ellen Habamacher, B.S., and Trade Key, B.S.N., R.N.
646
Dow
nloaded from https://academ
ic.oup.com/schizophreniabulletin/article/30/3/627/1933275 by guest on 07 January 2022

The Texas Medication Algorithm Project Schizophrenia Bulletin, Vol. 30, No. 3, 2004
The Authors
Alexander L. Miller, M.D., is Professor, Department ofPsychiatry, University of Texas Health Science Center atSan Antonio, San Antonio, TX; and Director of ClinicalResearch, San Antonio State Hospital, San Antonio, TX.M. Lynn Crismon, Pharm.D., is Professor, PharmacyPractice and Administration, University of Texas at AustinCollege of Pharmacy, Austin, TX; and ClinicalPsychopharmacologist, Texas Department of MentalHealth and Mental Retardation, Austin, TX. A. John Rush,M.D., is Professor, Department of Psychiatry, Universityof Texas Southwestern Medical Center at Dallas, Dallas,TX. John Chiles, M.D., was Professor, Department ofPsychiatry, University of Texas Health Science Center atSan Antonio at the time of this research and is currentlyClinical Professor, Department of Psychiatry, Universityof Washington, Seattle, WA. T. Michael Kashner, Ph.D.,J.D., is Professor, Department of Psychiatry, University ofTexas Southwestern Medical Center at Dallas, and VA
HSR&D Research Career Scientist. Marcia Toprac, Ph.D.,was Director, Office of Research and Education, TexasDepartment of Mental Health and Mental Retardation.Thomas Carmody, Ph.D., is Assistant Professor; MelanieBiggs, Ph.D., is Assistant Professor; and Kathy Shores-Wilson, Ph.D., is Assistant Professor, Department ofPsychiatry, University of Texas Southwestern MedicalCenter at Dallas. Judith Chiles, R.N., was Research Nurse,San Antonio State Hospital. Brad Witte, B.S., is SeniorResearch Associate, Department of Psychiatry, Universityof Texas Southwestern Medical Center at Dallas. ChristineBow-Thomas, Ph.D., was Clinical Psychologist, SanAntonio State Hospital. Dawn I. Velligan, Ph.D., isProfessor, Department of Psychiatry, University of TexasHealth Science Center at San Antonio. Madhukar Trivedi,M.D., is Professor, and Trisha Suppes, M.D., Ph.D., isAssociate Professor, Department of Psychiatry, Universityof Texas Southwestern Medical Center at Dallas. StevenShon, M.D., is Medical Director, Texas Department ofMental Health and Mental Retardation.
647
Dow
nloaded from https://academ
ic.oup.com/schizophreniabulletin/article/30/3/627/1933275 by guest on 07 January 2022

Dow
nloaded from https://academ
ic.oup.com/schizophreniabulletin/article/30/3/627/1933275 by guest on 07 January 2022