THE TELL-TALE BRAIN - Amazon Web Services · The human brain viewed from the top and from the left...
34
THE TELL-TALE BRAIN: A NEUROSCIENTIST'S QUEST FOR WHAT MAKES US HUMAN BY V. S. RAMACHANDRAN 1 Images copyright V.S. Ramachandran unless otherwise noted.
Transcript of THE TELL-TALE BRAIN - Amazon Web Services · The human brain viewed from the top and from the left...

THE TELL-TALE BRAIN: A NEUROSCIENTIST'S QUEST
FOR WHAT MAKES US HUMAN
BY V. S. RAMACHANDRAN
1
Images copyright V.S. Ramachandran unless otherwise noted.

Figure Int.1
Drawing of a neuron showing the cell body, dendrites, and axon. The axon transmits information (in the form of nerve impulses) to the next neuron (or set of neurons) in the chain. The axon is quite long, and only part of it is shown here. The dendrites receive information from the axons of other neurons. The flow of information is thus always unidirectional.
2

Figure Int.2
The human brain viewed from the top and from the left side. The top view shows the two mirror-symmetric cerebral hemispheres, each of which controls the movements of—and receives signals from—the opposite side of the body (though there are some exceptions to this rule). Abbreviations: DLF, dorsolateral prefrontal cortex; OFC, orbitofrontal cortex; IPL, inferior parietal lobule; I, insula, which is tucked away deep beneath the Sylvian fissure below the frontal lobe. The ventromedial prefrontal cortex (VMF, not labeled) is tucked away in the inner lower part of the frontal lobe, and the OFC is part of it.
3

Figure 1.1
A patient with a phantom left arm. Touching different parts of his face evoked sensations in different parts of the phantom: P, pinky; T, thumb; B, ball of thumb; I, index finger.
4

Figure 1.2
The Penfield map of the skin surface on the postcentral gyrus (see Figure Int.2). The drawing shows a coronal section (roughly, a cross section) going through the middle of the brain at the level of the postcentral gyrus. The artist’s whimsical depiction of a person draped on the brain surface shows the exaggerated representations of certain body parts (face and hand) and the fact that the hand map is above the face map.
5

Figure 1.3
A MEG (magnetoencephalograph) map of the body surface in a right-arm amputee. Hatched area, hand; black areas, face; white areas, upper arm. Notice that the region corresponding to the right hand (hatched area) is missing from the left hemisphere, but this region gets activated by touching the face or upper arm.
6

Figure 1.4
The mirror arrangement for animating the phantom limb. The patient “puts” his paralyzed and painful phantom left arm behind the mirror and his intact right hand in front of the mirror. If he then views the mirror reflection of the right hand by looking into the right side of the mirror, he gets the illusion that the phantom has been resurrected. Moving the real hand causes the phantom to appear to move, and it then feels like it is moving—sometimes for the first time in years. In many patients this exercise relieves the phantom cramp and associated pain. In clinical trials, mirror visual feedback has also been shown to be more effective than conventional treatments for chronic regional pain syndrome and paralysis resulting from stroke.
7
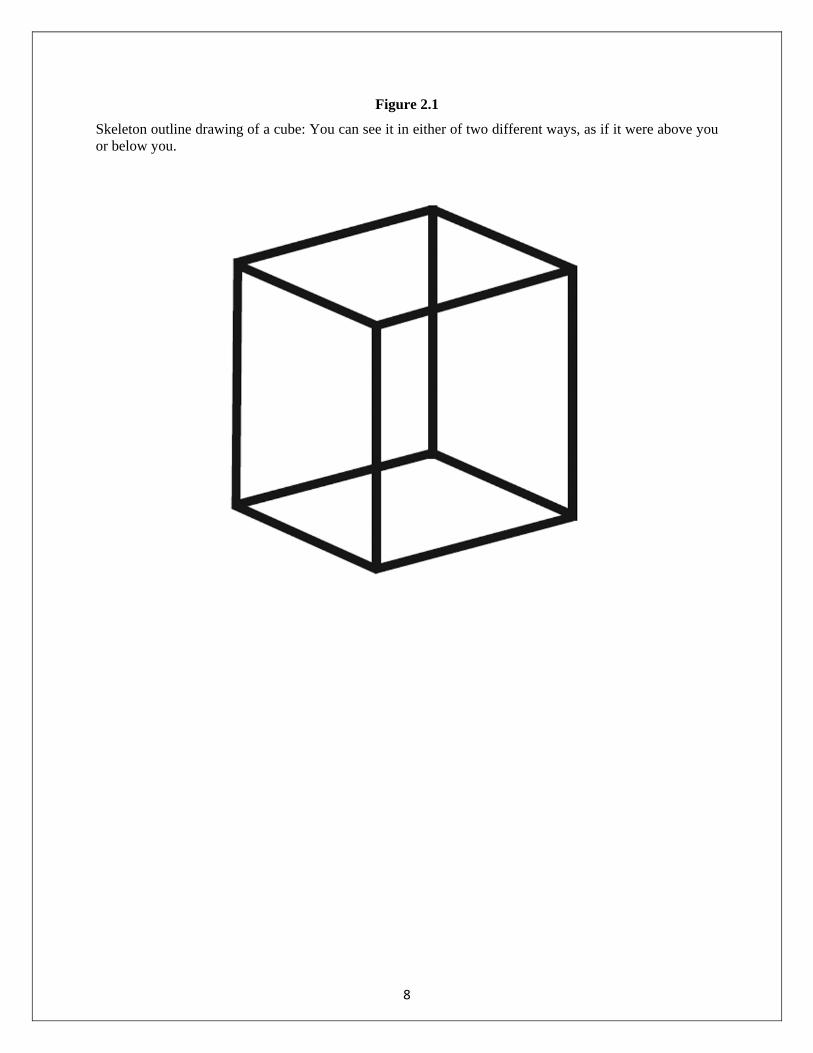
Figure 2.1
Skeleton outline drawing of a cube: You can see it in either of two different ways, as if it were above you or below you.
8

Figure 2.2
By permission of Al Seckel
This picture has not been Photoshopped! It was taken with an ordinary camera from the special viewing point that makes the Ames room work. The fun part of this illusion comes when you have two people walk to opposite ends of the room: It looks for all the world as if they are standing just a few feet apart from each other and one of them has grown giant, with his head brushing the ceiling, while the other has shrunk to the size of a fairy.
9

Figure 2.3
Eggs or cavities? You can flip between the two depending on which direction you decide the light is shining from, right or left. They always all flip together.
10
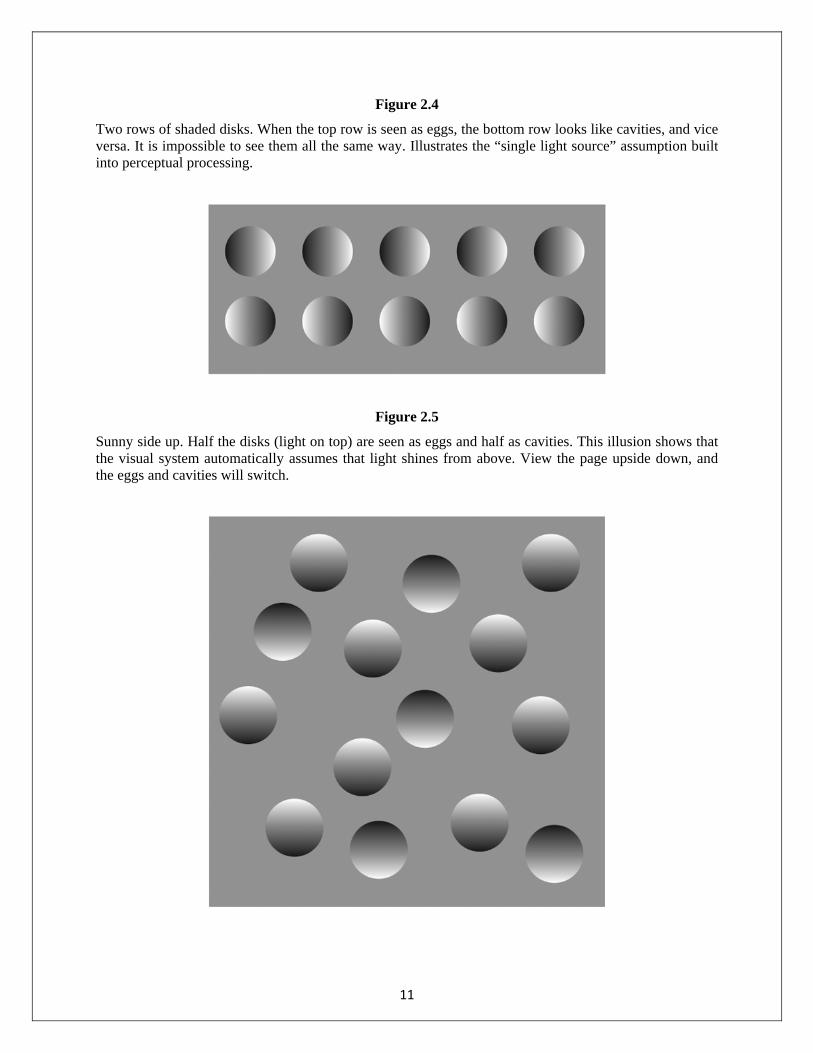
Figure 2.4
Two rows of shaded disks. When the top row is seen as eggs, the bottom row looks like cavities, and vice versa. It is impossible to see them all the same way. Illustrates the “single light source” assumption built into perceptual processing.
Figure 2.5
Sunny side up. Half the disks (light on top) are seen as eggs and half as cavities. This illusion shows that the visual system automatically assumes that light shines from above. View the page upside down, and the eggs and cavities will switch.
11

Figure 2.6
By permission of David Van Essen
David Van Essen’s diagram depicting the extraordinary complexity of the connections between the visual areas in primates, with multiple feedback loops at every stage in the hierarchy. The “black box” has been opened, and it turns out to contain…a whole labyrinth of smaller black boxes! Oh well, no deity ever promised us it would be easy to figure ourselves out.
12
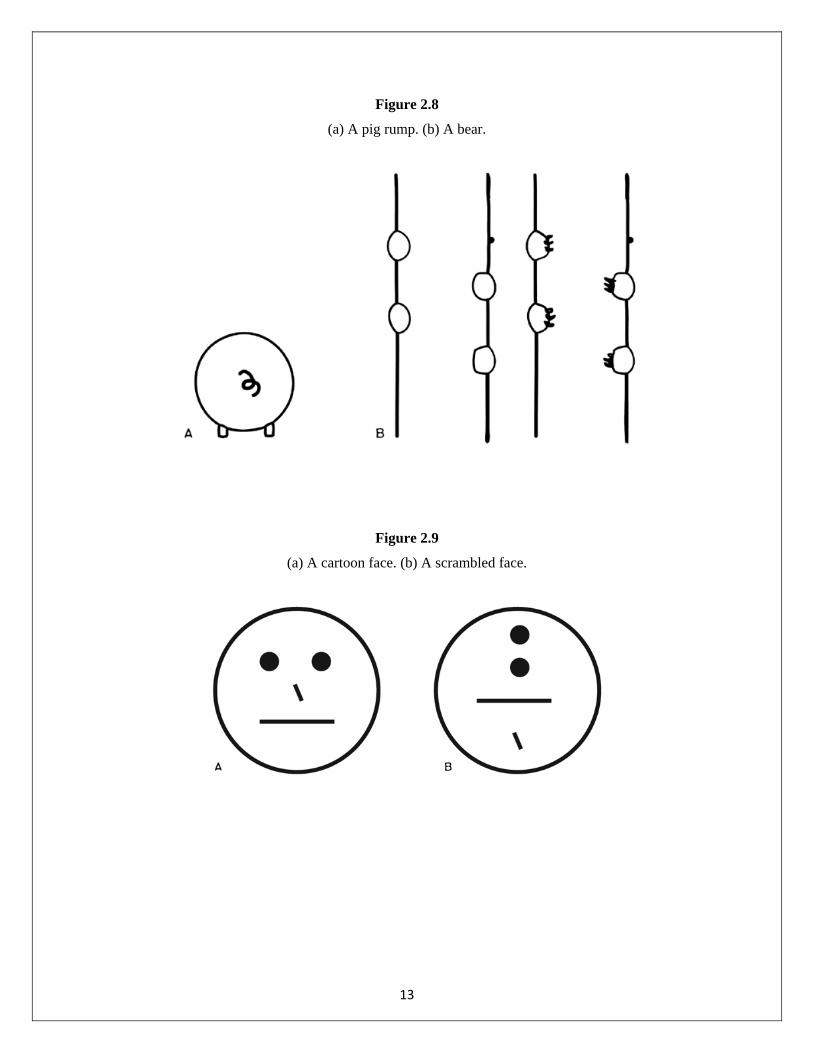
Figure 2.8
(a) A pig rump. (b) A bear.
Figure 2.9
(a) A cartoon face. (b) A scrambled face.
13

Figure 2.10
The visual information from the retina gets to the brain via two pathways. One (called the old pathway) relays through the superior colliculus, arriving eventually in the parietal lobe. The other (called the new pathway) goes via the lateral geniculate nucleus (LGN) to the visual cortex and then splits once again into the “how” and “what” streams.
14

Figure 2.11
By permission of Glyn Humphreys
“Martian flowers.” When asked to draw specific flowers, John instead produced generic flowers, conjured up, without realizing it, in his imagination.
15
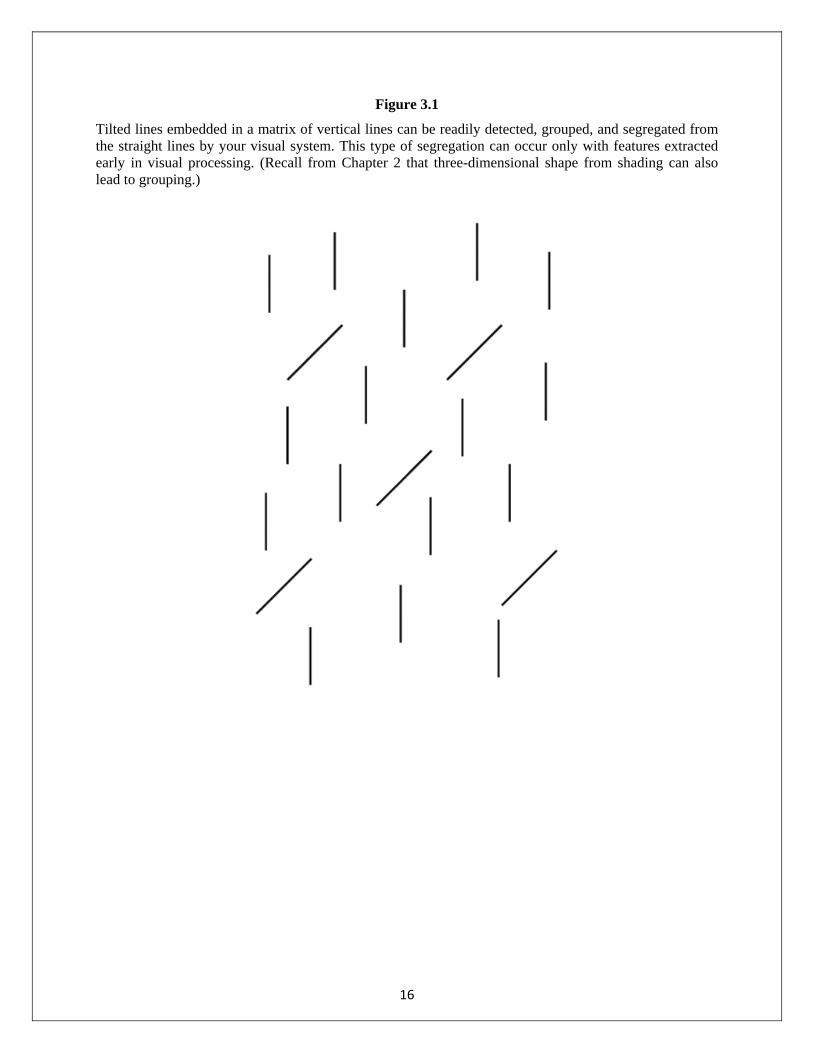
Figure 3.1
Tilted lines embedded in a matrix of vertical lines can be readily detected, grouped, and segregated from the straight lines by your visual system. This type of segregation can occur only with features extracted early in visual processing. (Recall from Chapter 2 that three-dimensional shape from shading can also lead to grouping.)
16

Figure 3.2
Dots of similar colors or shading can also be grouped effortlessly. Color is a feature detected early in visual processing.
17

Figure 3.3
Ts scattered among Ls are not easy to detect or group, perhaps because both are made up of the same low-level features: vertical and horizontal lines. Only the arrangement of the lines is different (producing corners versus T-junctions), and this is not extracted early in visual processing.
18

Figure 3.4
A cluster of 2s scattered among 5s. It is difficult for normal subjects to detect the shape formed by the 2s, but lower synesthetes as a group perform much better. The effect has been confirmed by Jamie Ward and his colleagues.
19

Figure 3.5
The same display as Figure 3.4 except that the numbers are shaded differently, allowing normal people to see the triangle instantly. Lower synesthetes (“projectors”) presumably see something like this.
20

Figure 3.6
The left side of the brain showing the approximate location of the fusiform area: black, a number area; white, a color area (shown schematically on the surface).
Figure 3.7
Which of these shapes is “bouba” and which is “kiki”? Such stimuli were originally used by Heinz Werner to explore interactions between hearing and vision.
21

Figure 3.8
From Francis Galton, “Visualized Numerals,” Journal of the Anthropological Institute, 10 (1881) 85-102
Galton’s number line. Notice that 12 is a tiny bit closer to 1 than it is to 6.
22

Figure 4.1
By permission of Giuseppe di Pellegrino
Mirror neurons: Recordings of nerve impulses (shown on the right) from the brain of a rhesus monkey (a) watching another being reach for a peanut, and (b) reaching out for the peanut. Thus each mirror neuron (there are six) fires both when the monkey observes the action and when the monkey executes the action itself.
23

Figure 6.1
The two main language areas in the brain are Broca’s area (in the frontal lobes) and Wernicke’s area (in the temporal lobes). The two are connected by a band of fibers called the arcuate fasciculus. Another language area, the angular gyrus (not labeled in this figure), lies near the bottom of the parietal lobe, at the intersection of temporal, occipital, and parietal lobes.
24

Figure 6.2
A schematic depiction of resonance between brain areas that may have accelerated the evolution of protolanguage. Abbreviations: B, Broca’s area (for speech and syntactic structure). A, auditory cortex (hearing). W, Wernicke’s area for language comprehension (semantics). AG, angular gyrus for cross-modal abstraction. H, hand area of the motor cortex, which sends motor commands to the hand (compare with Penfield’s sensory cortical map in Figure 1.2). F, face area of the motor cortex (which sends command messages to the facial muscles, including lips and tongue). IT, the inferotemporal cortex/fusiform area, which represents visual shapes. Arrows depict two-way interactions that may have emerged in human evolution: 1, connections between the fusiform area (visual processing) and auditory cortex mediate the bouba-kiki effect. The cross-modal abstraction required for this probably requires initial passage through the angular gyrus. 2, interactions between the posterior language areas (including Wernicke’s area) and motor areas in or near Broca’s area. These connections (the arcuate fasciculus) are involved in cross-domain mapping between sound contours and motor maps (mediated partly by neurons with mirror-neuron-like properties) in Broca’s area. 3, cortical motor-to-motor mappings (synkinesia) caused by links between hand gestures and tongue, lip, and mouth movements in Penfield’s motor map. For example, the oral gestures for “diminutive,” “little,” “teeny-weeny,” and the French phrase “en peau” synkinetically mimic the small pincer gesture made by opposing thumb and index finger (as opposed to “large” or “enormous”). Similarly, pouting your lips outward to say “you” or (in French) “vous” mimic pointing outward.
25

Figure 7.4
A lion seen through foliage. The fragments are grouped by the prey’s visual system before the overall outline of the lion becomes evident.
26

Figure 7.5
(a) Viewing the diagram on the left gives you a pleasing sensation of completion: The brain enjoys grouping. (b) In the right-hand diagram, the smaller blobs flanking the central vertical blob are not grouped by the visual system, creating a sort of perceptual tension.
27

Figure 7.6
Demonstration of the peak shift principle: The rat is taught to prefer the rectangle (2) over the square (1) but then spontaneously prefers the longer, skinnier rectangle (3).
28

Figure 7.7
Photograph by Rosemania for Wikicommons
Dancing stone nymph from Rajasthan, India, eleventh century. Does it stimulate mirror neurons?
29

Figure 7.8
The gull chick pecks at a disembodied beak or, a stick with a spot that is a reasonable approximation of the beak given the limits of sophistication of visual processing. Paradoxically, a stick with three red stripes is even more effective than a real beak; it is an ultranormal stimulus.
30

Figure 8.2
Two hills with a tree in the middle. (a) The brain dislikes unique vantage points and (b) prefers generic ones.
Figure 8.3
Three black discs with pie-shaped wedges removed from them: The brain prefers to see this arrangement as an opaque white triangle whose corners partially occlude circular discs.
31

Figure 8.4
A stone nymph below an arching bough, looking heavenward for divine inspiration. Khajuraho, India, eleventh century.
32

Figure 9.1
A highly schematic diagram of the visual pathways and other areas invoked to explain symptoms of mental illness: The superior temporal sulcus (STS) and supramarginal gyrus (SM) are probably rich in mirror neurons. Pathways 1 (“how”) and 2 (“what”) are identified anatomical pathways. The split of the “what” pathway into two streams—“what” (pathway 2) and “so what” (pathway 3)—is based mainly on functional considerations and neurology. The superior parietal lobule (SPL) is involved in the construction of body image and visual space. The inferior parietal lobule (IPL) is also concerned with body image, but also with prehension in monkeys and (probably) apes. The supramarginal gyrus (SM) is unique to humans. During hominin development, it split off from the IPL and became specialized for skilled and semiskilled movements such as tool use. Selection pressure for its split and specialization came from the need to use hands for making tools, wielding weapons, hurling missiles, as well as fine hand and finger manipulation. Another gyrus (AG) is probably unique to us. It split off from IPL and originally subserved cross-modal abstraction capacities, such as tree climbing, and matching visual size and orientation with muscle and joint feedback. The AG became exapted for more complex forms of abstraction in humans: reading, writing, lexicon, and arithmetic. Wernicke’s area (W) deals with language (semantics). The STS also has connections with the insula (not shown). The amygdaloid complex (A, including the amygdala) deals with emotions. The lateral geniculate nucleus (LGN) of the thalamus relays information from the retina to area 17 (also known as V1, the primary visual cortex). The superior colliculus (SC) receives and processes signals from the retina that are to be sent via the old pathway to the SPL (after a relay via the pulvinar, not shown). The fusiform gyrus (F) is involved in face and object recognition.
33

Figure 9.2
An abbreviated version of Figure 9.1, showing the distinction between emotions and semantics (meaning).
34