The taxing problems of land value capture, planning ... · The taxing problems of land value...
28
The taxing problems of land value capture, planning obligations and viability tests: some reasonable models? Article Accepted Version McAllister, P. (2019) The taxing problems of land value capture, planning obligations and viability tests: some reasonable models? Town Planning Review, 90 (4). pp. 429- 451. ISSN 1478-341X doi: https://doi.org/10.3828/tpr.2019.28 Available at http://centaur.reading.ac.uk/84241/ It is advisable to refer to the publisher’s version if you intend to cite from the work. See Guidance on citing . To link to this article DOI: http://dx.doi.org/10.3828/tpr.2019.28 Publisher: Liverpool University Press All outputs in CentAUR are protected by Intellectual Property Rights law, including copyright law. Copyright and IPR is retained by the creators or other copyright holders. Terms and conditions for use of this material are defined in the End User Agreement . www.reading.ac.uk/centaur
Transcript of The taxing problems of land value capture, planning ... · The taxing problems of land value...
The taxing problems of land value capture, planning obligations and viability tests: some reasonable models? Article
Accepted Version
McAllister, P. (2019) The taxing problems of land value capture, planning obligations and viability tests: some reasonable models? Town Planning Review, 90 (4). pp. 429451. ISSN 1478341X doi: https://doi.org/10.3828/tpr.2019.28 Available at http://centaur.reading.ac.uk/84241/
It is advisable to refer to the publisher’s version if you intend to cite from the work. See Guidance on citing .
To link to this article DOI: http://dx.doi.org/10.3828/tpr.2019.28
Publisher: Liverpool University Press
All outputs in CentAUR are protected by Intellectual Property Rights law, including copyright law. Copyright and IPR is retained by the creators or other copyright holders. Terms and conditions for use of this material are defined in the End User Agreement .
www.reading.ac.uk/centaur

CentAUR
Central Archive at the University of Reading
Reading’s research outputs online
1
The Taxing Problems of Land Value Capture, Planning Obligations and
Viability Tests: Some Reasonable Models?
Pat McAllister
Department of Real Estate and Planning
Henley Business School
University of Reading
Whiteknights
Reading
RG6 6UD
Email: [email protected]

2

3
Abstract
Given their increasing importance in the formation and implementation of planning policies in the UK,
this paper focuses on the use of development viability tests to determine how land value uplifts actuated
by planning consent could be distributed between developers, landowners and the community.
Following a discussion of way in which planning obligations act as a quasi-betterment tax that can
both capture and create land values, alternative approaches to operationalising Benchmark Land Value
(BLV) are evaluated. The effects of different approaches to BLV on potential land value capture are
simulated for a number of hypothetical development sites in order to identify and compare implied
betterment tax rates and to estimate viable affordable housing proportions. It is concluded that large
geographical variations in property prices produce large variations in the potential for land value
capture. Different approaches to BLV have a range of strengths and weaknesses. In addition, given
that viability models are susceptible to significant levels of error and potential bias, using such models
to make and implement planning policies renders such processes vulnerable to opportunistic behaviour
and prone to miscalculation.

4
Introduction
Nearly two decades ago, Campbell, Ellis, Henneberry and Gladwell (2000, 774) argued that the
changing nature of planning obligations was leading to the marketisation of planning processes and
“…indirect, even disingenuous, treatment of financial matters”. In the last decade, the growth of
viability testing in the UK’s planning systems has rendered the treatment of financial matters much
more direct, but arguably, no less disingenuous. During this period, for policy formation and
development management, local planning authorities and developers have been using what was
previously the narrow preserve of specialist development professionals – development appraisal
modelling – to evaluate the effects of proposed planning policies on the financial viability of
development for private developers. The application of apparently technical procedures typically
involving project-level cash flow appraisals has become one of the most contested and controversial
issue in local planning.
In a planning context, at the heart of a viability test is the financial matter of a “competitive return” to
the land owner. The key issue here has been the amount that the land owner should be assumed to
receive as a priority over any land value capture in the form of planning obligations. This is generally
termed Benchmark Land Value (BLV). The formation and implementation of policies by local
authorities on planning obligations and other land use plans has been required by central government
to incorporate a “competitive return” or “landowner premium” in the form of a minimum land value to
the landowner to ensure that there is a sufficient incentive to supply land for development. It has made
the trade-offs between land value capture by the community and by the land owner or developer much
more evident. McAllister (2017) argued that the policy introducing of financial viability criteria into
the planning system did not fit easily into a rationalist model of policy formulation but that policy
evolution seemed more like Lindholm’s ‘muddling through’ process of trial-and-error. However, as
the policy has mutated and grown in scope and scale, there has also been a process of policy learning
by central government policy makers, local planning authorities, professional institutions and
community activists among others. Nevertheless, as a policy construct, there remains much unfinished
business and it continues to evolve as various interest groups compete to shape it.
Probably deliberately, advice on viability guidance linked to the 2018 National Planning Policy
Framework (NPPF) uses rather imprecise language when addressing, what has been, the vexed issue of
BLV. Bearing in mind that it is essentially determining the scope for land value capture, in the NPPF
plan makers have been guided to establish “a reasonable premium” (above the value of sites in their
current use) which would provide “a reasonable incentive” for land owners to release sites and meet
land owners’ “reasonable expectations”. However, to date, an operational definition of the concept of
a reasonable premium to land owners remains fiercely contested and unresolved by the key

5
stakeholders. Indeed, perhaps reasonably, it seems that policy makers have been ducking this politically
contentious issue. Policy makers appear anxious about the political implications of shifting to a process
that specifies and/or quantifies the appropriate incentive to the landowner. The concern seems to be
that viability testing may be interpreted as or mutate into something that looks like an explicit and
transparent betterment tax. However, the internal logic of viability testing is increasingly driving policy
makers to confront how the concept of BLV should be operationalised and measured.
Given that a range of alternative approaches to estimating BLV have been proposed, this paper
investigates how these different approaches could affect the patterns of planning obligations and land
value capture in a range of market conditions. Some familiarity with issue of viability testing in the
context of the UK planning system is assumed. A discussion of the policy background and underlying
principles of development appraisal has been well-covered in previous papers (see, for example,
McAllister, Wyatt and Coleman, 2013 and Henneberry, 2016). The remainder of the paper is organised
as follows. The first section discusses the use of planning obligations in the UK’s planning systems
and analyses them from a taxation perspective. This is followed by a discussion of the concept of BLV
and the range of approaches to it that have been suggested in practice. The effects of these different
approaches on potential land value capture are then simulated for a number of hypothetical development
sites in order to identify and analyse how alternative approaches to setting a “reasonable premium”
could play out in practice. Specifically, the models presented attempt to identify the impacts of different
approaches to operationalising Benchmark Land Value in order to assess the consequences for patterns
of land value capture in high density and low density developments in affluent and average regions of
England.
Planning obligations as quasi-betterment taxes
Planning obligations as a form of land value capture can be framed as a quasi-tax on land value uplifts
where the level and timing of payment is agreed when planning permission is granted and which are
payable typically on and/or after implementation of planning permission. They have been described as
“surrogate betterment tax” by Corkindale (2004, 16) and as “…locally determined and negotiated
betterment levies on development values, hypothecated for local needs” by Crook and Monk (2011,
997). There is a long established yet largely theoretical literature on the welfare effects of the use of
planning obligations to mitigate the effects of negative externalities, to provide required infrastructure
and and/or to secure some of land value uplifts for public and merit goods. This literature has evaluated
the effects of planning obligations on allocative efficiency with a focus on their impact on the quantity
and form of development and consumer welfare (see Evans, 1983; Keogh, 1985; Bowers, 1992 and
Crook and Whitehead, 2002).
6
The conclusions have been mixed in terms of the costs and benefits of planning obligations. In an
evaluation of the effects of non-market housing contributions, having assessed such policies using a
range of micro-economic models, Crook and Whitehead (2002, 1272) concluded that
…there is a wide range of possible impacts of the ‘taxation’ policy. If the ‘tax’ simply transfers
economic rent there need be no impact on output, costs, and prices. However, in reality, the
situation is likely to be far more complex… The starting point is to demonstrate that
landowners do indeed bear the burden of provision in the form of lower land prices. If this can
be shown, critics argue that non-market housing represents an effective site-by-site collection
of betterment tax (albeit in the form of lower land prices rather than a specific tax levy).
From the perspective of equity planning, planning obligations can act as a redistributive policy
instrument. Focussing specifically on affordable housing, Whitehead (2007) analysed the long-
established tension in planning between enhancing land use efficiency and the central function of
government of improving the distribution of resources. A widely cited and contested claim is that
restricting housing land supply redistributes wealth between housing/land owners and non-owners and
creates a strong rationale to use planning obligations for equity reasons.
Planning obligations have also been characterised as indirect land value capture instruments As
discussed in detail by Alterman (2012), planning obligations can have a range of (sometimes implied)
purposes – cost recovery, provision of public and merit goods, internalisation and mitigations of
negative externalities and redistribution. In the UK context, planning obligations are a localised, event-
triggered form of land value capture through a range of ‘in-kind’ planning obligations (non-market
housing, community facilities, provision of open space, infrastructure provision etc.) as well as
monetary contributions such as tariffs, levies or in lieu payments. Planning obligations can be in the
form of planning and building regulations, restrictions and standards e.g. required energy efficiency
standards that impose additional development costs. In the UK, the current planning regimes currently
run both negotiable and non-negotiable developer contributions side-by-side. Originally intended as a
simple flat rate charge to replace planning agreements (commonly known as Section 106 agreements),
the Community Infrastructure Levy (CIL) now sits alongside that mechanism. CIL is meant to help to
fund infrastructure provision in the local planning authority. Planning (Section 106) agreements are
used to mitigate the impact of development and to provide additional merit and public goods of which
non-market housing is typically the most important (see Wyatt, 2017 for a more detailed and nuanced
discussion of the operation of the two systems). They can be expressed both in absolute or relative
terms. For instance, typically affordable housing requirements are expressed as a percentage of the
quantity of total housing provided. Additional s106 contributions to affordable housing may be
expressed by market participants as an cash sum per dwelling. With inter and often intra local authority
variations, CIL is set at fixed amount per square metre of additional space. Consequently, the rate of
taxation through the current system of planning obligations can be characterised as partly ad hoc,
7
discretionary, negotiable and inconsistent. There is a marked contrast with alternative land value capture
using the more conventional taxes. Event-based and recurrent real estate taxes such as the transaction
taxes and recurring real estate taxes are relatively certain, predictable and consistent.
Benchmark Land Value: Establishing a Competitive Return to Land Owners
Without planning permission, the landowner already has the Market Value of the land in its current use.
Depending on the difference between potential revenues and non-land development costs on a site, the
difference between the Market Value of the land assuming development is permitted (ignoring planning
obligations) and the Market Value for the current use can be either significant or quite minor.
Commentators routinely cite the differential between the prices of land restricted to agricultural use and
similar land for which planning permission for residential development has been obtained. This is
where the trade-off between the appropriate return to the community through affordable housing, CIL
and other planning obligations and the appropriate return to the land owner and developer is starkly
demonstrated. Typically, the former will sell for £15,000 to £25,000 per hectare. The latter can typically
sell for £1 million to £5 million per hectare depending on local house prices. As the discussion above
indicates, some planning obligations will have to be paid for out of this difference. A key unresolved
question concerns the appropriate allocation of the uplift between landowner and local planning
authority. As indicated, this uplift can vary enormously depending on the nature of the individual site.
When viability appraisal became mainstream over a decade ago, the Homes & Communities Agency1
(HCA) were grappling with the issue of BLV. The key potential bases of BLV were set out by the HCA
as:
a) Market Value of land based on price signals from land transactions
Put simply, this approach to BLV supports a return to the land owner based upon what similar sites have
sold for. However, the conventional criticism of using recent sales prices of comparable development
sites is that prices are partially determined by planning obligations on those sites and, as a result, such
an approach tends to ‘lock-in’ established development management policies. For instance, let’s assume
that house-builders’ bids for residential development sites were formed in a planning regime when
affordable housing contributions of 20% were typical and that this regime has produced prices in the
region of £3,000,000 per hectare for serviced residential development land. A new policy regime is
1 The Homes and Communities Agency (HCA) was an executive non-departmental public body, sponsored by the
Department for Communities and Local Government. It was replaced in January 2018 by Homes England and the Regulator
of Social Housing.
8
proposed requiring planning authorities to secure an increased proportion of affordable housing at 40%.
However, it is stipulated that such a policy must deliver a competitive return to the land owner. All else
being equal, if a BLV is assumed at £3,000,000 per hectare in a development viability appraisal and this
is deemed to be the minimum price to provide a competitive return to the land owner, any development
viability appraisal with a proportion of affordable housing above 20% will conclude that the policy is
not deliverable.
This illustrates the widely acknowledged ‘circularity problem’ with estimating the ‘competitive return’
based upon what sites have been selling for. Typically, land owners have tended to advocate this basis
of establishing BLV since it is implicitly supportive of the transfer to them of large proportions of the
increases in land value actuated by planning permission. The counter-argument has been that
comparable development sites should be comparable in policy terms. That is to say, that their prices
should reflect or be appropriately adjusted to reflect planning policy requirements.
In planning appeals, until relatively recently the private development sector has been relatively
successful at anchoring the definition of BLV (effectively the competitive return) to achieved prices.
Over the last decade, a number of Planning Inspectorate decisions have favoured the use of Market
Value based upon evidence of sale prices involving comparable development sites (see Crosby and
Wyatt, 2016). However, recent legal and policy decisions have tended to weaken the case for using this
approach. Much of the controversy regarding Benchmark Land Value has been encapsulated in a long-
running planning appeal in Islington’s former Territorial Army barracks located on Parkhurst Road. The
two public inquiries and High Court case (Parkhurst Road Limited v Secretary of State for Communities
and Local Government and The Council of the London Borough of Islington [2018] EWHC 991) have
made it a seminal case in the context of viability tests and BLV.
In April 2018, the judge in the case concluded that linking BLV to achieved transaction prices without
adjusting for differences between the level of planning obligations in the site sold and the proposed policy
or site subject to application was problematic. He argued
[I]t does not follow that, merely because an analysis is based upon a substantial amount of
market evidence, the conclusions drawn will be untainted by the circularity problem. That
will depend upon whether the transactions in the data base adequately reflected, for example,
the requirements of relevant planning policies and, if not, the adequacy of the steps taken, if
any, to adjust that information to overcome that problem.
Largely concurrently, following a consultation period in mid-2018, the Ministry of Housing
Communities and Local Government also confirmed the importance of taking into account whether
previous transactions prices appropriately reflected policy requirements in their viability guidance.
Where recent market evidence is used to inform assessment of benchmark land value this
evidence should be based on developments which are compliant with policies, including for

9
affordable housing. Where this evidence is not available plan makers and applicants should
identify and evidence any adjustments to reflect the cost of policy compliance. This is so that
historic benchmark land values of non-policy compliant developments are not used to inflate
values over time.
In practice, a procedure or technique for adjusting land prices to reflect differences in local house
prices and development costs including planning obligations between sites has not been proposed.
Such an adjustment essentially involves answering the question “What price would the transacted site
have sold for if it was the same as the site subject to application in terms of its normal and abnormal
development costs, development revenues and planning obligations per unit of space?” There is one
relatively straightforward simple method of answering this question - appraise the site subject to
application. This can be seen if it is assumed that an appraiser adjusts the prices of comparable sites
so that they reflect policy, site and market conditions on the site subject to application. That is, the
appraiser assumes that there is no difference in costs and revenues per unit of space between two sites.
Inevitably, the appraiser will produce the same adjusted value estimate for the comparable site per unit
of space that will be estimated for the site subject to application using a standard development
appraisal. As it stands, the government’s viability guidance seems, therefore, to be effectively stating
that the Benchmark Land Value will be the appraised value of the site assuming policy
compliance. The viability test then is if this estimate of site value is sufficiently above its value in
current use (or equivalent with the value in a possible alternative use), then the proposed level of
planning obligations are viable.
b) Market Value assuming current use plus an incentive
This is the approach that has been adopted in the government’s viability guidance which states that
“Benchmark land value should:...be based upon existing use value…[and] allow for a premium to
landowners”. Clearly, in terms of practicality, the key (and most difficult) question regarding this
approach is the size of the premium necessary to encourage landowners to release land for
development. In a sense, all approaches to BLV involve paying a premium to the land owner above
the existing use value. Crucially, as noted earlier, the government’s viability guidance is particularly
vague on how the premium is to be calculated.
The premium (or the ‘plus’ in EUV+) is the second component of benchmark land value. It
is the amount above existing use value (EUV) that goes to the landowner. The premium
should provide a reasonable incentive for a land owner to bring forward land for development
while allowing a sufficient contribution to comply with policy requirements…This will be
an iterative process informed by professional judgement and must be based upon the best
available evidence informed by cross sector collaboration.
Noticeably, no clear procedure for calculating the premium was proposed.
In 2018, in a response to a Parliamentary Select Committee that had been investigating land value
capture, The Peel Group (a large real estate investor and developer) submitted a proposal on BLV that

10
attempted to grasp this ‘nettle’ that has largely been avoided by government since the introduction of
viability tests. They proposed an operational definition of what constitutes a “reasonable incentive”.
The most critical aspect, and that of greatest relevance to the Committee, is the
recommended introduction of a series of quantitative ‘tests’ for the calculation of the
‘premium’ to the landowner in any situation of viability assessment in planning
(in plan-making or decision taking, on greenfield or brownfield sites, and on sites of
any scale). The proposed wording is as follows (in italics):
In order to incentivise a reliable supply of development land and avoid land being
withheld from development, the premium to the landowner must meet all of the
following criteria:
represent a premium of at least 20% in excess of the EUV (on brownfield sites in built-
up urban centres); and
represent a premium equal to an identified Alternative Use Value (AUV), where this
complies with adopted planning policy; and
represent a value of at least £150,000 per gross acre (£370,650 per gross hectare)
and £250,000 per net developable acre (£617,760 per net hectare), indexed annually
from the date of publication using the Consumer Price Index (CPI); and
represent a minimum of 60% of the uplift in land value between the EUV and the residual
land value of planned development after deducting the cost of site-specific abnormal and
enabling infrastructure works, but before allowing for deductions for affordable housing,
other developer contributions and CIL.
For greenfield sites in particular, the last bullet point is the most important and effectively represents
a proposal for a maximum 40% tax rate on the land uplifts to be gathered through CIL and s106
agreements.
There is precedent for adopting this type of approach to setting BLV in the planning system. In 2012,
in a planning inquiry for Land at the Manor, Shinfield (APP/X0360/A/12/2179141), the difference
between land value in existing use and land value assuming planning permission ignoring planning
obligations was split 50-50. The inspector agreed with the land promoter who advocated such a split
concluding that
Determining what constitutes a competitive return inevitably involves making a
subjective judgement based upon the evidence. Two very different viewpoints were put
forward at the Inquiry with the appellants seeking a land value of £4,750,000 which is
roughly the mid-point between the EUV/CUV and the RLV with planning permission for
housing and no obligations. This ties in with the 50:50 split between the community and
the landowner sought by the appellants.
In 2010, the HCA briefly considered a “share of the land value uplift” as a basis for estimating BLV
arguing that
An emerging concept is that there is a maximum amount of land value capture that is
acceptable to landowners. Assessment of the difference between theoretical RLV

11
with no affordable housing planning obligations (unencumbered land value) and RLV
with planning obligations provides a benchmark for this tolerance. Some approaches
have assumed that the maximum tolerance is 50% of the difference between
unencumbered value and EUV…Although there is no hard evidence that this approach
represents landowner behaviour, some have suggested that it matches their experience
of the market. This concept may offer a workable way forward. (HCA, 2010, 9).
The main advantage of this type of approach to distributing the land value uplifts between the land
owner/developer and the community is that it provides a clear operational procedure.
c) Market Value of land expressed as a proportion of gross development value
Ratios between land value and gross development value (GDV) are the accepted basis for establishing
the competitive return to the developer in the context of viability testing. This is presumably because
such ratios are widely used by developers when assessing what a development site is worth to them. For
developers, it is specified and quantified in the government’s viability guidance.
For the purpose of plan making an assumption of 15-20% of gross development value
(GDV) may be considered a suitable return to developers in order to establish the
viability of plan policies.
From the perspective of a return to land owners, there is no reason to expect land costs to be any
specific proportion of development value. However, ‘rules of thumb’ such as “The Rule of Thirds”
(one third of GDV to the land owner, one third of GDV to the developer and one third for other
development costs) have sometimes acted as simple heuristic devices in real estate development.
Rationally, such ‘rules of thumb’ have limited economic meaning. They tend to be crude procedures
based on specific experiences that may have been useful in a particular market environment. There
is no reason to presume that they have any application in another market environment.
The HCA (2010) also discussed this type of approach
Land value, expressed as a % of GDV, is a regularly used benchmark within the land
and development sector, with applicability to both urban and greenfield sites.
Anecdotally a rule of thumb is that, in active development markets, land will come
forward for development if its value is in a range of 20% to 30% of GDV, typically
25%. Some have noted that the historic rule of thumb (of a three way split of GDV
amongst land, build costs and finance/ margin) no longer holds true.
One advantage of this approach is its simplicity. Estimates of GDV for a development project are
relatively straightforward to estimate and to evidence. There is also an in-built link with the land value
uplift and local real estate prices. Linking the return to the land owner to the return to the developer
may appear more equitable.
12
Below, the ways that these potential approaches to operationalisation of the concept of Benchmark Land
Value could ‘play out’ in practice is simulated for a range of market contexts.
Land Value Capture: Some Simulations
Whilst an estimation of the value of monetary and non-monetary planning obligations can provide a
useful approach to estimating their value in absolute terms, such measures provide limited insight into
the pattern of relative land value capture. The approach that is used here is based the techniques widely
applied both in viability appraisal for planning purposes and by development practitioners for the
financial evaluation of development opportunities. In practice, real estate developers typically use land
residual theory to estimate their bid prices for development opportunities. In this specific context, the
potential for a development opportunity to support affordable housing delivery is assessed assuming
different payments to the land owner (i.e. different approaches to Benchmark Land Value/competitive
return to the land owner). In the context of impact fees in the US, the underlying logic was well
expressed by Evans-Cowley et al. (2005, 106)
When a property owner sells undeveloped land, the developer will pay less for it because the
developer knows that he/she will have to pay the impact fee upon development of the land. Thus,
the developer pays a lower price while the seller of undeveloped land receives less money due to the
capitalization of the impact fee into the price of the property.
Land value capture from planning obligations is estimated as the difference between what a
development opportunity would have sold for in a planning regime without planning obligations
compared what it would have sold for in a planning regime with planning obligations.
For any development opportunity, apart from land the main development costs broadly consist of
construction costs, professional fees, brokerage fees, land transfer taxes, developer contributions and a
return to the developer. The latter is essentially the cost of capital. It is commonly expressed as a
percentage of development costs, a margin on development value or as an internal rate of return. As
noted above, planning obligations often consist of monetary payments, requirements to sell a proportion
of housing to non-market housing providers at discounted prices, direct provision of in-kind facilities
(e.g. open space, playgrounds, health care facilities, transport infrastructure etc.) as well as a range of
other conditions. It is also worth re-iterating that, in terms of estimating land value capture, some
consideration is also needed to account for planning obligations that would have been provided by ‘the
market’.
The appraisal outputs are estimated for hypothetical sites with a hypothetical planning in a hypothetical
location. This is typical in viability studies made for planning policy formation purposes. As noted
13
above, such appraisals tend to rely on numerous uncertain inputs that can compromise the outputs. This
has obvious implications for the use of those outputs as a basis for policy formation. Whilst the
appraisals draw upon a wide range of estimates and assumptions, in the context of this analysis their
precise accuracy is not crucial. Rather it is the broad patterns, relationships and effects that matter.
The models presented attempt to identify the impacts of different approaches to operationalising
Benchmark Land Value in order to assess the consequences for patterns of land value capture in high
density and low density developments in affluent and average regions of England.
Key assumptions made focused on the main development appraisal inputs and are discussed below.
Hypothetical site: The hypothetical site is assumed to be one hectare of ‘bare’, serviced development
land. The models are presented on the basis of costs and revenues per square metre of site and building.
Hypothetical location: For affluent locations, the hypothetical locations are inner London boroughs
such as Camden or Southwark. For average locations, the South-West region has been selected.
Development Revenues: Residential prices were obtained from Office for National Statistics. Based on
an average dwelling size of 80 square metres2, a range of prices per square metre were assumed. For
high density, affluent urban sites a sale price of £7000 psm metre was used. For affluent, greenfield
projects, a sale price of £4500 psm was assumed. Using the South-West region as a benchmark with a
median income closest to the average, for new build estate housing an average sale price of £3,000 per
square metre was assumed. For high density developments in average areas, a sale price of £4,000 per
square metre was assumed. For a two bedroom apartment with an area of 75 square metres, this would
equate to a price of £300,000.
Development costs: Construction costs were based upon the BCIS Tender Price Index. Whilst there are
no standard figures, typical assumptions were made for abnormal costs, external works, professional
fees, sales and marketing fees and land acquisition fees and taxes. Assumptions are made about the
ratio between Gross Internal Area (GIA – essentially amount of space constructed) and Net Internal
Area (NIA – essentially amount of space sold). For the flatted schemes, it is assumed that the GIA is
125% of NIA and for estate housing is it assumed that the GIA is 105% if the NIA.
Density: Commonly used assumptions regarding these density ratios have been made, drawing upon
CIL development viability studies that are in the public domain. For estate housing on greenfield sites,
this is typically 40 units per hectare. For high density projects in affluent areas, density estimates have
2 This figure is cited in Housing in London 2015: The Evidence Base for the Mayor’s Housing Strategy.
14
been derived from an analysis of the project level data in the London Development Database. This has
remained reasonably stable, oscillating around 2.8 square metres of residential development per square
metre of site area. For high density projects in average areas, this density ratio has been adjusted to 2.
Developer profit: Whilst it is a fairly crude metric, a return to the developer has been assumed as a profit
margin of 15%% of the (gross development) value of the project. This is consistent with the Planning
Practice Guidance on viability published with the NPPF.
Discount for affordable housing received by Registered Providers: Given that affordable housing tends
to be the largest source of land value capture, the amount that Registered Providers pay developers for
affordable housing is a key variable. For inner London, McAllister, Shepherd and Wyatt (2018)
concluded that, based on an analysis of viability studies from inner London boroughs, for each non-
market dwelling, developers could expect to receive 30% of Market Value. However, in other areas an
average payment of 70% of Market Value is supportable.
Non-affordable housing planning obligations: In order to estimate the impacts on affordable housing
provision, the effects of other planning obligations need to be taken into account. Whilst CIL can vary
significantly even within a local authority, CIL assumptions were based on broad averages of a number
of Charging Schedules in local planning authorities in the market typologies used. In addition,
additional s106 costs also need to be taken into account. A figure of £65 per square metre has been
allowed for in these costs. This represents approximately £5,000 per dwelling. It may seem fairly low
but it is attempting to exclude s106 costs that may be included in external works.
Development programme: A three-year development period is assumed. Following land purchase, the
first six months is the mobilisation period involving discharge of pre-commencement conditions,
detailed design and construction procurement. Construction costs and professional fees are spread
equally over the remaining eight (urban) or ten (greenfield) quarters. For high density sites, sales are
assumed to be split equally across the 11th and 12th quarters. For low density sites, sales revenues are
assumed to be received in equal amounts over the last eight quarters.
Estimated market prices of land based on comparable sites: Estimates of the ‘going rate’ for housing
sites have been obtained from a range of sources. Although it is likely that there has been a drop in
land prices, the Greater London Authority (2016) presented estimates of residential land values for 2015
of £33.3 million per hectare in Camden, £56.8 million per hectare in Hammersmith and Fulham and
£23.4 million per hectare in Lambeth. Prices for housing land can vary hugely due to differences in
local house prices and abnormal costs. The Valuation Office Agency produce land value estimates at a
local authority level. However, the land value estimates are based on development appraisals that

15
exclude the effect of land value capture through planning obligations. Drawing upon anecdotal
evidence from practitioners, for serviced greenfield sites typical estimates of £4.5 million per hectare
have been made for land in affluent, greenfield areas and £1.5 million per hectare in average, greenfield
sites. Land values in average price, high density locations were very problematic with a huge range of
values being cited. The key issue was that high density developments in these locations tended to
involve be characterised by high values (consequently high developer profit) and high costs. However,
in many cases, the gap between costs and revenues can be narrow with small relative variations in costs
and revenues leading to large absolute and relative changes in land values. In business terminology,
the ratio of operational gearing is higher for such sites. The results of the various appraisals are
presented below and the cash flow models can be viewed in Appendix 1.
Results
The results of the appraisals are displayed in Table 2. As suggested above, the affluent urban site is
assumed to be an inner London location. It is also assumed that the Market Value of the site in its
current use (typically described as Existing Use Value) is £5,000,000 per hectare. This is a plausible
figure for a site suitable for industrial or logistics use in inner London. The value of the site without
planning obligations is estimated at £47,200,000. This is essentially the product of a Net Development
Value of £190 million less approximately £110.6 million of construction costs and professional fees,
£3 million for land acquisition fees and £29.4 million developer’s profit. The profit (15% of GDV) is
equivalent to an IRR of just under 10% per annum. With an EUV of £5 million, there is £42.2 million
remaining land value uplift that can potentially be captured. The three potential policy approaches to
setting BLV are then applied to assess the scope for affordable housing provision and the implied
betterment tax rate on the land value uplift generated by the planning consent.
In the first option, the BLV is estimated drawing upon recent sales of similar sites which have indicated
that a figure of £30 million is appropriate. This type of comparison, mark-to-market method is a
common approach to estimating Market Value. Assuming this land cost, there is £17.2 million of land
value that can be captured through planning obligations. £4 million is assumed to allocated to CIL and
other s106 costs (n.b. other s106 costs exclude items that would have been provided by the developer
in the absence of a policy requirement). This represents approximately £13,500 per dwelling. The
remaining £13.2 million represents revenue that is available for affordable housing. Assuming that the
developer will receive 30% of the market price for each affordable unit, this allows for an affordable
housing proportion of 15%. Assuming 300 dwellings per hectare, 45 affordable units are provided.

16
Table 2 Land Value Capture and Benchmark Land Value: Simulation Results
Affluent
Urban
Affluent
Greenfield
Average
Urban
Average
Greenfield
Estimated land value per hectare: no planning
obligations £47,200,000 £6,700,000 £3,850,000 £2,090,000
Estimated land value in existing use per hectare £5,000,000 £25,000 £500,000 £25,000
Estimated Market Value of land per hectare based on
transaction prices £30,000,000 £4,000,000 £3,000,000 £1,300,000
Estimated land value uplift per hectare £42,200,000 £6,675,000 £3,350,000 £2,065,000
BLV Option 1 (Market Value) £30,000,000 £4,000,000 £3,000,000 £1,300,000
BLV Option 2 (50/50 Uplift Share) £26,100,000 £3,387,500 £1,675,000 £1,082,500
BLV Option 3 (10% of GDV) £24,600,000 £1,739,286 £7,766,990 £1,225,000
BLV Option 1: Estimated land value capture per hectare £17,200,000 £2,700,000 £850,000 £580,000
BLV Option 2: Estimated land value capture per hectare £21,100,000 £3,312,500 £1,675,000 £1,007,500
BLV Option 3: Estimated land value capture per hectare £22,600,000 £4,977,427 £0 £739,951
BLV Option 1: Estimated viable affordable housing (%) 15% 24% 0% 15%
BLV Option 2: Estimated viable affordable housing (%) 20% 31% 0% 22%
BLV Option 3: Estimated viable affordable housing (%) 21% 50% 0% 18%
BLV Option 1: Implied betterment tax rate 41% 40% 25%3 30%
BLV Option 2: Implied betterment tax rate 50% 50% 50% 50%
BLV Option 3: Implied betterment tax rate 54% 75% 0% 39%
3 Reflects CIL and other s106 costs.

17
The developer loses approximately £300,000 in potential revenue for each affordable unit. Given that
the land price is based upon existing development land transaction evidence, it would be expected that
this level of affordable provision would be consistent with the existing policy regime. This level of
planning obligations equates to an implied betterment tax rate of 41% (£17,200,000/£42,200,000).
The second BLV option is an equal split of the land value uplift between the community and the land
owner. In this scenario, this creates land value capture through planning obligations with a cash value
equivalent to £21,100,000 in cash term (£42,200,000/2). Perhaps obviously, this level of planning
obligations equates to an implied betterment tax rate of 50%. Since a lower amount is payable to the
land owner, there is more scope for affordable housing. In this option, the estimated viable affordable
housing contribution is 19.5%. Assuming 300 dwellings per hectare, this represents an additional of
15 affordable units compared to the first option. In the third option, the developer is assumed to receive
the EUV plus 10% of the GDV assuming no planning obligations. The BLV is therefore £24,600,000
per hectare. In this scenario, this creates land value capture through planning obligations with a cash
value equivalent to £22,600,000 in cash term. This allows for an affordable housing proportion of
21%. This level of planning obligations equates to an implied betterment tax rate of 54%.
For low density schemes in affluent areas, there is a much lower GDV due to a combination of lower
values and lower density. As suggested above, the affluent greenfield site is assumed to be an outer
London/shire location. A number of changes have also been made to assumptions about construction
costs, sale prices, professional fees and, importantly, affordable housing sales discount. The latter has
been assumed to be 50%. For this scenario, it has also been assumed that dwellings are sold in (eight
equal) phases with sales starting after one year. The Market Value of the site in its current use (typically
described as Existing Use Value) is estimated £25,000 per hectare which is broadly in line with
agricultural land values. The value of the site without planning obligations is estimated at £6,500,000
per hectare. This is consistent with estimates found in data produced for the MHCLG by the Valuation
Office Agency4 for this category of local authority. This land price of £6.5 million per hectare is
essentially the product of a Net Development Value of approximately £17.5 million less approximately
£9.4 million of construction costs and professional fees, £400,000 for land acquisition fees and £2.7
million developer’s profit. Reflecting the more favourable cash flow pattern relative to a single building
flatted scheme, the profit (15% of GDV) produces an IRR of just over 15% per annum. With an EUV
of £25,000 per hectare, there is £6.475 million (£6,500,000 - £25,000) remaining land value uplift that
can potentially be captured.
4 Details of the methods and results can be found at
https://assets.publishing.service.gov.uk/government/uploads/system/uploads/attachment_data/file/710539/Land_
Values_2017.pdf

18
In the first option, the BLV is estimated drawing upon recent sales of similar sites which have indicated
that a figure of £4 million is appropriate. Assuming this land cost, there is £2.5 million of land value
that can be captured through planning obligations. £600,000 is assumed to allocated to CIL and other
s106 costs. This represents approximately £15,000 per dwelling. The remaining £2.1 million represents
revenue that is available for affordable housing. Assuming that the developer will receive 50% of the
market price for each affordable unit, this allows for an affordable housing proportion of 23.5%. Again,
it would be expected that this level of affordable provision would be consistent with the existing policy
regime. The second option of an equal split in the land value uplift produces a lower BLV at £3,262,500.
In this scenario, this creates land value capture through planning obligations with a cash value
equivalent to £3,312,500 in cash term. This allows for an affordable housing proportion of 31%. This
level of planning obligations equates to an implied betterment tax rate of 50%. The third option
produces a significantly lower BLV of £1,825,000. This then allows for a greater element of land value
capture resulting in an estimated viable affordable proportion of 50% and producing an implied
betterment tax rate of just over 74%.
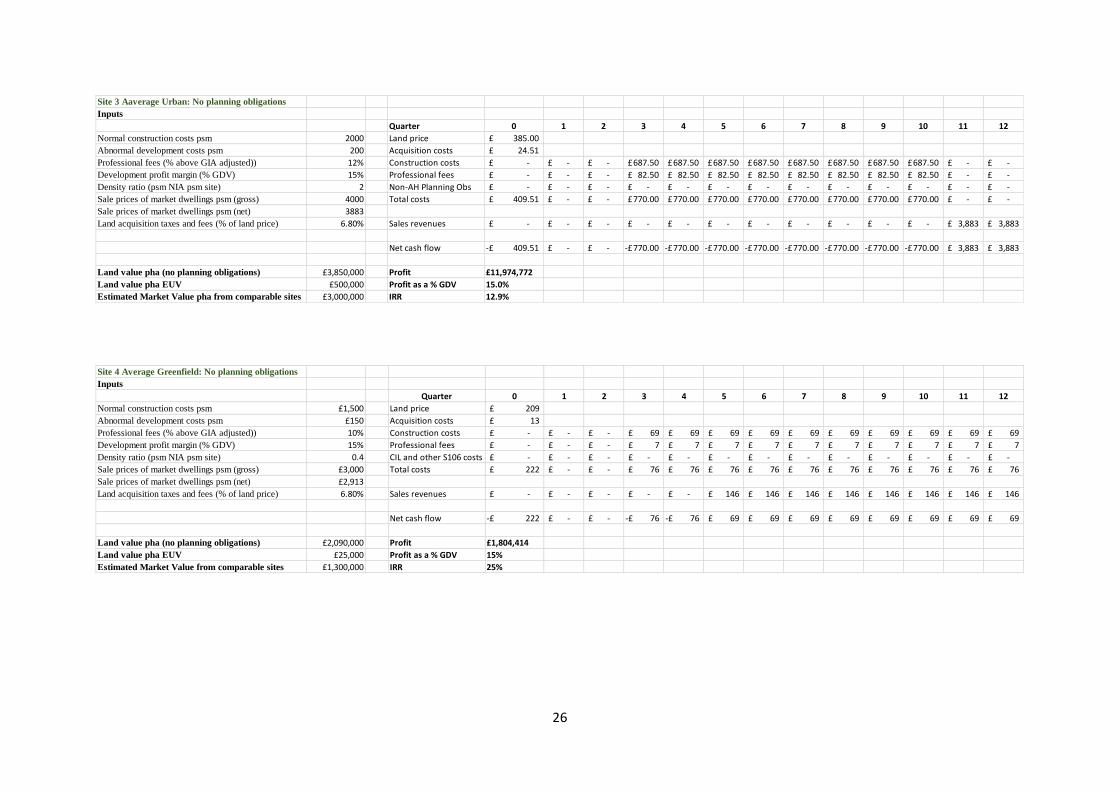
For greenfield sites in areas with average house prices, the pattern of estimated land values is much
lower. The estimated land value with no planning obligations is £2,090,000 per hectare. Assuming the
same EUV as for affluent greenfield areas, there is an estimated potential land value capture of
£2,065,000. Based on transaction evidence, the ‘going rate’ for housing land is estimated at £1,300,000
per hectare. In this scenario, it is assumed that Registered Providers will pay on average 70% of the
Market Value of affordable dwellings. The pattern pf land value capture is broadly similar to the
greenfield sites in high house price areas. However, the estimated viable affordable housing proportions
are 15%, 25% and 18% for the three options are lower. The three options for BLV produce estimated
viable affordable housing proportions of 15%, 25%, and 18% and implied betterment tax rates of 30%,
50% and 39%.
High density sites in areas of average house prices tend to produce the most volatile pattern of land
value capture. The key issues is that the combination of high gross development values and high non-
land development costs tend to produce land value and land value capture estimates that are very
sensitive to relatively small changes in the cost and value inputs. In addition, when land values are low
relative to the GDV, a BLV linked to GDV tends to result in no potential for land value capture. A
further consequence of such high GDV/low land value sites is that non-affordable housing planning
obligations such as CIL tend to capture any available land value capture. This finding is consistent with
controversy regarding the lack of affordable housing provision in high density developments in central
Manchester and in the city centres of other large cities such as Sheffield and Nottingham.

19
Some of the UK’s biggest cities are allowing developers to plan huge new residential developments
containing little or no affordable housing, a Guardian Cities investigation has found…In
Manchester, none of the 14,667 homes in big developments granted planning permission by the
council’s planning committee in the last two years are set to be “affordable” (Pidd, 2018)
Unlike inner London where sale prices can commonly be more than three or four times construction
costs, such prices are not prevalent in regional cities. Due to a lower density and lower prices, a one
hectare site in an average regional city is expected to produce a GDV of £80 million compared to
approximately £170 million in inner London. With relatively little variation in development costs
between the sites, the result is huge variation in potential land value capture.
It is estimated that the value of the site without planning obligations is £3,850,000. This is essentially
the product of a Net Development Value of £77.8 million less approximately £61.6 million of
construction costs and professional fees, £2.3 million for land acquisition fees and £12 million
developer’s profit. The profit (15% of GDV) is equivalent to an IRR of just under 13% per annum. The
EUV is uncertain and an estimate of £500,000 is made. The large difference in cash return to the
developer and the land owner is notable here. Given the high GDV, it is clear that linking BLV to GDV
will produce no scope for planning obligations in this scenario. In this case, 10% of GDV is £7.78
million and there is no scope for any planning obligations at all if this BLV option is applied. Assuming
the same CIL payment per square metre as in a low density development with average house prices, the
other BLV options also produces estimated viable affordable housing proportions of zero. A similar
level of CIL and other s106 costs as low density sites in areas with average house prices are also not
viable at these BLV.
Conclusion
Whilst there seems to be an unwillingness amongst policy makers to formalise the betterment tax-like
attributes of planning obligations, most commentators recognise that CIL and s106 contributions
display many of the attributes of such taxes. However, in many ways they are unusual ‘taxes’. Some
planning obligations are negotiable. They are often highly hypothecated, can be paid in kind and are
often loosely linked to ability to pay or to realised financial outcomes. In terms of land value impacts,
the effects of the varied range of planning obligations can also be quite diverse. In some cases, by
reducing negative externalities or creating positive externalities for proximate sites, planning
obligations can serve to preserve or enhance land values in adjacent sites. Other planning obligations
are essentially a mechanism to ensure that developers provide some of the public and merit goods that
in many cases would have been provided by the developer in the absence of a specific requirement.
However, the most important and controversial planning obligation in the UK have been affordable
housing requirements which is a relatively clear-cut form of land value capture.

20
In the last decade, a particular form of calculative practice - the development viability appraisal – has
become a common procedure for setting these quasi-betterment taxes. A highly localised approach to
applying viability tests has proved extremely controversial. When used for policy formation, viability
tests have been used to form area-wide policies that are undeliverable on some sites and/or that tend to
become obsolete over time. When applied to specific schemes in development management, given the
developers’ and consultants’ incentives the procedure has proved to be intrinsically prone to gaming
and manipulation unless robustly governed. Often, the viability tests have lacked transparency and
legitimacy and, as a result, been highly criticised, contested and controversial.
Possibly deliberately, the application of viability tests in the planning system has been procedurally and
operationally unclear and inconsistent. The lack of clear procedural and operational guidance on
applying development viability tests from central government seems to have created a vacuum that
various special interests have tried to fill. Since it effectively determines the level of quasi-betterment
tax that is payable, it is not surprising that defining how much the land owner should receive when
determining the deliverability of planning obligations has been the most controversial issue in
development viability testing. This paper has attempted to assess the implications of the main proposed
approaches to setting Benchmark Land Value for a number of different market contexts.
One notable finding of the simulations is the futility in modelling the potential of different approaches
to BLV in areas with below average house prices. In such areas, due to the small gap between expected
development revenues and expected non-land development costs, the uplifts in land values generated
by planning consent tend to be insufficient to generate any significant level of planning obligations.
This is consistent with the finding that local authorities are much less likely to have introduced CIL in
areas with low house prices (see Wyatt, 2017). Since house prices tend to vary much more than non-
land development costs, the scope for land value capture tends to be much higher in affluent areas.
Again, the concentration, in terms of incidence and value, of planning obligations in London and the
South-East is consistent with this pattern. However, since the vast majority of these planning
obligations are for affordable housing, their distribution is broadly aligned with the spatial distribution
of housing affordability problems.
Having modelled different approaches to Benchmark land Value for a range of market contexts, few
straightforward patterns emerge. Whilst attempting to identify an optimal betterment tax rate is beyond
the scope of this paper, it is clear that it raises complex issues. It is perhaps too obvious to state that
advocates for land owners who argue that the BLV should be based upon historic transaction evidence
of market prices are implicitly trying to preserve a current planning policy regime that has resulted in
high land prices in affluent areas. Arguably, this approach incentivises the supply of land. In the

21
modelling, this approach to BLV tended to produce the lowest levels of estimated viable affordable
housing proportions. Equally splitting the land value uplift produced by planning consent, again perhaps
too obviously, produced a standard implied betterment tax rate of 50% but large ranges of estimated
viable affordable housing proportions. Since affordable housing was realistically assumed to have a
lower priority than payment of CIL and other s106 costs, in areas where the gap between expected
development revenues and expected non-land development costs was expected to be small, affordable
housing was typically not viable at any level with any surplus being ‘mopped up’ by CIL and other
s106 costs.
Probably the most pertinent conclusion regarding the various approaches to land value capture based
upon viability modelling is related to the limitations of the simulations discussed in this paper. They are
based on a mark-to-model method of appraisal of a hypothetical site where the model requires a wide
range of inputs from different specialists. The numerous estimates of development costs, revenues and
timing are prone to uncertainty, disagreement, error and bias. As a result, the effects of relatively small
errors or biases in the major costs and revenue assumptions can have substantial effects on the
proportion of affordable housing estimated to be viable. It has been long recognised that the residual
method of development appraisal is prone to high levels of uncertainty because the output is typically
a function of estimates of revenue and costs inputs that are highly uncertain. Such problems become
more heightened in a development appraisal used to estimate affordable housing capacity where the
estimated viable affordable housing proportion is essentially a residual of a residual. Even if an accepted
operational definition of BLV were to emerge, the use of viability models prone to such levels of error
and potential bias to set and implement planning policy is likely to remain vulnerable to opportunistic
behaviour and prone to miscalculation.
Since accurate calibration of a financial viability model is largely unattainable, it is proposed that a
parsimonious viability model that makes general and generous assumptions regarding returns to land
owners and developers will be the least problematic approach to forming policies for planning
obligations. This approach i presumes that sites with similar land value uplifts triggered by a consent
should have similar levels of planning obligations. As similar sites are expected to have similar
development costs, it should be possible to generate indicators of expected planning obligations that
can be directly linked to local property prices. A secondary, but also important, requirement is that,
since the estimation of value uplifts is intrinsically uncertain and precise calibration of estimates of
planning obligations is largely spurious, policies based upon viability tests should not be challengeable
on the detailed but uncertain model assumptions. Given the strong incentives (i.e. the trade-offs between
land value and/or profit and the level of planning obligations), it needs to be accepted that land owners
and/or developers will attempt to ‘game’ any viability testing process (and other parts of the policy
making or development management process) that is put in place. Exceptions from policy should only

22
be acceptable where significant abnormal costs can be demonstrated. On the competitive return to the
land owner, quasi ‘tax’ rates can seem arbitrary. On this taxing problem, it is proposed that land owner
should receive a return that is similar to the developer. It seems reasonable that the land owner obtains
a similar profit as the developer from a project?
23
References
ALTERMAN, R. (2012), Land use regulations and property values: The 'Windfalls Capture' idea
revisited. in The Oxford Handbook of Urban Economics and Planning Brooks, n., Donaghy, K. and
Knaap, G (eds.), 755-786.
BOWERS, J. (1992), The economics of planning gain: a re-appraisal, Urban Studies, 29 (8), 1329-
1339.
CAMPBELL, H., ELLIS, H., HENNEBERRY, J. and GLADWELL, C. (2000), Planning obligations,
planning practice, and land-use outcomes, Environment and Planning B: Planning and Design, 27 (5),
759-775.
CORKINDALE, J., (2004), The land use planning system: evaluating options for reform, Institute of
Economic Affairs.
CROOK, T. and MONK, S. (2011), Planning gains, providing homes, Housing Studies, 26 (7-8), 997-
1018.
CROOK, A.T.D. and WHITEHEAD, C.M., (2002), Social housing and planning gain: is this an
appropriate way of providing affordable housing?, Environment and Planning A, 34 (7), 1259-1279.
CROSBY, N. and WYATT, P. (2016), Financial viability appraisals for site-specific planning decisions
in England, Environment and Planning C, 34 (8), 1716-1733.
EVANS A, (1983), The determination of the price of land, Urban Studies 20 119–129
EVANS‐COWLEY, J. S., FORGEY, F. A. and RUTHERFORD, R. C. (2005), The effect of
development impact fees on land values, Growth and Change, 36 (1), 100-112.
GREATER LONDON AUTHORITY. (2016), London Industrial Land Supply and Economy 2015
HEALEY P, PURDUE M. and ENNIS F. (1996), Negotiating development: planning gain and
mitigating impacts, Journal of Property Research 13 143-160
HENNEBERRY, J. (2015) Development Viability, in Crook, T., Henneberrry, J. and Whitehead, C.
(eds) Planning gain: Providing infrastructure and affordable housing. John Wiley & Sons.
HOMES AND COMMUNITIES AGENCY. (2010), Area Wide Viability Appraisal – Transparency of
Assumptions, Draft Working Notes.
KEOGH, G., (1985), The economics of planning gain, In Land Policy: Problems and Alternatives,
Barrett, S and Healey, P (eds) 203-228.
MCALLISTER, P. (2017), The Calculative Turn in Land Value Capture: Lessons from the English
Planning System, Land Use Policy, 63, 122-129.
MCALLISTER, P., WYATT, P. and COLEMAN, C. (2013), Fit for Policy? Some Evidence on the
Application of Development Viability Modelling in the UK Planning System, Town Planning Review,
84, 495-521.
MCALLISTER, P., SHEPHERD, E. and WYATT, P. (2018), Policy Shifts, Developer Contributions
and Land Value Capture in London 2005-2017, Land Use Policy, 78, 316-326.

24
MINISTRY OF HOUSING, COMMUNITIES AND LOCAL GOVERNMENT. (2018), National
Policy Planning Framework.
THE PEEL GROUP. (2018), Written Evidence Submitted to the Parliamentary Select Committee on
Land Value Capture, see
http://data.parliament.uk/writtenevidence/committeeevidence.svc/evidencedocument/housing-
communities-and-local-government-committee/land-value-capture/written/85908.html
PIDD, H. (2018), Housing crisis: 15,000 new Manchester homes and not a single one 'affordable', The
Guardian, 5 March, 2008.
WHITEHEAD, C.M. (2007). Planning policies and affordable housing: England as a successful case
study?. Housing Studies, 22 (1), 25-44.
WYATT, P. (2017), Experiences of running negotiable and non-negotiable developer contributions
side-by-side, Planning Practice & Research, 32 (2), 152-170.

25
Appendix 1: Site Appraisals
Site 1 Affluent Urban: No planning obligations Cash Flow Appraisal
Inputs Quarter 0 1 2 3 4 5 6 7 8 9 10 11 12
Land price psm 4,720£ -£ -£ -£ -£ -£ -£ -£ -£ -£ -£ -£ -£
Normal construction costs psm £2,500 Acquisition costs 301£ -£ -£ -£ -£ -£ -£ -£ -£ -£ -£ -£ -£
Abnormal development costs psm £250 Construction costs -£ -£ -£ 1,203£ 1,203£ 1,203£ 1,203£ 1,203£ 1,203£ 1,203£ 1,203£ -£ -£
Professional fees (% above GIA adjusted)) 15% Professional fees -£ -£ -£ 180£ 180£ 180£ 180£ 180£ 180£ 180£ 180£ -£ -£
Development profit margin (% GDV) 15% CIL and other S106 costs -£ -£ -£ -£ -£ -£ -£ -£ -£ -£ -£ -£ -£
Density ratio (psm NIA psm site) 2.8 Total costs 5,021£ -£ -£ 1,384£ 1,384£ 1,384£ 1,384£ 1,384£ 1,384£ 1,384£ 1,384£ -£ -£
Sale prices of market dwellings psm (gross) £7,000
Sale prices of market dwellings psm (net) £6,796 Sales revenues -£ -£ -£ -£ -£ -£ -£ -£ -£ -£ -£ 9,515£ 9,515£
Land acquisition taxes and fees (% of land price) 6.80%
Net cash flow 5,021-£ -£ -£ 1,384-£ 1,384-£ 1,384-£ 1,384-£ 1,384-£ 1,384-£ 1,384-£ 1,384-£ 9,515£ 9,515£
Land value pha (no planning obligations) £47,200,000 Profit £29,398,519
Land value pha EUV £5,000,000 Profit as a % GDV 15.0%
Estimated Market Value from comparable sites £30,000,000 IRR 9.81%
Site 2 Affluent Greenfield: No planning obligations
Inputs Quarter 0 1 2 3 4 5 6 7 8 9 10 11 12
Land price 670.00£
Normal construction costs psm 1500 Acquisition costs 42.66£
Abnormal development costs psm 150 Construction costs -£ -£ -£ 69.30£ 69.30£ 69.30£ 69.30£ 69.30£ 69.30£ 69.30£ 69.30£ 69.30£ 69.30£
Professional fees (% above GIA adjusted)) 10% Professional fees -£ -£ -£ 6.93£ 6.93£ 6.93£ 6.93£ 6.93£ 6.93£ 6.93£ 6.93£ 6.93£ 6.93£
Development profit margin (% GDV) 15% Non-AH Planning Obs -£ -£ -£ -£ -£ -£ -£ -£ -£ -£ -£ -£ -£
Density ratio (psm NIA psm site) 0.4 Total costs 712.66£ -£ -£ 76.23£ 76.23£ 76.23£ 76.23£ 76.23£ 76.23£ 76.23£ 76.23£ 76.23£ 76.23£
Sale prices of market dwellings psm (gross) 4500
Sale prices of market dwellings psm (net) 4369 Sales revenues -£ -£ -£ -£ -£ 218.45£ 218.45£ 218.45£ 218.45£ 218.45£ 218.45£ 218.45£ 218.45£
Land acquisition taxes and fees (% of land price) 6.80%
Net cash flow 712.66-£ -£ -£ 76.23-£ 76.23-£ 142.22£ 142.22£ 142.22£ 142.22£ 142.22£ 142.22£ 142.22£ 142.22£
Land value pha (no planning obligations) £6,700,000 Profit £2,726,136
Land value pha EUV £25,000 Profit as a % GDV 15%
Estimated Market Value from comparable sites £4,000,000 IRR 15%
26
Site 3 Aaverage Urban: No planning obligations
Inputs
Quarter 0 1 2 3 4 5 6 7 8 9 10 11 12
Normal construction costs psm 2000 Land price 385.00£
Abnormal development costs psm 200 Acquisition costs 24.51£
Professional fees (% above GIA adjusted)) 12% Construction costs -£ -£ -£ 687.50£ 687.50£ 687.50£ 687.50£ 687.50£ 687.50£ 687.50£ 687.50£ -£ -£
Development profit margin (% GDV) 15% Professional fees -£ -£ -£ 82.50£ 82.50£ 82.50£ 82.50£ 82.50£ 82.50£ 82.50£ 82.50£ -£ -£
Density ratio (psm NIA psm site) 2 Non-AH Planning Obs -£ -£ -£ -£ -£ -£ -£ -£ -£ -£ -£ -£ -£
Sale prices of market dwellings psm (gross) 4000 Total costs 409.51£ -£ -£ 770.00£ 770.00£ 770.00£ 770.00£ 770.00£ 770.00£ 770.00£ 770.00£ -£ -£
Sale prices of market dwellings psm (net) 3883
Land acquisition taxes and fees (% of land price) 6.80% Sales revenues -£ -£ -£ -£ -£ -£ -£ -£ -£ -£ -£ 3,883£ 3,883£
Net cash flow 409.51-£ -£ -£ 770.00-£ 770.00-£ 770.00-£ 770.00-£ 770.00-£ 770.00-£ 770.00-£ 770.00-£ 3,883£ 3,883£
Land value pha (no planning obligations) £3,850,000 Profit £11,974,772
Land value pha EUV £500,000 Profit as a % GDV 15.0%
Estimated Market Value pha from comparable sites £3,000,000 IRR 12.9%
Site 4 Average Greenfield: No planning obligations
Inputs
Quarter 0 1 2 3 4 5 6 7 8 9 10 11 12
Normal construction costs psm £1,500 Land price 209£
Abnormal development costs psm £150 Acquisition costs 13£
Professional fees (% above GIA adjusted)) 10% Construction costs -£ -£ -£ 69£ 69£ 69£ 69£ 69£ 69£ 69£ 69£ 69£ 69£
Development profit margin (% GDV) 15% Professional fees -£ -£ -£ 7£ 7£ 7£ 7£ 7£ 7£ 7£ 7£ 7£ 7£
Density ratio (psm NIA psm site) 0.4 CIL and other S106 costs -£ -£ -£ -£ -£ -£ -£ -£ -£ -£ -£ -£ -£
Sale prices of market dwellings psm (gross) £3,000 Total costs 222£ -£ -£ 76£ 76£ 76£ 76£ 76£ 76£ 76£ 76£ 76£ 76£
Sale prices of market dwellings psm (net) £2,913
Land acquisition taxes and fees (% of land price) 6.80% Sales revenues -£ -£ -£ -£ -£ 146£ 146£ 146£ 146£ 146£ 146£ 146£ 146£
Net cash flow 222-£ -£ -£ 76-£ 76-£ 69£ 69£ 69£ 69£ 69£ 69£ 69£ 69£
Land value pha (no planning obligations) £2,090,000 Profit £1,804,414
Land value pha EUV £25,000 Profit as a % GDV 15%
Estimated Market Value from comparable sites £1,300,000 IRR 25%