Incomplete Dominance, Co-Dominance, & Multiple Alleles March 23, 2009.

ISSN 0856-4965
The Tanzania Forestry Research Institute
(TAFORI)
Newsletter
Vol. 8 No. 2 December, 2017
Published by Tanzania Forestry Research Institute (TAFORI)
P.O. Box 1854, Morogoro, Tanzania
Tel: +255 23 2604498/2604532
Fax: +255 23 2603725
E- mail: [email protected]
Website: www.tafori.or.tz
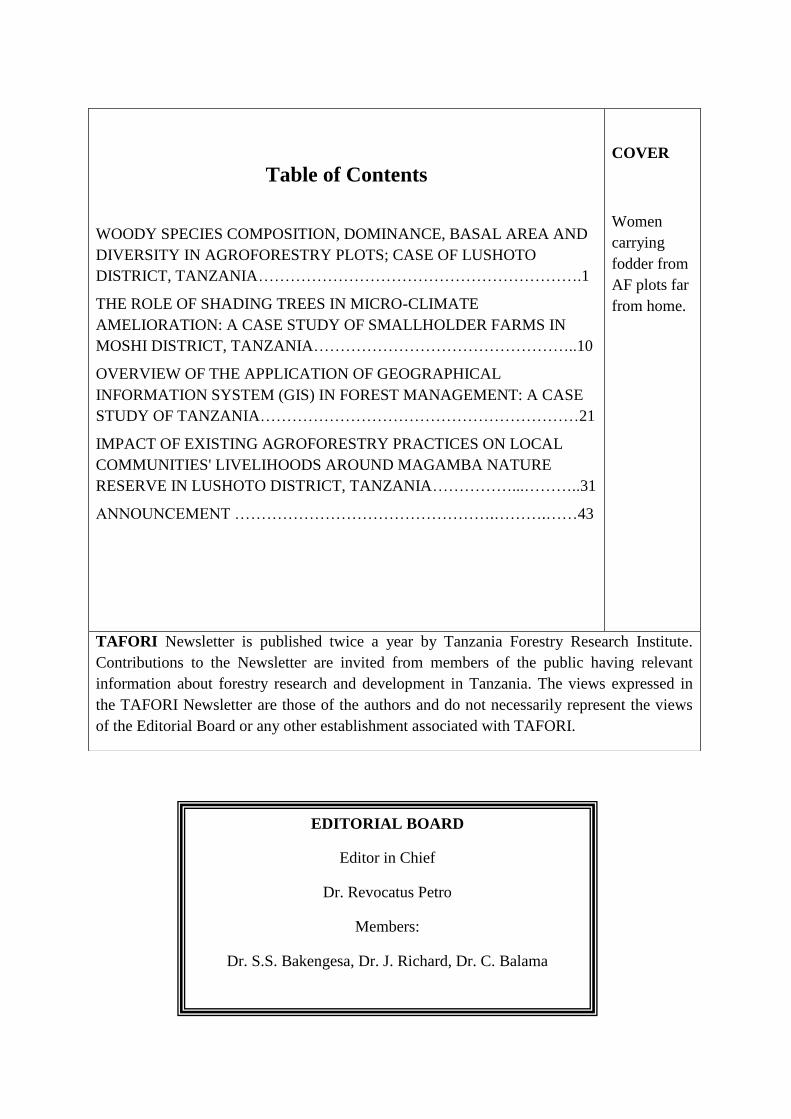
Table of Contents
WOODY SPECIES COMPOSITION, DOMINANCE, BASAL AREA AND
DIVERSITY IN AGROFORESTRY PLOTS; CASE OF LUSHOTO
DISTRICT, TANZANIA…………………………………………………….1
THE ROLE OF SHADING TREES IN MICRO-CLIMATE
AMELIORATION: A CASE STUDY OF SMALLHOLDER FARMS IN
MOSHI DISTRICT, TANZANIA…………………………………………..10
OVERVIEW OF THE APPLICATION OF GEOGRAPHICAL
INFORMATION SYSTEM (GIS) IN FOREST MANAGEMENT: A CASE
STUDY OF TANZANIA……………………………………………………21
IMPACT OF EXISTING AGROFORESTRY PRACTICES ON LOCAL
COMMUNITIES' LIVELIHOODS AROUND MAGAMBA NATURE
RESERVE IN LUSHOTO DISTRICT, TANZANIA……………...………..31
ANNOUNCEMENT ………………………………………….……….……43
COVER
Women
carrying
fodder from
AF plots far
from home.
TAFORI Newsletter is published twice a year by Tanzania Forestry Research Institute.
Contributions to the Newsletter are invited from members of the public having relevant
information about forestry research and development in Tanzania. The views expressed in
the TAFORI Newsletter are those of the authors and do not necessarily represent the views
of the Editorial Board or any other establishment associated with TAFORI.
EDITORIAL BOARD
Editor in Chief
Dr. Revocatus Petro
Members:
Dr. S.S. Bakengesa, Dr. J. Richard, Dr. C. Balama
Mr. Kaisi Mwaikambo Dr.J. Richard
Dr.R. Petro Dr.C. Balama Mr. A. J.
Uisso

1
WOODY SPECIES COMPOSITION, DOMINANCE, BASAL AREA AND DIVERSITY
IN AGROFORESTRY PLOTS; CASE OF LUSHOTO DISTRICT, TANZANIA
1Mndolwa, M.A.,
1Kagosi, P.J.,
1Japhet, E.M.,
2Sabuni, F. and
2Kirenga, R.
1Tanzania Forestry Research Institute, P.O Box 1854, Morogoro.
2Eastern Arc Mountain Endowment Fund, P.O. Box 6053, Morogoro
Correspondence author email: [email protected]
ABSTRACT
The ecological benefits of Agroforestry (AF) systems dependent on a number of factors
including type and arrangement of woody species, density and type of crop planted. The aim of
this study was to assess woody species composition, dominance, basal area and diversity in AF
plots in Lushoto district. Four villages practicing AF, i.e. Migambo, Kwembago, Kinko and
Mavumo were purposively selected for both biophysical and socio-economic data collection.
Socio-economic data were collected using focus group discussions and questionnaire. For
collection of biophysical data, one transect was established across each village. A total of 60
quadrats (20m x 20m) were laid in AF plots along the four transects. In each quadrat woody
species with Diameter at Breast Height (DBH) ≥5cm were numbered, counted, identified by
species and assessed. The dominant tree species were determined on the basis of their Important
Value Index (IVI) and species diversity by Shannon-Wiener diversity index (H‟). Results
showed that the most (61%) practiced AF was agri-silviculture. Some 20 families comprising of
27 woody species were recorded. Grevillea robusta was a dominating contributing 29% of the
total tree species in the study area. The species also had the highest (70.1) average IVI. The mean
trees' basal area within AF plots was 2.83m2/ha with average Shannon-Wiener diversity index
(H‟) of 1.86. The study concluded that current levels of species composition, dominance, basal
area and diversity in AF plots are capable of providing acceptable ecological benefits. However,
increasing number and species of tree component in AF plots is recommended.
Key words: Agroforestry, Basal area, Species diversity, Woody species composition
INTRODUCTION
There are various definitions of Agroforestry (AF). However, the definition given by Lundgren
and Raintree, (1982) cited by Nair (1993), provides a clear and practical definition of AF.
Lundgren and Raintree (1982) defined AF as a collective name for land-use systems and
technologies where woody perennials (eg. trees, shrubs, palms, bamboos) are deliberately
planted on the same land-management units as agricultural crops and/or animals, in some form
of spatial arrangement or temporal sequence. AF is a dynamic ecologically based natural
resources management system that sustains production (Molla and Kewessa, 2015). In their
combination, trees and crops (components) take advantage of interactions between them in the
farming system. In AF, species composition is one of major components of biologically spatial
structure (Huang et al., 2003). The presence of various trees and shrub species improves the
value of AF. For example, the presence of herbaceous food resources has been reported to
improve honey production and bees diversity (Hoehn et al., 2010). On the other hand, soil
organic carbon content was found to be positively correlated with both tree density and species
2
richness (Islam et al., 2015). Islam et al. (2015) further reported that species-rich AF
technologies like homegarden with high tree density can sequester more carbon in soil thereby
contributing more to climate change mitigation.
Originally, AF within Lushoto district involved the use and protection of trees and shrubs by
farmers in agricultural landscapes (Dawson et al., 2013) for fodder, fuel wood, medicines and
building materials (Scherr, 1990). Farmers retain various tree components based on spaces
available and their compatibility with agricultural crops and household needs (Mekonnen et al.,
2014). This was considered an important step in conserving tropical trees (Dawson et al., 2013).
The study by Namwata et al. (2012) in Lushoto district revealed that AF systems have potential
for their high level of productivity. Through the time, AF transformed into present various
technologies. Among the technologies, homegarden has become a popular land-use in Lushoto
district. It was reported that, the homegarden supports sequestration of organic carbon in soil
more than crops, monoculture plantations and even other AF systems (Islam et al., 2015). The
system is believed to be more diverse due to combination of crops, trees and livestock
(Mekonnen et al., 2014).
AF has been considered to have high diversity. For example, the study by Mwangoka et al.
(2010) reported that in some cases diversity level of AF systems is as higher as those of natural
forests. Normally, diversity is influenced by presence of one or more species with higher
frequencies of occurrence. It is important to consider species and growth patterns of various tree
components in AF as species diversity is significantly associated with structure and species
composition (Huang et al., 2003). Various scientists accept that diversity of trees is fundamental
to total trees biodiversity (Huang et al., 2003). This paper highlights on woody species
composition, dominance, basal area and diversity in AF plots in Lushoto district.
MATERIALS AND METHODS
Description of study area
The study was conducted in Lushoto district in purposively selected four villages practicing AF
namely Migambo, Kwembago, Kinko and Mavumo. The district is found within longitudes 38o
05‟ and 38o
38‟E and latitudes 4o 22‟ and 5
o 08‟ S and altitude ranging from 600 - 2300 meters
above sea level (Huwe and Mwihomeke, 1990). The area has relatively cool and less humid
climate with maximum temperatures in March and minimum in July (Wiersum et al., 1985).
During cold seasons temperatures may go down to 8oC while 30
oC are common during hot
seasons (Nasser et al., 1993). Lushoto district receives mean rainfall of 800 - 2,000 mm in the
highland and between 500 - 800 mm per annum in the lowlands. Long rains fall between March
and June and short rains between October and December. The district receives some intermediate
rains between July and September. The study villages were in the highland.
The district has considerable relief with steep slopes (Kihiyo, 1985). The larger part of the district
has deep red earth soil and intermediate metamorphic rocks with surface pH of 5.85 (Maro et al.,
2014). The seasonally flooded soils of the lower valleys are quite deep and fertile with a loamy,
blackish – brown alluvium. Some patches of Montane forests are found within the district
(Hamisy and Mathias, 2001). The major economic activities in Lushoto district are mainly
agriculture, livestock keeping and small businesses.

3
Data collection and analysis
Data collection
Four villages Migambo, Kwembago, Kinko and Mavumo practicing AF were purposively
selected for both biophysical and socio-economic data collection.
(i) Biophysical data collection
One transect along the gradient was established in each village to cover altitudinal variations.
GPS was used to locate data collection quadrats. A total of 60 (20m x 20m) adopted from Molla
and Kewessa (2015) were systematically laid along the transect in AF plots. In each quadrat
woody species (trees and shrubs) were marked and recorded in the field for their occurrences and
identified for their respective botanical name by the botanist. All trees with Diameter at Breast
Height (DBH) ≥ 5 were numbered, counted and identified by species (Huang et al., 2003).
Collected data included; number of individual tree/shrub species, DBH and specie's name.
(a) Tree/shrub species composition and dominance
Tree/shrub species composition
Identified individual tree species were arranged alphabetically in spreadsheet and thereafter the
list and number of species in the AF plots was obtained.
Tree/shrub species dominance
The dominant tree species were determined on the basis of their Important Value Index (IVI).
The IVI gives a combined standard measure of abundance, density and dispersion for each
species (Kent and Coker, 1992). It is a composite index based on the relative measures of species
frequency, abundance, and dominance and it indicates the significance of species in the system
(Molla and Kewessa, 2015). The higher the IVI the more ecologically dominant and important
the tree species is in a given plant community (Shrestha et al., 2000; Reddy et al., 2008). The IVI
for each individual tree species was determined using the formula recommended by Mueller-
Dombois and Ellenberg (1974).
IVI = (RD + RDo + RF)………....………………………………………………………….(1)
Where:
RD = 100 number of individuals of the species/number of individuals of all species
RDo = 100 total basal area of the species/ total basal area of all species
RF = 100 number of occurrence of the species/number of occurrences of all species
(b) Tree Species diversity Shannon Wiener Index (H‟) was used to determine species diversity of woody perennials in the
AF plots. The index accounts for both abundance and evenness of the species present where two
components of diversity are combined (i) the number of species and (ii) equitability or evenness
portion of individuals among the species (Molla and Kewessa, 2015). The index is described
mathematically as follows:-
4
S
H‟ = -pi Ln pi …………………………………………………………… (2)
i=1
Where;
H‟ = Shannon–Wiener index
Pi = the proportion of all individuals in the sample that belong to species i
S = total number of plant species
Ln = loge = natural logarithm of pi (e = 2.71828).
Pi =
N
ni
Where; ni = total number of individuals in the ith
species N = total number of individuals of all species
The Shannon Wiener index assumes that all the species from the community are included in the
samples. The value usually lies between 1.5 and 3.5 although it can occasionally exceed 4.5
(Kent and Coker, 1992). High value of H' indicates high diversity.
(ii) Socio-economic data collection
Socio-economic data were collected using focus group discussions and questionnaire methods.
This data were collected to supplement biophysical data and information.
RESULTS AND DISCUSSION
It was observed that types of AF practiced were influenced by farm sizes. In general 75% of the
households reported to own less land than what they need. Sixty three percent of the households
had less than 2 acres while 37% had more than 2 acres. The most popular (61%) AF practice in
the study area was agri-silviculture. Agri-silviculture, api-silviclture, woodlots, boundary
planting, agri-silvi-pastoral and home gardens were commonly practiced in Migambo and
Kwembago villages, while alley cropping, woodlots, agri-silviculture, boundary planting and
api-silviculture were common in Mavumo and Kinko villages. In common, woodlots was less
practiced in all villages. Agri-silvipastoral was common in Mavumo and Kinko villages because
41% households in these villages have relatively larger pieces of land (>2ha) against Migambo
and Kwembago who in average 30% have >2ha.
Woody species composition in AF plots
A total of 27 (22 trees and 5 shrubs) woody species belonging to 20 families (Table 1) were
recorded within AF plots in the study area. The recorded woody species were far less than those
(44 woody species) found in homegarden in Ethiopia (Mekonnen et al., 2014), 45 tree species
recorded by Munishi et al., (2006) in farm tree retention in Bumbuli ward in Lushoto district and
55 woody species belonging to 31 families gathered in traditional AF plots in Ethiopia (Molla
and Kewessa, 2015). Table 1 below shows a list of trees and shrubs found in AF plots in the
study area.

5
Table1: List of woody species (trees and shrubs) found in AF plots
Species Type Family Species Type Family
Acrocarpus
fraxinifolius
Tree Caesalpiniaceae Juniperus procera Tree Cupressaceae
Albizia schimperiana Tree Leguminosae Olea capensis
Tree Oleaceae
Annona spp
Tree Annonaceae Persea americana Tree Lauraceae
Brassica spp.
Shrub Brassicaceae
Persea domestica Tree Pinaceae
Citrus spp. Tree Rutaceae Pinus patula. Tree Pinaceae
Croton spp. Tree Euphorbiaceae Prunus persica Tree Pinaceae
Cupressus lusitanica Tree Cupressaceae Prunus domestica Tree Rosaceae
Dioscorea spp. Shrub Dioscoreaceae Prunus japonica Shrub Rosaceae
Ficus spp. Tree Moraceae Psidium guajava Tree Myrtaceae
Grevillea robusta Tree Proteaceae Rauvolfia caffra Tree Apocynaceae
Eriobotrya japonica Tree Rosaceae Solanum gilo Shrub Solanaceae
Euclea fructuosa Tree Ebenaceae Tectona grandis Tree Lamiaceae
Eucalyptus spp. Tree Myrtaceae Turraea robusta Shrub Meliaceae
E. Saligna Tree Myrtaceae
Generally G. robusta was a dominating tree species in all villages contributing 29% of the total
tree species. The least occurring included; T. grandis and Ficus spp (0.5% each), A.
schimperiana, Annona spp., Dioscorea spp, O. capensis and Brassica spp. (with 0.6% each).
Acrocarpus spp, Prunus domestica and C. lusitanica were found in Migambo and Kwembago
villages only while Euclea fractuosa, O. capensis and Brassica spp were found in Kinko and
Mavumo villages. It is reported that different traditions and different agro-ecological conditions
dictate the type of tree species that are likely to be accommodated on farm (Munishi et al., 2006).
Presence of many woody species in AF plots provides various woody products for households
livelihood need (e.g. fuelwood, medicine, fodder and timber) and improves stability of the AF
ecosystem. On the other hand, species abundance in AF plots is a function of either household
preference or best fit to the given ecology /climate (Mekonnen et al., 2014).
Tree species dominance
In general G. robusta had the highest average Importance Value Index (IVI) of 70.1 in the study
area. G. robusta was dominating in Kinko village C. lusitanica, P. japonica and P. americana
dominated in Mavumo, Migambo and Kwembago respectively. The most dominant tree species
by the (IVI) in Kinko village were G. robusta, J. procera and P. persica while in Mavumo
village were C. lusitanica, G. robusta, P. americana and P. patula. The most dominant tree
species in Migambo village were P. japonica, G. robusta, P. americana and S. gilo while in
Kwembago village were P. americana, G. robusta, P. patula and A. schimperiana (Table 2). The
higher Importance Value Index for these tree species is an indication that they have wide range
of growth, adaptability and evenly distributed in the AF systems (Reddy et al., 2008). The
dominant species were ecologically dominant and important tree species in AF communities as
6
the higher the IVI the more ecologically dominant and important the tree species is (Shrestha et
al., 2000; Reddy et al., 2008).
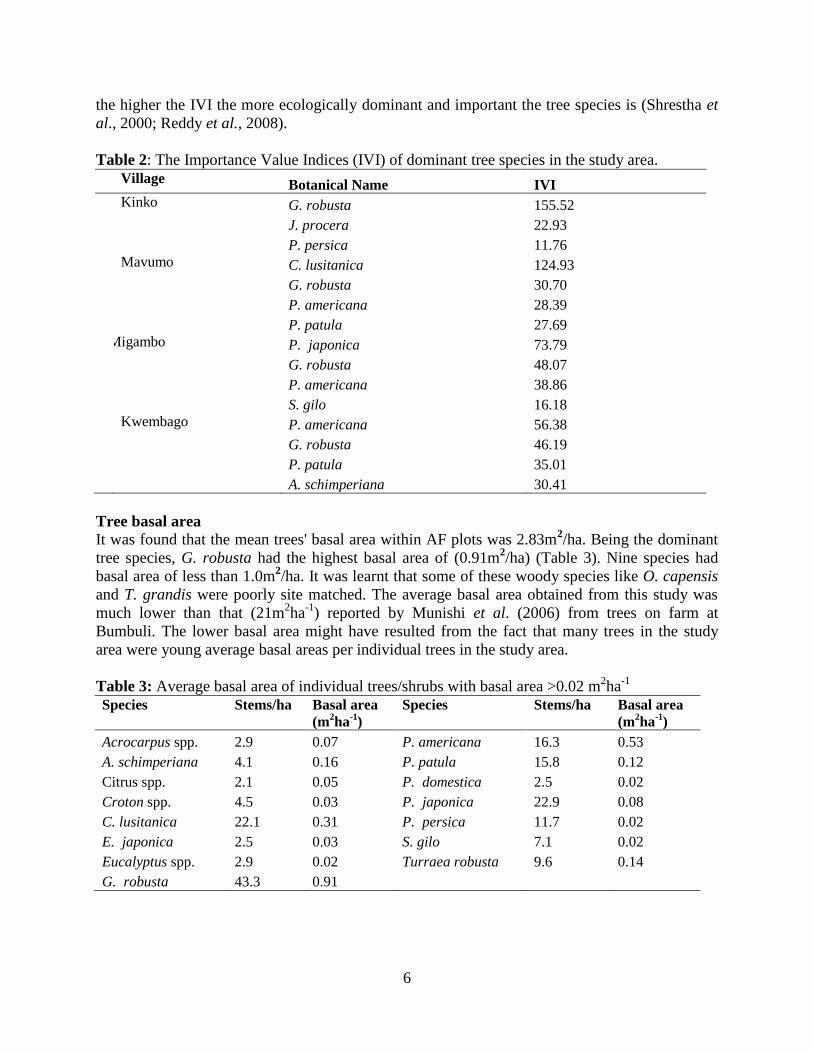
Table 2: The Importance Value Indices (IVI) of dominant tree species in the study area.
Village Botanical Name IVI
Kinko G. robusta 155.52
J. procera 22.93
P. persica 11.76
Mavumo C. lusitanica 124.93
G. robusta 30.70
P. americana 28.39
P. patula 27.69
Migambo P. japonica 73.79
G. robusta 48.07
P. americana 38.86
S. gilo 16.18
Kwembago P. americana 56.38
G. robusta 46.19
P. patula 35.01
A. schimperiana 30.41
Tree basal area
It was found that the mean trees' basal area within AF plots was 2.83m2/ha. Being the dominant
tree species, G. robusta had the highest basal area of (0.91m2/ha) (Table 3). Nine species had
basal area of less than 1.0m2/ha. It was learnt that some of these woody species like O. capensis
and T. grandis were poorly site matched. The average basal area obtained from this study was
much lower than that (21m2ha
-1) reported by Munishi et al. (2006) from trees on farm at
Bumbuli. The lower basal area might have resulted from the fact that many trees in the study
area were young average basal areas per individual trees in the study area.
Table 3: Average basal area of individual trees/shrubs with basal area >0.02 m2ha
-1
Species Stems/ha Basal area
(m2ha
-1)
Species Stems/ha Basal area
(m2ha
-1)
Acrocarpus spp. 2.9 0.07 P. americana 16.3 0.53
A. schimperiana 4.1 0.16 P. patula 15.8 0.12
Citrus spp. 2.1 0.05 P. domestica 2.5 0.02
Croton spp. 4.5 0.03 P. japonica 22.9 0.08
C. lusitanica 22.1 0.31 P. persica 11.7 0.02
E. japonica 2.5 0.03 S. gilo 7.1 0.02
Eucalyptus spp. 2.9 0.02 Turraea robusta 9.6 0.14
G. robusta 43.3 0.91
7
Despite the fact that the overall basal area is very low but in terms of density aggregate woody
species density was as high as 182 stems/ha. This is higher than 147 stems/ha reported by
Munishi et al. (2006) in Bumbuli.
Tree Species diversity
Tree species diversity within study area averaged Shannon-Wiener diversity index (H‟) of 1.86.
It is accepted that an ecosystem with H‟ value ≥ 1.5 is regarded as medium to high diverse in
terms of species (Kent and Coker, 1992). The obtained results conform to the results reported
from homegarden in Kerala India where H' between 1.12 - 3 was obtained (Kumar et al., 1994)
and lower than 2.53 - 2.73 reported from traditional AF plots in Ethiopia (Molla and Kewessa,
2015). The higher values of diversity indicate greater stability of the community structure
(Narayan et al., 1994 in Kohli et al., 1996). Usually the Shannon diversity index (𝐻') is high
when the relative abundance of the different species in the sample is even and is low when few
species are more abundant (Molla and Kewessa, 2015). This showed that in the study area, a few
species dominated the AF plots. However, Mwangoka et al. (2010) indicated that, with proper
management, it is possible for the AF system to have diversity close to natural forests.
CONCLUSION AND RECOMMENDATION
There were a number of AF practices in Lushoto district. The types were mainly influenced by
farm sizes. The AF plots were composed of few tree species with low basal area per hectare.
Grevillea robusta was a dominating tree species with the highest Importance Value Index (IVI).
The AF plots in the study area had acceptable H'. The results obtained from this study which
indicated a relatively stable ecosystem within AF plots is an indication that the AF plots are
capable of providing acceptable ecological benefits. It is recommended that the number and
species of tree component in AF plots need to be increased in the study area.
REFERENCES
Dawson, I.K., Guariguata, M.R., Loo, J.A. and Guarino, L. 2013. What is the relevance of
smallholders' agroforestry systems for conserving tropical tree species and genetic
diversity in circa situm, in situ and ex situ settings? A review. Biodiversity and
Conservation, 22:301-324.
Hamisy, W.C. and Mathias, S. 2001. Survival and growth of three Liquidamber styraciflua
provenances at Lushoto, Tanzania. TAFORI Newsletter, Vol. 2 No. 1; 7 – 13.
Hoehn, P., Steffan-Dewenter, I. and Tscharntke, T. 2010. Relative contribution of agroforestry,
rainforest and open-land to local and regional bee diversity. Biodiversity
Conservation 19:2189–2200.
Huang, W., Pohjonen, V., Johansson, S., Nashanda, M., Katigula, M.I.L. and Luukkanen, O.
2003. Species diversity, forest structure and species composition in Tanzanian tropical
forests. Forest Ecology and Management 173: 11 - 24.
Huwe, C and Mwihomeke, S. 1990. Development and Research Activities within the Soil
Erosion Control and Agroforestry Project in the West Usambara mountains – Tanzania.
paper presented in the Workshop on “participatory Methods for On-farm, Agroforestry
Research” ICRAF Nairobi, 19 pp

8
Islam, M., Dey, A. and Rahman, M. 2015. Effect of Tree Diversity on Soil Organic Carbon
Content in the Homegarden Agroforestry System of North-Eastern Bangladesh. Small-
scale Forestry, Volume 14, Issue 1: 91-101.
Kent, M. and Coker, P. (1992). Vegetation Description and Analysis, A practical Approach.
Belhaven Press, 25 Floral Street, London. 363pp.
Kihiyo, V.B.M.S. 1985. An economic evaluation of some aspects of the wattle industry in
Tanzania. MSc thesis, Sokoine University of Agriculture, Morogoro, Tanzania
Kohli, R. K., Sigh, H. P. and Rani, D. 1996. Status of floor vegetation under some monoculture
and mix culture plantations in North India. Journal of Forest Research 1: 205 - 209.
Kumar, B. M., George, S.J. and Chinnamani, S. 1994. Diversity, structure and standing stock of
wood in the homegardens of Kerala in peninsular India, Agroforestry Systems, vol. 25,
no. 3: 243–262.
Maro, G., Msanya, B. and Mrema, J. 2014. Soil Fertility Evaluation for Coffee (Coffea arabica)
in Hai and Lushoto Districts, Northern Tanzania. International Journal of Plant &
Soil Science, Vol:3(8): 934-947.
Mekonnen, E. L., Asfaw, Z. and Zewude, S. 2014. Plant species diversity of homegarden
agroforestry in Jabithenan District, North-Western Ethiopia. International Journal of
Biodiversity and Conservation Vol. 6(4), 301 - 307.
Molla, A and Kewessa, G. 2015. Woody Species Diversity in Traditional Agroforestry Practices
of Dellomenna District, Southeastern Ethiopia: Implication for Maintaining Native
Woody Species. International Journal of Biodiversity Volume 2015, Article ID 643031,
13 pp.
Mueller-Dombois, D. and Ellenberg, H. 1974. Aims and methods of vegetation ecology. Jon
Wiley and Sons, New York. 547pp.
Munishi, P.K.T., Philipina, F. and R.P.C. Temu 2006. On-farm Tree Resources and Farmer
Motives for on farm Tree Retention and Management in BumbuliWard, Lushoto District
North Western Tanzania. In: In: S.A.O Chamshama, L. Nshubemuki, S. Iddi, R.E Swai,
M.L. Mhando, E.sabas, C. Balama, L. Mbwambo and M. Mndolwa (Eds). Proceedings of
the Second National Agroforestry and Environment Workshop (Partnerships and
Linkages for a Greater Impact in Agroforestry and Environmental Awareness), Mkapa
Hall, Mbeya Tanzania 14th
– 17th
March 2006. pp 188 - 198.
Mwangoka, C.M.M.; Mkongewa, V.; Doggart, N. and Vihemaki, H. 2010. Assessment of the
biological values of different land cover types in the East Usambara Mountains of
Tanzania. TFCG Technical Paper No. 23, DSM, 91pp.
Nair, P.K.R. 1993. An introduction to Agroforestry. Kluwer Academic publishers, Dordecht, Pp
500.
Namwata, B.M.L.; Masanyiwa, Z.S. and Mzirai, O.B. 2012. Productivity of the agroforestry
systems and its contribution to household income among farmers in Lushoto District,
Tanzania. International Journal of Physics and Social Sciences, 2(7): 369-292.
Reddy, S.C., Ugle, P., Murthy, R.S.M. and Sudhakar, S. 2008. Quantitative structure and
composition of Tropical Forests of Mudumalai Wildlife Sanctuary, Western Ghats, India.
Taiwania53 (2): 150 - 156.
Scherr, J.S. 1990. Evaluating Farmers‟ Agroforestry Systems. Paper presented to the DSO
Training Course on Agroforestry Research and Development. (unpublished). ICRAF
House, Nairobi. Pp 15.

9
Shrestha, R., Karmacharya, B. S. and Jha, K.P. 2000. Vegetation analysis of natural and
degraded forests in Chitrepani in Siwalik region of Central Nepal. Journal of Tropical
Ecology, 41 (1): 111 - 114.
Wiersum, K.F., Anspach, C.L., Boerboom, J. H.A., Rouw, A. and Veer, C.P. 1995. Development
of ecological methods of upland farming in West Usambara Mountains, Tanzania. FAO
Forestry Paper 5: 55 – 82.UNESCO/FAO. 1977. Soil of the World 1: 5 000 000.00
Vol. VI Africa. FAO Rome.

10
THE ROLE OF SHADING TREES IN MICRO-CLIMATE AMELIORATION: A CASE
STUDY OF SMALLHOLDER FARMS IN MOSHI DISTRICT, TANZANIA
1Kajembe, J.,
2Olesen, J.E.,
2Plauborg, F. and
3Lupala, I.
1Tanzania Forestry Research Institute, P.O. Box 1854, Morogoro.
2 Aarhus University, Department of Agroecology, 8830 Tjele, Denmark
3Tanzania Forest Services (TFS) Agency, P.O. Box 404, Same, Kilimanjaro
Correspondence author email: [email protected]
ABSTRACT
This study assessed the role of shading trees in micro-climate amelioration in Moshi District,
Tanzania. Specifically the study aimed at identifying shading tree species commonly used in
agroforestry systems in different agroecological zones and to assess and compare the influence
of shading tree species on soil and air temperature in different agroecological zones. Two study
villages were purposively selected. Data collection methods involved questionnaires, focus group
discussions and temperature measurements in farms. A total of 60 farmers were interviewed.
Temperature data were collected for shading trees at six farms. Soil temperature was measured at
5 cm soil depth and air temperature at 1.5m height under tree shade and with no tree shade. Data
were recorded at 5 minutes interval for 24 hours. The study found that Albizia schimperiana,
Grevillea robusta, Rauvolfia caffra and Albizia gummifera were the common shading tree
species. Soil and air temperature differences ranged from -0.3-1.9 0C and -3.1 -1.5
0C
respectively. Thus there was no significant effects of shading tree species (p >0.05) on either soil
or air temperature difference in both highland and midland zones. Lack of significant differences
among shade tree species may be credited to cloudy and rain conditions and also the shorter time
span for temperature measurements.
Key words: Shading trees; Micro-climate and Amelioration
INTRODUCTION
Climate change has raised concern on the future of food supply, since crop growth could be
severely affected by changes in key climatic variables particularly temperature. As temperatures
continue to rise due to anthropogenic greenhouse gas emissions, its impacts on agriculture
production are expected to become more significant (Doering, 2002). Moreover, it is widely
acknowledged that the increasing heat stress caused by increasing temperatures will have larger
negative impacts in the tropics than in the temperate latitudes and smallholder farmers are among
the most vulnerable to its impacts (Rao et al., 2007). Lott et al. (2009) suggested the use of trees
in smallholder farms to improve micro-climatic conditions. Also Gregory and Ingram (2000)
noted that, the presence of trees in agriculture can have beneficial ecological functions on the
agro-ecosystem through the mitigation of micro-climatic effects. In addition, Sanchez and
Leakey (1997) indicated that, integrating trees with crops (coffee) on the same land is more
beneficial as compared to mono-cropping. This is due to the fact that, trees have different
impacts on soil properties which is particularly associated with their longer residence time, larger

11
biomass accumulation and more extensive root systems. Thus intervention of trees in
smallholder farms have the ability to provide environmental, social and economic benefits and
thus making farmers able to address local needs (e.g. food, fodder and firewood) and micro-
climate improvements (Rao et al., 2007).
Shade tree species form an integral part of the farming system (Regmi, 2003). They provide
nutrients for agricultural crops such as coffee. Shade provided by trees also, helps to keep
associated crops cooler during the day and warmer at night (Lin, 2007). Moreover, a
combination of either indigenous or exotic trees with crops supports nutrition, increase stability
of production and improve farmers‟ income (Steffan et al., 2007). Despite the fact that the
importance of trees on the farmland are locally, nationally and globally recognized and well
acknowledged, the role of shading trees as an important factor in ameliorating microclimate (soil
and air temperature) of smallholder farms is not well documented. For instance, a study by FAO
(2013) was conducted to reveal the socio-economic aspects of trees in different land use
practices while (Namwata et al., 2012) analyzed the contribution of different land use practices
for livelihood improvements. However, information on the biophysical aspects of trees
particularly with regards to the influence of shading trees on microclimate amelioration under
coffee crop (e.g. soil and air temperature) were still limited (Lott et al., 2009). It should be noted
that, different initiatives of incorporating different trees species into national agricultural
development programmes in Tanzania have offered more affordable and sustainable sources of
soil nutrients through nitrogen fixation by trees and this cultivation method may potentially have
modified the microclimatic effects leading to improvement of agricultural productivity
(Namwata et al., 2012). The main objective of this study was to assess the role of shading trees
in ameliorating microclimate in smallholder farms in Moshi District, Tanzania. Specifically the
study intended to identify shading tree species commonly used in the study area and to assess
and compare the influence of shading tree species in micro-climate amelioration of soil and air
temperature.
MATERIAL AND METHODS
Description of the study area
The study was conducted in Moshi District, Tanzania. Moshi District is located in Kilimanjaro
region, North Eastern part of Tanzania. It lies between 3○03′ - 3
○20′ S and 37
○15′- 37°21′ E. The
District covers a total area of 171,300 ha. Whereby, arable land covers 124,254 ha, natural
forests covers 38,676 ha and the remaining 8370 ha is non-arable land covered by rocks, hills
and gullies. The district is administratively divided into 4 divisions, 31 wards, 165 villages and
689 hamlets (URT, 2003). There are two main ethnic groups in Moshi District Chagga and Pare
(Soini, 2005). In this district, temperature and altitude range are classified according to agro-
ecological zones (Table 1).

12
Table 1: Temperature and altitude data based on agro-ecological zones in Moshi District,
Tanzania
Ecological zone Altitude (m) Temp (oC) Main crop Rainfall (mm)
Highlands 1 500 - 1 800 15-20 Coffee/bananas 1200-2000
Midlands 1 100 - 1 500 20-30 Maize/beans 1000-1200
Lowlands 900-1100 >30 Maize and livestock 400-900
Source: (Zongolo et al., 2000; URT, 2003)
Sampling Procedure
The district was stratified into three agro-ecological zones (highland, midland and lowland). The
highland and midland zone were purposively selected because the majority of smallholder
farmers in these two zones frequently use shading trees in their agricultural field. According to
Soini (2002) the highland and midland zones are more densely populated than most areas with
population density of about 650 persons per km2 compared to lowlands which have
approximately 250 persons per km2. This scarcity of land provides an incentive for enhancing
productivity, such as through use of agroforestry.
For each of the selected agro-ecological zone, one village was selected, Shimbwe Juu in the
highland zone and Mwasi Kusini in the Midland zone. From each study village about 30
representative households (Bailey, 1998) were selected randomly making a total sample size of
60 households. Out of the 60 households selected, three farms were selected randomly in each of
the study village and used to collect experimental data.
Data collection Identification of shading trees in the study area was done by the use of structured questionnaire
with both closed and open questions and focus group discussion with the key informants. Sixty
interested farmers were interviewed in two of the representative villages. The primary purpose of
these interviews was to gather information concerning the history and background of tree species
whose function was to provide shade when integrated with agricultural crops and also to provide
direction concerning the fundamental issues and questions to be answered experimentally.
Measurements of soil and air temperature were carried out to assess the influence of shading
trees in ameliorating microclimate. Three farmers from each village with shading tree species
integrated with crops in their agricultural land were randomly selected to check the effect of the
shade provided by these species on soil and air temperature. Thus, six farms out of 60 farms used
for questionnaire survey (three from each village) were selected for temperature measurements.
The three farms were represented by three dominant species found in the study area. Each of the
selected farms was measured based on a particular species, whereby the first farm Albizia
schimperiana , second farm Rauvolfia caffra and the third farm Grevillea robusta species whose
effect was measured. The same selection of farms based on dominant species was also conducted
in midland zone as one of the selected study area. The reasons for selecting only three farms
from each village for experimental study was due to limited time for data collection and weather
conditions during the particular period which was dominated by rainfall. Simultaneous
measurement of soil and air temperature was carried out in a one day campaign at six of the
selected sites, each site on a different day as resources allowed only one set of equipment. The
temperature sensors were placed at different positions in the specified plots based on the distance
and species canopy.
13
Soil temperature was measured by using three soil temperature sensors (Em50 from DECAGON
DEVICES COMPANY). The temperature sensors were located at different distance. Soil
temperature were taken at the soil depth of 5 cm in a plot with a size of 5m x 5m; at three
different positions of tree influences; Full shade (under the crown), Semi-shade (at the edge of
tree crown) and Full sun (open field) as suggested by (Wilson et al., 1997) . Data recorded by
dedicated logger (Em50 series data loggers from DECAGON DEVICES COMPANY) which has
a protected memory section. The recording was done at 5 minutes interval for a period of 24
hours. Further, the two air temperature sensors were placed at two points. The first on a wooden
stick about 1.5m above the ground on the full shade and the second was inserted by using the
same procedure but in no shade (Shashua and Hoffman, 2000). Hence air temperature was
measured at two different locations both protected from strong winds but good openness to air
circulation. To prevent the air temperature sensors from direct solar radiation or other influences,
a radiation shield was used to shield the sensors.
Data analysis
The responses to the questionnaires for the household survey were analyzed by using Statistical
Package for Social Science (SPSS) version 15 software. Average hourly soil and air temperature
were calculated in open and under shade for all three species found on the Highland and Midland
zone. Then the average diurnal temperature range for soil and air were calculated based on the
average maximum temperature and minimum temperature for both open and under shade of
different tree species. Thus based on the calculated hourly reading at each sample point, the
average temperature difference (open area minus shade) for soil and air at each specific time
category were calculated. In other words, for each measurement made under a tree shade, there
was a corresponding observation made at the open area. The difference between the two
corresponding measurements taken simultaneously at two sites (open and under shade) was
considered to be partly attributable to the shade tree. Thus the differences in temperature
obtained for soil and air were analyzed in a statistical model presented in the next sections to
assess the effect of shading on soil and air temperature.
Two different models, Linear and Linear mixed models were used to analyze the effect of
shading on soil and air temperature. The first model included all the treatment effects (Species,
Area and Time as fixed effects) and the second model included both fixed and random effects.
The fixed effects were indicated by time and species for each area were taken as random effects.
The main reason of using two models was to compare the two models to see which one was able
to describe the effect of shading on soil and air temperature data. The response variables were
the differences in soil and air temperature and treatments effects were the species (Albizia
schimperiana, Rauvolfia caffra and Grevillea robusta), Area (Highland and Midland zone) and
Time of the day. However, the time of the day were classified into four categories for each
species i.e. Morning (6:00 – 11:59), Midday (12:00 – 17:59), Afternoon (18:00 – 23:59) and
Night time (00:00 – 5:59).
Models used to find the effect of shading on soil and air temperature were as follows:
Model1: Tdiffij=μ + αh +βA + TS + Eij;

14
Where, Tdiffij = response variable (soil and air temperature difference), μ= mean, αh =Time of the
day, TS = Tree species (Albizia schimperiana, Rauvolfia caffra, Grevillea robusta) βA = Area
(Highland and Midland zone), Eij=random error
Model 2:Tdiffij=μ + αh +β1|unit + Eij;
Where, Tdiffij= Response variable (soil and air temperature) μ= Estimated mean, αh= Fixed term
for time of the day, β1|unit = Random effect for species (Albizia schimperiana, Rauvolfia caffra,
Grevillea robusta) at each area Eij= Random error
In order to check if the selected model adequately described the data, residuals for the model
were assessed which indicated no systematic variation of residuals. The analysis of variance
(ANOVA) and coefficient tables were calculated for each model. The ANOVA tables derived
from models of similar components were used to estimate the effect of time during the day,
species and area as treatment effects on the response variables (soil temperature difference and
air temperature difference). The coefficient tables were calculated mainly to draw comparisons
between treatment effects. The treatments were judged to be significant at p≤ 0.05.
RESULTS AND DISCUSSION
Table 2 shows the dominant shading tree species integrated with coffee in the study area. It was
noted that, Albizia schimperiana, Grevillea robusta and Rauvolfia caffra were preferred by the
farmers as shading trees for Coffea Arabica crop.
Table 2: Response of farmers for the dominant shading tree species integrated with coffee in,
Moshi District, Tanzania.
Shading tree species % of farmers response
Albizia schimperiana 35
Grevillea robusta 48
Rauvolfia caffra 17
Total 100
The reasons for the selection of tree species by the farmers were due to the contribution of those
three species to the daily life of the surrounding communities. Akbari and Taha (1992) revealed
the importance of trees incorporated with different crops in the agricultural land as having a huge
positive effect on people‟s lives including amelioration of microclimate. However, the choice of
tree to be used in the farming system is a key step for the success of this practice. Selection of
the tree species must be made based on the objective of the system, the site conditions i.e. soil
and climate and the species adaptability to the region. Aiming at protecting coffee from
hazardous environmental impacts, it was noted by Caramori et al. (2004) that, some of the
mentioned species such as Gravillea robusta has been used in different parts of the world for
instance in Brazil which was proven to have the satisfactory results. Most of the tree attributes
considered favourable as shade trees by farmers in the study area are similar to what has been
reported for Costa Rica (Albertin and Nair, 2004).

15
The influence of shading tree species in micro-climate amelioration
Diurnal temperature variation and diurnal range of soil and air temperature
Table 3 summarizes the average differences of air and soil temperature (Topen-Tshade) for three
dominant tree species found in Moshi District. There was very little effect of shading on soil and
air temperature for both highland and midland zones. In few cases there were higher soil and air
temperature of about 10C in the open than under shade during the day. There was one case
observed under Albizia schimperiana in the midland zone, where the air temperature increased
under shade in the afternoon.
Table 3: Average differences of air and soil temperature (Topen-Tshade) for three dominant tree
species found on the study area
Area Tree Species Time (hours) Soil temp difference
(Topen-Tshade) 0C
Air temp difference
(Topen-Tshade) 0C
Highland Albizia schimperiana 6:00 – 11:59 -0.2 -0.2
Highland Albizia schimperiana 12:00 – 17:59 0.0 -0.2
Highland Albizia schimperiana 18:00 – 23:59 0.5 0.2
Highland Albizia schimperiana 00:00 – 5:59 0.0 -0.3
Highland Rauvolfia caffra 6:00 – 11: 59 0.4 -0.1
Highland Rauvolfia caffra 12:00 – 17:59 0.4 0.3
Highland Rauvolfia caffra 18:00 – 23:59 0.4 0.8
Highland Rauvolfia caffra 00:00 – 5:59 0.4 -0.1
Highland Grevillea robusta 6:00 – 11:59 0.1 -0.1
Highland Grevillea robusta 12:00 – 17:59 0.0 -0.1
Highland Grevillea robusta 18:00 – 23:59 -0.2 0.0
Highland Grevillea robusta 00:00 – 5:59 -0.1 0.1
Midland Albizia schimperiana 6:00 – 11:00 -0.3 0.8
Midland Albizia schimperiana 12:00 – 17:59 0.4 1.5
Midland Albizia schimperiana 18:00 – 23:59 0.1 -3.1
Midland Albizia schimperiana 00:00 – 5:59 -0.2 -1.9
Midland Rauvolfia caffra 6:00 – 11:59 0.1 -0.1
Midland Rauvolfia caffra 12:00 – 17:59 0.0 -0.1
Midland Rauvolfia caffra 18:00 – 23:59 -0.2 0.0
Midland Rauvolfia caffra 00:00 – 5:59 -0.1 0.1
Midland Grevillea robusta 6:00 – 11:59 1.0 1.4
Midland Grevillea robusta 12:00 – 17:59 1.9 1.3
Midland Grevillea robusta 18:00 – 23:59 1.1 0.5
Midland Grevillea robusta 00:00 – 5:59 0.0 -0.2
Maximum 1.9 1.5
Minimum -0.3 -3.1
On the other hand, diurnal temperature range, calculated from T=Tmax-Tmin in the open or
under shade for Albizia schimperiana, Rauvolfia caffra and Grevillea robusta found on the
Midland and Highland zone is presented in Figure 1a and 1b. The diurnal temperature range
varies roughly by 1-7 °C at 5cm depth for soil temperature and 4-9 °C in air temperature for all
the three species found on both Highland and Midland zone. The soil temperature range was

16
higher in the Midland than in the Highland. On the contrary, the air temperature range indicated
some variations in both highland and midland. Air temperature range was slightly higher in the
open area for the highland zone when compared to Midland.
Figure 1a. Average diurnal soil temperature range calculated from T=Tmax-Tmin in the open or
under shade for Albizia schimperiana, Rauvolfia caffra and Grevillea robusta found on the
Midland and Highland zone.
Figure 1b: Average diurnal air temperature range, calculated from T=Tmax-Tmin in the open or
under shade for Albizia schimperiana, Rauvolfia caffra and Grevillea robusta found on
the Midland and Highland zone.
Daily mean temperature is generally used as universal indicator in climate change studies.
However it has been found by several researchers that mean temperature alone is not enough to
reflect the complicated variation of climate, and (Moot et al., 1996; Sun et al., 2006) indicated
that the trends which are observed in mean surface temperature are often due to changes that
17
takes place in daily maximum and minimum temperature. Therefore this shows that diurnal
temperature range (Tmax-Tmin) is also an important factor in climate change studies (Karl et al.,
2004; Qu et al., 2014). In our case the low diurnal temperature range was caused by cloudy
conditions (Karl et al., 1987; Qu et al., 2014). On the cloudy days, the ground is shielded from
the incoming solar radiation because of reflection and absorption of radiation. Hence this will
lead in reduction of the amount of solar radiation reaching the surface and cause cooling at the
surface. Thus, with less incoming solar radiation during day time and less radiative cooling
during night, it means it lead into lower diurnal temperature variation compared to clear sky. On
cloudy nights the heat loss from the ground is also decreased.
Furthermore the changes in canopy cover due to different tree management practice such as
pruning could probably contribute to variation in microclimatic conditions. Winds, especially at
night, reduce the cooling of surface air by bringing down and mixing warmer air from above. For
instance, the decline in temperature moderation in some of the shading tree species as indicated
in Table 3 with time relative to the shade effect might be due to increasing tree height and
removal of branches which increases the distances between the tree canopy and the ground and
thus would probably influence the air flow. However there are some of microclimatic variables
which are indeed highly sensitive to changes in the over story canopy structure and air
temperature is one of them (Saunders et al., 1999). Additionally, Saunders et al. (1999) indicated
that, by considering the influence of tree shape (Dbh) and tree height, the dense canopy which
has lower average tree height tends to perform better in terms of the cooling effect. This may
result from higher humidity. In the present study Gravillea robusta with the soil temperature
difference of 1.9 oC and air temperature difference of 1.3
oC in the midland zone has shown a
slightly higher cooling effect compared to the two other species, which may be attributed to tree
height since Grevillea robusta had the lowest average tree height 12m while Rauvofia has the
average tree height of 18m and Albizia had the highest tree height of 23m. Saunders et al. (1999)
indicated that, the tree types such as upright or spreading, large or small might also affect tree
shade effects. However, it was indicated by Sandor and Fodor (2012), that, the main driving
forces determining the soil temperature are air temperature and solar radiation possibly linked to
other factors such as soil moisture, precipitation and surface cover (plant canopy and crop
residue). Generally, shading causes some temperature variations under the smallholder farms;
however, these effects were not significant in our study were probably due to rainy conditions.
Other studies have observed the shading effect to be significant when measurements were taken
during midday with hot sunny days. For instance, Lin and Lin (2010) observed that, in a coffee
plantation under the shade of Inga jinicuil, the average maximum temperature was 5.40C lower
and the minimum temperature 1.50
C higher.
Effect of shading on soil and air temperature in the study area
Performance of dominant tree species, location and time on regulation of soil and air temperature
levels is presented in Table 4. The results indicated that, there was no significant effect of air and
soil temperature among tree species, location and time in the study area (p-values> 0.05).

18
Table 4: Performance of dominant tree species, location and time on regulation of soil and air
temperature levels
Temperature Treatment effects F-value Pr(>F)
Soil Temperature Tree species 1.16 0.23
Time(hrs) 0.84 0.49
Location(Highland and midland zone) 0.73 0.41
Air Temperature Tree species 1.30 0.30
Time(hrs) 1.08 0.38
Location(Highland and midland zone) 0.00 0.98
Significance levels: 0 „***‟ 0.001 „**‟ 0.01 „*‟ 0.05 „.‟ 0.1 „ ‟
Shade is one of the most recognizable characteristics of any tree. On hot sunny days, the outline
or effect of a shady area is probably more noticed than the tree itself. The use of these trees
minimizes the exposition of plants to climatic risks such as high temperature which could
probably result to sustainability of the associated crops such as coffee in the agroforestry systems
(Sun et al., 2006). According to Simpson (2002) the effect of shading trees on soil and air
temperature is an important parameter for the agroforestry systems; this is due to the fact that,
moderate temperature underneath tree crowns may increase biomass of below species and reduce
water and heat stress. Although there were not statistically significant effects of the shading trees
in this study on the cooling of soil and air temperature, the soil and air temperature under the
shade tree canopies were slightly lower, probably due to the shade effect. Lin and Lin (2010)
indicated that, the significant cooling effect of the shade trees is found on sunny days in hot
seasons in the tropics and subtropics. Thus during the experiment, the microclimatic conditions
under the tree canopies and unshaded open space were measured repeatedly during the mid days
without precipitation .This would probably explain why we did not get significant effect of
shading trees on soil and air temperature in our study. Thus the lack of significant differences
among shade treatments may be credited to the weather conditions during the time when the
experiment was conducted which has substantially reduced the shade effect. Lin and Lin (2010)
noted that, wind speed and vapour pressure were indicated to have negative effects in his
experiment. Thus he concluded that, the cooling effect of shade tree depends very much on the
weather at the time of experiment. Simpson (2002) indicated that, there are other tree
characteristics that might affect the tree shade effects e.g. specie morphology, canopy cover and
leaf area.
CONCLUSION AND RECOMMENDATION
The common shading tree species in the study area are Albizia schimperiana, Grevillea robusta,
Rauvolfia caffra and Albizia gummifera. The identified shading tree species did not significantly
affect soil and air temperature in the midland zone as well as in the highland zone during the
measurement period. Other treatment effects such as time and location did not show statistical
significance effect on either soil or air temperature difference. Weather conditions (cloudy and
rains) and lack of replication during the time of experiment probably explain why the shading
effect on soil and air temperature was non-significant. In order to be able to observe significant
effect of shading trees in microclimate amelioration, the temperature measurements should
probably be taken in a larger time span and not just few days during a period of the season.

19
REFERENCES
Akbari, H. and Taha, H., 1992. The impact of trees and white surfaces on residential heating and
cooling energy use in four Canadian cities. Energy 17 (2):141–149.
Albertin, A. and Nair, P. K. R. 2004. Farmers‟ Perspectives on the Role of Shade Trees in Coffee
Production Systems: An Assessment from the Nicoya Peninsula, Costa Rica. Human
Ecology, 32:4.
Bailey, K. D. 1998. Methods of Social Research. The free Press. A division of Macmillan Inc.,
New York. 88pp.
Caramori, P.H.; Kathounian, C.A.; Morais, H.; Leal, A.C.; Gorreta, R.; Rocioli filho, A.
Arborização de cafezais e aspectos climatológicos. In: MATSUMOTO, S.N. (Org.).
Arborização de cafezais no Brasil. Vitória da Conquista: Edições Uesb, 2004. p. 21-38
Doering, O.C., Randolph, J.C., Southworth, J., and Pfeifer, R.A. 2002. Effects of Climate Change
and Variability on Agricultural Production Systems. Kluwer Academic Publishers,
Dordrecht, Netherlands.
FAO 2013. Agroforestry, Food security and climate change. Summary of learning event
[http/www.fao.org/climate change/36562-0ce6bd83e1316de8db1bf4efbf2fed53a.pdf].site
visited on 20/ august/2013.
Gregory, P.J., Ingram, J.S.I., 2000. Global change and food and forest production: future
scientific challenges. Agric. Ecosystem Environment, 82:3–14.
Karl, B., Karoly, D.J., Arblaster, J.M., 2004. Diurnal temperature range as an index of global
climate change during the twentieth century. Geophysics Resource, 31:17.
Karl, T.R., Kukla, G., Gavin, J. 1987. Recent temperature changes during overcast and clear
skies on the United States. Journal of Climatology Applied Meteorology, 26:698–711.
Lin, B.B. 2007. Agroforestry management as an adaptive strategy against potential microclimate
extremes in coffee agriculture. Agric. For. Met. 144, 85–94.
Lin, B.S. and Lin, Y.J. 2010. Cooling Effect of Shade Trees with Different Characteristics in a
Subtropical Urban Park. Hort Science 45(1):83–86. 2010.
Lott, J.E, Ong C.K. and Black C.R. 2009. Understory microclimate and crop performance in a
Grevillea robusta-based agroforestry system in semi-arid Kenya. Agricultural and
Forest Meteorology, 149: 1140–1151.
Moot, D. J., Henderson, A. L., Porter, J. P., and Semenov, M. A. 1996.Temperature, CO2 and
the growth and development of wheat: changes in the mean and variability of growing
conditions. Climate Change, 33:351 -368.
Namwata , M.L.B, Masanyiwa, S.Z. and Mzirai, B.O. 2012.Contribution to Household Income
among Farmers in Lushoto District, Tanzania.
Qu, M., Wan, J., and Hao, X. 2014. Analysis of diurnal air temperature range change in the
continental United States. Weather and Climate Extremes (Article in press).
Rao, K.P.C., Verchot, V.L. and Laarman, J. 2007. Adaptation to Climate Change through
Sustainable Management and Development of Agroforestry Systems. World Agroforestry
Center, Nairobi, Kenya. An Open Access Journal published by ICRISAT.
Regmi, N.B. 2003.Contribution of agroforestry for rural livelihoods: A case of Dhading District,
Nepal. Paper presented at The International Conference on Rural Livelihoods, Forests
and Biodiversity19-23 May 2003, Bonn, Germany.
Sanchez, P. A. and Leakey, R. R. B. 1997. Land-use trans- formation in Africa: Three
determinants for balancing food security with natural resource conservation. Fourth
Congress European Society of Agronomy (In the press).

20
Sandor, R. and Fodor, N. 2012. Simulation of Soil Temperature Dynamics with Models Using
Different Concepts. The Scientific World Journal Volume 2012, Article ID 590287, 8
pages doi:10.1100/2012/590287.
Saunders, S. C., Chen, J. T., Drummer, D., Crow, T. R., 1999. Modelling temperature gradients
across edges over time in a managed landscape. Forest Ecology and Management,
117:17 – 31.
Sun, D., Pinker, R., Kafatos, M. 2006. Diurnal temperature range over the United States: a
satellite view. Geophysics Resource, 33.
Shashua-Bar L and Hoffman, M.E. 2000. Vegetation as a climatic component in the design of
an urban street: An empirical model for predicting the cooling effect of urban green
areas with trees. Energy and Buildings. 31(3): 221 - 235.
Simpson, J.R. 2002.Improved estimates of tree shade effects on residential energy use. Energy
Building, 34:1067–1076.
Soini, E. 2002. Changing Landscapes on the Southern Slopes of Mount Kilimanjaro, Tanzania:
Soini, E. 2005 Changing livelihoods on the slopes of Mt. Kilimanjaro, Tanzania: Challenges
and opportunities in the Chagga home garden system. Agroforestry Systems 64:157–167.
Steffan‐Dewenter, I., Kessler, M., Barkmann, J., Bos, M.M., Buchori, D. and Erasmi, S. 2007
Tradeoffs between income, biodiversity, and ecosystem functioning during tropical
rainforest conversion and agroforestry intensification. Proceedings of the National
Academy of Sciences of the USA, 104: 4973–4978.
United Republic of Tanzania (URT) 2003. The 2002 Population and Housing Census, Central
Census Office, National Bureau of Statistics, President‟s Office, Planning and
Privatization, Dar-es-salaam. [http://www.Tanzania.go.tz/census/regions.tm] site visited
on 16/3/2012.
Wilson, T. D., Brook, R. M. and Tomlinson, H.F. 1997. Interactions between NERE (PARKIA
BIGLOBOSA) and Under-Planted Sorghum in a Parkland System n BURKINA FASO
Agriculture, 34:85 - 99.
Zongolo, S. A., Kiluvia, S. and Mghase, G. 2000. UmbweOnana PRA report. Traditional
Irrigation and Environmental Development Organization, Moshi.
21
OVERVIEW OF THE APPLICATION OF GEOGRAPHICAL INFORMATION
SYSTEM (GIS) IN FOREST MANAGEMENT: A CASE STUDY OF TANZANIA
Uisso, A.J., Ernest, S. and Balama, C.
Tanzania Forestry Research Institute
P. O. Box 1854, Morogoro, Tanzania
E-mail of corresponding author: [email protected]
ABSTRACT
Tanzania has about 48.1 million ha of forest area which constitutes 55% of the total land area of
Tanzania mainland. Forest resources are managed sustainably by the forest sector to enhance the
contribution of the sector to the sustainable development of Tanzania and the conservation and
management of her natural resources for the benefit of present and future generations.
Geographic Information System (GIS) has been used in forest management in mapping and
monitoring of forest resources and has been proved to aid in decision making, to improve
productivity and save time, money and manpower. The aim of this paper is to explore the
application of GIS for sustainable management of forests and woodlands in Tanzania. The study
utilized a desk-top review approach which involved collection of various books, journals,
newsletters, reports and working papers integrated with field experiences. It was revealed that,
the use of GIS technology in forest management in Tanzania has increased largely from the year
2000. The use of GIS has been in Land Use and Land Cover studies (92%), wildfires analysis
(5%) and participatory mapping (3%). Recommendations on the use of this technology in forest
management are presented.
Keywords: Geographical Information System; Application; Management; Forestry
INTRODUCTION
Tanzania has about 48.1 million ha of forest area which constitutes 55% of the total land area of
Tanzania mainland (TFS, 2015). Out of this total forest area, woodlands occupy 92% and the rest
is occupied by humid Montane, lowland, mangrove and plantation forests. This huge forest
resources offer habitat for wildlife, beekeeping, unique natural ecosystems and genetic resources;
and is an economic base for country development (MNRT, 1998). Forest assessments
(inventories) in Tanzania have been carried out since 1971-1973 (TFS, 2015) and mapping of
vegetation types have been conducted for more than 100 years (Willcock, 2012). Forest mapping
in Tanzania until 1989 used manual drafting which was basically analogy data processing. Data
were mainly obtained from traverse forest surveys and manual interpretation of aerial
photographs. In recent years, monitoring and mapping of forest resources have advanced as a
result of advancement in information technologies. Geographic Information System (GIS) has
been used in mapping and monitoring of forest resources and has been proved to aid in better
decision making, to improve productivity and save time, money and manpower.
Geographical Information Systems (GIS) also known as Geo Information Sciences (or
Geosciences) or Geospatial Information System is a computer based system that capture,
prepare, manage (storage and maintenance), manipulate, analyze and present geo-referenced data
(Huisman and de By, 2009). Based on this definition, GIS users expect support from the system
to enter (geo-referenced) data, analyze it in various ways and to produce presentations (Including

22
maps and other types) from the data. GIS data inputs include vector data e.g. GPS coordinates
and raster data e.g. aerial photograph and satellite image. Compared to manual drafting, GIS has
efficient handling of large data and efficient spatial analysis capabilities. The GIS technology is
used in almost every field including health; soil science; management of agricultural, forest and
water resources; business and marketing; urban planning; geology; mineral exploration; cadastre
and environmental monitoring. This paper intends to explore the application of GIS technology
in forest management in Tanzania.
Forest assessment and mapping in a changing technological environment
Forest mapping in Tanzania can be group in two categories; manual drafting (Mapping initiatives
of 1891, 1908, 1923 and 1949) and digital data processing (GIS) (Mapping initiatives of 1989,
1995 and 2014) which started concurrently with satellite remote sensing. Satellite remote sensing
is the use of satellite borne sensors to observe, measure and record the electromagnetic radiation
reflected or emitted by the earth and its environment for successive analysis and extraction of
information. In 1989, Millington and Townsend developed a vegetation map of Southern African
Development Coordination Conference (SADCC) (including Tanzania) from the interpretation
of Advanced Very High Resolution Radiometer (AVHRR) images onboard NOAA satellite. In
1995, Hunting Technical Services of the United Kingdom and Africover project of the United
Nations, each developed a land cover map product from the interpretation of Landsat and SPOT
images for Tanzania and the entire African continent respectively. In 2014 National Forest
Resources Monitoring and Assessment (NAFORMA) project developed Tanzania land cover
map from the interpretation of Landsat images. In these digital mapping initiatives, GIS was used
in interpretation of land cover classes from the satellite images. Moreover, the use of GIS has
enabled the integration of huge amount of data during mapping (Including forest inventory data),
the update of forest cover maps on a constant basis, and has enhanced the access of forest cover
maps and mapping activities at local level.
In forest inventory, recently researches have revealed the use of auxiliary remotely sensed data
(Interferometric Synthetic Aparture Radar (InSAR) and Airborne Laser Scanning (ALS))
increase precision in biomass estimation in Tanzanian rainforest (Hansen et al., 2015) and
woodland (Solberg et al., 2015). The use of these data also provides advantage of lowering
inventory cost and has higher areal capacity. Based on the results, InSAR and ALS are expected
to provide new possibilities for forest inventory in Tanzania.
GIS in the Forest Management in Tanzania
The review revealed that the use of GIS has increased largely from the year 2000 in forest
management. This could be due to declining cost of computer hardware and GIS software, user
friendliness of GIS software and increasing awareness as GIS is mostly technological driven.
The use of GIS in Forest Management in Tanzania has been in Land Use and Land Cover study
(92%), wildfires analysis (5%) and participatory mapping (3%) (Table 1). The 92% indicates the
importance of GIS combined with satellite remote sensing in monitoring land cover changes in
Tanzania. In all these identified GIS uses in Forest Management in Tanzania (Table 1), GIS has
generated critical information that guide decision makers on how to protect and value forest
resources.

23
Table 1: Applications of GIS in Forest Management in Tanzania Applications in Forest
Management
Authors Title The use of GIS
Land Use Land Cover study Prins and Kikula (1996) Deforestation and regrowth phenology in
miombo woodland-assessed by Landsat
Multispectral Scanner System data
To assess woodland cover changes from the analysis
of Landsat images
Pelkey et al (2000) Vegetation in Tanzania: assessing long
term trends and effects of protection using
satellite imagery
To examine changes in vegetative cover across
Tanzania using normalized difference vegetation
index (NDVI) products derived from imagery taken
by Advanced Very High Resolution Radiometer
(AVHRR) on board NOAA satellite.
Wang et al (2003) Remote Sensing of Mangrove Change
along the Tanzania Coast
To estimate mangrove areas and mangrove area
change from the Landsat images
FBD (2006) Forest area baseline for the Eastern Arc
Mountains
To map land covers. Also, to quantify and locate
degradation of forests and woodlands.
Mbilinyi et al (2007) Land cover dynamics as a result of
charcoal production: use of remote
sensing and GIS
To quantify and locate degradation and regeneration
of woodlands in assessment of the extent of
environmental degradation due to charcoal
production
Nduwamungu et al (2008) Recent land cover and use changes in
Miombo woodlands of eastern Tanzania
To generate knowledge on dynamics of land cover
and land use in miombo woodlands of eastern
Tanzania from the analysis of Landsat satellite
images.
Hall et al (2009) Conservation implications of deforestation
across an elevational gradient in the
Eastern Arc Mountains, Tanzania.
To develop datasets of forest extent and to estimate
area of forest loss between years for the entire
Eastern Arc Region, within each mountain block and
within elevation bands
FBD (2010) Assessment of Forest Area Changes
(2000-2007/8) for the Eastern Arc
Mountains
To map land covers and monitor changes in the
Eastern Arc Mountains
Platz et al. (2011) Delimiting tropical mountain ecoregions
for conservation
To derive terrain parameters, estimate forest cover,
overlay derived terrain parameters with forest cover
classes and point distribution of vascular plants

24
strictly endemic to Eastern Arc Mountains, bounding
a chosen regional typology, overlay ecoregion
boundaries with forest distributions and protection
status; and derive population surface
Tabor et al (2010) Forest and Woodland Cover and Change
in Coastal Tanzania and Kenya, 1990 to
2000
To estimate forest and woodland cover and change
from satellite imageries, supplemented data from
aerial overflights, field surveys and local knowledge
Godoy et al (2011) Deforestation and CO2 Emissions in
Coastal Tanzania from 1990 to 2007
To estimate cover and carbon stock of Tanzania
coastal forests, as well as CO2 emissions due to forest
loss
Swetnam et al. (2011) Mapping socio-economic scenarios of
land cover change: A GIS method to
enable ecosystem service modelling
To interpret qualitatively expressed socio-economic
scenarios in quantitative maps for use in ecosystem
service modelling and valuation
Pfeifer et al. (2012) Land use change and carbon fluxes in East
Africa quantified using earth observation
data and field measurements
To analyze trends in vegetation cover (biomes) and
carbon in East Africa (Including Tanzania), to
determine the relationship between fire and
vegetation cover, to link fire occurrence and
vegetation cover with precipitation; and to assess
vegetation cover trend, vegetation burning, and their
link to precipitation per land management scheme
Mdemu et al., (2012) Dynamics of land use and land cover
changes in the Pugu and Kazimzumbwi
Forest Reserves.
To quantify land use and cover changes from the
Landsat images in order to investigate long-term
changes that have occurred as a result of human
activities
Kimaro and Lulandala (2013) Forest Cover and Land Use Change in
Ngumburuni Forest Reserve, Rufiji
District, Tanzania
To determine the status of forest vegetation cover
under the influence of land use intensification in the
adjacent villages from Landsat satellite images.
Kashaigili et al (2013) Integrated Assessment of Forest Cover
Change and Above-Ground Carbon Stock
in Pugu and Kazimzumbwi Forest
Reserves, Tanzania
To estimate the forest cover change and map tree
above-ground carbon stock from the Landsat satellite
images and mapping tree above- ground carbon stock
Kashindye et al, (2013) Multi-temporal assessment of forest To assess forest cover dynamics from the

25
cover, stocking parameters and above-
ground tree biomass dynamics in Miombo
Woodlands of Tanzania
classification of Landsat images, and computation of
vegetation indices (VIs) for development of
regression equation in predicting Total Above
Ground Tree Biomass.
Masanja (2013) Population dynamics and the contraction
of the Miombo Woodland Ecozone: A
case study of Sikonge District, Tabora
Region, Tanzania
To quantify different cover types and their changes
from the analysis of Landsat images
Nzunda et al. (2013) Land use and vegetation cover dynamics
in and around Kagoma Forest Reserve in
Tanzania
To investigate land use and vegetation cover changes
from Landsat images
Willcock et al. (2014) Quantifying and understanding carbon
storage and sequestration within the
Eastern Arc Mountains of Tanzania, a
tropical biodiversity hotspot
To map carbon stored across the watershed of the
Eastern Arc Mountains
Kukkonen and Kayhko (2014) Spatio-temporal analysis of forest changes
in contrasting land use regimes of
Zanzibar, Tanzania
To estimate forest changes and deforestation trends
within forest land use regimes on the island of
Unguja (Zanzibar) from the satellite images.
Lupala et al. (2014) Effects of Peri-Urban Land Use Changes
on Forest Ecosystem Services: The Case
of Settlements Surrounding Pugu and
Kazimzumbwi Forest Reserves in
Tanzania.
To estimate land use area and land use changes from
aerial photographs in assessing effects of peri-urban
land use changes on forest ecosystem services
Mongo et al. (2014) Forest cover changes, stocking and
removals under different decentralized
forest management regimes in Tanzania
To estimate forest cover changes from Landsat
imageries in providing insights on the influence of
decentralized approaches to forest resources
conditions.
Soka and Nzunda (2014) Application of Remote Sensing and
developed allometric models for
estimating wood carbon stocks in a North
– Western Miombo woodland Landscape
of Tanzania.
To analyze land use and land cover changes from
Landsat imagery in estimating the amount of wood
carbon which is stored and lost.
Lupala et al. (2015) The land use and cover change in Miombo
woodlands under Community Based
To develop land cover maps for exploring the
dynamic of land use and covers change and biomass
26
Forest Management and its implication to
Climate Change mitigation: A case of
Southern Highlands of Tanzania
due to Community Based Forest Management
(CBFM).
Ojoyi et al. (2015) An analysis of ecosystem vulnerability
and management interventions in the
Morogoro region landscapes, Tanzania
To estimate annual rate of forest changes from the
Landsat images in assessing vulnerability status of
natural forests in Morogoro.
Mganga and Lyaruu (2015) Applicability of Satellite Remote Sensing
in accounting above-ground carbon in
Miombo Woodlands
To compute Normalized Vegetation Index (NDVI)
from Landsat images to investigate the effectiveness
of remote sensing in estimating the carbon stock in
Miombo woodlands.
Ndumbaro (2015) Understanding Spatial Flow of Building
Poles‟ Opportunities and Challenges for
Sustainable Livelihoods and Forest
Resources: The Case of Zanzibar,
Tanzania
To overlay GPS points of building poles depots over
the land use maps
TFS (2015) Main result: National Forest Resources
Monitoring and Assessment of Tanzania
Mainland
To produce Land Use Land Cover map of Tanzania
mainland from satellite imagery.
Mayes et al. (2015)
Forest cover change in Miombo
Woodlands: modeling land cover of
African dry tropical forests with linear
spectral mixture analysis
To assess land cover dynamics and forest changes in
Tanzania Miombo woodland landscape from Landsat
images. Ancillary data used were MODIS and
Quickbird images.
Jew et al. (2016) Miombo woodland under threat:
Consequences for tree diversity and
carbon storage
To categorize land use from Landsat images
Tabor et al. (2016) Forest Cover and Change for the Eastern
Arc Mountains and Coastal Forests of
Tanzania and Kenya circa 2000 to circa
2010
To update and validate the land over maps for the
Eastern Arc Mountains and Coastal Forests of
Tanzania.
Gizachew et al. (2016) Mapping and estimating the total living
biomass and carbon in low-biomass
woodlands using Landsat 8 CDR data
To extract spectral reflectance values from the pixel
containing NAFORMA plots center and to calculate
spectral indices from different spectral band
27
combinations.
Makero and Kashaigili (2016) Analysis of land cover changes and
anthropogenic activities in Itigi thicket,
Tanzania
To assess land cover changes of Itigi thicket from
Landsat images.
Wildfires analysis FAO (2013) A fire baseline for Tanzania To estimate the spatial distribution and size of
wildfires in Tanzania from MODIS active fire
&burned area product.
Tarimo et al. (2015) Spatial distribution of temporal dynamics
in anthropogenic fires in miombo savanna
woodlands of Tanzania
To analyze MODIS active fire product and Landsat
satellite images in assessment of spatio-temporal
distribution of fires in miombo woodlands of
Tanzania
Participatory mapping Duvail et al. (2006) Participatory mapping for local
management of natural resources in
villages of the Rufiji District (Tanzania)
To produce georeferenced village land use maps
(with emphasis on official recognition of Village
Forest Reserves).

28
CONCLUSION AND RECOMMENDATION The use of Geographical Information System provides necessary information for decision
making on the management of forest resources in Tanzania. There is a rapidly increase in the
use of GIS in forest management from the year 2000, and the use is mostly in Land Use Land
Cover study. Other uses are in wildfire monitoring and participatory mapping. The increasing
trend towards the use of GIS in forest indicates that greater diversity can be expected in
future.
REFERENCES
Duvail, S., Hamerlynck, O., Nandi, R.X.L., Mwambeso, P., Elibariki, R. 2006. Participatory
mapping for local management of natural resources in villages of the Rufiji District
(Tanzania). The Electronic Journal on Information Systems in Developing Countries,
25, 6, 1 - 6
FAO 2013. A fire baseline for Tanzania. Sustainable Forest Management in a Changing
Climate. Dar Es Salaam 75pp.
Forestry and Beekeeping Division. 2006. Forest Area Baseline for the Eastern Arc Mountains.
Compiled by Mbilinyi, B.P., R.E. Malimbwi, D.T.K. Shemwetta, Songorwa, E.
Zahabu, J.Z. Katani and J. Kashaigili for Conservation and Management of the Eastern
Arc Mountain Forests, Forestry and Beekeeping Division, Dar es Salaam.
Forestry and Beekeeping Division. 2010. Assessment of Forest Area Changes (2000-2007/8)
for the Eastern Arc Mountains. Forestry and Beekeeping Division, Dar es Salaam.
Gizachew, B., Solberg, S., Naesset, E., Gobbaken, T., Bollandsas, OM., Breidenbach, J.,
Zahabu, E., Mauya, E.W. 2016. Mapping and estimating the total living biomass and
carbon in low-biomass woodlands using Landsat 8 CDR data. Carbon Balances and
Management 11:13. DOI 10. 1186/S13021-016-0055-8.
Godoy, F.L., Tabor, K., Burgess, N.D., Mbilinyi, B.P., Kashaigili, J.J., Steininger, M.K. 2011.
Deforestation and CO2 Emissions in Coastal Tanzania from 1990 to 2007.
Environmental Conservation: 1-10. DOI: 10.1017/S037689291100035X.
Hall, J., Burgess, N.D., Lovett, J., Mbilinyi, B., Gereau, R.E. 2009. Conservation implications
of deforestation across an elevational gradient in the Eastern Arc Mountains,
Tanzania. Biological Conservation, 142(11): 2510-2521.
Hansen, E.H., Gobakken, T., Solberg, S., Kangas, A., Ene, L., Mauya, E., Naesset, E. 2015.
Relative efficiency of ALS and InSAR for biomass estimation in a Tanzanian
Rainforest. Remote sensing. 2015, 7, 9865-9885. DOI: 10.3390/rs70809865
Huisman, O., de By, R.A (eds). 2009. Principles of Geographic Information Systems. An
Introductory textbook. The International Institute for Geo-Information Science and
Earth Observation, Enschede, The Netherlands. 540pp.
Jew, E.K.K., Dougil, A.J., Sallu, S.M., O‟cornell, J., Benton, T.G. 2016. Miombo woodland
under threat: consequences for tree diversity and carbon storage. Forest ecology and
Management 361:144-153.
Kashaigili, J.J., Makarius, V.M., Nduganda, A.R., Mbilinyi, B.P. 2013. Integrated Assessment
of Forest Cover Change and Above-Ground Carbon Stock in Pugu and Kazimzumbwi
Forest Reserves, Tanzania, Advances in Remote Sensing, 2:1-9.
Kashindye, A., Mtalo, E., Mpanda, M.M., Liwa, E., Giliba, R. 2013. Multi-temporal
assessment of forest cover, stocking parameter and above-ground tree biomass
dynamics in Miombo Woodlands of Tanzania. African Journal of Environmental
Science and Technology, 7(7):611 - 623.
Kimaro, J. and Lulandala, L. 2013. Forest Cover and Land Use Change in Ngumburuni Forest
Reserve, Rufiji District, Tanzania. Journal of Environment and Ecology, 4(2):113.

29
Kukkonen, M., Käyhkö, N. 2014. Spatio-temporal analysis of forest changes in contrasting
land use regimes of Zanzibar, Tanzania. Applied Geography, 5:193 - 202.
Lupala, J.M., Mdemu, M.V., Butungo, S.P. 2014. Effects of Peri-Urban Land Use Changes on
Forest Ecosystem Services: The Case of Settlements Surrounding Pugu and
Kazimzumbwi Forest Reserves in Tanzania. Journal of Geography and Geology, 6(4):
231.
Lupala, Z.J., Lusambo, L.P., Ngaga, Y.M., Makatta, A.A. 2015. The land use and cover
change in Miombo woodlands under Community Based Forest Management and its
implication to Climate Change mitigation: A case of Southern Highlands of Tanzania.
International Journal of Forestry Research, Article ID 459102, 11 pages.
http://dx.doi.org/10.1155/2015/459102
Makero, J.S. and Kashaigili, J.J. 2016 Analysis of Land Cover Changes and Anthropogenic
Activities in Itigi Thicket, Tanzania. Advances in Remote Sensing, 5, 269-283.
http://dx.doi.org/10.4236/ars.2016.54021.
Masanja, G.F. 2013. Population dynamics and the contraction of the Miombo Woodland
Ecozone: A case study of Sikonge District, Tabora Region, Tanzania. Journal of
Environmental and Earth Science, 3(10).
Mayes, M.T., Mustard, J.F. and Malillo, J.M. 2015. Forest cover change in Miombo
Woodlands: modelling land cover of African dry tropical forests with linear spectral
mixture analysis. Remote Sensing of Environmental, 165:203 - 215.
Mbilinyi, B.P., Misana, S., Malimbwi, R.E., Monela, G.C., Jambiya, G. 2007. Land cover
dynamics as a result of charcoal production: use of remote sensing and GIS. Tanzania
Journal of Forestry and Nature Conservation, 76(1), 67 - 79.
Mdemu, M., Kashaigili, J.J., Lupala, J., Levira, P., Liwenga, E., Nduganda, A., Mwakapuja,
F. 2012. Dynamics of land use and land cover changes in the Pugu and Kazimzumbwi
Forest Reserves. Proceedings of the first Climate Change Impacts, Mitigation and
Adaptation Programme Scientific Conference.
Mgaya, N.D., Lyaruu, H.V.M. 2015. Applicability of satellite remote Sensing in accounting
above-ground carbon in Miombo Woodlands. International Journal of Advanced
Remote Sensing and GIS, 4(1):1334-1343.
Millington, A., Townsend, R. 1989. Biomass assessment of SADCC member states. London:
Earthscan.
MNRT 1998. National Forest Policy. Ministry of Natural Resources and Tourism, Forestry
and Beekeeping Division, Dar Es Salaam. 59pp.
Mongo, C., Eid, T., Kashaigili, J.J., Malimbwi, R.E., Kajembe, G.C., Katani, J. 2014. Forest
cover changes, stocking and removals under different decentralized forest management
regimes in Tanzania. Journal of Tropical Forest Science 26(4):484-494
Ndumbaro, F.G.J. 2015. Understanding Spatial Flow of Building Poles‟ Opportunities and
Challenges for Sustainable Livelihoods and Forest Resources: The Case of Zanzibar,
Tanzania. Journal of the Geographical Association of Tanzania, 36(2): 59 – 72.
Nduwamungu, J., Bloesch, U., Munishi, P., Hagedorn, F., Lulu, K. 2008. Recent land cover
and use changes in Miombo woodlands of eastern Tanzania. Tanzania Journal of
Forestry and Nature Conservation, 78(1).
Nzunda, N., Munishi, P. K., Kashaigili, J., Soka, G., Monjare, J. 2013. Land use and
vegetation cover dynamics in and around Kagoma Forest Reserve in
Tanzania. Journal of Ecology and the Natural Environment, 5(8).
Ojoyi, M.M., Antwi-Agyei, P., Mutanga, O., Odindi, J., Abdel-Rahman, E.M. 2015. An
analysis of ecosystem vulnerability and management interventions in the Morogoro
region landscapes, Tanzania. Tropical Conservation Science, 8(3).

30
Pelkey, N.W., Stoner, C.J., Caro, T.M. 2000. Vegetation in Tanzania: assessing long term
trends and effects of protection using satellite imagery. Biological Conservation
94:297-309.
Pfeifer, M., Platts, P.J., Burgess, N.D., Swetnam, RD., Willcock, S., Lewis, SL., Marchant, R.
2012. Land use change and carbon fluxes in East Africa quantified using earth
observation data and field measurements. Environmental Conservation 40 (3): 241–
252.
Platts, P.J., Burgess, N.D., Gereau, R.E., Lovett, J.C. , Marshall, A.R. , McClean, C.J.,
Pellikka, P.K.E., Swetnam, R.D., Marchant, R. 2011. Delimiting tropical mountain
ecoregions for conservation. Environmental Conservation, 38(3):312–324.
Prins, E., Kikula, I.S. 1996. Deforestation and regrowth phenology in miombo woodland -
assessed by Landsat Multispectral Scanner System data. Short Communication. Forest
Ecology and Management 84:263 - 266.
Soka, G., Nzunda, N. 2014. Application of remote sensing and developed allometric models
for estimating word carbon stocks in a North Western Miombo Woodland landscape
of Tanzania. Journal of Ecosystems, 8pp.
Solberg, S., Gizachew, B., Naesset, E., Gobakken, T., Bollandas, O.M., Mauya, E.W., Olsson,
H., Malimbwi, R., Zahabu, E. 2015. Monitoring forest carbon in a Tanzanian
woodland using interferometric SAR: a novel methodology for REDD+. Carbon
Balance and Management, 9(10):14.
Swetnam, R.D., Fisher, B., Mbilinyi, B.P., Munishi, P.K.T., Willcock, S., Ricketts, T.,
Mwakalila, S., Balmford, A., Burgess, N.D., Marshall, A.R., Lewis, S.L. 2011.
Mapping socio-economic scenarios of land cover change: A GIS method to enable
ecosystem service modelling. Journal of Environmental Management 92:563 – 574.
Tabor, K., Burgess, N.D., Mbilinyi, B.P., Kashaigili, J.J., Steininger, M.K. 2010. Forest and
Woodland Cover and Change in Coastal Tanzania and Kenya, 1990 to 2000. Journal
of East African Natural History, 99(1):19 – 45.
Tabor, K., Kashaigili, J.J., Mbilinyi, B., Wright, T.M. 2016. Forest Cover and Change for the
Eastern Arc Mountains and Coastal Forests of Tanzania and Kenya circa 2000 to circa
2010. Final report
[http://www.birdlife.org/sites/default/files/attachments/cepf_easternarcandcf_forestcov
er_1.pdf] site visited on 11th
October 2016.
Tanzania Forest Service Agency 2015. Main result. National Forest Resources Monitoring
and Assessment of Tanzania Mainland. Government printer. 124pp.
Tarimo, B., Dick, O.B., Gobakken, T., Totland, O. 2015. Spatial distribution of temporal
dynamics in anthropogenic fires in miombo savanna woodlands of Tanzania. Carbon
Balance Management, 10:18.
Wang, Y., Bonynge, G., Nugranad, J., Traber, M., Ngusaru, A., Tobey, J., Hale, L., Bowen,
R., Makota, V. 2003. Remote Sensing of Mangrove Change along the Tanzania Coast.
Marine Geodesy, 26:35-48.
Willcock, S., Phillips, O.L. , Platts, P.J. , Balmford, A., Burgess, N.D., Lovett, J.C., Ahrends,
A., Bayliss, J. , Doggart, N. , Doody, K. , Fanning, E., Green, J.M.H., Hall, J., Howell,
K.L., Marchant, R. , Marshall, A.R., Mbilinyi, B., Munishi, P.K.T., Owen, N.,
Swetnam, R.D., Topp-Jorgensen, E.J., Lewis, S.L. 2014. Quantifying and
understanding carbon storage and sequestration within the Eastern Arc Mountains of
Tanzania, a tropical biodiversity hotspot. Carbon Balance and Management, 9:2.

31
IMPACT OF EXISTING AGROFORESTRY PRACTICES ON LOCAL
COMMUNITIES' LIVELIHOODS AROUND MAGAMBA NATURE RESERVE IN
LUSHOTO DISTRICT, TANZANIA
1Kagosi, P.J.,
1Mndolwa, M.A.,
1Japhet, E.M.,
2Sabuni, F. and
2Kirenga, R.
1Tanzania Forestry Research Institute, P.O Box 1854, Morogoro.
2Eastern Arc Mountain Endowment Fund, P.O. Box 6053, Morogoro
Corresponding author email: [email protected]
ABSTRACT
The study was conducted to community adjacent Magamba Nature Reserve (MNR) in
Lushoto district, Tanzania to assess: impact of existing Agroforestry (AF) practices on
surrounding communities' livelihoods; and challenges for AF practices adoption Four villages
namely Mavumo and Kinko (leeward), Migambo and Kwembago (windward) were
purposively selected. Data were collected through socio-economic survey using the following
methods: Participatory Rural Appraisal, Physical Observation, Structured Questionnaire (SQ)
and Key Informants‟ Interviews. For SQ, sampling intensity of 5% of households in each
village was used and questionnaire data were analysed using statistical packages for social
science. The qualitative data were subjected to content analysis. Results showed that AF
practices in the study area dated way back 1980s. In 1970s free livestock grazing caused
considerable surface runoff, soil erosion and reduction of crop production. Since 1980s, the
area received various interventions on land conservation and improved livelihood through
practising AF. Results showed that 44% and 80% of respondents reported improvement in
crop productivity and increased availability of firewood respectively. A total of 80% of
respondents reported a decrease in soil erosion. Irrigation farming has improved as a result of
year round availability of water flow from MNR. The main challenges reported in adoption of
AF are inadequate AF training and poor quality of AF tree species. The study recommends for
homegarden in the windward and woodlots in the leeward. The study further recommend on
continued training on new AF technology packages including good quality of AF trees species
in the study-area.
Key words: Agroforestry, challenges, communities‟ livelihood, Magamba Nature Reserve,
Opportunities.
INTRODUCTION
Agroforestry (AF) is a collective name for land use systems and practices in which woody
perennials (trees, shrubs etc) are in crop field (Young 1989, SECAP, 1991). Agroforestry as
mixed systems of agriculture in combination with trees and grasslands have formed key
elements of some Tanzania landscapes throughout historical times (ICRAF, 2008). Some of
these have been documented, like the Chagga home-gardens, the related Mara region home-
gardens (Obohochere) (Kitalyi et al., 2010) the traditional Wasukuma silvopastoral system
(Ngitili), Kagera homegardens (Rugalema et al., 1994) and the Usambara traditional AF
practices (Msuya et al., 2008). AF is a popular practice capable of meeting rural development
needs, environmental sustainability and biodiversity conservation due to its capacity to
transform lives and landscape (ICRAF, 2008). While AF has potential for reducing land
degradation, poverty and enhancing food security and environmental resilience, there are
major challenges to wider adoption of AF in Africa (Tanzania inclusive) (Boeckmann and
Iolster, 2010).

32
Magamba Nature Reserve (MNR) is one of the nine nature reserves in the Eastern Arc
Mountains (EAMs) with an area of 8,700 ha (EAMCEF, 2013). It is the largest among the 14
forest reserves in the West Usambara Mountains (WUMs) with high biological diversity of
both flora and fauna. Notwithstanding this potential, it is heavily depended by surrounding
communities for socio-economic development. Study by Namwata et al. (2012) in the WUMs
revealed that AF has potential in improving livelihoods of rural poor and reduce dependence
on natural forests due to their high level of productivity. Increasingly, UNESCO (2010) and
Wagner and Lugazo (2011) revealed the problem of heavy dependence on forest products for
livelihood by communities surrounding nature and forest reserves. The authors also
recommended the need for potential livelihood alternatives to offset forest based livelihood.
This paper presents the impact of the existing AF practices on local peoples' livelihood around
MNR. Specifically, the paper presents history and current status of AF practices, challenges
for adoption of AF practices/technologies and recommend on best AF practices that can be
adopted and act as alternative livelihood to offset nature reserve based livelihood.
STUDY AREA AND METHODS
Study area
The study was conducted in four villages Migambo, Kwembago (on the windward), Kinko
and Mavumo (on the leeward) within Lushoto district in Tanga region. Topographically the
district is mountainous (altitudes 600 - 2300 meters above sea level) (Huwe and Mwihomeke,
1990) with steep slopes (Kihiyo, 1985). The MNR is surrounded by 21 villages. The area has
relatively cool and less humid climate with maximum temperatures of 180C in March and
minimum in July (Wiersum et al., 1985) with the extreme temperatures of 8oC during cold
seasons and 30oC during hot (Nasser et al., 1993). It receives an average of 800 - 2000 mm of
rainfall with extreme variation within the year which allows for no fixed cropping calendar
(Huwe and Mwihomeke, 1990).
Soils are predominantly ancient, more or less leached and very low in phosphorus and
potassium, except for some valley alluvium soils (vitivo) which were found to be quite fertile
(Koert, 1904). Except for the seasonally flooded loamy, blackish – brown alluvium soils of
the lower valleys, which are quite deep and fertile, the larger part of the district has deep red
earth soil with surface pH of 5.5 (Borota, 1969). The area is covered with parches of montane
forest dominated by Albizia maranguensis, Juniperus procera, Newtonia buchananii, Ocotea
usambarensis, Parinari excelsa, Podocarpus usambarensis and Syzigium guinense (Hamisy
and Mathias, 2001). Farming is based on the rainfall patterns where sweet potatoes, maize,
irish potatoes and vegetables are grown. Perennial crops (coffee, tea, cardamom, banana,
spices and fruits) are also planted.
METHODS
Data collection and analysis
The study was conducted in four villages Migambo, Kwembago (on the windward), Kinko
and Mavumo (on the leeward) adjacent to MNR. Participatory Rural Appraisal (PRA), Focus
Group Discussions (FGDs), Physical Observation (PO), Structured Questionnaire (SQ) and
Key Informants‟ Interviews (KII) were used in data collection. For structured questionnaire,
household was used as sampling unit and sampling intensity of 5% of village households was
used. A random sample of at least 5% taken from the total household population to represent
significant population is recommended (Boyd and Stach, 1988). Both qualitative and
quantitative data were collected. Information collected through socio-economic survey
included; history of AF practices, current status of AF practices, challenges facing adoption of
AF practices and available opportunities that can improve adoption of AF practices.
33
Data analysis Data collected through FGDs, PRA, PO, and KII were subjected to content analysis. The
content analysis is a technique for compressing many words of text into fewer content
categories based on explicit rules of coding (Stemler, 2001). In this case, the recorded
dialogues were broken down into smallest meaningful units of information or themes. This
helped researchers in ascertaining the types, patterns, sequences and process of issues related
to impact of AF on community livelihoods around MNR. Data collected through PRA tools
(pair-wise ranking and time line history) was analyzed with the help of local people.
Matrix/pair-wise ranking was used to identify the most popular AF practices and challenges
faced by communities in managing AF. It was also used in ranking the best AF system based
on the choice of the communities. The quantitative data collected through household
structured questionnaire was analyzed statistically using Statistical Package for Social Science
(SPSS).
RESULTS AND DISCUSSION
Characteristics of respondents It was found that the sampled household had 58% male and 42% female headed households.
Eighty eight percent (88%) of respondents were married (Table 1). The married families
indicated a stable labour for the AF activities. It was reported that men were more involved in
AF activities especially those done away from homesteads. According to Hunt (2004) male
and female have different needs, roles and responsibilities. For example men and women
value tree species best for AF and their uses differently. Many women concentrated in
planting trees in home gardens for fruits, medicine and other products for households use or
sale in local markets.
Table 1: Characteristics of the respondents
Variable Characteristics Frequency (N) Percentage (%)
Gender Male 67 58
Female 49 42
Total 116 100.0
Education level No formal education 8 6
Primary education 97 84
Secondary education and above 11 10
Total 116 100.0
Marital status Single 8 7
Married 10.2 88
Widowed/widower 6 5
Total 116 100
Majority (84%) of respondents had primary education, followed by 10% with secondary
education or above and 6% with no formal education. Education is necessary to enable
someone to easily adopt and transform new technologies in economic activities. Mhinte
(2001), pointed out that education increases working efficiency, productivity, high income
and food security at household level.
It was also found that mean age of household heads of the population in the study area was 45
years indicating that most of the respondents were in the economically productive age which
has an impact in undertaking AF activities. According to Mandara (1998) and Mtenga (1999),
household members were considered economically productive between 16 to 64 years.
Presence of this group indicated a sufficiency in supply of workforce needed in AF activities.

34
The average family size in the study area was 5 household members. The figures showed
conformity with average district figures of 5 persons per household (URT, 2012) but lower
than average of 9 persons reported by Moshi (1997) in the west Usambara. This could be due
to the youth emigration from the study area to the towns searching for better life outside the
district as a result of limited resources such as land. The emigration of youth to town has
negative impact in the reducing workforce needed for AF activities in the area.
History and current status of AF practices around MNR
History of AF in the study area
According to Johansson (2001), land degradation in WUM started to receive attention during
German era between 1930 and 1945. Johansson (2001) further reported that during that time
solution to land degradation concentrated on construction of bench terraces, tied ridges,
enforced de-stocking, afforestation, prohibited cultivation on steep slopes and resettlement of
local people to lowland areas. These measures were implemented by force and made local
farmers to hate the whole idea of soil conservation (Conte, 1999). Land degradation continued
to post colonial era (after independence of Tanzania - then Tanganyika) in 1961.
Increasing population in the district caused increased pressure for land resource. It was
reported that during this period the area faced serious soil erosion which resulted from poor
soil conservation measures plus free livestock grazing which caused considerable surface
runoff, soil erosion and reduction of crop production. In 1980s several Governmental, Non-
Governmental Organizations (NGO) and international donor programs provided considerable
solution to the soil erosion problems. Among them were; Lushoto Integrated Development
Project (LIDEP), Participatory Agriculture Development Empowerment Project (PADEP),
Soil Erosion Control and Agroforestry Project (SECAP) and Tanzania Social Action Fund
(TASAF), Tanzania Forest Conservation Group (TFCG) as well as local government. Each
intervention had its impact based on the planned activities. SECAP dealt with introduction of
tree seedlings and cattle keeping in the villages through calves pass over from one farmer to
another. PADEP promoted establishment of trees nurseries to the villages. Similar support
was obtained from Shume Forest project in different stages. Awareness creation was done to
Village Government Leaders (VGL) and councils and public through village meetings.
In year 2011, TASAF came in and introduced support to poor families through dairy cattle
keeping. The later was for improvement of the household economies but at the same time to
support supply of manure in the field. LIDEP provided support in tree nursery establishment
through provision of tree seed and nursery inputs just like TFCG. The commonly preferred
trees were Grevillea robusta, Cupressus lusitanica and coffee. The practice also involved
planting of guatemala (Tripsacum laxum) grass for pasture (feeding animals). This was the
time when zero grazing was emphasized. On the other hand, Ministry of Natural Resources
and Tourism (MNRT) in 1990s supported the village through MNR in establishment of tree
nurseries. Later the District Development Director (DED) added some effort and provided
support of seedlings to the village.
Beside general acceptance that genesis of AF within WUM can be traced way back 1900s
(Scherr, 1990) the scenario thereafter did not take the same trend in all areas. Scherr (1990)
further indicated that originally AF involved the use and protection of trees mostly through
natural regeneration of valuable tree species and shrubs for fodder, fuel wood, medicines and
building materials. The practice was reported to be done by the local people although not in a
pronounced level as it is to-date. Available records showed that the habit of retaining trees

35
formed the basis for present AF (Munishi et al., 2006) and that local people grew with it
building up love with the practice.
Current status of AF practices around MNR
AF technologies
The commonly practiced AF technologies in the study area were agri-silviculture, epi-
silviclture, woodlots, boundary planting, agri-silvi-pastoral, home-gardens and alley
cropping/hedgerow intercropping. According to (Rugalema et al., 1994) alley cropping is
peculiar as it retains the basic restorative attributes of the bush fallow through nutrient
recycling, fertility regeneration and weed suppression and combines these with arable
cropping so that all processes occur simultaneously on the same land, allowing the farmer to
grow crops in the land for an extended period. Alley cropping/hedgerow planting and home-
garden were practiced by 28% and 20% respectively. Other practices were done by over 30%
participants.
Common to both areas (windward and leeward) were the woodlots, boundary planting and
epi-silviculture. Agri-silviculture ranked high as it was practiced by 61% of population in both
areas. The practice is more pronounced in both areas but was observed to be more prominent
in Kinko and Mavumo villages (leeward) where it was practiced by 52% and 83% of
households respectively. It was established that these communities in average had relatively
larger pieces of land compared with Migambo and Kwembago (windward) (Table 3). In
common woodlots received the lowest attention in all villages. This might be because in
woodlots land is held for much longer time without producing alternative crops. Because of
this; areas with land shortage have little chance of practicing it. On the other hand the
differences are contributed by the fact that the two areas were reported to differ climatically
with the former receiving relatively less precipitations than the later. It is interesting to note
that home gardening is more practiced in Mavumo village (40%) than the rest. Kinko was the
least in practicing home gardens despite the fact that TASAF came in and introduced support
to poor families through dairy cattle keeping in 2011. The fact is, people had no much interest
in home-gardening in Kinko just because they have relatively larger piece of land than other
studied villages
Reasons for adopting AF
There had been a number of reasons as to why households glued to AF. Majority (80%) of
respondents mentioned production of firewood and 65% soil conservation as the major
reasons for practicing AF (Table 2). This was contrary to observations reported by Munishi et
al., (2006) where wood/timber production ranked high in trees retained on farms. Reasons for
practicing AF in the study area varied from one village to another (Table 2).
Table 2: Reasons for adopting AF in the study area as reflected by proportions of respondents'
Village Soil
Conserva
tion
Provision
of
Firewood
Maximize
production
Fodder
for
livestock
Shade Wood Boundary
demarcation
Mavumo 57 63 70 20 0 30 0
Kinko 76 84 40 4 4 36 4
Migambo 58 81 52 10 0 39 0
Kwembago 70 93 43 0 0 23 3
Average 65 80 52 9 1 32 2
The results further showed that 44% and 80% of respondents reported improvement in crop
productivity and increased availability of firewood respectively. A total of 80% of

36
respondents reported a decrease in soil erosion (Table 3). Irrigation farming has improved as a
result of year round availability.
Table 3: Respondents' opinions (percentage) on crop productivity and soil erosion
Item Mavumo Migambo Kinko Kwembago Average
Increase crop
productivity in 10
years (%)
30 49 44 53 44
Reduced soil
erosion
60 87 84 90 80
Impact of AF on households' livelihood
AF is a promising alternative, which is considered as one of the options to lift local
communities out of the poverty trap (ICRAF 2008). It was found that dependency on the
forest products from MNR has tremendously been reduced. The following reasons were
reported; (i) Improved law enforcement by the MNR management, and (ii) Increased realised
returns from other sources including AF plots. It was found that in average households
realized 67% of their income from AF related activities (54%) forest products and 13%
agriculture crops) (Figure 1). The main sources of income reported in the study area were
those from within and outside AF activities (Figure 1). In general, the household gets total of
Tshs 1,443,117 per year from sale of both forest products and agricultural crops from AF
plots. The major AF forest crops sold from AF plots were firewood followed by timber. The
values for timber included also values of that wood used by 32% of respondents for
households' construction. Charcoal making from AF plots was uncommon in the studied
villages.
Figure 1: Average percentage contribution of various household economic sources
Furthermore, it was reported that income from sale of AF products was mainly used for buying
food (during shortage) and other household needs. However, it was found that majority (80%)
of respondents in the study villages get enough food all year round due to increased crop
production. The few respondents (20%) who experience food shortage subsidize it by using
money obtained from sale of AF products. At the same time extra income was used on other

37
expenditures such as school fees, purchase of land, business expansion, settling of hospital
bills and purchase household assets like bicycle, motorcycle and mobile phones.
Firewood was the main source of energy in the study area. The material is collected from either
felled or pruned branches from on farm trees. It was further found that 80% of respondents
reported an increase in fuelwood supply from AF plots. Some (72%) respondents agreed that
crop production has increased and had even a chance of diversifying agricultural crops. Income
realised from sale of products harvested from AF plots contributed so much in raising
households' economy.
Increased water flow and improved agriculture
Water for irrigation was a big problem in the past. It was realized that, the presence of forest
products harvested from AF plots paved way for improvement of the MNR vegetation hence
stabilized water flow. Previously water used to flow for only six months. However, currently
water is available throughout the year and that farmers can presently (especially at Kinko village)
increase crop production through irrigation. It was accepted that the money realised from
production of agricultural crops and sale of AF products has raised standard of living of the
respective households by being able to send their children to school, buying food (for
supplement) as well as building good settlements.
Improved livestock keeping
AF practices have improved livestock keeping from free range to zero grazing. It was learnt that
as a result of increased participation in AF, number of livestock has been reduced tremendously.
In average households had about 2-3 cows and 4-5 goats in Mavumo village, 2-3 cows and 1-2
goats in Migambo village. The number of cows in Kwembago village is quite low to one per
household. Kinko had relatively many cows (3-5 in average) per household and 4-5 goats. The
decreased number of animals was a result of strict by-law which does not allow for free grazing.
Goats, cattle and sheep were kept in zero grazing where fodder was brought from AF plots far
from home (Plate 2). It was also learnt that with increasing population, the study area sometimes
fell short of fodder and pasture land. Beside reducing erosion, contour line fodder production in
the villages provided considerable amount of forage for zero-grazing hence increased milk
production for the small-scale dairy farmers.
Plate 2: Women carrying fodder from AF plots far from home

38
Unfortunately, it was observed that environmental benefits realized from AF plots were given
little value than direct cash and in-kind benefits. Consideration on contribution of the AF plots
in global environmental benefit like carbon sequestration and biodiversity conservations was
not of priority to farmers.
CHALLENGES AND OPPORTUNITIES OF AF PRACTICES
Challenges
It was observed that challenges faced by farmers differed with location. Below are some of the
reported challenges;
(i) Diminishing farm land sizes
It was found that 41% of the households in the leeward had more than 2 acres of farms
compared to 30% from the windward (Table 3). This situation has great impact in adoption of
AF. Those households with small land pieces avoided engaging themselves in some AF
practices like woodlots. In general 75% of the households reported to own less land than what
they needed.
Table 3: Farm sizes between two areas (leeward and windward)
Location Village Farm sizes (acres)
≤ 1 1.1-2.0 2.1-3.0 3.1-4.0 >4
Leeward Mavumo 48 22 18 11 0
Kinko 9 36 22 13 18
Average 29 29 20 12 9
Windward Migambo 28 38 21 7 7
Kwembago 33 33 17 1 7
Average 31 36 19 4 7
NB: Numbers inside the table represent proportion of respondents
The need for other pieces of farming land was a crosscutting challenge among villages in the
study area. While some (38%) respondents were ready to purchase any available piece of land
within their village, others (16%) were ready even to go outside their village as far as
Handeni/Kilindi. Migambo village had more (23%) respondents ready to go outside the village to
purchase land while Mavumo had the least (10%). On average 48% of households were ready to
purchase farm lands elsewhere. With increasing population, larger areas are now being
converted into residential areas and for construction of other social services like schools and
dispensaries. This stressed land for AF the more and increased more demand of wood from
AF plots in the expense of areas for establishing AF plots.
(ii) Restrictions in harvesting of forest products from AF plots
Tree harvesting ban has stopped or made it difficult for farmers to harvest planted AF trees
freely. It was learnt that if one wants to harvest a tree, he/she has to follow a series of permit
search processes from village level up to the district commissioner, which is very stressful. It was
argued, that before the ban, the cost for house construction, payment of school fees and hospital
bills were mainly paid through sell of AF trees. Since AF is one of the main employer of large
number of people in the study area, restrictions on AF tree harvesting has consequently increased
poverty at household level. It was reported that a proper arrangement is needed so as to allow
harvesting at a certain maturity age and encourage replacement of cut trees. It was further
revealed that, AF harvest ban discourages farmers from engaging in planting more trees in the
study villages. This arrangement needs a review.

39
(iii) Improper functioning of village governments
The other challenge observed was improper functioning of government machineries at village
level. Instead of emphasizing on tree planting; much concentration was in issuing of harvest
permits and administering penalties to offenders. This attracted for a quick implementation of
tree harvest ban which resulted to economic crisis and which opened chances for corruptions
and illegal harvesting and sometimes encroachment to MNR. The Village Environmental
Committees need to be more educated.
(iv) Poor knowledge on trees crops site matching
Tree planting and environmental conservation training has been provided by various
government organizations and non-governmental organizations in the district. However,
training was in many cases done infrequently or even provided once. It was reported that
training left behind new comers and young farmers every year. In general training lacked
continuity. This had a very serious effect in that those who received the training were
supposed to impart the required knowledge to others which was not always the case. In some
occasions those people were noted to move/shift to other areas. Knowledge on matching tree
species to site was in this case missing. As a result farmers kept on growing pines and
sometime eucalyptus mixed with other agricultural crops which reduced production of the
later. Pine and eucalyptus were supposed to be planted in the woodlots or as boundary trees.
Sometimes trees like teak (Tectona grandis) were found incorrectly planted in the study area.
It was learnt that during SECAP, the approach was to villages and not individual farmers, and
the main extension instrument was group meetings. Unfortunately, it was noted that men were
main decision makers while women were implementers. Competence of planning and
implementation was partly delegated to zones and village levels rather than key or pilot
farmers. This approach missed the succession scenario.
(v) Damage from wild animals
Villagers especially those with plots adjacent to MNR complained of wild animals destroying
their crops. This tempted the farmers not to include trees in their farms as the animals would
use them for hiding and eat agricultural crops.
(vi) Influence of climate change
There have been negative changes especially on rising temperatures and irregular rainfall
which consequently affected planting patens and production of almost all crops. This was
reported by many (85%) respondents. The drier areas had become much drier with an unusual
prolonged dry spells (sometimes up to six months). This in a way caused a big change in the
formation of the AF systems, as weather plays a very big role in trees/vegetation
establishment, growth and development which sometimes commands for change in alternative
AF tree species.
(vii) Poor quality of tree planting materials
Lack of improved planting materials (seeds, seedlings, cuttings/clones) was identified as one
of the biggest challenges constraining AF farming system in Lushoto District. Poor quality of
seed is probably due to that, farmers cut the best trees in their plots without leaving behind
high quality trees to produce tree seeds for future generation and access to Tanzania Tree Seed
Agency (TTSA) for genuine tree seed was limited. The deficit might also be a result of
incompetence of farmers in handling the seeds.

40
(viii) Improper harvesting
Improper harvesting appeared to be a setback in management of AF plots. Generally, to make
the process sustainable, harvesting and planting should move concurrently. However, there
were many cases where some plots were left bare with all trees harvested without any
replacement plan (Plate 3), and the decrease is alarming (Munishi et al., 2006).
Plate 3: Excessive removal of trees (G. robusta) leaving an AF plot without trees
CONCLUSION AND RECOMMENDATIONS
Agroforestry has a long history in the study area and passed through various interventions.
The interventions had positive impact in the households‟ livelihood as the practice provided
employment to most farmers in Lushoto District. Farmers were motivated by AF impacts,
encouraging each household to practice it. It has contributed into improvement of households
livelihoods with direct income benefit as well as indirect through improved areas such as
water flow from MNR. However, various challenges such as limited training, poor AF tree
seedlings, restrictions in harvesting AF trees, fluctuations in climatic conditions, and land
shortage limit practicing of AF. It is recommended that, proper AF practices training need to
provide to stakeholders and all AF practices need to continue to be practiced in the study area
depending on the physical and climatic conditions of the respective area. However,
homegarden need to be emphasised in the windward area because of land shortage and
woodlots in the leeward area as there are relatively larger pieces of land per household.
ACKNOWLEDGEMENTS
We wish to acknowledge the EAMCEF for financial support. Many thanks should go to
TAFORI officials for transport/office facilities. Lastly but not least, special appreciation goes
to village leaders and all farmers who shared their experiences with project team. Many
thanks to all people who provided help and information during the research and writing of this
paper.
REFERENCES
Boeckmann, S. and Iolster, P. 2010. Agroforestry in Africa: Exploring the Lack of
Widespread Implementation and the Potential for Expansion.
http://www.rmportal.net/library.
Borota, J. 1969. The growth of tree species in Lushoto arboretum. Tanzania Silviculture
Research Note. 23. Lushoto, Tanzania.
Boyd, H.K. and Stach, S. F. 1988. Marketing Research. Texts and Cases. Illinois Richards D.
Inc., London. 813pp.
41
Conte, C.A. 1999. The forest becomes desert: Forest use and environmental change in
Tanzania's West Usambara Mountain. Land Degradation and Development, 10:291-
309.
EAMCEF 2013. Baseline Survey Report for 8 Nature Reserves and 1 National Park in the
Eastern Arc Mountains of Tanzania. Morogoro, Tanzania 220pp.
Hamisy, W.C. and Mathias, S. 2001. Survival and growth of three Liquidamber styraciflua
provenances at Lushoto, Tanzania. TAFORI Newsletter, 2(1): 7 – 13.
Huwe, C. and Mwihomeke, S. 1990. Development and Research Activities within the Soil
Erosion Control and Agroforestry Project in the West Usambara mountains –
Tanzania. Paper presented in the Workshop on “participatory methods for on-farm,
Agroforestry Research” ICRAF Nairobi, February 1190. 19pp.
Hunt, J. 2004. Introduction to gender analysis concepts and steps. Development Bulletin,
64:100-106.
ICRAF (World Agroforestry Centre). 2008. Integrating livelihoods and multiple biodiversity
values in Landscape Mosaics: field methods. 48pp.
Kihiyo, V.B.M.S. 1985. An economic evaluation of some aspects of the wattle industry in
Tanzania. MSc thesis, Sokoine University of Agriculture, Morogoro, Tanzania
Koert, W. 1904. Geologische – agronomische der Umgegend von Amani in Ostusambara.
Miteinergeologisch – agronomischen Übersichts-kerte-Ber. Land. Forstw. D.O.A 2:
143-164.
Kitalyi, A., Nyadzi, G., Lutkamu, M., Swai, R. and Gama, B. 2010. New Climate, New
Agriculture: How Agroforestry Contributes to Meeting the Challenges of Agricultural
Development in Tanzania, Tanzania Journal of Agricultural Sciences, 10(1):1 - 7.
Mandara, E.G.1998. Assessment of factors influencing women's participation in off-farm
income generating activities. Dissertation for Award of MSc Degree at Sokoine
University, Morogoro, Tanzania, 101pp.
Mhinte, A.R. 2001. Analysis of Food Insecurity and Household coping strategies: The case
study of Kilosa District. Dissertation for award of MSc. degree at Sokoine University
of Agriculture, Morogoro, Tanzania. 122pp
Msuya, T.S., Mndolwa, M. and Kapinga, C. 2008. Domestication: An Indigenous Method in
Conserving Plant Diversity on Farmlands in West Usambara Mountains. Journal of
Tropical Forest Science 46 (Suppl.1): 74 – 78.
Moshi, E.R.F. 1997. Inventory of indigenous agroforestry systems in the West Usambaras,
dissertation for award of Msc Degree at Sokoine University of Agriculture, Morogoro,
Tanzania, 172pp.
Mtenga, K.J. 1999. Smallholder seed production in Tanzania: Potential and Limitations.
Dissermination for award of Msc degree at Sokoine University of Agriculture,
Morogoro, 96pp
Munishi, P.K.T., Philipina, F. and Temu, R.P.C. 2006. On-farm Tree Resources and Farmer
Motives for on farm Tree Retention and Management in Bumbuli Ward, Lushoto
District North Western Tanzania. In: In: S.A.O Chamshama, L. Nshubemuki, S. Iddi,
R.E Swai, M.L. Mhando, E.sabas, C. Balama, L. Mbwambo and M. Mndolwa (Eds).
Proceedings of the Second National Agroforestry and Environment Workshop
(Partnerships and Linkages for a Greater Impact in Agroforestry and Environmental
Awareness), Mkapa Hall, Mbeya Tanzania 14th
– 17th
March 2006. pp 188 - 198.
Namwata, B.M.L.; Masanyiwa, Z.S. and Mzirai, O.B. 2012. Productivity of the agroforestry
systems and its contribution to household income among farmers in Lushoto District,
Tanzania. International Journal of Physics and Social Sciences, 2(7): 369-292.
Rugalema, G.H., Johnsen, F.H., Okting'ati, A. and Minjas, A. 1994. The homegarden
agroforestry system of Bukoba district, North-Western Tanzania. 3. An economic
42
appraisal of possible solutions to falling productivity. Agroforestry Systems,
28(3):227–236.
Scherr, J.S. 1990. Evaluating Farmers‟ Agroforestry Systems. Paper presented to the DSO
Training Course on Agroforestry Research and Development. (Unpublished). ICRAF
House, Nairobi. Pp 15.
SECAP 1991. Project review. Soil Erosion Control and Agroforestry Project, Lushoto.
Stemler, S. 2001. An overview of content analysis. Practical Assessment, Research and
Evaluation. [http://PAREonline.net/getvn.asp?v=7&n=17] site visited on 2/10/2014.
UNESCO 2010. Nomination of properties for inclusion on the world heritage list serial
nomination: Eastern Arc Mountains forests of Tanzania. Online document available at:
http://whs.tfcg.org/docs/E_Arc_Mountains_World_Heritage Nomination
_100127_FINAL.pdf] Site visited on 21/10/2012
URT 2012. Population and housing census, National Bureau of Statistics and Office of Chief
Government Statistician, President‟s Office, Finance, Economy and Development
Planning Zanzibar. 244pp.
Wiersum, K.F., Anspach, C.L., Boerboom, J.H.A., Rouw, A. and Veer, C.P. 1995.
Development of ecological methods of upland farming in West Usambara
Mountains, Tanzania. FAO Forestry Paper 5: 55 – 82.UNESCO/FAO. 1977. Soil of
the World. 1:5 000 000.00 Vol. VI Africa. FAO Rome.
Young, A. 1989. Agroforestry for Soil Conservation. CAB International. ICRAF.

43
ANNOUNCEMENTS
In the Period of 2009-2017, TAFORI has witnessed retirement of her 49 employees. These
served in various capacities. We witnessed our Director General Dr. Ladislaus Nshubemuki
who retired from service in 12.01.2010.
The other TAFORI members served in the capacity of Researchers, Laboratory Technicians,
Forest Assistants, Librarian, Typist, Drivers and Security Guards. To all of you we say
“Thank you” for the foundation laid and we wish you well in your endeavours. The list of
retired TAFORI employee is as indicated below:
S/N NAME DATE OF
BIRTH
DESGNATION QUALIFICATIONS DATE OF
RETEREMENT
CENTRE
1 Dr. Ladislaus
Nshubemuki
13/01/1950 CRO, DG Ph.D,1990 12/1/2010 HQ
2 Mr. Theonas
Msangi
4/3/1951 SRO I M.Sc(For), 1991 3/3/2011 Lushoto
3 Mr Alex Chihongo 28/12/1952 SRO I M.Sc(Wd Sc.),1979 27/12/2012 HQ
4 Mr. Evarist Sabas 1,Oct,1951 SRO I, DFPR M.Sc(For), 1980 2,Oct,2011 HQ
5 Mr. Leonard
Mhando
12/9/1950 SRO I M.Sc(For),1991 11/9/2011 HQ
6 Mr. Stephen
Mwihomeke
1/12/1952 SRO I M.Sc(For),1987 30/11/2012 Lushoto
7 Mr. Jocania Isango 1/7/1952 SRO I M.Sc, 1994 30/6//2012 HQ
8 Mr. Nassoro
Magogo
24/1/1951 SLT I Dip (For),1986 23/11/2011 Lushoto
9 Mr. Samwel
Lekamoi
1/4/1952 LT II Cert (For),1974 30/3/2012 Lushoto
10 Mr. Peter Nduka 23/1/1953 PLT II Dip (For)1981 22/1/2013 Dodoma
11 Mr. Sawema
Msangi
12/4/1951 SLT I Dip (For),1984 11/4/2011 Moshi
12 Mr. Chrispine
Shangali
23/12/1954 PLT II Dip (For)1979 22/12/2014 Lushoto
13 Mr. Ayubu
Shemkongwa
30/12/1948 LT I Cert (For),1980 29/12/2008 Lushoto
14 Mr. Athumani
Kambi
14/3/1955 SLT I Dip (For),1991 13/3/2015 Kibaha
15 Mr. Ahmed
Mndolwa
1/11/1957 SLT I Dip (For),1990 30/10//2017 Lushoto
16 Mr. Leonce Leringo 1/7/1957 SLT II Cert (For) 30/6/2017 Malya
17 Mr. Gideon Mushi 22/6/1954 LT I Dip(For)2006 21/6/2014 Lushoto
18 Ms. Veronika
Kweka
23/6/1950 SFA II Cert, 1973 22/6/2010 Lushoto
19 Ms. Hamida Ngoda 30/9/1952 SFA II STD VII 29/9/2012 Lushoto
20 Ms. Pilly Kapilya 10/10/1955 SFA II STD VII,1970 9/10/2015 Kibaha
21 Mrs. Damaris Sabali 26/6/1956 FA III STD VII,1970 25/6/016 Lushoto
22 Mr. Colman Sabas 1/7/1951 SFA II STD VII,1966 30/6/2011 Moshi
23 Mr. Protas William
M
1/7/1956 SFA II STD VII,1973 30/6/2016 Moshi
24 Mr. Yahya Said 7/7/1957 SFA II STD VII,1973 6/7/2017 Lushoto
25 Mr. Hamis 20/3/1952 SFA I STD VIII,1966 19/3/2012 Sao Hill

44
Mng'omba
26 Mr. Alen Mokiwa 1/1/1952 SFA II STD VII,1967 31/12/2011 Kibaha
27 Mr. Golitha
Malindima
1/7/1956 SFA III STD VII 30/6/2016 Malya
28 Ms. Anna Issack 20/12/1956 SFA I STD VII,1976 19/12/2016 Moshi
29 Mr. Joseph Moses 25/5/1954 SFA II STD VII,1968 24/5/2014 Lushoto
30 Ms. Amina Hemed 13/9/1952 SFA II STD VII,1964 12/9/2012 Lushoto
31 Mr. Keneth
Ndelimo
12/12/1959 FA III STD VII,1966 11/12/2016 Tabora
32 Mr. Mtoi Juma 1/12/1953 SLA II Cert, 1981 30/11//2013 Lushoto
33 Mr. Hemed
Abdallah
15/6/1957 SLA II STD VII 14/6/2017 Lushoto
34 Mr. Michael
Kicholo
28/12/1952 SLA II STD VII 27/12/2012 Lushoto
35 Mr. Daniel Jona 14/1/1956 SLA II STD VII 13/1/2016 Lushoto
36 Mr. Zoel Kiwale 5/7/1955 SLA II STD VII,1976 4/7/2015 Moshi
37 Mr. Adam
Shekiomboo
13/7/1953 SLA III Cer(For), 1993 12/7/2013 Kibaha
38 Mr. Mwinyijuma
Ibrahimu
1/7/1952 SA II STD VII,1966 30/6/2012 Moshi
39 Mr. Francis Juma 11/6/1951 SA II STD VII 10/6/2011 Lushoto
40 Mr. Jackson Zakaria
M
1/7/1952 SA II STD VII,1967 30/6/2012 Moshi
41 Mr. Richard
Mwaringo
11/1/1957 SA I Cer
(Sawmilling),1982
10/1/2017 HQ
42 Ms. Halima Mshana 8/9/1951 Libr Ass I Cert(Libr),1997 7/9/2011 Lushoto
43 Ms. Stella Muyanza 8/7/1951 TYPIST I Cert, 1997 7/7/2011 Lushoto
44 Ms. Eliasenta
Lemma
3/12/1949 TYPIST II Cert, 1998 2/12/2009 Lushoto
45 Ms. Efransia
Rwenyagira
1/11/1952 PS II Cer, 1972 30/10/2012 Moshi
46 Ms. Binti Msangi 1/7/1954 TYPIST II Cert, 2000 31/6/2014 Kibaha
47 Mr. Mwinyihamisi
Mfaume
1/7/1956 Driver Mechc Adv Cert,II,2002 1/7/2016 Kibaha
48 Mr. Samweli
Malogo
1/7/1953 SG III STD VII 30/6/2015 Malya
49 Mr. Martine.
Morgan
1/7/1957 SG III STD VII 30/6/2017 Malya