The Tangency Portfolio
8
Ismael Correa Econ 490 | Financial Econometrics: Final Report May 15 th , 2016 The Tangency Portfolio Apple, Inc. (AAPL) Exxon Mobil Corporation (XOM) Microsoft (MSFT) Alphabet, Inc. (GOOGL) Alphabet, Inc. (GOOG) In order to leverage the concepts that we learned on portfolio theory, I decided to focus my final report on creating multiple portfolios, including an equal weighted portfolio, global minimum variance portfolio, targeted return portfolio and a tangency portfolio. The main question I wanted to ask was what was the tangency portfolio for each month from February 2015 until December 2015. This tangency portfolio would give me the best Sharpe ratio that could be located within a portfolio and effectively optimize my utility as a risk-seeking investor. The stocks that I examined were Apple Inc. (AAPL) Exxon Mobil Corporation (XOM), Microsoft (MSFT), Alphabet Inc. (GOOGL), and Alphabet Inc. (GOOG). I leveraged both excel and R in my analysis through extracting the data from yahoo finance into excel in order to have all the information I needed I needed to utilize these adjusted prices to compute the data that I needed. From these adjusted prices, I found their expected return by taking the holding period return of each stock, including dividends, from one month to the next. Then I created a 5 x 5 covariance matrix, which consisted of the variance of each stock followed by the covariance of each stock with the other. After computing this information I found the beta of each stock from the year of 2015 by taking the covariance of each stock with the Standard and Poor’s 500, and diving this number by the variance of the Standard and Poor’s 500. This information would later on be used to compute the alpha of each stock by taking the return of the portfolio minus the risk free rate plus the return on the market minus the risk free rate multiplied by the beta. After getting all of this information, I was able to compute the portfolios for the months of February 2015 until December 2015. I followed a standard operating procedure for each month. I
-
Upload
ismael-correa -
Category
Documents
-
view
141 -
download
0
Transcript of The Tangency Portfolio

Ismael CorreaEcon 490 | Financial Econometrics: Final ReportMay 15th, 2016The Tangency PortfolioApple, Inc. (AAPL)Exxon Mobil Corporation (XOM)Microsoft (MSFT)Alphabet, Inc. (GOOGL)Alphabet, Inc. (GOOG)
In order to leverage the concepts that we learned on portfolio theory, I decided to focus my final report on creating multiple portfolios, including an equal weighted portfolio, global minimum variance portfolio, targeted return portfolio and a tangency portfolio. The main question I wanted to ask was what was the tangency portfolio for each month from February 2015 until December 2015. This tangency portfolio would give me the best Sharpe ratio that could be located within a portfolio and effectively optimize my utility as a risk-seeking investor.
The stocks that I examined were Apple Inc. (AAPL) Exxon Mobil Corporation (XOM), Microsoft (MSFT), Alphabet Inc. (GOOGL), and Alphabet Inc. (GOOG). I leveraged both excel and R in my analysis through extracting the data from yahoo finance into excel in order to have all the information I needed I needed to utilize these adjusted prices to compute the data that I needed. From these adjusted prices, I found their expected return by taking the holding period return of each stock, including dividends, from one month to the next. Then I created a 5 x 5 covariance matrix, which consisted of the variance of each stock followed by the covariance of each stock with the other. After computing this information I found the beta of each stock from the year of 2015 by taking the covariance of each stock with the Standard and Poor’s 500, and diving this number by the variance of the Standard and Poor’s 500. This information would later on be used to compute the alpha of each stock by taking the return of the portfolio minus the risk free rate plus the return on the market minus the risk free rate multiplied by the beta.
After getting all of this information, I was able to compute the portfolios for the months of February 2015 until December 2015. I followed a standard operating procedure for each month. I started by entering the expected return in a 1 x 5 matrix into R. Followed by entering the covariance matrix in a 5 x 5 matrix. After this I set the risk free rate to a hypothetical .005%. I then found the equal weighted portfolio and got the return on this portfolio as well as the risk associated with it and the shares to be invested in each stock, which would be .2 in this situation. After finding the equal weighted portfolio, I found the global minimum of the portfolio that gave me this expected return, the risk associated with it and the amount of shares to invest in each stock, which often times was leveraged. I then found the mean-variance efficient portfolio that was set to optimize a portfolio achieved at a target expected return. The last portfolio I found was the tangency portfolio, which was my main interest, this portfolio gave me the optimal level of the return and risk for each month and also gave me the most utility. After compiling these different portfolios I finally found the efficient frontier and plotted this on a graph along with the global minimum portfolio, the tangency portfolio and the Sharpe ratio. The optimal amount of shares to invest in each stock depended on the level of risk I was willing to take on and in this case I am a risk-seeking investor.
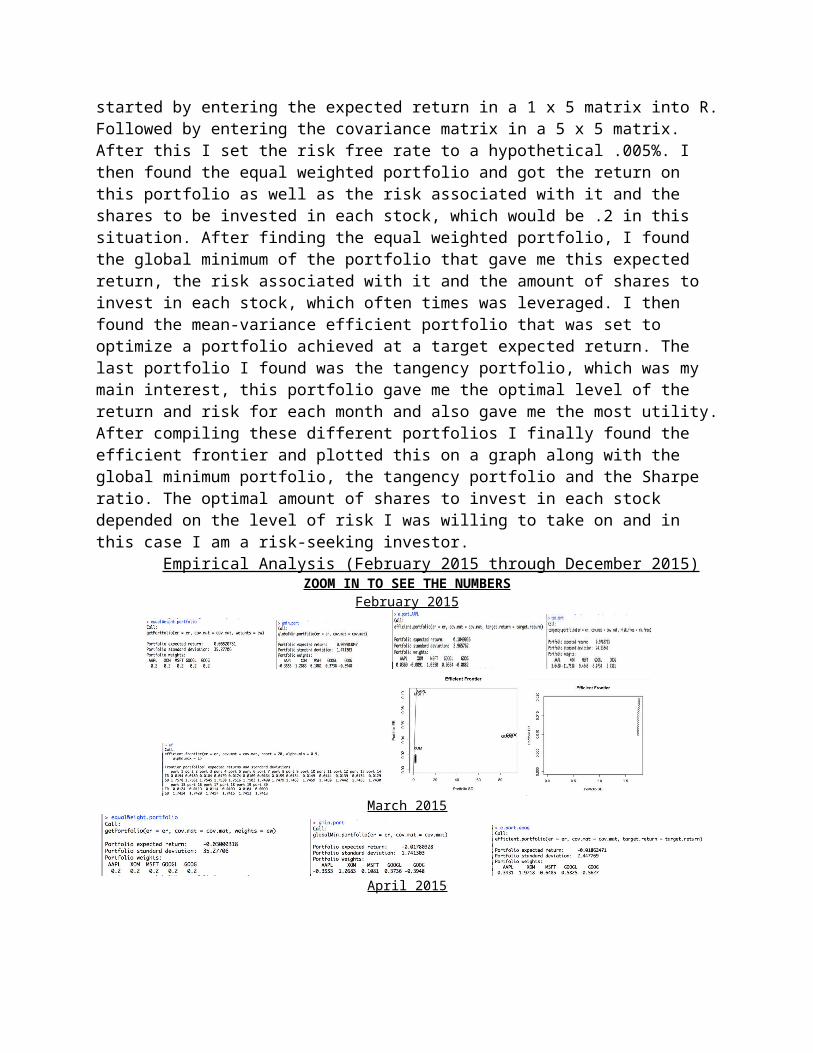
Empirical Analysis (February 2015 through December 2015)ZOOM IN TO SEE THE NUMBERS
February 2015
March 2015
April 2015
May 2015
June 2015
July 2015
August 2015
September 2015

October 2015
November 2015
December 2015
Results AnalyzedEach set of portfolios belongs to one of the eleven months analyzed. The portfolios
displayed in the results above consist of an equal weighted portfolio, a global minimum variance portfolio, a target mean-variance portfolio and a tangency portfolio. In addition to this, some months are accompanied by an efficient frontier if the risk free rate is less than

the average return on the global minimum variance portfolio. If the risk free rate is greater than average return on the global minimum variance portfolio, then the tangency portfolio cannot be computed and therefore I could not proceed in finding the optimal return and risk for the portfolio.
The month of February is the first month in which I will analyze. The equal weighted portfolio saw an expected portfolio return of 0.06520731 and a portfolio standard deviation of 35.27706. Each stock was invested at an equal amount of 20%. The global minimum portfolio saw an expected portfolio return at 0.00903047 and a portfolio risk of 1.741303. This portfolio was leveraged in the sense that some stocks were shorted while others were invested at an amount greater than one however, the sum of the short positions and long positions still equaled to one. The efficient portfolio with a target return equal to the return of Apple for the month of February gave a portfolio expected return of .1049036 and a portfolio standard deviation of 2.965762, which was a leveraged portfolio as well. The tangency portfolio gave me the highest portfolio expected return that was .9782703 and a portfolio standard deviation of 24.53341, this portfolio was also a leveraged one. In my decision on which portfolio to select, my decision is on the risk-seeking side as I stated above. The tangency portfolio would thus give me the most utility since I am able to trade off a higher risk for a higher expected return than we see in the other portfolios.
The month of March however saw different results. This month had a negative equal weighted portfolio with an expected portfolio return at -0.03000318 and a portfolio standard deviation at 35.27706. The global minimum variance portfolio also saw a negative return that was at -0.01780928 and a portfolio standard deviation at 1.741303. In this situation, a tangency portfolio cannot be created due to the fact that the risk free rate will never be higher than the return on the global minimum variance portfolio. The package, which I was using, did not allow this to occur. Therefore, for this month, even though I am a risk seeking individual I still would like to limit my losses at the least amount of risk and therefore, I decide to invest in the risk averse global minimum variance portfolio.
The month of April did not see a negative global minimum variance portfolio. Instead it was a month that had modest returns on the portfolios. The equal weighted portfolio had a portfolio expected return of 0.03995662 and a portfolio standard deviation of 35.27706. The global minimum portfolio was leveraged with a portfolio expected return of 0.05820585 and a portfolio standard deviation of 1.741303. The target mean-variance portfolio was targeted at the return of Microsoft and had a return of .1962616 with a slightly higher portfolio standard deviation of 2.54386 and was also leveraged. The tangency portfolio had a very high portfolio expected return at .3740369 and an even higher risk than all three of the other portfolios at 4.585952. Since I am a risk-seeking investor and love to take my chances, I take on all the risk and go with the tangency portfolio with the highest expected return than all the other portfolios.
The month of May saw a similar story that the month of March had. The global minimum variance portfolio had negative returns at -0.0288928 and a portfolio standard deviation at 1.741303. The equal weighted portfolio had a positive expected return at 0.0003493088 but with an astoundingly high risk for such a small return at 35.27706. The targeted portfolio of Alphabet, Inc. (GOOGL) saw an expected return of -0.00628681 and a risk of 2.238932. My optimal decision is to invest in the target portfolio since it gives me the least losses with a moderate level of risk.

The months of June through September all saw negative global minimum variance portfolios. The best strategy, in my opinion, for the month of June would be to invest in the target portfolio targeted at Alphabet, Inc. (GOOGL) due to the fact that this portfolio would give me the least amount of losses when comparing it to the equal weighted portfolio and the global minimum variance portfolio. For the month of July, the optimal decision is to go with the targeted portfolio as well due to the fact that this portfolio gives me a way much higher return of 0.2175025 with a risk of 6.631801. Even though the risk is higher, it would be irrational to invest in a portfolio that would generate a negative portfolio expected return or less returns. For the month of August, it would be optimal to invest in the targeted portfolio aimed at Alphabet, Inc. (GOOGL) which would be the portfolio with the least amount of losses possible. This is the safest portfolio option that would guard me from a higher expected loss if I were to invest in the equal weighted portfolio or the global minimum variance portfolio. For the month of September, it would be optimal to invest in the targeted portfolio at Microsoft due to the fact that it gives me positive expected returns.
The month of October was a month if moderate returns. The equal weighted portfolio saw an expected return of 0.1417983 and the portfolio risk was at 35.27706. On the other hand the global minimum variance portfolio saw an expected return of .1254743 and a portfolio risk of 1.741303. The targeted portfolio had the returns of Microsoft as the target return and saw a portfolio expected return of 0.1893358 and a portfolio risk of 2.553405. The tangency portfolio had the highest return with 0.1549041 and a portfolio risk of 1.942378. The efficient frontier was plotted for the month of portfolio. After considering the investment strategy, as a risk-seeking investor, my most utility would come from investing in the riskiest portfolio since it would have the most expected return. However, for the month of October the most expected return came from the tangency portfolio and this portfolio did not have a high risk. For the month of October, investing in the tangency portfolio would give me the most utility.
The month of November was a month of trivial returns, with the exception of the tangency portfolio. The equal weighted portfolio saw an expected return of 0.02577046 and a portfolio risk of 35.27706. The global minimum variance portfolio saw an expected return of 0.006591484 and a portfolio risk of 1.741303. The target portfolio was targeted at Microsoft and saw an expected return of 0.04637845 and a portfolio risk of 2.734432. The tangency portfolio had the highest returns with an expected return of 0.6851032 and a portfolio standard deviation of 35.99652. As a risk-seeking investor, this portfolio selection is inclining my investment strategy to lean toward the riskiest portfolio, the tangency portfolio. Even though it has the highest risk, it still has the highest return by a large margin.
The month of December was also a month similar to the months of March and May through September. This month’s investment strategy would be to go toward the target portfolio aimed at Alphabet, Inc. (GOOG) since this portfolio gives me a positive expected return when compared to the global minimum variance portfolio and the equal weighted portfolio.
The set of concepts from portfolio theory allowed me to derive these portfolios and make my optimal decision based on the utility I get from my risk-seeking investment strategy. Economically speaking, these portfolios are optimal based on my preferences.
Works Cited

1. Zivot, E. (November 11th, 2008) Computing Efficient Portfolios in R. University of Washington.


![Tangency of Conics and Quadrics - WSEASfor conics, and extend it to find the tangency of quadrics in 3d space. Although the basic theory behind it is known [5], the novelty of the](https://static.fdocuments.in/doc/165x107/5e69ae77fdba872e203b8cd0/tangency-of-conics-and-quadrics-for-conics-and-extend-it-to-ind-the-tangency.jpg)