The swedish paradox psychological + job dimorphism
56
Labour supply The case of Sweden Ulla Björnberg and Lillemor Dahlgren 2003 Introduction .........................................................................................................................................................2 Employment of men and women in Sweden .......................................................................................................2 Employment of mothers and fathers in Sweden ..................................................................................................5 Full-time/Part-time employment .........................................................................................................................7 Unemployment ..................................................................................................................................................11 Temporary employment ....................................................................................................................................15 Job flexibility- balancing work and family .......................................................................................................16 Non-employment/Workless households............................................................................................................17 Domestic work ..................................................................................................................................................18 Parental leave of mothers and fathers in Sweden ................................................................................... 20 Leave to care for sick children ..........................................................................................................................24 Income and earnings .........................................................................................................................................25 Poverty rates and poverty gap ...........................................................................................................................30 Skills and education ..........................................................................................................................................37 Age when entering the labour market ...............................................................................................................39 Education, employment and unemployment in different ethnic groups ............................................................40 Unemployment ........................................................................................................................................ 40 Employment ............................................................................................................................................ 43 Education ................................................................................................................................................ 44 Financial situation .................................................................................................................................. 44 Parental leave ......................................................................................................................................... 46 Gender equality policies relevant for the labour market ...................................................................................46 Women in managerial positions ........................................................................................................................48 Job satisfaction and health.................................................................................................................................50 Conclusion ........................................................................................................................................................51 Figures...............................................................................................................................................................53 Tables ................................................................................................................................................................54 References .........................................................................................................................................................54 1
-
Upload
jondoeindustries -
Category
Documents
-
view
217 -
download
0
Transcript of The swedish paradox psychological + job dimorphism

Labour supply
The case of Sweden
Ulla Björnberg and Lillemor Dahlgren 2003
Introduction.........................................................................................................................................................2
Employment of men and women in Sweden.......................................................................................................2
Employment of mothers and fathers in Sweden..................................................................................................5
Full-time/Part-time employment .........................................................................................................................7
Unemployment..................................................................................................................................................11
Temporary employment ....................................................................................................................................15
Job flexibility- balancing work and family .......................................................................................................16
Non-employment/Workless households............................................................................................................17
Domestic work ..................................................................................................................................................18
Parental leave of mothers and fathers in Sweden................................................................................... 20 Leave to care for sick children ..........................................................................................................................24
Income and earnings .........................................................................................................................................25
Poverty rates and poverty gap ...........................................................................................................................30
Skills and education ..........................................................................................................................................37
Age when entering the labour market ...............................................................................................................39
Education, employment and unemployment in different ethnic groups............................................................40
Unemployment ........................................................................................................................................ 40 Employment ............................................................................................................................................ 43 Education................................................................................................................................................ 44 Financial situation.................................................................................................................................. 44 Parental leave ......................................................................................................................................... 46
Gender equality policies relevant for the labour market ...................................................................................46
Women in managerial positions........................................................................................................................48
Job satisfaction and health.................................................................................................................................50
Conclusion ........................................................................................................................................................51
Figures...............................................................................................................................................................53
Tables ................................................................................................................................................................54
References.........................................................................................................................................................54
1

Introduction
This is the second national report for the Nordic project on Welfare Policies and Employment
in the Context of Family Change and it focuses on parents in the labour market in Sweden
between 1990 and 2000.
Sweden went through a major recession during the 1990s, leading to high levels of
unemployment. The first half of 1990s was a problematic period from a social political view,
both economically and demographically. Political as well as economic changes occurred
during the 1990s with different implications for the living conditions of families. The
situation improved during the later part of the 1990s, but some groups in society, young lone
mothers and immigrants in particular, still suffer from relatively high rates of unemployment,
insecure labour market situation and problematic financial situations.
Employment of men and women in Sweden
By the end of the 1960s, the economy was still expanding, and the great need for labour was
predicted to continue. It was argued that the best ways to supply labour was to make it easier
for women to be gainfully employed and that equal opportunities between men and women
was to be accomplished. Several social reforms were introduced in the 1970s. The
breakthrough of the two-earner system in Sweden was supported by a number of social
reforms with direct influence on individuals’ choices concerning employment and household
labour (Björnberg, 2004).
Today the activity rate of women in Sweden does not differ much from that of men. The
activity rate among men has decreased since the 1960s, while the activity rate among women
has increased almost 40 percent since. During the 1990s the activity rate decreased, however,
and especially so during the first part of the decade. The activity rate of men was 85 percent in
1990, and decreased to 77 percent in 2001. For women the activity rate has decreased from 81
percent in 1990 to around 73 percent in 2001 (figure 1).
2
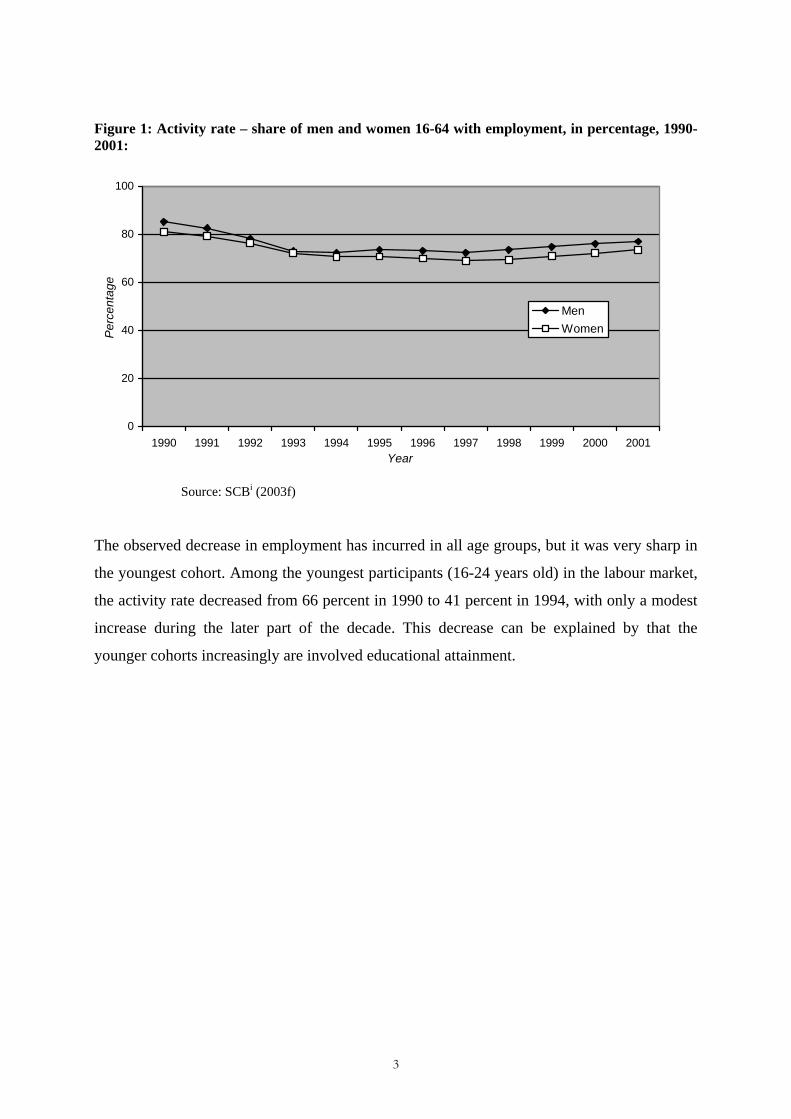
Figure 1: Activity rate – share of men and women 16-64 with employment, in percentage, 1990-2001:
0
20
40
60
80
100
1990 1991 1992 1993 1994 1995 1996 1997 1998 1999 2000 2001Year
Perc
enta
ge
MenWomen
Source: SCBi (2003f)
The observed decrease in employment has incurred in all age groups, but it was very sharp in
the youngest cohort. Among the youngest participants (16-24 years old) in the labour market,
the activity rate decreased from 66 percent in 1990 to 41 percent in 1994, with only a modest
increase during the later part of the decade. This decrease can be explained by that the
younger cohorts increasingly are involved educational attainment.
3

Figure 2: Activity rates – share of population with employment, different age groups, in percentage, 1990-2001
0
20
40
60
80
100
1990 1991 1992 1993 1994 1995 1996 1997 1998 1999 2000 2001Year
Perc
enta
ge
16-24 year olds25-54 year olds55-64 year olds
Source: SCB (2003f) The labour market in Sweden is segregated by gender, both horizontally as well as vertically.
Horizontally the labour market is segregated in its division of public and private sector work,
vertically in its division of employment positions within the workplace (Muhonen 1999). The
pattern of the gender segregated labour market participation among men and women was
established by 1970 and has remained since then. The sector with the highest proportion of
female employment has been the public sphere, especially in social and personal services like
education and care.
The share of women working in the private sector increased during the 1990s, however. As
seen in figure 3, equal numbers of women work in the private and public sectors today,
something that was not the case in the early 1990s. This is explained not only by cuts in staff
within the public sphere, but also by privatization of state-owned companies (LUii 2003).
During the same period, the number of men in the private sector has increased. The private
sector included around half of all employed in the early 1990s, a figure that was two-thirds in
2001. In the private sector, the majority of employed belong to younger cohorts, while it is the
opposite within the public sector (SCB 2002c).
4
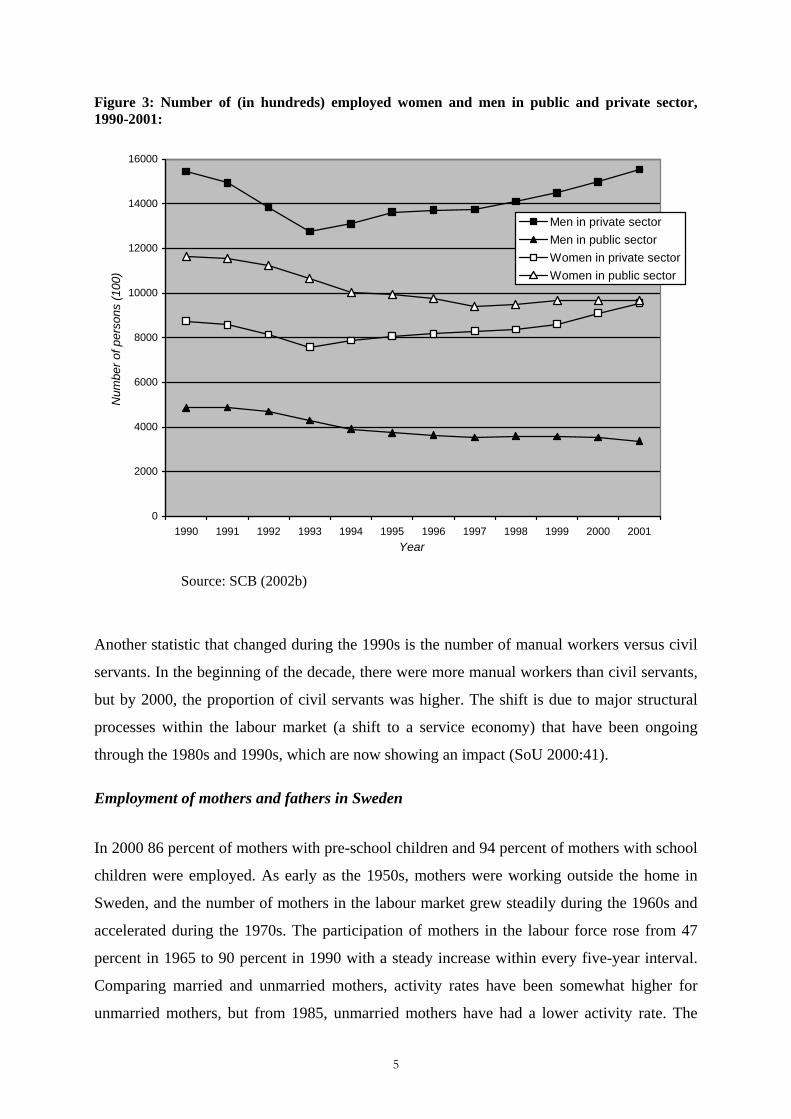
Figure 3: Number of (in hundreds) employed women and men in public and private sector, 1990-2001:
0
2000
4000
6000
8000
10000
12000
14000
16000
1990 1991 1992 1993 1994 1995 1996 1997 1998 1999 2000 2001Year
Num
ber o
f per
sons
(100
)
Men in private sectorMen in public sectorWomen in private sectorWomen in public sector
Source: SCB (2002b)
Another statistic that changed during the 1990s is the number of manual workers versus civil
servants. In the beginning of the decade, there were more manual workers than civil servants,
but by 2000, the proportion of civil servants was higher. The shift is due to major structural
processes within the labour market (a shift to a service economy) that have been ongoing
through the 1980s and 1990s, which are now showing an impact (SoU 2000:41).
Employment of mothers and fathers in Sweden
In 2000 86 percent of mothers with pre-school children and 94 percent of mothers with school
children were employed. As early as the 1950s, mothers were working outside the home in
Sweden, and the number of mothers in the labour market grew steadily during the 1960s and
accelerated during the 1970s. The participation of mothers in the labour force rose from 47
percent in 1965 to 90 percent in 1990 with a steady increase within every five-year interval.
Comparing married and unmarried mothers, activity rates have been somewhat higher for
unmarried mothers, but from 1985, unmarried mothers have had a lower activity rate. The
5

change might be explained by a change in the statistical definition: until 1985, the category
"unmarried mothers" included cohabiting mothers, but after 1990, cohabiting mothers were
included in the category of married mothers (Björnberg, 1998, unpublished paper).
As seen in figure 4, fathers work as much, or even more, than men in general, while mothers
work less than women in general, at least when the child is under the age of seven. However,
it has been shown that married/cohabiting fathers of young children do work approximately
30 minutes less a day in 2000/2001 than they did in the early 1990s (LU 2003). Fathers with
preschool children work in average 40 minutes less per day than they did in the in 1990. This
reduction is largely related to more fathers taking parental leave, but it does also reflect a
pattern of reduction in work hours of fathers with preschool children (SCB 2003g)
Figure 4: Average hours working per week, men and women with children under age 7 compared to all working men and women, year 2002:
0
10
20
30
40
50
All working men All working men withchildren under age 7
All working women All working womenwith children under age
7
Hou
rs/w
eek
Source: SCB (2002a)
There is a difference when comparing absence from work. Eighty-one percent of mothers to
children aged 0 to 16 have employment, but they are absent from work more frequently than
fathers. Out of the 81 percent mothers with employment, only 62 percent were at the
workplace during the investigated week, and among mothers of one-year-olds, the figure was
down to 49 percent. Fathers, on the other hand, are usually present at the workplace, as it is
twice as likely for mothers than fathers to be absent (SCB 2002d). The absenteeism can
largely be explained by parental leave.
6

Figure 5: Children in families, occupation (etc.) of mothers and fathers, in percentage, year 2000:
0
20
40
60
80
100
Work 1-19h/w
Work 20-34h/w
Work 35+ h/w Absent* Unemployed Student Other*
Perc
enta
ge
Children with married/cohabitingmothersChildren with lone mothers
Children with married/cohabitingfathersChildren with lone fathers
*Absent – Sick leave, Care of sick children, Vacation, parental leave. *Other – Those who are not in the labour market and not students.
Source: SCB (2002d) In spite of high rates of unemployment during the recession in the 1990s, women have not
"returned" to the home as housewives. Women are well established in the labour market; an
establishment that was not affected by the recession (SoU 2000:3).
Full-time/Part-time employment
A significant pattern of female employment in Sweden has been part-time employment. In
statistics, part-time employment is divided into short and long part-time, where short is
defined as being 1-19 hours a week and long is defined as being 20-34 hours a week. As seen
in figure 4, parents most commonly work full-time, that is, more than 35 hours a week. Very
few work short part time. Part-time work is more common among mothers than among
fathers, especially mothers in nuclear families. Fathers tend to work the same amount of hours
regardless of their children’s ages, while mothers tend to work less hours when the children
are under the age of seven (SoU 2001:24, Ds 2001:57)
7

Parents with children under the age of eight have the right to work part-time in Sweden.
However, this is a right seldom used by fathers, as only 3 percent of fathers worked part-time
in 2001. It is nearly as common with part-time as full-time employment among mothers with
children under the age of six, and the majority of mothers with older children work full-time.
In a study from the early 1990s, many parents declared that they found the ideal situation to
be when both parents work part-time, but in reality, such a solution is rare. Among children
aged 0-5, only 1 percent had parents who both worked part-time in 2001 (SCB 2003e).
Instead the rate of full-time employment has increased among mothers.
Married/cohabiting mothers work part-time more than lone mothers do. In the beginning of
the 1990s, about 25 percent of married/cohabiting mothers worked less than 30 hours a week,
a figure that has decreased to around 15 percent in 2001. The number of lone mothers
working less than 30 hours a week has remained fairly constant throughout the 1990s, but
decreased from over 12 percent to less than 9 percent between 2000 and 2001(figure 6).
Figure 6: Part time employed mothers (less than 30 hours/week), 1990-2001, in percentage:
0
20
40
60
80
100
1990/1991 1992/1993 1994/1995 1996/1997 1998/1999 2000 2001
Year
Perc
enta
ge
Lone MothersCohabiting/Married mothers
Source: SCB (2003a)
The number of mothers working full-time has increased, especially during the end of the
1990s. Overall, it is more typical that mothers are working full-time than part-time today, as
seen in figure 7. The number of lone mothers working more than 35 hours a week was up to
8

over 60 percent in 2001, while around 45 percent of married/cohabiting mothers worked full-
time the same year.
Figure 7: All year, full time (more than 35 hours/week) employed mothers, 1990-2001, in percentage:
0
20
40
60
80
100
1990/1991 1992/1993 1994/1995 1996/1997 1998/1999 2000 2001
Year
Perc
enta
ge
Lone MothersCohabiting/Married mothers
Source: SCB (2003a)
The level of education seems to be an important factor in determining whether mothers work
full-time or part-time, while it has no significant impact among fathers, as they seem to work
full-time regardless of educational level (table 1). The higher the education level, the more
likely it is that the mother works full-time. Among mothers who have long post-secondary
education, 72 percent work full-time whereas of mothers with 2-year upper Secondary
education 52 percent work full-time. 58 percent of these mothers are employed at all which
indicate that low educated mothers have a more marginalised position on the labour market.
9

Table 1: Parents with employment depending on level of education and how many of these are working full time, 1999, in percentage:
MOTHERS FATHERS
EDUCATION WITH EMPLOYMENT
OUT OF WHICH WORK FULL TIME
WITH EMPLOYMENT
OUT OF WHICH WORK FULL TIME
2 year Upper Secondary Education
58 52 77 95
3 year Upper Secondary Education
61 57 78 96
Short Post-secondary Education
66 60 79 95
Long Post-secondary Education
72 72 81 96
Source: SoU 2001:24
As shown in figure 8 many women have involuntary part-time work, Instead, they work part-
time involuntarily due to labour market reasons. During the mid-1990s, as many as 25 percent
of mothers stated that they wanted to work longer hours than they did at the time of the
investigation. The involuntary part-time work among women is a reflection of a flexibilisation
strategy on the labour market where work hours are reduced in order to meet fluctuations
within the economy. This strategy is more applied within the service sector where women are
working.
10

Figure 8: Persons working less than they would want to out of labour market reasons (out of 1000):
0
50
100
150
200
250
300
1990 1991 1992 1993 1994 1995 1996 1997 1998 1999 2000 2001
Year
Per 1
000
MenWomen
Source: SCB (2002b)
Unemployment
The rate of unemployment among both men and women was below three percent for decades
prior to 1990s. Unemployment rates were at the lowest in 1990, at about 1,4 percent for
women and 1,5 percent for men. During the 1990s, the rate of unemployment reached levels
not seen in Sweden since the 1930s (SoU 2000:3). As seen in figure 9, men seem to have been
mostly affected by unemployment during the 1990s. However, the rate was lower among men
with children than without, while it was the opposite for women (SoU 2001:24).The
unemployment rate has been reduced since 1997, but has not reached the same low level as
seen in the beginning of the decade (figure 9).
Women had lower rates than men in all age groups, although calculations of
underemployment and hidden unemployment suggest that women had a rate of 17 percent and
men 13 percent in 1995 (Björnberg 1998). The dramatic increase in unemployment after 1992
is mainly due to a large drop in industry and later in the public service sector. From this time,
the goal of full employment was replaced by the goal of reducing inflation.
11
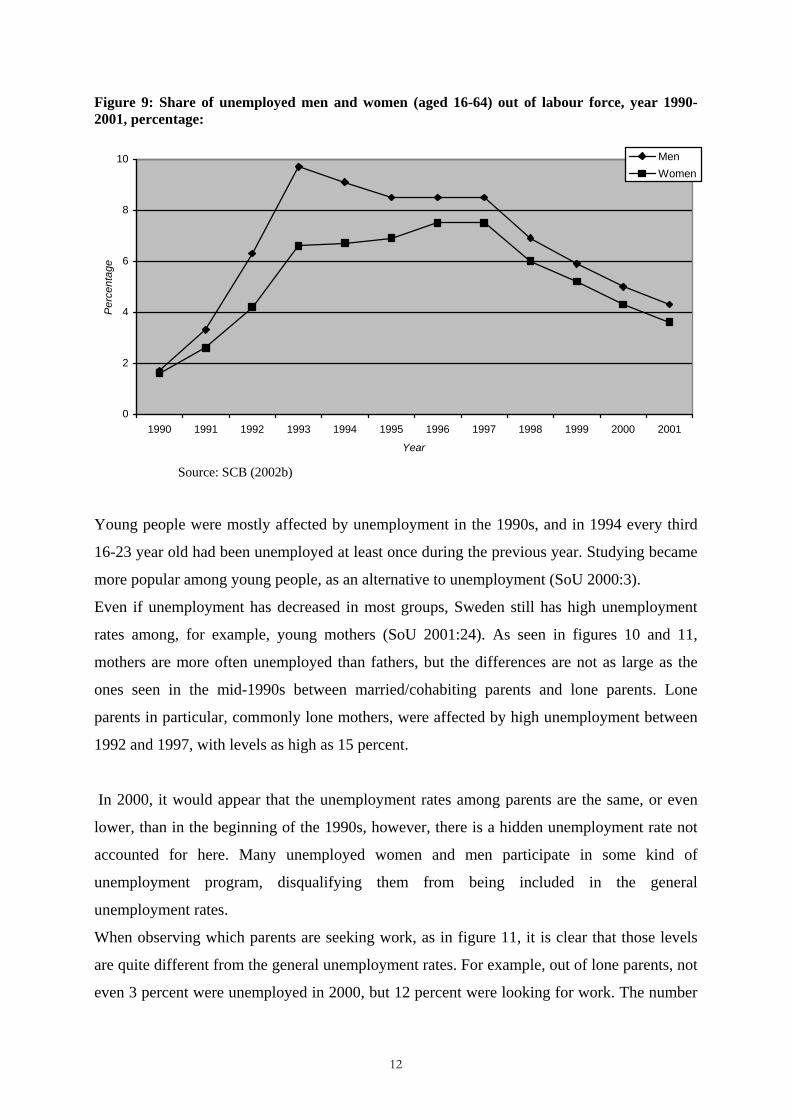
Figure 9: Share of unemployed men and women (aged 16-64) out of labour force, year 1990-2001, percentage:
0
2
4
6
8
10
1990 1991 1992 1993 1994 1995 1996 1997 1998 1999 2000 2001
Year
Perc
enta
ge
MenWomen
Source: SCB (2002b)
Young people were mostly affected by unemployment in the 1990s, and in 1994 every third
16-23 year old had been unemployed at least once during the previous year. Studying became
more popular among young people, as an alternative to unemployment (SoU 2000:3).
Even if unemployment has decreased in most groups, Sweden still has high unemployment
rates among, for example, young mothers (SoU 2001:24). As seen in figures 10 and 11,
mothers are more often unemployed than fathers, but the differences are not as large as the
ones seen in the mid-1990s between married/cohabiting parents and lone parents. Lone
parents in particular, commonly lone mothers, were affected by high unemployment between
1992 and 1997, with levels as high as 15 percent.
In 2000, it would appear that the unemployment rates among parents are the same, or even
lower, than in the beginning of the 1990s, however, there is a hidden unemployment rate not
accounted for here. Many unemployed women and men participate in some kind of
unemployment program, disqualifying them from being included in the general
unemployment rates.
When observing which parents are seeking work, as in figure 11, it is clear that those levels
are quite different from the general unemployment rates. For example, out of lone parents, not
even 3 percent were unemployed in 2000, but 12 percent were looking for work. The number
12

of men and women in unemployment programs increased greatly during the 1990s, as shown
in figure 12, which can explain the differences in figures 10 and 11.
Figure 10: Unemployed parents, in percentage, 1990-2000:
0
5
10
15
20
1990/1991 1992/1993 1994/1995 1996/1997 1998/1999 2000
Year
Perc
enta
ge
Lone parentsCohabiting/Married mothersCohabiting/Married fathers
Source: SCB (2003a)
Figure 11: Parents looking for work, 1990-2000, in percentage:
0
5
10
15
20
1990/1991 1992/1993 1994/1995 1996/1997 1998/1999 2000
Year
Perc
enta
ge
Lone parentsCohabiting/Married mothersCohabiting/Married fathers
Source: SCB (2003a)
13
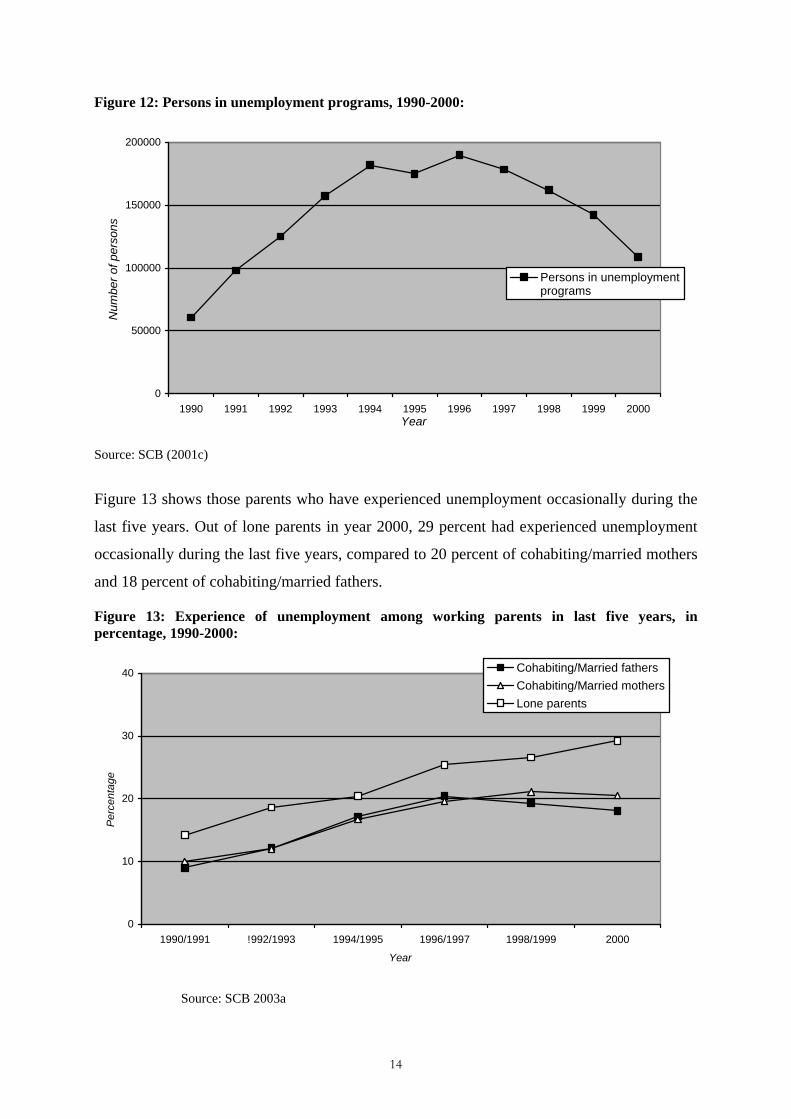
Figure 12: Persons in unemployment programs, 1990-2000:
0
50000
100000
150000
200000
1990 1991 1992 1993 1994 1995 1996 1997 1998 1999 2000Year
Num
ber o
f per
sons
Persons in unemploymentprograms
Source: SCB (2001c)
Figure 13 shows those parents who have experienced unemployment occasionally during the
last five years. Out of lone parents in year 2000, 29 percent had experienced unemployment
occasionally during the last five years, compared to 20 percent of cohabiting/married mothers
and 18 percent of cohabiting/married fathers.
Figure 13: Experience of unemployment among working parents in last five years, in percentage, 1990-2000:
0
10
20
30
40
1990/1991 !992/1993 1994/1995 1996/1997 1998/1999 2000
Year
Perc
enta
ge
Cohabiting/Married fathersCohabiting/Married mothersLone parents
Source: SCB 2003a
14
It is clear that married/cohabiting fathers hold a strong position in the labour market compared
to mothers and lone parents (who are most often lone mothers).
Temporary employment
Overall, the 1990s have developed into a period where permanent employment is no longer
the norm or something to take for granted, as the chances that a person will obtain temporary
employment have doubled for both men and women during the decade. Still, it is more likely
that more women than men will have temporary employment, also among parents (SoU
2000:3, Ds 2001:57). This development strikes lone parents more than married/cohabiting
parents. As seen in figure 14, more lone parents, mostly mothers, had temporary employment
during the 1990s compared to both married/cohabiting fathers and mothers. In 2000, the
number of married/cohabiting mothers and lone parents with temporary employment was
approximately the same, 13 and 14 percent respectively, after a decrease among lone parents
who had temporary employment in the last year. This shows however that lone mothers have
a more precarious labour market situation. The number of fathers with temporary employment
increased only slightly during the first part of the decade, only to decrease during the later part
to a little less than 6 percent in 2000.
15

Figure 14: Parents with temporary employment out of all employed, 1990-2000, in percentage:
0
5
10
15
20
25
30
1990/1991 1992/1993 1994/1995 1996/1997 1998/1999 2000
Year
Perc
enta
ge
Lone parentsCohabiting/Married mothersCohabiting/Married fathers
Source: SCB (2003a)
Job flexibility- balancing work and family
The most common form of job flexibility in Sweden is called "flextime," which is a type of
employment that allows employees to work their choice of a few hours in the morning and/or
a few hours in the afternoon, as long as the employee works the total weekly hours for which
they were hired. Parents usually use their "flextime" to shorten their children's days in
childcare (SoU 2001:55)
A study of 10-18 year old children in Sweden showed that the number of parents who had
flextime at their jobs had increased since the 1980s, both among mothers and fathers.
Between 1981 and 2000, the amount of mothers who had flextime at their jobs increased from
31 percent to 55 percent, reflecting an increase of 24 percent. Moreover, during the same
period, the amount of fathers who had flextime at their jobs was higher than the amount of
women and increased from 46 percent to 68 percent. (SoU 2001:55).
Lone mothers have flextime to a lesser extent: 46 percent compared to 62 percent of mothers
in two-parent households. Fathers generally have flextime more often than mothers: 74
percent of fathers in two parent households and 67 percent of fathers in lone parent
households have flextime at their jobs. (figure 15).
16

Figure 15: Mothers and fathers of 10-18 year old children (living at home), with flexible working hours, ‘flextime’, in year 2000, out of those who work at least 10 hours a week, in percentage:
0
20
40
60
80
100
In two parent households In lone parent households
Perc
enta
ge
MothersFathers
Source: SoU 2001:55
Another way to measure flexibility is to see if the workplace can be left temporarily, or visited
by, for example, children. Among the 10-18 year old children in the above-mentioned study,
72 percent of their fathers and 46 percent of their mothers could leave the workplace for a
while. Around 50 percent of their mothers and 34 percent of their fathers could be visited at
their places of work, and most children, 90 percent, could contact both parents by telephone
during the working day. The preceding study seems to indicate that many workplaces have
become more "parent-friendly" over the years. Still, not all parents have the same job
flexibility. Parents not born in Sweden, as well as lone parents, do not have the same high
rates of flexibility as other parents (SoU 2001:55).
Non-employment/Workless households
The amount of people who are outside the labour market all together, and are not considered
unemployed, students, nor retired, has stayed at the same level, more or less, throughout the
1990s. Most of these non-employed people are in the age group 56 to 65 years old (SoU
2000:3).
17

Among children aged 0-16 years old, about 3 percent live in a household where none of the
parents are either working or studying. These workless households are more common among
the youngest children, aged 0-5 years old, where the figure is up to 6 percent (SCB 2002d).
Domestic work
Women do 60 percent of domestic (including child care)1 work in families with preschool
children, which also reflect the fact that women take the bulk of parental leave. Compared
with 1990, women have reduced their time for domestic work with 40 minutes a day. Women
do in general 4:08 hours a day unpaid domestic work. Men have not changed their domestic
work pattern since 1990. They do 2:46 hours a day (7 minutes less than they in 1990). Ten
years ago women did 65 percent more domestic work than men, now they do about 50 percent
more. Said otherwise, gender equality as far as domestic work is concerned has become
somewhat more equal but this is mainly because women have reduced their time for domestic
work. Behind the equalisation is also the fact that men have reduced their share in paid work
with 20 minutes a day, whereas women’s share has not changed (SCB 2003g).
Looking more closely into time spent on child care2, the study reveals that mothers with pre-
school children and living in couples have reduced their total time for child care with 32
minutes a day since 1990. They have increased their time with 6 minutes a day for care of
school children. In total, mothers do child care 2:14 hours a day, whereas fathers do half as
much – 1:03 hours a day. Mothers do 38 minutes a day of child care for school children and
fathers 22 minutes a day. These figures are based on those fathers who participate in child
care. However, 20 percent of men are not involved in care of pre-school children and 54
percent are not involved in care of school children (ibid.).
The reduction of time used for child care is significant. Lone mothers have reduced their time
more than mothers in couples. However, it is emphasised by the investigators that child care is
a complex category and individuals have different interpretation of the time spent with
1 Domestic work was studied in a time budget survey undertaken by Statistics Sweden. The study compares 1990 and 2000, crossectionally. Domestic work is a wide category that includes care work, household work, purchase of goods, maintenance work – all unpaid work which could be replaced by paid work. As such it is regarded as productive work and separated from leisure (SCB 2003). 2 Caring for children is the widest category used in the study, but more specific activities can also be discerned. The categorisation of specific activities are not without problems. In the study, ’talking with children’ ’reading for children’ ’playing with children’ were categorised as separate activities. So was ’looking after children’.
18

children as child care or leisure. It is only the main activity that is registered, which means
that doing two activities at a time will give priority in the coding only as one activity.
Looking more closely into household work (cooking, baking, cleaning, washing up and doing
laundry) women do twice as much as men. In couples with pre-school children women do
2:19 and men 1:02 hours a day. A similar pattern is revealed for couples living with school
children. All in all, the sharing of domestic work in has been reduced mainly by that women
do less domestic work than they did ten years ago. The activity that has been mostly reduced
is cleaning. This reduction has contributed to somewhat more equality in terms of total
sharing of domestic work and paid work. The unequal sharing within the household has
however not changed (ibid.)
Parental Leave Parental insurance is constructed as a kind of sickness insurance and follows the same basic
principles. The insurance allows leave to take care of a child and economic compensation. A
person on parental leave is guaranteed continued employment if he or she was employed for
at least 6 months before a child is born. Unemployed parents who have had an income
entitling them to sickness benefit are also entitled to the parental allowance. Still, parental
insurance is tied to a very strong incentive to be employed and to work full-time. This is also
apparent in the employment pattern of young women: almost all have been employed before
their first child. Before childbirth, most women are employed full-time; when returning to the
labour market after parental leave, many start to work part-time. The rule that a parent can
keep the level of income upon which the insurance is based for two and a half years after the
birth of a child has also encouraged a closer spacing of births (Björnberg 2002).
After the most recent legislative changes in January 2002, parents are eligible to 480 days of
parental leave to share between them. However, 60 days are tied to each parent and can not be
transferred to the other parent. The rules of parental insurance allows for flexibility in sharing
implying that parental leave can be taken by either parent and in many varied ways during the
first eight years of the child’s life. During the first 390 days, 80 percent of the parent's
income is paid, but with a limitation set to 70 Euros a day. Those with no income or a very
low income are guaranteed at least 17 Euros a day (FK 2003).
19

Parental leave of mothers and fathers in Sweden There has been a steady increase in fathers' take up of parental leave. For example, back in
1980, fathers used 5 percent of the insured parental days, a figure that reached 7 percent in
1990, and 12 percent in 2000. However, in cases where both parents have a low income, the
father uses fewer days of parental leave. Furthermore, fathers usually take more days with the
first child than with subsequent children (Ds 2001:57). The fact that fathers seem more likely
to take parental leave with their first child may be because it often takes more time to
establish childcare for the first child than for siblings (RFV 2002).
Figure 16 shows how fathers' use of parental leave has increased during the 1990s, from 7
percent in 1990 to 16 percent in January 2003. This increase can be explained by the fact that
from year 1995, 30 days of parental leave were tied to each parent. In January of 2002, these
30 days were extended to 60 days of parental leave, but the effects remain to be seen, as it is
only applicable to children born after the effective date of the changes.
Figure 16: Reimbursed days of parental leave year 1990-2003, in percentage:
0
20
40
60
80
100
1990 1991 1992 1993 1994 1995 1996 1997 1998 1999 2000 2001 2002 2003*Year
Perc
enta
ge
WomenMen
* Figure for year 2003 is only based on the month of January
Source: SCB (2002d) and RFV (2003) With the changes regarding parental leave in 1995, when 30 days were tied to each parent
(extended to 60 days in 2002), it was hoped that a relatively equal share of the parental leave
would be distributed between women and men. It can be assumed that an equal share of the
parental leave can lead to an equal share of the overall care of the children, as well as the
unpaid work in the household. In addition, an equal share of the parental leave could lead to a
20

greater equality in the labour market. If fathers are equally likely to stay home with the
children, mothers will not be discriminated against in the labour market where they are often
assumed the ones caring for the children (RFV 2002).
Still, tying the 60 days of parental leave to each parent does not seem to be a sufficient
method for establishing more equal opportunities in the labour market. Attitudes and norms
remain in society where it is often assumed that women are the main caretakers for children,
which can then lead to disadvantages for women in the labour market (LU 2003).
In 2002, a study was conducted to analyse to what extent the 30 days tied to each parent (the
so-called "daddy month") had changed fathers' use of parental leave, if at all (RFV 2002). In
the analysis, families with children born in 1993 (before the "daddy month") were compared
to families whose children were born in 1996 (after the introduction of the "daddy month").
The result shows that more fathers used some of the parental leave, but it has not led to fathers
staying home for longer periods (figure 17).
Figure 17: Fathers to children born in 1993 and 1996 on parental leave, number of days taken, percentage:
0
20
40
60
80
100
0 days 1-30 days 31- daysNumber of days
Perc
enta
ge
Fathers to children born 1993Fathers to children born 1996
Source: RFV (2002)
Among those who used parental leave days in 2001, almost 40 percent were men, and they
took 13,8 percent of the total days available for parental leave. If compared to the situation in
1993, before the "daddy month" was introduced, it is clear that there has been an increase in
fathers use of parental leave, and that this policy has had some impact. In 1993, the share of
men using parental leave was 27 percent and they took 10 percent of the total parental leave
days available. Still, out of the fathers who take parental leave, the length of leave has
21

shortened. In 1993, the fathers used 40 days on average; while in 2001 the number of days
taken on average was down to 27,1 days of parental leave (RFV 2002).
Another difference between the fathers with children born in 1993 and those with children
born in 1996 is that there are significantly fewer fathers who took no parental leave after the
changes were instituted in 1996, as also shown in figure 17. Almost 50 percent of the children
born in 1993 had a father who took no parental leave, while this figure decreased to less than
25 percent for children born in 1996. The group of fathers who take between 1 and 30 days of
parental leave is the one group that has grown the most (RFV 2002).
Still, despite the increase, many fathers in Sweden still do not take any parental leave days at
all, and those who do take far less days than the mothers. One explanation is said to be the
attitudes and norms in society. Another explanation is that it usually costs more for a family
when the father is home, since he generally has the highest income. Because there is a limit of
70 Euros/day paid for parental leave, those who make more money will then be subject to a
greater income reduction during that time. Regardless of whether the mother, father, or both
take parental leave, there will be less disposable income during the time of leave. The size of
the reduction depends on the size of income before the parental leave. Table 2 shows how
much of a reduction a family can experience yearly depending on the prior incomes and
depending on who takes the parental leave and for how long. Although those with lower
incomes will experience a total reduction of about 20 000 to 22 000 SEK annually due to
parental leave, the reduction is more or less the same regardless of who is on leave and for
how long. Still, it is clear that the reduction becomes greater with higher incomes, and that the
reduction differs greatly depending on who is taking the leave.
The payment maximum of 70 Euros /day may explain why some men do not take parental
leave, but it does not explain why men with lower incomes do not. Therefore, raising the limit
would only benefit some, and perhaps result in more fathers with high incomes taking
parental leave, but would make no difference for others (LU 2003). Also it has been shown,
according to RFV, that parental leave has a greater negative effect on men's wages than on
women's. Parental leave has been shown to result in no wage increase for women but instead,
a wage cut for men (LU 2003, RFViii 2002).
Table 2: Families yearly loss of income depending on individual incomes and share of parental leave, in SEK:
22

Income of person 1
Income of person 2
Person 1: 30 days Person 2: 330 days
Person 1: 180 days Person 2: 180 days
Person 1: 330 days Person 2: 30 days
181 700 171 600 20 773 21 137 21 514 222 900 199 600 23 686 25 291 26 680 263 300 226 400 28 338 30 351 32 243 426 500 306 200 50 460 70 042 96 501 Source: LU 2003
Earlier studies have shown that the education level of parents is an important factor in
determining who takes parental leave and who does not. Generally, these studies show that
fathers with higher education take more days of parental leave than those with lower
education. This can also be seen in the study regarding the "daddy month," as shown in figure
18. Fathers who have primary and lower secondary education or less are more likely to be
found among those who take no parental leave at all. At the same time, those with post-
secondary education are more likely to be found among those who take 30 days or more. This
is noticeable both among the children born in 1993 and those born in 1996 (RFV 2002).
Figure 18: Fathers to children born in 1993 and 1996 taking no parental leave, educational level, in percentage:
0
20
40
60
80
100
Primary and lower secondary education, or less Post-secondary educationLevel of education
Perc
enta
ge
Fathers to children born 1993Fathers to children born 1996
Source: RFV (2002)
In addition, the greater the similarity between the partners with respect to education and
career aspirations, the greater the tendency towards equal sharing of parental leave. However,
if there is a large discrepancy in this respect between the partners--for instance with the father
earning much more than the mother--the likelihood that the partner with the higher income
23
will take parental leave decreases. Men who work in public services, especially in professions
that are not male-dominated, tend to make the greatest use of parental leave (Björnberg 1998).
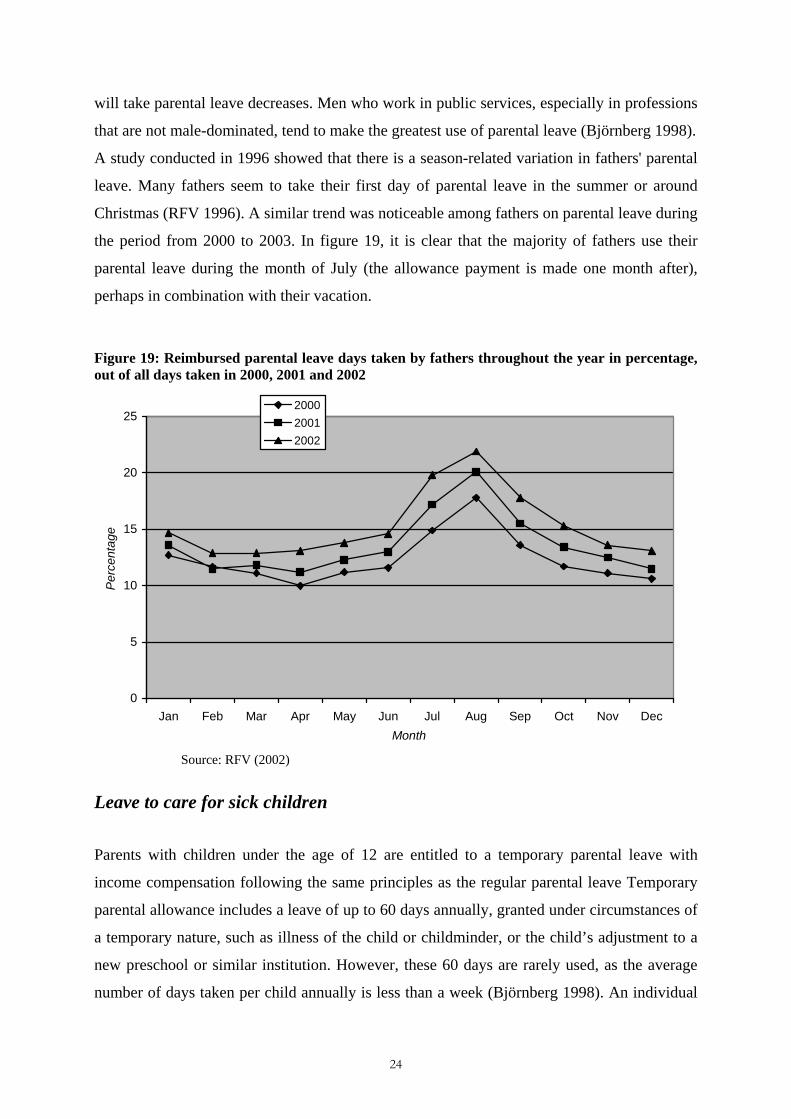
A study conducted in 1996 showed that there is a season-related variation in fathers' parental
leave. Many fathers seem to take their first day of parental leave in the summer or around
Christmas (RFV 1996). A similar trend was noticeable among fathers on parental leave during
the period from 2000 to 2003. In figure 19, it is clear that the majority of fathers use their
parental leave during the month of July (the allowance payment is made one month after),
perhaps in combination with their vacation.
Figure 19: Reimbursed parental leave days taken by fathers throughout the year in percentage, out of all days taken in 2000, 2001 and 2002
0
5
10
15
20
25
Jan Feb Mar Apr May Jun Jul Aug Sep Oct Nov DecMonth
Perc
enta
ge
200020012002
Source: RFV (2002)
Leave to care for sick children
Parents with children under the age of 12 are entitled to a temporary parental leave with
income compensation following the same principles as the regular parental leave Temporary
parental allowance includes a leave of up to 60 days annually, granted under circumstances of
a temporary nature, such as illness of the child or childminder, or the child’s adjustment to a
new preschool or similar institution. However, these 60 days are rarely used, as the average
number of days taken per child annually is less than a week (Björnberg 1998). An individual
24

cohabiting with the child’s parent is also entitled to a temporary parental allowance, and it
can, under certain circumstances, be transferred to a friend or relative (FKiv 2003).
As seen in figure 20, fathers use around 35 percent of the total amount of days, and the figure
has remained steady throughout the 1990s.
Figure 20: Reimbursed days with temporary parental leave, leave to care for sick children 1990-2003, in percentage:
0
20
40
60
80
100
1990 1991 1992 1993 1994 1995 1996 1997 1998 1999 2000 2001 2002 2003*Year
Perc
enta
ge
WomenMen
* Year 2003 is only based on the month of January
Source: SCB (2002d) and RFV (2003)
Income and earnings
The incomes of men and women are usually from work, as seen in figure 21. The share of
people with income from work has decreased during the 1990s, however. Ninety-two percent
of women had income from work in 1990, a figure that has decreased to around 88 percent in
2000. The figures for men are similar to those of women, only slightly higher. Around 94
percent of men had income from work in 1990, which has decreased to 90 percent in 2000.
25

Figure 21: Share of population aged 20-64 with income from work, 1990-2000, in percentage:
50
60
70
80
90
100
1990 1991 1992 1993 1994 1995 1996 1997 1998 1999 2000Year
perc
enta
ge
WomenMen
Source: SCB (2002e)
In figure 22, it is shown that the average (mean) income for men and women decreased during
the mid 1990s, only to increase towards the end of the decade. Still, the difference in the
average income for women with that of men is the same throughout the decade, despite the
fact that more women work full-time today.
Figure 22: Income from work, for all individuals age 20-64, 1990-2000, mean-value in SEK thousands:
0
50
100
150
200
250
1990 1991 1992 1993 1994 1995 1996 1997 1998 1999 2000Year
SEK
thou
sand
s
WomenMen
Source: SCB (2002e)
26

The median monthly wage in 2001 for men was 20 200 and for women 17 700 SEK, all based
on full-time employment. The average monthly wage is higher within the private sector than
the public. The average wage within the public sector was 19 800 SEK in 2001, while it was
22 100 SEK within the private sector (SCB 2002c). The relative level of wages within the
public sector, mainly within occupations such as health, care and education has decreased
markedly the last decade (SOU 2001:79)
The real wages increased sharply during the 1990s. The median wage increased with 22
percent 1991-2000. Furthermore the pay gap between women and me
n has decreased slightly, which reflects an increase in the educational level among women.
However, compared to men, the increased level of education among women has not resulted
in an equivalent increase in their wages (SOU 2001:79).
Within the upper layers of the employed, the range of wages has increased. The biggest range
is found within the categories for officials and managers, and the smallest within the category
for occupations where post secondary education is not required. The differences in wages
among these groups are not as big in the public sector (SCB 2002c).
The level of education is affecting wages positively, as seen in figure 23. This is true for
women as well as men, even though men’s generally benefit more from education. The
difference between men and women when it comes to wage is most obvious among those with
higher education, post secondary education, 2 years or more. In the group of people with post
secondary education of two years or more, in year 2001, women earned an average monthly
wage of 22 500 SEK, while men earned an average of 29 700 SEK monthly. Only 7 percent
of women, compared to 26 percent of men, are in those occupations that pay wages above 25
000 SEK monthly (SCB 2002c).
27

Figure 23: Average (Mean) monthly wages of men and women in Sweden year 2001 depending on level of education:
0
5000
10000
15000
20000
25000
30000
35000
40000
Primary and lowersecondary education
Upper secondaryeducation
Post secondaryeducation, less than
2 years
Post secondaryeducation, 2 years
or longer
Postgraduateeducation
Level of education
Aver
age
mon
thly
sal
ary,
SEK
MenWomen
Source: SCB (2002c)
Gender, as well as family situation, seems to be important factors when it comes to income.
As mentioned above, women generally make less than men. Even when all other variables are
taken into account, such as education, age, experience, occupation, and part-time/full-time
status, women make 11 percent less money than men do (LU 2003).
As for the family situation, having a family affects the incomes of women negatively, while it
positively affects incomes for men. To be a mother reduces the income from work by about
2,5 percent, while being a father adds another 3 percent to income, compared to men and
women without children (LU 2003).
Lone fathers generally have incomes more similar to those of married/cohabiting fathers
compared with those of to mothers (figure 24). It is also shown that the difference in income
from work between lone mothers and cohabiting fathers is more than 9 300 Euros (100 000
SEK) annually.
28
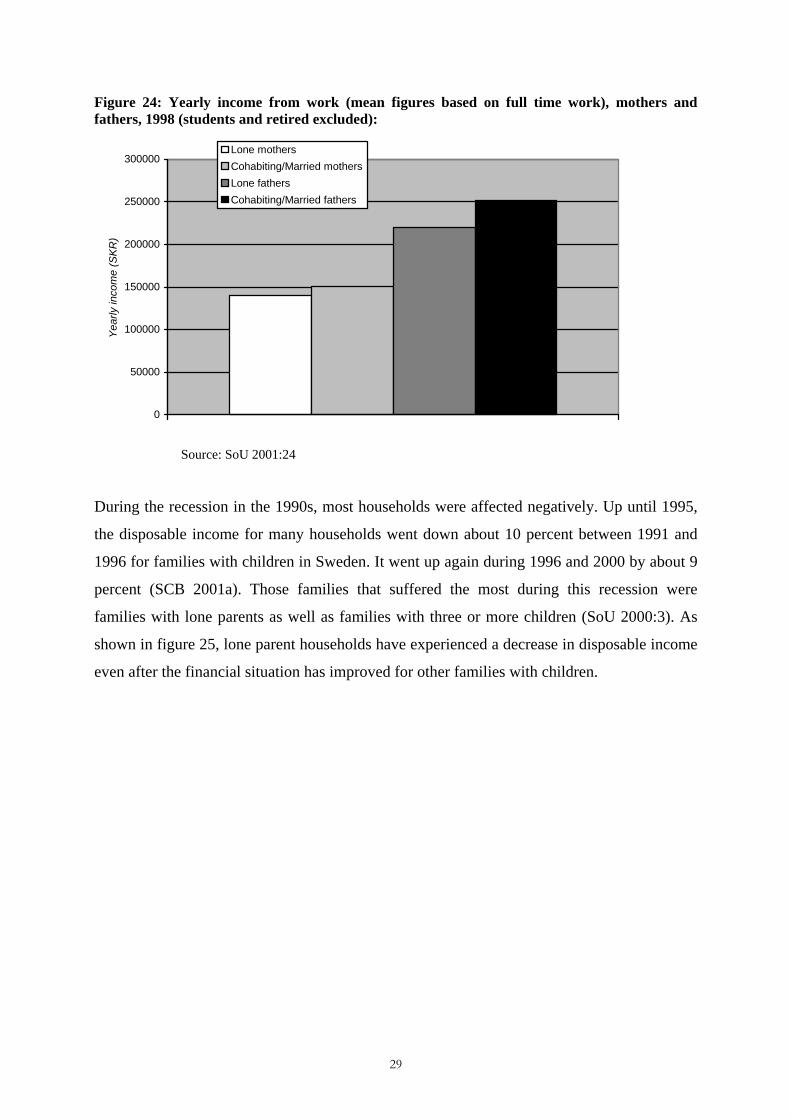
Figure 24: Yearly income from work (mean figures based on full time work), mothers and fathers, 1998 (students and retired excluded):
0
50000
100000
150000
200000
250000
300000
Year
ly in
com
e (S
KR)
Lone mothersCohabiting/Married mothersLone fathersCohabiting/Married fathers
Source: SoU 2001:24
During the recession in the 1990s, most households were affected negatively. Up until 1995,
the disposable income for many households went down about 10 percent between 1991 and
1996 for families with children in Sweden. It went up again during 1996 and 2000 by about 9
percent (SCB 2001a). Those families that suffered the most during this recession were
families with lone parents as well as families with three or more children (SoU 2000:3). As
shown in figure 25, lone parent households have experienced a decrease in disposable income
even after the financial situation has improved for other families with children.
29

Figure 25: Disposable income per consumption unit in different households, median, in SEK thousands, 1989-1998:
80
90
100
110
120
130
140
150
160
1989/1990 1993/1994 1997/1998
Year
SKR
(in
thou
sand
s)
Single without children Cohabiting/Married without childrenLone parents Cohabiting/Married parents
Source: SoU 2000:41
Poverty rates and poverty gap
Sweden has been, and still is, quite unique with its low rates of people living in poverty. Since
the 1990s has shown some inequalities and differences when in comes to living conditions
and standards, especially for lone mothers and immigrants (SoU 2000:3). The number of
children living in families with incomes under the social assistance norm3 increased during
the 1990s, but improved during the later part of the decade. However, lone mothers still had a
5 percent lower income in 1999 than in 1991. In 1996, every eighth child lived in a family
with incomes below the social welfare norm in Sweden, and in lone parent households, it was
every fifth child. In Sweden, 8 percent of all children--but 12 percent of children of lone
parents--could be considered poor in 1999, a relatively low number if compared
internationally (SCB 2001a).
Figure 26 shows that there was a great increase in the number of persons in need of social
assistance during the 1990s. Even though the number has decreased since 1997, there were 3 The social assistance norm is a sum set to cover the most necessary expenses. Presently it is set to about 2500
SEK a month for an adult (less if the household includes more than one adult) and 1300-2000 SEK a month per
child (depending on age). The monthly amount is not including cost of housing, such as rent, which is added
according to the individual cost.
30

more persons on social assistance in 2000 than in the beginning of the 1990s. One explanation
is that unemployment among young people increased during the decade. If one has not yet
been established in the labour market, unemployment benefits are not obtainable, and then
social assistance is the option in case of unemployment. Another explanation is the great
number of refugees coming to Sweden during the early 1990s who, many times, have no other
source of income than social assistance.
Figure 26: Persons on social assistance, 1990-2002:
40000
60000
80000
100000
120000
140000
1990 1991 1992 1993 1994 1995 1996 1997 1998 1999 2000 2001 2002Year
Num
ber o
f who
le y
ear e
quiv
alen
ts
Persons on social assistance
Source: SCB (2001c and 2003h)
Figure 27 shows persons in different family forms who have experienced financial crisis. As
seen, it is more common for a lone parent household to have serious financial difficulties than
two parent households, 32 respectively 8 percent.
31

Figure 27: Experience of financial crisis* in different family forms, 1990-2001, in percentage:
0
10
20
30
40
50
90/91 92/93 94/95 96/97 98/99 2000 2001
Year
Perc
enta
ge
Cohabiting/Married couples with children Cohabiting/Married couples without children
Lone parents Single households without children
* Definition of financial crisis: Have had serious financial difficulties with the basic needs and have had to borrow money from relatives or friends or turn to social assistance in order to cope with food or rent expenses, alternatively have not paid rent. Source: SCB (2003a)
Children in lone parent households in particular have experienced financial difficulties during
the 1990s, as mentioned earlier. Figure 28 shows the number of families with a disposable
income under 50 percent of the median, where lone parent households reached a high peak in
the mid 1990s, but even higher in year 2000. The situation for lone parent households is not
improving, quite the contrary. During the latter part of the 1990s it appeared as if the situation
for lone parent households was improving, but there is a remarkable increase of these
households with low incomes between 1999 and year 2000.
32

Figure 28: Share of households by type of households (with children aged 0-17) with a low equalised disposable income per consumption unit, under 50 percent of median of all households, 1991, 1996-2000:
0
2
4
6
8
10
1991 1996 1997 1998 1999 2000Year
Perc
enta
ge
Lone parents
Married/Cohabiting parents
Source: SCB (2000)
It has been estimated that around half of the lone parent households during the 1990s had
trouble making ends meet on a monthly basis to pay for food, rent, etc., as seen in figure 29
(SCB 2001a).
Figure 29: Children in families having difficulties paying running expenses, year 1990-2000, in percentage:
0
20
40
60
80
100
90/91 92/93 94/95 96/97 98/99 99/00
Year
Perc
enta
ge
Children in nuclear families Children with lone parents
99/00 is estimation. Source: SCB (2001a)
Another way to estimate a difficult financial situation is to investigate which families have a
cash-margin, and which do not. Families are asked if they can come up with the amount of
33
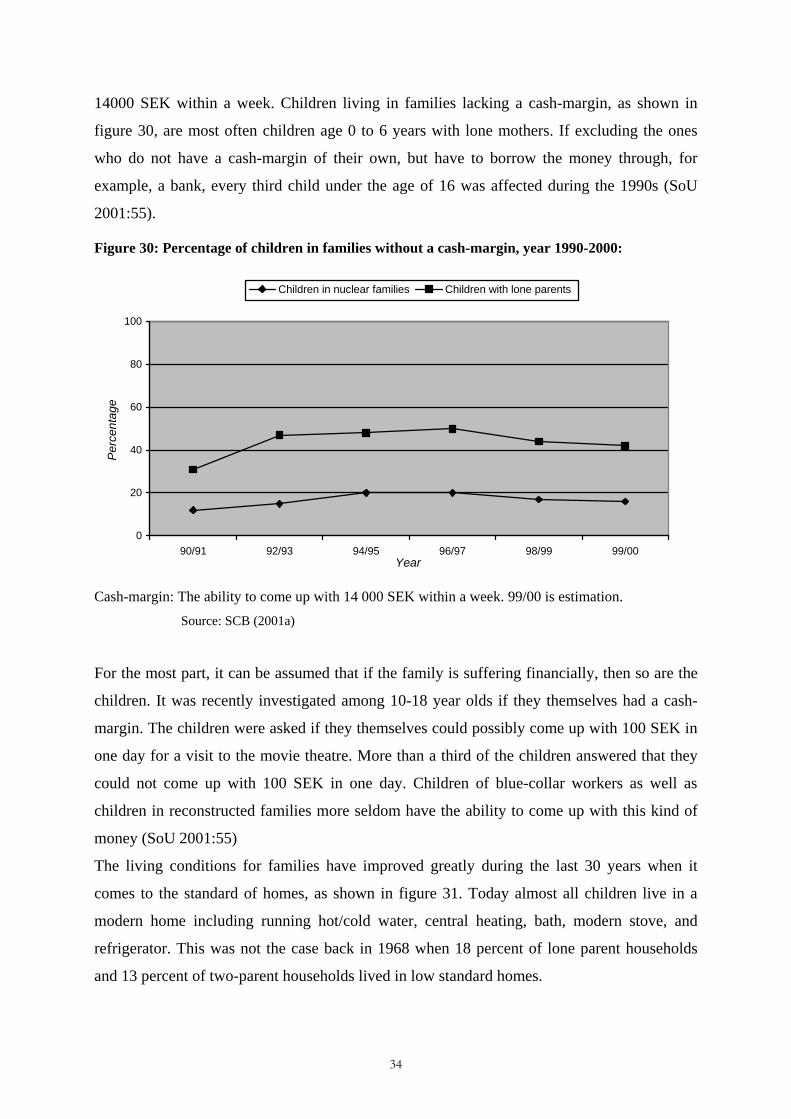
14000 SEK within a week. Children living in families lacking a cash-margin, as shown in
figure 30, are most often children age 0 to 6 years with lone mothers. If excluding the ones
who do not have a cash-margin of their own, but have to borrow the money through, for
example, a bank, every third child under the age of 16 was affected during the 1990s (SoU
2001:55).
Figure 30: Percentage of children in families without a cash-margin, year 1990-2000:
0
20
40
60
80
100
90/91 92/93 94/95 96/97 98/99 99/00Year
Perc
enta
ge
Children in nuclear families Children with lone parents
Cash-margin: The ability to come up with 14 000 SEK within a week. 99/00 is estimation.
Source: SCB (2001a)
For the most part, it can be assumed that if the family is suffering financially, then so are the
children. It was recently investigated among 10-18 year olds if they themselves had a cash-
margin. The children were asked if they themselves could possibly come up with 100 SEK in
one day for a visit to the movie theatre. More than a third of the children answered that they
could not come up with 100 SEK in one day. Children of blue-collar workers as well as
children in reconstructed families more seldom have the ability to come up with this kind of
money (SoU 2001:55)
The living conditions for families have improved greatly during the last 30 years when it
comes to the standard of homes, as shown in figure 31. Today almost all children live in a
modern home including running hot/cold water, central heating, bath, modern stove, and
refrigerator. This was not the case back in 1968 when 18 percent of lone parent households
and 13 percent of two-parent households lived in low standard homes.
34

Figure 31: Share of children 0-16 year old living in low standard home (not including some or all of the following: running hot/cold water, central heating, bath/shower/toilet, modern stove, refrigerator) 1968-2000, in percentage:
0
5
10
15
20
1968 1974 1981 1991 2000year
perc
enta
ge
Two parent familiesLone parent families
Source: SoU 2001:55
Figure 32 shows children of different age groups, living in families with financial difficulties.
It is clear that the older children, between the ages of 13 and 17, live in families that have
improved their financial situation during the later part of the 1990s, while this is not true for
the youngest children.
35
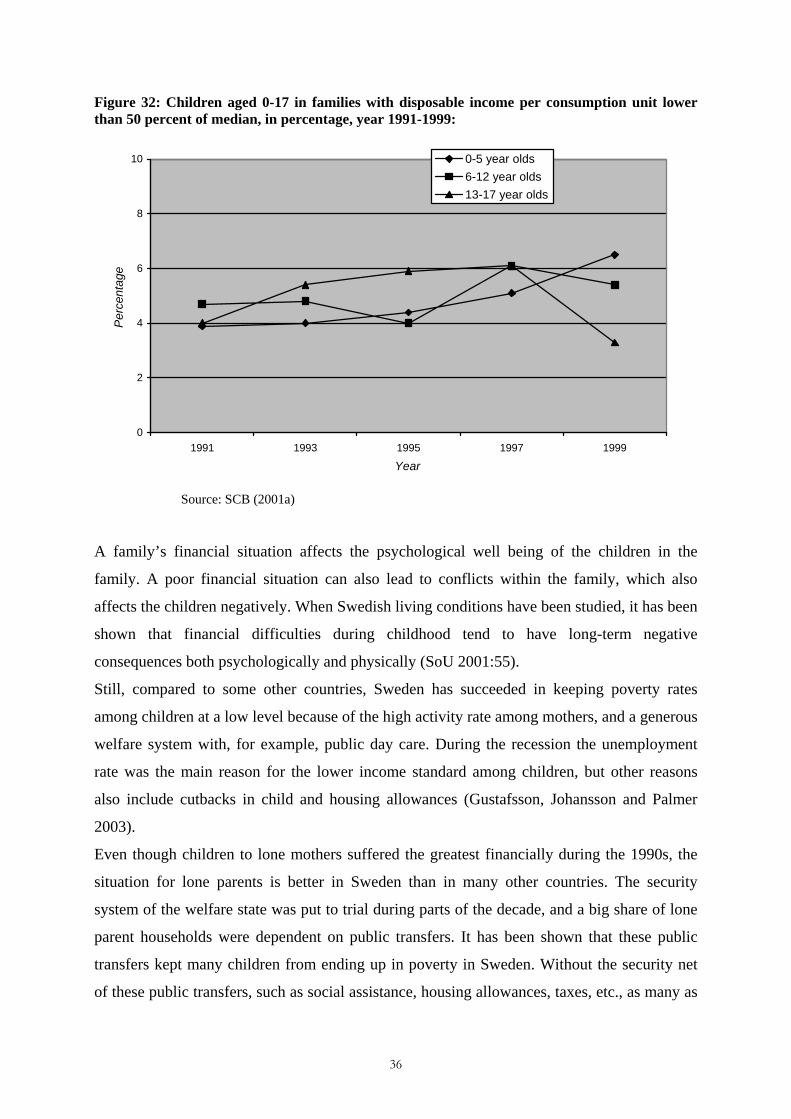
Figure 32: Children aged 0-17 in families with disposable income per consumption unit lower than 50 percent of median, in percentage, year 1991-1999:
0
2
4
6
8
10
1991 1993 1995 1997 1999
Year
Perc
enta
ge
0-5 year olds6-12 year olds13-17 year olds
Source: SCB (2001a)
A family’s financial situation affects the psychological well being of the children in the
family. A poor financial situation can also lead to conflicts within the family, which also
affects the children negatively. When Swedish living conditions have been studied, it has been
shown that financial difficulties during childhood tend to have long-term negative
consequences both psychologically and physically (SoU 2001:55).
Still, compared to some other countries, Sweden has succeeded in keeping poverty rates
among children at a low level because of the high activity rate among mothers, and a generous
welfare system with, for example, public day care. During the recession the unemployment
rate was the main reason for the lower income standard among children, but other reasons
also include cutbacks in child and housing allowances (Gustafsson, Johansson and Palmer
2003).
Even though children to lone mothers suffered the greatest financially during the 1990s, the
situation for lone parents is better in Sweden than in many other countries. The security
system of the welfare state was put to trial during parts of the decade, and a big share of lone
parent households were dependent on public transfers. It has been shown that these public
transfers kept many children from ending up in poverty in Sweden. Without the security net
of these public transfers, such as social assistance, housing allowances, taxes, etc., as many as
36

21 percent of children would have ended up living below the poverty line in 1993. This shows
that an increasing marginalisation among children could be avoided. (Gustafsson, Johansson
and Palmer 2003).
Skills and education
Thirty years ago, about six out of ten adults in Sweden only had primary and lower secondary
education. In 2002 the share was down to two out of ten (figure 33).
Figure 33: Persons with primary and secondary education at the most year 1968 compared to year 2002, in percentage:
0
20
40
60
80
100
1968 2002Year
Perc
enta
ge
Only primary and secondaryeducation at the most
Source: SCB (2003b)
While only 25 percent of adults had upper secondary education 30 years ago, the number was
up to 50 percent in 2002, and the amount of people with post-secondary education has
increased from 10 to 30 percent (figure 34). This clearly shows that the level of education has
increased in society. Nearly all students continue on to upper secondary education today, but
not all of them complete their education. Some choose to do so later through adult education
programs (SCB 2003b).
37

Figure 34: People with upper secondary education and post secondary education in year 1968 compared to year 2002, in percentage:
0
20
40
60
80
100
1968 2002Year
Perc
enta
ge
Upper seconday educationPost secondary education
Source: SCB (2003b)
Women generally have a higher level of education than men in all age groups today, and the
differences are bigger among the young. For example, among women aged 25-29 years old,
40 percent have a post-secondary education, compared with 33 percent of men in the same
age group. The number of women with post-secondary education is expected to increase also
in the future (SCB 2003b).
During the mid 1990s, the share of women accepted to university studies for the first time was
55 percent. Women also tend to get better results and have a bigger frequency of obtaining a
degree. In spite of this, there are more men accepted to postgraduate education programs. Out
of those who were accepted to postgraduate programs in the mid 1990s, 10 percent were men
and 3 percent were women (Muhonen 1999).
With the unemployment rates increasing greatly during the 1990s, the number of students
increased with it. Especially young unemployed men and women seemed to regard education
as an alternative to unemployment. Compared with the later part of the 1980s, the number of
20-25 year old students doubled during the 1990s. The number of persons attending the
university increased by 55 percent between 1990 and 1997(SoU 2000:3).
Figure 35 shows the different levels of education among parents. Both parents of every fifth
child in nuclear families have post-secondary education. When the parents have different
levels of education, it is slightly more common that the mother has the highest level. The level
38

of education is relatively lower among lone mothers. Among children living with a lone
mother, 75 percent of these mothers have upper secondary education at the most (2003e).
Figure 35: Level of education, mothers and fathers with children living at home, 1999, in percentage.
0
20
40
60
80
100
Primary and lowersecondary education
Shorter uppersecondary education
Longer uppersecondary education
Post-secondaryeducation
Unknown
Education
Perc
enta
ge
Lone mothers Lone fathers Cohabiting/Married mothers Cohabiting/Married fathers
Source: SoU 2001:24
Age when entering the labour market
What is clearly visible in the development during the last decade is that labour market activity
among both men and women is concentrated between the ages of 25 and 55. Young men and
women remain in education longer, and a large number take more time to establish
themselves in the labour market.
Women nowadays wait longer before they have children because they want to have a
relatively stable position on the labour market before having children. It generally takes
longer for women to get established4 in the labour market than it does for men. The
establishing age for men has remained at 26 since 1994, but has varied for women during the
decade. The establishing age for women was as high as 31 in 1997, but decreased to 29 in
2000 (Ds 2001:57).
4 In the labour force surveys they differentiate between age of entrance (the age at which 50 percent of a cohort is employed) and age of being established (the age at which 75 percent of a cohort is employed)
39
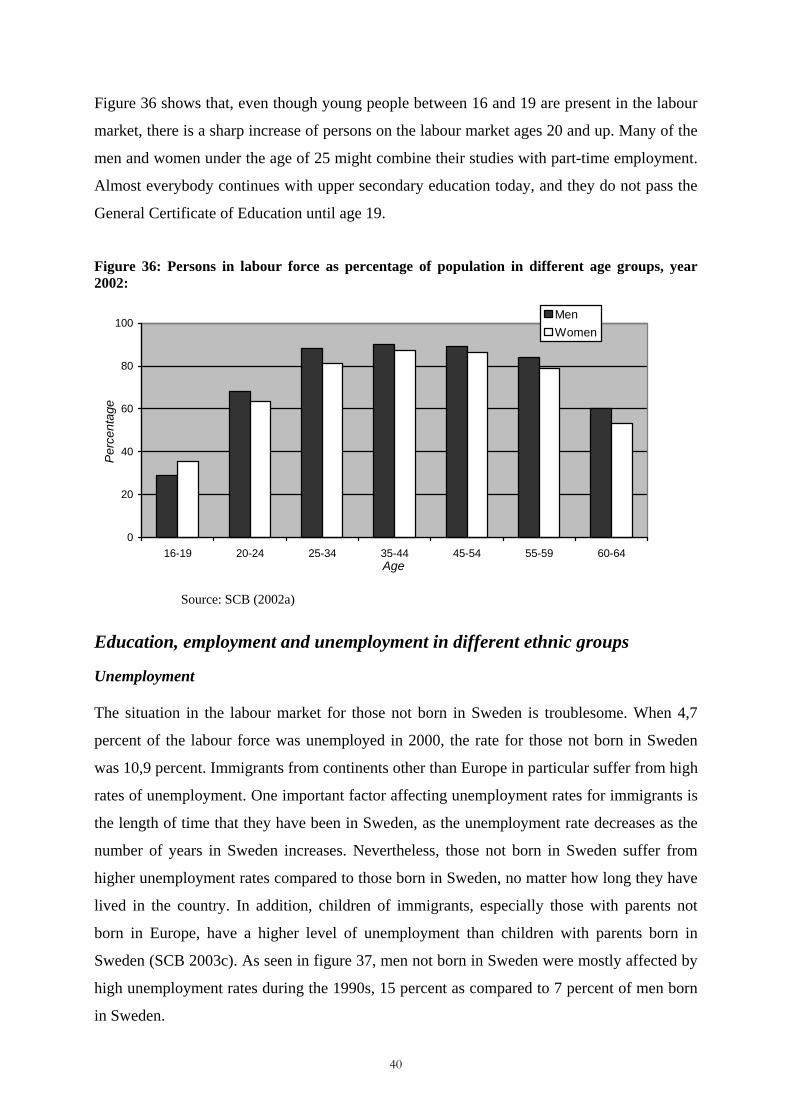
Figure 36 shows that, even though young people between 16 and 19 are present in the labour
market, there is a sharp increase of persons on the labour market ages 20 and up. Many of the
men and women under the age of 25 might combine their studies with part-time employment.
Almost everybody continues with upper secondary education today, and they do not pass the
General Certificate of Education until age 19.
Figure 36: Persons in labour force as percentage of population in different age groups, year 2002:
0
20
40
60
80
100
16-19 20-24 25-34 35-44 45-54 55-59 60-64Age
Perc
enta
ge
MenWomen
Source: SCB (2002a)
Education, employment and unemployment in different ethnic groups
Unemployment The situation in the labour market for those not born in Sweden is troublesome. When 4,7
percent of the labour force was unemployed in 2000, the rate for those not born in Sweden
was 10,9 percent. Immigrants from continents other than Europe in particular suffer from high
rates of unemployment. One important factor affecting unemployment rates for immigrants is
the length of time that they have been in Sweden, as the unemployment rate decreases as the
number of years in Sweden increases. Nevertheless, those not born in Sweden suffer from
higher unemployment rates compared to those born in Sweden, no matter how long they have
lived in the country. In addition, children of immigrants, especially those with parents not
born in Europe, have a higher level of unemployment than children with parents born in
Sweden (SCB 2003c). As seen in figure 37, men not born in Sweden were mostly affected by
high unemployment rates during the 1990s, 15 percent as compared to 7 percent of men born
in Sweden.
40

Figure 37: Unemployed women and men not born in Sweden compared to unemployed women and men born in Sweden, in percentage, 1990-2000:
0
5
10
15
20
1990/1991 1992/1993 1994/1995 1996/1997 1998/1999 2000Year
Perc
enta
ge
Women not born in Sweden Men not born in SwedenWomen born in Sweden Men born in Sweden
Source: SCB (2003a)
As discussed in the section regarding unemployment earlier, Sweden has a hidden
unemployment rate, as those entered in different unemployment programs are not included in
the general statistics. If comparing figures 37 and 38, there is a great difference between how
many are actually unemployed according to the general unemployment statistics and how
many are looking for work. For example, 4 percent of women not born in Sweden were
unemployed in 2000, but 12 percent were looking for work.
41

Figure 38: Men and women not born in Sweden compared to those born in Sweden looking for work, 1990-2000, in percentage:
0
5
10
15
20
1990/1991 1992/1993 1994/1995 1996/1997 1998/1999 2000Year
Perc
enta
ge
Women not born in Sweden Men not born in SwedenWomen born in Sweden Men born in Sweden
Source: SCB (2003a)
More persons not born in Sweden experience unemployment than those born in Sweden, as
seen in figure 39. This is a number that has increased during the 1990s, and even more so later
in the decade.
Figure 39: Experience of unemployment among working population born in Sweden and not born in Sweden, during the last five years, in percentage. 1990-2000:
0
10
20
30
40
50
1990/1991 !992/1993 1994/1995 1996/1997 1998/1999 2000
Year
Perc
enta
ge
Not born in SwedenBorn in Sweden to Swedish parentsBorn in Sweden to parents not born in Sweden
Source: SCB (2003a)
42

Many immigrants came to Sweden during the 1960s, due to a labour shortage. The labour
market had a different structure and organization during the 1960s. At that time, there was a
higher demand for unqualified workers, for example, in the industrial sector, where
background, education, and language skills were not essential. Since then, the labour market
has changed. Today many positions demand skills and education, the ability to communicate,
and culture-specific knowledge about Swedish society. Because of this trend, it has become
harder for new immigrants to establish themselves in the labour market, and many who were
already established have had difficulty maintaining their employment (SCB 2003c).
Employment The working conditions for those not born in Sweden when they do have employment are
often less flexible, especially for women. In addition, as seen in figure 40, men and women
not born in Sweden are more often employed on a temporary basis. Among women not born
in Sweden who are employed, almost 32 percent are employed on a temporary basis. During
the 1990s, for those born outside of Sweden, the likelihood of having temporary employment
was twice as high compared with those born in Sweden (SoU 2000:3).
Figure 40: Temporary employed men and women not born in Sweden compared to men and women born in Sweden, out of all employed, in percentage, 1990-2000:
0
5
10
15
20
25
30
35
40
1990/1991 1992/1993 1994/1995 1996/1997 1998/1999 2000
Year
Perc
enta
ge
Men born in SwedenMen not born in SwedenWomen born in SwedenWomen not born in Sweden
Source: SCB (2003a)
43

Education Many of the immigrants who come to Sweden are highly educated. Among those not born in
Sweden, 28 percent have a post-secondary education, compared with 31 percent of those born
in Sweden. Still, there are a higher number of people not born in Sweden with less than what
is equivalent to the Swedish compulsory education (SCB 2003c).
Financial situation The number of people requiring social assistance has increased greatly in Sweden during the
1990s, to an extent that has never been experienced in Sweden in modern times. More than
any other group, those in need of social assistance have been those not born in Sweden,
because of their high unemployment rates. Another factor that can explain the increased need
for social assistance among those not born in Sweden is the high number of refugees coming
to Sweden in the first part of the 1990s (SoU 2000:3).
Figure 41 shows that the number of households with a disposable income of less than 50
percent of the median is higher among those not born in Sweden, and this so even at the end
of the decade and beginning of 2000. Almost 12 percent of households with persons not born
in Sweden had a disposable income of less than 50 percent of the median in 2000, compared
with approximately 4 percent of those born in Sweden.
Figure 41: Households with persons not born in Sweden as compared with persons born in Sweden, with a disposable income less than 50 percent of median disposable income, 1996-2000, in percentage:
0
5
10
15
1996 1997 1998 1999 2000Year
Perc
enta
ge
Not born in SwedenBorn in Sweden
Source: SCB (2002e)
44

In addition, immigrants seem to lack a cash-margin more frequently than others, as shown in
figure 42. The number of persons not born in Sweden without a cash-margin increased during
the first part of the decade, and has remained around 35 percent since then.
Figure 42: Persons not born in Sweden compared to those born in Sweden without a cash-margin, 1990-2000, in percentage:
0
5
10
15
20
25
30
35
40
1990/1991 1992/1993 1994/1995 1996/1997 1998/1999 2000Year
Perc
enta
ge
Not born in SwedenBorn in Sweden to Swedish parentsBorn in Sweden to parents not born in Sweden
Cash-margin: To be able to come up with 14 000 SEK within a week
Source: SCB (2003a)
In the first few years after immigration to Sweden, many families are largely dependent on
social assistance. Immigrant families suffered from the cutbacks during the 1990s when the
regulations and practice regarding social assistance were changed, as the amount was lowered
and more strictly limited (SCB 2001a).
Figure 43 shows that families with both parents not born in Sweden have about 28 percent
less disposable income than families with both parents born in Sweden.
45

Figure 43: Children (0-21 years of age) in families, cohabiting parents, the income standard of families, disposable income per consumption unit, 1999
0
20000
40000
60000
80000
100000
120000
Inco
me
(SKR
)
Both parents born in SwedenOne parent not born in SwedenBoth parents not born in Sweden
Source: SCB (2002d)
Parental leave Earlier studies have shown that fathers not born in Sweden are less likely to use the parental
leave allowance. When both parents are born outside Sweden, the father is less likely to be on
parental leave, and in those families where fathers take leave, they take a smaller share and
fewer days than men born in Sweden. In families where only the mother is born outside
Sweden, however, the fathers take more leave than average, where the opposite is the case if
only the father is born outside Sweden (RFV 2002).
Gender equality policies relevant for the labour market
A motive behind Sweden's expansion of family policies in the 1970s was to enhance equality
between men and women. The government aimed to improve the position of women, bringing
it into line with that of men. Women were supposed to acquire greater autonomy by being
gainfully employed, and men were encouraged to take a greater share in domestic chores and
child care (Björnberg 2002).
Two laws protect parents from being at a disadvantage or discriminated against in the
workplace or while seeking employment: the Parental Leave Act and the Equal Opportunities
Act. The Parental Leave Act protects employed men and women from being fired for
exercising their rights to parental leave. It also protects employed mothers and fathers from
disadvantages or changes in work conditions as well as wage, because of their parenthood
46

status. The Equal Opportunities Act pertains to discrimination and disadvantages because of
gender, not only in cases regarding parenting and employment. There has been a significant
increase in reports to the Equal Opportunities Ombudsman regarding cases where men and
women have been discriminated against in the workplace or as respects their terms of
employment, because of pregnancy and parenthood. Still, it is believed that many do not file a
report even if they have a case, as they fear it will make the situation worse. (JämOv 2001).
Cases reported to the Equal Opportunities Ombudsman during the period between March
2000 and September 2001, regarding discrimination due to parenthood and employment is
shown in figure 44. Almost 42 percent of the cases reported are related to termination of
employment.
Figure 44: Reported cases to the Equal Opportunities Ombudsman March 2000 – September 2001, division of cases in percentage:
0
10
20
30
40
50
60
70
80
90
100
Fired or laid off Problem combiningparenting andemployment
Relocation inconnection withparental leave
Disadvantages inpay raises, workconditions, etc. inconnection withparental leave
Discriminationbecause of childrenor pregnancy when
seekingemployment
Perc
enta
ge
Source: JämO (2001)
When women are discriminated against because of pregnancy it is most likely not the
pregnancy in itself that is viewed as an obstacle. A pregnancy in itself does not usually lead to
a longer absence, as most women work up until delivery. Instead it is the likelihood that the
mother will take parental leave that is viewed as an obstacle, and the fact that it is expected
47
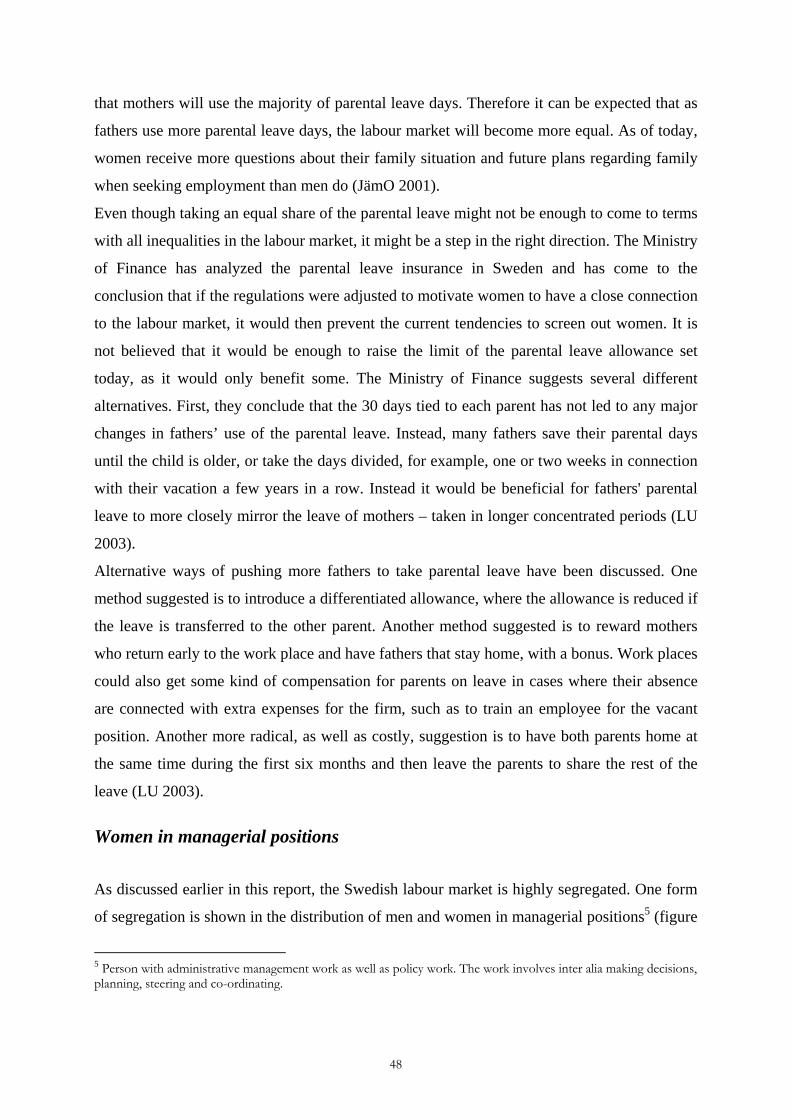
that mothers will use the majority of parental leave days. Therefore it can be expected that as
fathers use more parental leave days, the labour market will become more equal. As of today,
women receive more questions about their family situation and future plans regarding family
when seeking employment than men do (JämO 2001).
Even though taking an equal share of the parental leave might not be enough to come to terms
with all inequalities in the labour market, it might be a step in the right direction. The Ministry
of Finance has analyzed the parental leave insurance in Sweden and has come to the
conclusion that if the regulations were adjusted to motivate women to have a close connection
to the labour market, it would then prevent the current tendencies to screen out women. It is
not believed that it would be enough to raise the limit of the parental leave allowance set
today, as it would only benefit some. The Ministry of Finance suggests several different
alternatives. First, they conclude that the 30 days tied to each parent has not led to any major
changes in fathers’ use of the parental leave. Instead, many fathers save their parental days
until the child is older, or take the days divided, for example, one or two weeks in connection
with their vacation a few years in a row. Instead it would be beneficial for fathers' parental
leave to more closely mirror the leave of mothers – taken in longer concentrated periods (LU
2003).
Alternative ways of pushing more fathers to take parental leave have been discussed. One
method suggested is to introduce a differentiated allowance, where the allowance is reduced if
the leave is transferred to the other parent. Another method suggested is to reward mothers
who return early to the work place and have fathers that stay home, with a bonus. Work places
could also get some kind of compensation for parents on leave in cases where their absence
are connected with extra expenses for the firm, such as to train an employee for the vacant
position. Another more radical, as well as costly, suggestion is to have both parents home at
the same time during the first six months and then leave the parents to share the rest of the
leave (LU 2003).
Women in managerial positions
As discussed earlier in this report, the Swedish labour market is highly segregated. One form
of segregation is shown in the distribution of men and women in managerial positions5 (figure
5 Person with administrative management work as well as policy work. The work involves inter alia making decisions, planning, steering and co-ordinating.
48
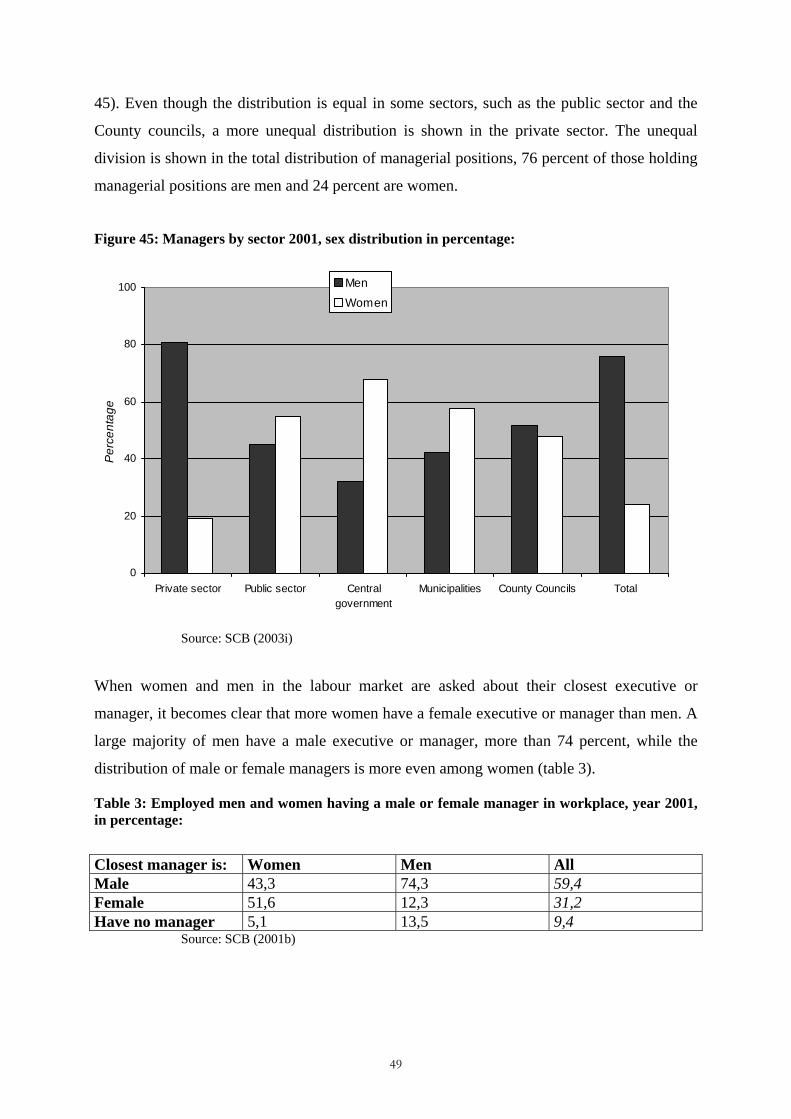
45). Even though the distribution is equal in some sectors, such as the public sector and the
County councils, a more unequal distribution is shown in the private sector. The unequal
division is shown in the total distribution of managerial positions, 76 percent of those holding
managerial positions are men and 24 percent are women.
Figure 45: Managers by sector 2001, sex distribution in percentage:
0
20
40
60
80
100
Private sector Public sector Centralgovernment
Municipalities County Councils Total
Perc
enta
ge
Men
Women
Source: SCB (2003i)
When women and men in the labour market are asked about their closest executive or
manager, it becomes clear that more women have a female executive or manager than men. A
large majority of men have a male executive or manager, more than 74 percent, while the
distribution of male or female managers is more even among women (table 3).
Table 3: Employed men and women having a male or female manager in workplace, year 2001, in percentage:
Closest manager is: Women Men All Male 43,3 74,3 59,4 Female 51,6 12,3 31,2 Have no manager 5,1 13,5 9,4
Source: SCB (2001b)
49

Job satisfaction and health Work-related stress has increased during the 1990s, and more so for women than men. There
are more women working in fields where high stress has been reported, such as health care,
schools, and social work (SoU 2000:3). All in all 70 percent of the working population in
1997/98 indicate that they have a stressful work situation - 30 percent more women than men.
What has been labelled as high stress work (a combination of high demands and low degree
of control (Karasek 1997) has increased during the 1990s. In particular women in caring
professions in health care, child care and teachers have experienced a large increase in high
stress work. Among these women the prevalence of sleeping disorders, psychological
disorders and anxiety are very high (SOU 2000:3).
Men tend to consider their work more free and unrestricted than women in all age groups.
This is also shown in figures about how much these women and men feel they can influence
working hours. Almost 34 percent of men state that they generally cannot influence working
hours, while almost 42 percent of women feel the same way. Still, when asked about their job
satisfaction in general, 73 percent of both men and women felt very satisfied (SCB 2003d).
One study including parents of 10-18 year olds show that mothers are exhausted, both
mentally as well as physically, to a larger extent than fathers when returning home from a
workday (figure 46). Thirteen percent of mothers stated that they often or always felt
physically exhausted when returning home from work, and 17 percent often or always felt
mentally exhausted. Eight percent of fathers stated that they felt physically exhausted when
returning home from work, and 8 percent felt mentally exhausted, even though fathers
generally have a longer working week. Lone mothers generally feel exhausted, physically and
mentally, more often than other parents (SoU 2001:55).
50

Figure 46: Mothers of 10-18 year olds (living at home) feeling mentally exhausted/physically exhausted when returning home from work (working at least 10 hours a week) in percentage:
0
5
10
15
20
25
30
In two parent households In lone parent households
Perc
enta
ge
Mentally exhaustedPhysically exhausted
Source: SoU 2001:55
Conclusion
Sweden went through a recession during the first part of the 1990s, which led to high rates of
unemployment, lower activity rates, and difficult financial times for some specific groups in
society. Even though the situation improved during the later part of the decade, the
unemployment rates have not yet managed to reach the same low levels as in the beginning of
the 1990s.
The high unemployment rates affected the young in particular, and there was a sharp decrease
in activity rates among those aged 16-25. Many of these young men and women continued
with education, perhaps as an alternative to unemployment. During the 1990s, there was an
increase of more than 50 percent, compared to the 1980s, in the number of students accepted
to the university.
Parents were also affected by the recession. Lone parents, especially younger ones with low
educational level, and parents not born in Sweden suffered from high unemployment rates
during the 1990s, and with it a decrease in disposable incomes.
Looking at the period as a whole, fathers are more secure in the labour market than men in
general, while it is the opposite for mothers. Women and mothers have more often temporary
jobs and involuntary part time jobs. The incomes of men are also higher than those of women,
even though more women work full-time today. Even mothers with young children tend to
51
work full-time more today than in the beginning of the 1990s. Many workplaces seem to have
become more "parent friendly" over the years, offering increased opportunities for flexibility
at work. However, men tend to benefit from different aspects of flexibility more often than
women, and cohabiting/married parents more often than lone parents, even though lone
parents would need flexible working conditions as well.
After legislative changes were made to increase the amount of parental leave days tied to each
parent, more fathers began taking parental leave. Today more men take some leave, but there
is a decrease in the number of men taking longer leave. Women still use the majority of
parental leave.
By the end of the 1990s the government initiated an investigation of the development in living
conditions and welfare of the population as well as the within the social services. The aim was
to make an account over the decade in order to evaluate the political measures that had been
undertaken during the decade and also to obtain an overview of the labour market changes
and their impacts on work opportunities of different categories of the labour force. Some of
the reports have been referred to in this report. Regarding changes of work, it is clear that
stress problems have increased in most occupations, but mainly within occupations within the
public sector, such as care and education. The qualification of the work force has been raised
but there are no certain indications regarding if work has become more qualified. Another
major conclusion from the reports is that class inequalities have remained stable and they
display inequalities in welfare in many respects. The recession during the 1990s led to
financial difficulties, especially for lone parents, parents not born in Sweden and the young
generation. More people were in need of social assistance during the mid 1990s, and about
half of all lone parent households had problems making ends meet on a monthly basis. Even
though the situation has improved in Sweden after 1997, the mentioned categories are still
suffering from insecure work conditions, problematic financial situations, and higher
unemployment rates.
52

Figures
Figure 1: Activity rate – share of men and women 16-64 with employment, in percentage, 1990-2001:............... 3 Figure 2: Activity rates – share of population with employment, different age groups, in percentage, 1990-2001 4Figure 3: Number of (in hundreds) employed women and men in public and private sector, 1990-2001: ............. 5 Figure 4: Average hours working per week, men and women with children under age 7 compared to all working
men and women, year 2002:.......................................................................................................................... 6 Figure 5: Children in families, occupation (etc.) of mothers and fathers, in percentage, year 2000: ...................... 7 Figure 6: Part time employed mothers (less than 30 hours/week), 1990-2001, in percentage: ............................... 8 Figure 7: All year, full time (more than 35 hours/week) employed mothers, 1990-2001, in percentage:............... 9 Figure 8: Persons working less than they would want to out of labour market reasons (out of 1000):................. 11 Figure 9: Share of unemployed men and women (aged 16-64) out of labour force, year 1990-2001, percentage:12Figure 10: Unemployed parents, in percentage, 1990-2000:................................................................................. 13 Figure 11: Parents looking for work, 1990-2000, in percentage:.......................................................................... 13 Figure 12: Persons in unemployment programs, 1990-2000:................................................................................ 14 Figure 13: Experience of unemployment among working parents in last five years, in percentage, 1990-2000:. 14Figure 14: Parents with temporary employment out of all employed, 1990-2000, in percentage:........................ 16 Figure 15: Mothers and fathers of 10-18 year old children (living at home), with flexible working hours,
‘flextime’, in year 2000, out of those who work at least 10 hours a week, in percentage: .......................... 17 Figure 16: Reimbursed days of parental leave year 1990-2003, in percentage:.................................................... 20 Figure 17: Fathers to children born in 1993 and 1996 on parental leave, number of days taken, percentage:...... 21 Figure 18: Fathers to children born in 1993 and 1996 taking no parental leave, educational level, in percentage:
..................................................................................................................................................................... 23Figure 19: Reimbursed parental leave days taken by fathers throughout the year in percentage, out of all days
taken in 2000, 2001 and 2002...................................................................................................................... 24 Figure 20: Reimbursed days with temporary parental leave, leave to care for sick children 1990-2003, in
percentage:................................................................................................................................................... 25 Figure 21: Share of population aged 20-64 with income from work, 1990-2000, in percentage:......................... 26 Figure 22: Income from work, for all individuals age 20-64, 1990-2000, mean-value in SEK thousands: .......... 26 Figure 23: Average (Mean) monthly wages of men and women in Sweden year 2001 depending on level of
education: .................................................................................................................................................... 28 Figure 24: Yearly income from work (mean figures based on full time work), mothers and fathers, 1998
(students and retired excluded):................................................................................................................... 29 Figure 25: Disposable income per consumption unit in different households, median, in SEK thousands, 1989-
1998:............................................................................................................................................................ 30 Figure 26: Persons on social assistance, 1990-2002: ............................................................................................ 31 Figure 27: Experience of financial crisis* in different family forms, 1990-2001, in percentage: ............ 32 Figure 28: Share of households by type of households (with children aged 0-17) with a low equalised disposable
income per consumption unit, under 50 percent of median of all households, 1991, 1996-2000:............... 33 Figure 29: Children in families having difficulties paying running expenses, year 1990-2000, in percentage: ... 33Figure 30: Percentage of children in families without a cash-margin, year 1990-2000:....................................... 34 Figure 31: Share of children 0-16 year old living in low standard home (not including some or all of the
following: running hot/cold water, central heating, bath/shower/toilet, modern stove, refrigerator) 1968-2000, in percentage:..................................................................................................................................... 35
Figure 32: Children aged 0-17 in families with disposable income per consumption unit lower than 50 percent of median, in percentage, year 1991-1999:...................................................................................................... 36
Figure 33: Persons with primary and secondary education at the most year 1968 compared to year 2002, in percentage:................................................................................................................................................... 37
Figure 34: People with upper secondary education and post secondary education in year 1968 compared to year 2002, in percentage:..................................................................................................................................... 38
Figure 35: Level of education, mothers and fathers with children living at home, 1999, in percentage............... 39 Figure 36: Persons in labour force as percentage of population in different age groups, year 2002:.................... 40 Figure 37: Unemployed women and men not born in Sweden compared to unemployed women and men born in
Sweden, in percentage, 1990-2000:............................................................................................................. 41 Figure 38: Men and women not born in Sweden compared to those born in Sweden looking for work, 1990-
2000, in percentage:..................................................................................................................................... 42 Figure 39: Experience of unemployment among working population born in Sweden and not born in Sweden,
during the last five years, in percentage. 1990-2000: .................................................................................. 42
53

Figure 40: Temporary employed men and women not born in Sweden compared to men and women born in Sweden, out of all employed, in percentage, 1990-2000:............................................................................ 43
Figure 41: Households with persons not born in Sweden as compared with persons born in Sweden, with a disposable income less than 50 percent of median disposable income, 1996-2000, in percentage: ............ 44
Figure 42: Persons not born in Sweden compared to those born in Sweden without a cash-margin, 1990-2000, in percentage:................................................................................................................................................... 45
Figure 43: Children (0-21 years of age) in families, cohabiting parents, the income standard of families, disposable income per consumption unit, 1999........................................................................................... 46
Figure 44: Reported cases to the Equal Opportunities Ombudsman March 2000 – September 2001, division of cases in percentage: ..................................................................................................................................... 47
Figure 45: Managers by sector 2001, sex distribution in percentage: ................................................................... 49 Figure 46: Mothers of 10-18 year olds (living at home) feeling mentally exhausted/physically exhausted when
returning home from work (working at least 10 hours a week) in percentage: ........................................... 51
Tables Table 1: Parents with employment depending on level of education and how many of these are working full time,
1999, in percentage:..................................................................................................................................... 10 Table 2: Families yearly loss of income depending on individual incomes and share of parental leave, in SEK: 22Table 3: Employed men and women having a male or female manager in workplace, year 2001, in percentage: 49
References Björnberg, U. (2002) Ideology and Choice Between Work and Care: Swedish Family Policy for Working Parents Critical Social Policy Vol 22 (1) 2002 Sage Publications, London Björnberg, U. (1998) Families and the Division of Labour Ds 2001:57 Barnafödandet i fokus – från befolkningspolitik till ett barnvänligt samhälle Fritzes offentliga publikationer, Stockholm 2001 Gustafsson, B.; “Barnens inkomststandard under 90-talets djupa recession och den följande
återhämtningen” i Johansson, M.; Socialvetenskaplig Tidskrift no 1 2003 (årg.10) . Palmer, E (2003) JämO Problem i Arbetslivet i Samband med Graviditet och Föräldraskap JämO, Stockholm, November 2001 Karasek, R (1979) ”Job demands. Job decision Latitude and mental Strain: Implications for Job
Redesign”, Administrative Science Quarterly, 24, 285-308 LU (2003) Långtidsutredningen Bilaga 12
Finansdepartementet 2003 Muhonen, T. (1999) Kvinnor, karriär och familj: en studie om chefer i fyra olika branscher Avhandling i Psykologi Lunds Universitet 1999 RFV (2003) Statistik www.rfv.se (Feb. 25 2003) RFV (2002) Spelade pappamånaden någon roll? – pappornas uttag av föräldrapenning RFV Analyserar 2002:14
54

Riksförsäkringsverket, Stockholm RFV (2000) Båda blir bäst RFV Redovisar 2000:1 Riksförsäkringsverket, Stockholm RFV (1996) Pappaledighet från norr till söder RFV Redovisar 1996:5 Riksförsäkringsverket, Stockholm RFV (1994) Från moderskap till föräldraskap RFV Redovisar 1994:1 Riksförsäkringsverket, Stockholm RFV (1993) Vilka pappor kom hem? Statistisk rapport Is-R 1993:3 Riksförsäkringsverket, Stockholm SCB (2003a) Undersökningarna av levnadsförhållanden (ULF) www.scb.se/statistik (March 12, 2003) SCB (2003b) ABC… Befolkningens utbildning Trender och Prognoser 2002 www.scb.se (March 25 2003) SCB (2003c) De utrikes födda på arbetsmarknaden Trender och Prognoser 2002 www.scb.se (March 25 2003) SCB (2003d) www.scb.se/statistik/am0501/am0501tab1.asp
www.scb.se/statistik/am0501/am0501tab3.aspwww.scb.se/statistik/am0501/am0501tab7.asp(February 7, 2003)
SCB (2003e) Barn och deras familjer 2001 Demografiska rapporter 2003:1 SCB (2003f) Sysselsättning och arbetslöshet 1975-2001,
www.scb.se/statistik (March 25 2003)
SCB (2003g) Tid för vardagsliv 1990 och 2000 SCB (2003h) ”Beräkningar av antalet personer som försörjs med sociala ersättningar och
bidrag” Pressinformation SCB Nr 2003:224 www.scb.se (August 27, 2003) SCB (2003i) Women and Men in Sweden – Facts and Figures 2002 SCB 2003 SCB (2002a) Labour force surveys 2001 SCB (2002b) AKU sammanställning 1975-2001 SCB (2002c) Lönestatistik årsbok 2001
55

SCB (2002d) Barn och deras familjer 2000 Demografisk rapport 2002:2 SCB 2002 SCB (2002e) Income distribution survey 2002 SCB 2002 SCB (2001a) Barnens del av kakan – Välstånd och fattigdom bland barn 1991-1999 Demografiska rapporter 2002:1 SCB 2001 SCB (2001b) Arbetsmiljöundersökningen www.scb.se/statistik (March 12, 2003) SCB (2001c) Pressmeddelande nr 2001:240, 2001-09-07 www.scb.se (March 12, 2003) SCB (2000) Income distribution survey 2000 SCB 2000 Socialstyrelsen (2002) Folkhälsa och sociala förhållanden SoU 2000:3 Välfärd vid Vägskäl (utvecklingen under 1990 talet) Delbetänkande Kommittén Välfärdsbokslut Fritzes offentliga publikationer, Stockholm 2000 SoU 2000:41 Välfärd, ofärd och ojämlikhet – levnadsförhållanden under 1990 talet Rapport Kommittén Välfärdsbokslut Fritzes offentliga publikationer, Stockholm, 2000 SoU 2001:24 Ur fattigdomsfällan Familjeutredningens slutbetänkande Fritzes offentliga publikationer, Stockholm, 2001 SoU 2001:55 Barn och ungdomars välfärd Delbetänkande Kommittén Välfärdsbokslut Fritzes offentliga publikationer, Stockholm, 2001
i SCB stands for Statistics Sweden ii LU stands for the investigation regarding long term projection iii RFV stands for National Social Insurance Board iv FK stands for Social Insurance Office v JämO stands fro Equal opportunities Ombudsman
56