Electronic Circular Dichroism of Transition Metal Complexes within TDDFT
Upload
truongngocCategory
view
213download
0
S1
The Supporting Information for the paper:
Comprehensive spectroscopic characterization of finasteride
polymorphic forms. Does the form X exist?
Jadwiga Frelek,a Marcin Górecki,
a Alicja Dziedzic,
a Ewa Jabłońska,
b Bohdan Kamieński,
a,c
Ryszard K. Wojcieszczyk,b Roman Luboradzki,
c and Wojciech J. Szczepek*
d
a Institute of Organic Chemistry, Polish Academy of Sciences, Kasprzaka 44/52, Warsaw,
Poland
b University of Technology and Humanities in Radom, Chrobrego 27, 26-600 Radom, Poland
c Institute of Physical Chemistry, Polish Academy of Sciences, Kasprzaka 44/52, Warsaw,
Poland
d Pharmaceutical Research Institute, Rydygiera 8, 01-793 Warsaw, Poland
Contents:
page
EXPERIMENTAL PROCEDURES S3
PREPARATION OF FINASTERIDE POLYMORPHS S5
FT-IR SPECTROSCOPY
S8
Table S1. FT-IR (KBr) after final drying.
Table S2. FT-IR (nujol) after final drying.
Table S3. FT-IR (ATR) after final drying.
Table S4. FT-IR (KBr [cm-1
]) data for samples of form I.
Table S5. FT-IR (KBr [cm-1
]) data for samples of form II.
Table S6. FT-IR (KBr [cm-1
]) data for samples of form III.
DIFFERENTIAL SCANNING CALORYMETRY (DSC) S12
Table S7. DSC data for samples of form I.
Table S8. DSC data for samples of form II.
Table S9. DSC data for samples of form III.
X-RAY POWDER DIFFRACTION (XRPD) S13
Fig. S1. XRPD of the sample S1 (form I).
Table S10. XRPD data for samples of form I.
Fig. S2. XRPD of the sample S4 (form II).
Table S11. XRPD data for samples containing forms II and III.
Fig. S3. XRPD of the sample S6 (form III).
Fig. S4. XRPD of the sample S7 (a mixture of forms II and III).
13
C CP-MAS NMR SPECTROSCOPY S16
Table S12. Carbon-13 chemical shifts (δC/ppm) for finasteride forms I.
Table S13. Carbon-13 chemical shifts (δC/ppm) for finasteride forms II.
Fig. S5. 13
C CP-MAS NMR of the sample S0 (form I).
Fig. S6. 13
C CP-MAS NMR of the sample S1 (form I).

S2
Fig. S7. 13
C CP-MAS NMR of the sample S4 (form II).
Fig. S8. 13
C CP-MAS NMR of the sample S6 (form III).
Fig. S9. 13
C CP-MAS NMR of the sample S7 (a mixture of forms II and III).
SOLUTION 1H AND
15N NMR DATA S20
Fig. S10. 1H NMR spectrum of finasteride sample S6 (600 MHz, CDCl3).
Fig. S11. 15
N NMR spectrum of finasteride sample S6 (60.8 MHz, CDCl3).
Fig. S12. 1H-
15N gHMBC NMR spectrum of finasteride sample S6.
Fig. S13. 1H-
15N HSQC NMR spectrum of finasteride sample S6.
SOLID 15
N CP-MAS NMR DATA S23
Fig. S14. 15
N CP-MAS NMR of the form I, sample S0.
Fig. S15. 15
N CP-MAS NMR of the form I, sample S1.
Fig. S16. 15
N CP-MAS NMR of the form II, sample S4.
Fig. S17. 15
N CP-MAS NMR of the form III, sample S6.
Fig. S18. 15
N CP-MAS NMR of a mixture of forms II and III, sample S7.
CONFORMATIONS OF FINASTERIDE AND RELATED MOLECULES IN
THE CRYSTALLINE FORMS (POLYMORPHS AND SOLVATOMORPHS)
AND FINASTERIDE IN SOLUTION
S26
Table S14. Conformations of ,-unsaturated lactam (en-lactam) and amide
chromophores in finasteride and its analogs (unsolvated and solvated forms).
COMPUTED ECD SPECTRUM OF FINASTERIDE POLYMORPHIC
FORM I
S27
Figure S19. Solid-state ECD spectrum recorded in KCl pellet of Form I (S1)
compared with the TDDFT calculations based on X-ray data at CAM-B3LYP/TZVP
level of theory.
SOLID-STATE VCD SPECTRA
S28
Fig. S20. Reproducibility of solid-state VCD spectra of forms I-III.
SOLUTION VCD AND IR CALCULATIONS
S28
Fig. S21. Structures of conformers within a 5 kcal/mol–1
energy window of
finasteride.
Fig. S22. Experimental VCD and IR spectra recorded in CDCl3 compared to
simulated.
Table S15. Vibrational analysis of selected bands for the lowest energy conformer
(Conf. 1) of finasteride in CDCl3 solution.
Table S16. Rotational strengths for selected bands of conformers 1-3 of finasteride in
chloroform solution.
REFERENCES
S30

S3
EXPERIMENTAL PROCEDURES
Commercially available, pure solvents such as hexane, heptane, cyclohexane,
dichloromethane (methylene chloride), ethyl acetate, diethyl carbonate, ethanol,
tetrahydrofuran, propan-2-ol (isopropanol), and acetic acid were used without additional
purification in preparation of finasteride polymorphs.
Finasteride was synthesized in Pharmaceutical Research Institute from commercially
available 3-oxoandrost-4-ene-17-carboxylic acid (Chart 1A). Thus, the absolute
configurations at C(10), C(9), C(8), C(14), C(13) and C(17) remained unchanged and are the
same as in the substrate, i.e. can be described as 10-CH3, 9-H, 8-H, 14-H, 13-CH3 and
17-H, respectively. The absolute configuration of the newly formed stereogenic center at
C(5) resulted from 1H NMR spectrum of finasteride, described in Supporting Information on
page S20 and can be described as 5-H (Chart 1B). The obtained finasteride shows specific
optical rotation +13.3 (c=1, methanol; temperature: 23 ºC) and meets requirement of
European Pharmacopoeia 5.0 (+12.0 to +14.0).
Chart 1. A: 3-oxoandrost-4-ene-17-carboxylic acid; B: finasteride with its systematic name;
C: finasteride and its IUPAC name with the proper numbering of its skeleton and R/S
stereodescriptors at the chiral centers.
FT-IR Spectroscopy FT-IR spectra were recorded using JASCO FTIR-6200 spectrometer equipped with
DLATGS detector and temperature regulator. The spectra were obtained using KBr pellet
technique (~1 mg per 300 mg KBr) and Nujol mull technique (qualitatively) in the range of
4000-400 cm1
with 4 cm1
resolution, as well as by reflectance method using single
reflection ATR attachment (ZnSe crystal) in the range of 4000-550 cm1
with 4 cm1
resolution.
Differential Scanning Calorimetry (DSC) DSC was carried out using Universal V4.3A TA Instruments. All samples were run
from 30 to 300 °C. Argon was used as purge gas in ambient mode. The heating rate was kept
constant at 5 or 10 °C min1
. Aluminum sample pans were used for all samples. A single point
calibration was carried out using indium as a standard sample.
X-ray Powder Diffraction (XRPD)
Diffraction data for all samples were collected using Bruker D8 ADVANCE (Cu K
1.5418 Å) diffractometer, in Bragg-Brentano geometry. Diffractograms were measured for 2

S4
values ranging from 5 to 40 °, with step size 0.01 ° and time per step equal 20 s, at room
temperature.
Nuclear Magnetic Resonance (1H NMR,
13C NMR,
15N NMR)
The NMR measurements in solution were performed using Varian VNMRS 600 MHz
spectrometer operating at 600 MHz and 60.8 MHz for proton and nitrogen, respectively. 5
mm Inverse, variable temperature, PFG, probe was used. Internal TMS was used as a
reference for proton spectra. The nitrogen spectra were referenced to external nitromethane.
The assignment of the chemical shifts for nitrogen in solution was made by gHMBC and
HSQC methods. The standard Varian procedures were used for acquisition and processing of
data.
The solid-state CP-MAS spectra were measured at 298 K using Bruker 500 Avance II
spectrometer equipped with MAS 4 BL CP TRIPLE probe-head. 4 mm Zirconia rotors were
used. The CPMAS technique, performed by Bruker cp.av pulse program, was applied.
CPMAS experimental conditions for 15
N measurements were the following: spectral width
25kHz, acquisition time 50 ms, contact time 4 ms, rotation rate 6 kHz, relaxation delay 10 s.
2k Scans were collected to obtain good quality spectra. For carbon CPMAS experiments the
following conditions were applied: spectral width 31.25 kHz, acquisition time 50 ms, contact
time 2 ms, rotation rate 10 kHz, relaxation delay 10 s. 512 Scans were collected. For short
contact time CH spectra the contact time 40 μs was applied.
Solution ECD measurements The experimental solution ECD and UV spectra were recorded using Jasco J-815
spectrometer at room temperature in spectroscopic grade CH3CN. Solutions with
concentration 6.2×10⁴
M were measured in a quartz cell with a path length of 1–0.1 cm. All
spectra were recorded using scanning speed of 100 nm/min, step size of 0.2 nm, bandwidth of
1 nm, response time of 0.5 s, and an accumulation of 5 scans. The spectra were background-
corrected using spectrum of CH3CN collected under the same conditions.
Solid-state ECD measurements The diffused transmission circular dichroism (DTCD) spectra were recorded between
400-200 nm at room temperature using Jasco J-815 ECD spectropolarimeter equipped with
the powder ECD attachment (i.e. the integrating sphere compartment coating with barium
sulphate). All spectra were obtained using 100 nm/min scanning speed, step size of 0.2 nm,
bandwidth of 5 nm, response time of 0.5 sec, and an accumulation of 5 scans. The spectra
were background corrected.
Samples were prepared with the KCl pellet technique (0.06-0.1 mg of finasteride per
100 mg KCl). In each case, the compound was mixed with dried KCl, finely ground in Specac
Mill for 10 min and pressed at 10 ton under vacuum for 5 min to make a 13 mm diameter
transparent and spotless disk. The pellet was mounted on a rotatable holder in
spectropolarimeter. For each sample, several ECD spectra were measured upon rotation of the
disk around the incident axis direction at various rotation angles. These spectra were almost
identical, demonstrating the absence of detectable spectral artifacts.
Solid-state ECD calculations The calculations were performed using as an input structure the X-ray data for the form
I (WOLXOK02) of finasteride.1 After optimization of hydrogen atoms at B3LYP/6-31G(d)
level of theory, ECD/UV spectra were simulated in vacuum using the CAM-B3LYP
functional and TZVP basis set. Moreover, TDDFT calculations were repeated using
S5
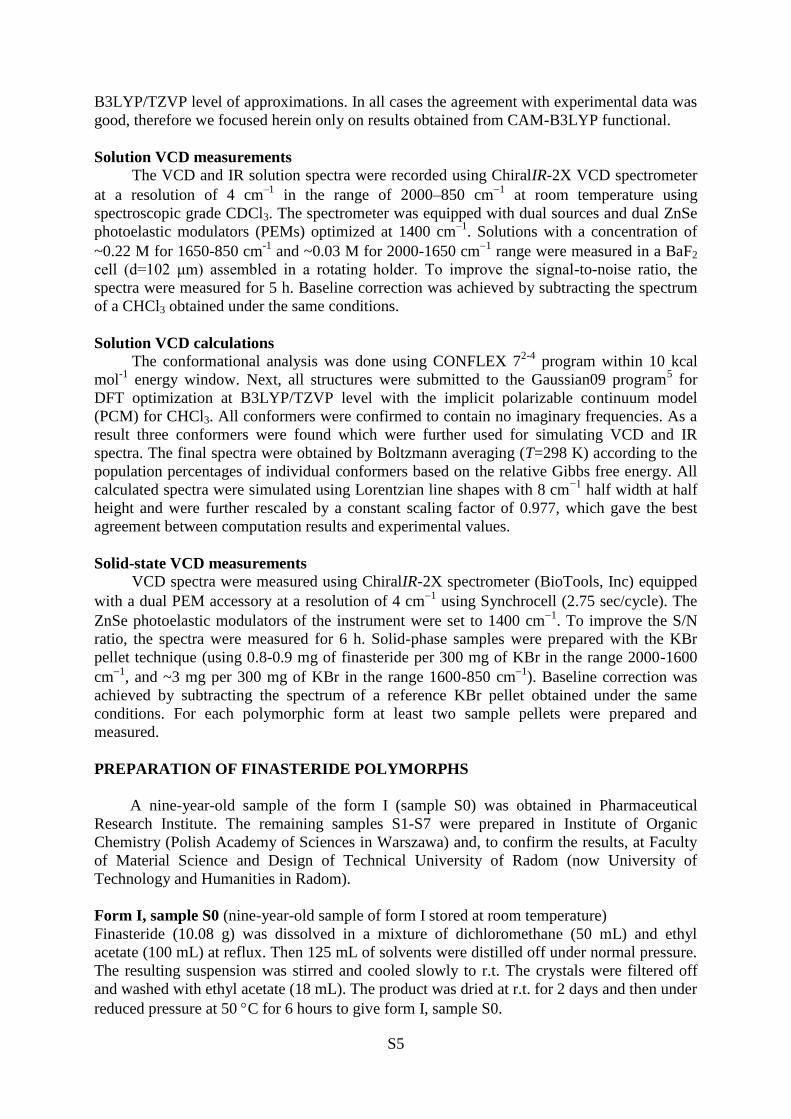
B3LYP/TZVP level of approximations. In all cases the agreement with experimental data was
good, therefore we focused herein only on results obtained from CAM-B3LYP functional.
Solution VCD measurements The VCD and IR solution spectra were recorded using ChiralIR-2X VCD spectrometer
at a resolution of 4 cm–1
in the range of 2000–850 cm1
at room temperature using
spectroscopic grade CDCl3. The spectrometer was equipped with dual sources and dual ZnSe
photoelastic modulators (PEMs) optimized at 1400 cm–1
. Solutions with a concentration of
~0.22 M for 1650-850 cm-1
and ~0.03 M for 2000-1650 cm1
range were measured in a BaF2
cell (d=102 μm) assembled in a rotating holder. To improve the signal-to-noise ratio, the
spectra were measured for 5 h. Baseline correction was achieved by subtracting the spectrum
of a CHCl3 obtained under the same conditions.
Solution VCD calculations The conformational analysis was done using CONFLEX 7
2-4 program within 10 kcal
mol-1
energy window. Next, all structures were submitted to the Gaussian09 program5 for
DFT optimization at B3LYP/TZVP level with the implicit polarizable continuum model
(PCM) for CHCl3. All conformers were confirmed to contain no imaginary frequencies. As a
result three conformers were found which were further used for simulating VCD and IR
spectra. The final spectra were obtained by Boltzmann averaging (T=298 K) according to the
population percentages of individual conformers based on the relative Gibbs free energy. All
calculated spectra were simulated using Lorentzian line shapes with 8 cm−1
half width at half
height and were further rescaled by a constant scaling factor of 0.977, which gave the best
agreement between computation results and experimental values.
Solid-state VCD measurements VCD spectra were measured using ChiralIR-2X spectrometer (BioTools, Inc) equipped
with a dual PEM accessory at a resolution of 4 cm1
using Synchrocell (2.75 sec/cycle). The
ZnSe photoelastic modulators of the instrument were set to 1400 cm1
. To improve the S/N
ratio, the spectra were measured for 6 h. Solid-phase samples were prepared with the KBr
pellet technique (using 0.8-0.9 mg of finasteride per 300 mg of KBr in the range 2000-1600
cm1
, and ~3 mg per 300 mg of KBr in the range 1600-850 cm1
). Baseline correction was
achieved by subtracting the spectrum of a reference KBr pellet obtained under the same
conditions. For each polymorphic form at least two sample pellets were prepared and
measured.
PREPARATION OF FINASTERIDE POLYMORPHS
A nine-year-old sample of the form I (sample S0) was obtained in Pharmaceutical
Research Institute. The remaining samples S1-S7 were prepared in Institute of Organic
Chemistry (Polish Academy of Sciences in Warszawa) and, to confirm the results, at Faculty
of Material Science and Design of Technical University of Radom (now University of
Technology and Humanities in Radom).
Form I, sample S0 (nine-year-old sample of form I stored at room temperature)
Finasteride (10.08 g) was dissolved in a mixture of dichloromethane (50 mL) and ethyl
acetate (100 mL) at reflux. Then 125 mL of solvents were distilled off under normal pressure.
The resulting suspension was stirred and cooled slowly to r.t. The crystals were filtered off
and washed with ethyl acetate (18 mL). The product was dried at r.t. for 2 days and then under
reduced pressure at 50 C for 6 hours to give form I, sample S0.

S6
Form I, sample S1
Finasteride (8.0 g) was dissolved in hot ethanol (40 mL). The stirred solution was cooled to
r.t. and then water (120 mL) was slowly added. The obtained suspension was stirred at r.t. for
20 hours. The crystals were filtered off and dried at r.t. for 2 days and then under reduced
pressure at 75 C for 6 hours to give form I, sample S1.
Form I, sample S2
A solution of finasteride (3.0 g) in dichloromethane (10 mL) was added dropwise to the
vigorously stirred boiling and distilling under normal pressure heptane (55 mL). About 50 mL
of solvents were distilled off. The resulting suspension was stirred and cooled slowly to r.t.
The crystals were filtered off and dried at r.t. for 2 days, under reduced pressure at 75 C for 6
hours and finally under reduced pressure at 135 C for 6 hours to give form I, sample S2.
Form I, sample S3
Finasteride (2.0 g) was dissolved in a minimal amount of diethyl carbonate at reflux. The
resulting solution was stirred and cooled slowly to r.t. The crystals were filtered off and dried
at r.t. for 2 days and then under reduced pressure at 75 C for 6 hours to give form I, sample
S3.
Form II, sample S4
Finasteride (5.0 g) was dissolved in a hot mixture acetic acid-water (4:6; 35 mL) and kept at
70-80 C for 30 min. The resulting solution was stirred and cooled slowly to r.t., and then
stirred at r.t. overnight. The crystals were filtered off and washed with water. The crystals of
so-called “form V”,6 i.e. finasteride acetic acid solvate,
7-9 were dried at r.t. for 2 days [FT-IR
(KBr): 3440, 3407, 3223, 3109, 1679, 1664, 1596, 1502, 1452, 1394, 1364, 1255, 1219, 1128
and 819 cm1
], then under reduced pressure at 75 C for 6 hours and finally under reduced
pressure at 135 C for 6 hours to give form II, sample S4.
Impure form II, sample S5
Finasteride (2.0 g) was dissolved in the minimal amount of propan-2-ol at reflux. The
resulting solution was stirred and cooled slowly to r.t. The crystals of so-called “form H1”,10
i.e. [bis(finasteride) monohydrate mono(isopropanol) solvate]7,8
were filtered off and dried at
r.t. for 2 days [FT-IR (KBr): 3439, 3385, 3293, 3187, 3099, 1681, 1650, 1599, 1514, 1451,
1365, 1252, 1222, 1126, 952, 816 and 809 cm1
], then under reduced pressure at 75 C for 6
hours and finally under reduced pressure at 135 C for 6 hours to give impure form II, sample
S5.
Form III, sample S6
A solution of finasteride (3.1 g) in dichloromethane (10 mL) was added dropwise to the
vigorously stirred boiling and distilling under normal pressure cyclohexane (60 mL). About
50 mL of solvents were distilled off. The resulting suspension was stirred and cooled slowly
to r.t. The crystals were filtered off and dried at r.t. for 2 days, then under reduced pressure at
75 C for 6 hours and finally under reduced pressure at 135 C for 6 hours to give form III,
sample S6.

S7
Impure form III, sample S7
Finasteride (8.0 g) was dissolved in dichloromethane (24 mL) and then 15 mL of
dichloromethane were distilled off. The resulting solution was saturated with hexane (80 mL)
and then 10 mL of solvents were distilled off under atmospheric pressure. The obtained
suspension was stirred and cooled slowly to r.t. The crystals were filtered off and dried at r.t.
for 2 days, then under reduced pressure at 75 C for 6 hours and finally under reduced
pressure at 135 C for 6 hours to give mixed crystals of form III and form II, sample S7.

S8
FT-IR SPECTROSCOPY FT-IR spectra of all obtained samples were recorded in KBr pellets (Table S1), in nujol
(Table S2) and by ATR method (Table S3).
Table S1. FT-IR (KBr) after final drying.
F I F II F III F (III+II)
S0 S1 S2 S3 S4 S5 S6 S7
•3429
3348
••3236
3114
1687
1668
1600
1505
1449
1384
1364
1331
1257
1218
1125
815
688
•3429
3352
••3237
3114
1690
1667
1600
1505
1449
1384
1364
1331
1258
1218
1125
815
688
•3429
3348
••3233
3114
1687
1667
1600
1504
1444
1384
1364
1331
1257
1218
1125
815
688
•3429
3347
••3233
3114
1687
1669
1600
1505
1444
1384
1363
1330
1257
1217
1125
814
687
•3438
3337
••3213
3110
3047
1688
1679
1658
1598
1500
1451
1415
1389
1365
1251
1219
1200
1126
820
•3438
3384
3289
••3201
3106
3047
1680
1658
1597
1500
1451
1415
1390
1364
1251
1220
1200
1126
819
•3426
3328
••3229
3104
3040
1679
1601
1499
1449
1384
1365
1357
1332
1254
1219
1201
1126
820
691
*•3426
3327
••3229
3105
3043
1679
1600
1498
1448
1385
1365
1331
1254
1219
1200
1125
820
691 * – this band is overlapped by a weaker band at higher frequency; • – sharp, intensive band over 3040 cm
-1;
•• – broad, the most intensive band over 3040 cm-1

S9
Table S2. FT-IR (nujol) after final drying.
F I F II F III F (III+II)
S0 S1 S2 S3 S4 S5 S6 S7
3427
3347
•3231
3114
1688
1668
1599
1504
1254
1219
1124
814
685
3428
•3223
3114
1688
1667
1600
1505
1444
1384
1364
1331
1258
1218
1126
815
688
3428
3348
•3222
3113
1687
1667
1600
1504
1473
1442
1383
1364
1331
1257
1224
1125
815
721
688
3428
3347
•3229
3113
1687
1668
1600
1505
1442
1385
1363
1331
1257
1218
1125
815
688
3437
3337
•3199
3106
3042
1689
1677
1655
1596
1498
1479
1433
1415
1389
1361
1251
1219
1200
1125
820
722
3437
3383
3288
•3188
3099
3045
1678
1651
1597
1498
1475
1439
1416
1389
1362
1251
1220
1200
1126
818
741
722
3425
3327
•3220
3102
1680
1600
1497
1473
1445
1383
1365
1332
1254
1219
1200
1126
819
722
691
*3425
3327
•3217
3104
1679
1600
1498
1447
1390
1365
1332
1254
1219
1200
1126
819
692 * – this band is overlapped by a weaker band at higher frequency; • – the most intensive band over 3040 cm
-1

S10
Table S3. FT-IR (ATR) after final drying.
F I F II F III F (III+II)
S0 S1 S2 S3 S4 S5 S6 S7
3427
•3233
3114
1685
1667
1600
1504
1453
1389
1362
1255
1221
1124
813
685
3429
•3234
3114
1686
1667
1600
1505
1448
1384
1364
1331
1257
1224
1125
815
688
3429
•3237
3115
1687
1667
1601
1505
1449
1384
1364
1331
1257
1225
1125
815
688
3429
•3237
3115
1687
1667
1601
1505
1449
1384
1364
1331
1257
1225
1125
815
688
3437
•3206
3110
1686
1678
1656
1597
1498
1451
1415
1389
1365
1251
1220
1200
1126
819
3438
•3208
3110
1686
1678
1657
1597
1499
1451
1416
1389
1364
1251
1220
1200
1126
819
3426
•3232
3103
1679
1601
1497
1448
1384
1366
1357
1333
1254
1220
1201
1126
819
692
3426
•3230
3104
1679
1601
1497
1448
1385
1366
1333
1254
1220
1200
1126
819
692 • – the most intensive band over 3040 cm
-1
All samples containing form I, i.e. freshly prepared samples S1, S2 and S3, as well as
nine-year-old sample S0 show FT-IR data in KBr well-matched with that reported in the
literature (shown in Table S4). The identity of these samples confirm the complete IR data in
KBr (Table S1), in nujol (Table S2) and ATR (Table S3).
Table S4. FT-IR (KBr [cm-1
]) data for samples of form I.
Literature data Current work 11
9
1
12
13 S0 S1 S2 S3
3431
3237
1692
1666
1602
688
3429
3348
3238
3115
1689
1669
1601
3430
3349
3236
3114
1690
1668
3429
3241
1689
1669
3426
3240
1687
1666
1599
1504
814
688
3429
3348
•3236
3114
1687
1668
1600
1505
815
688
3429
3352
•3237
3114
1690
1667
1600
1505
815
688
3429
3348
•3233
3114
1687
1667
1600
1504
815
688
3429
3347
•3233
3114
1687
1669
1600
1505
814
687 in italics - values calculated from figure included in the literature; • – the most intensive band above 3040 cm
1
Sample S4, containing form II, has FT-IR data in KBr consistent with that reported in
the literature, while sample S5 clearly shows presence of additional absorption bands at 3384
and 3289 cm1
(Table S5, underlined values), which belong to the not completely
decomposed bis(finasteride) monohydrate mono(isopropanol) solvate.7,8
The latter sample

S11
(i.e., S5) does not have a well-shaped absorption band at 1688 cm-1
. Samples S4 and S5 show
also differences in IR data in KBr (Table S1) and nujol (Table S2), although the data in ATR
are similar (Table S3).
Table S5. FT-IR (KBr [cm-1
]) data for samples of form II.
Literature data Current work 11
9
1
12 S4 S5
3441
3215
1678
1654
1597
1476
752
3439
3336
3213
1680
1657
1599
3440
3342
3213
3115
3048
1677
1655
3439
3221
1689
1678
3438
3337
•3213
3110
3047
1688
1679
1658
1598
1451
3438
3384
3289
•3201
3106
3047
1680
1658
1597
1451
in italics - values calculated from figure included in the literature; • – the most intensive band above 3040 cm
-1
Finally, samples S6 and S7 (form III) exhibited FT-IR data in KBr well-matched with
that reported in literature as it is shown in Table S6. However, in the case of sample S7 a
weaker band at higher frequency is superimposed on the absorption band at 3426 cm1
. At
this point, the origin of this weak band was not yet clear. However, it might be expected that
in this case the form III is contaminated by the form II. The IR data in KBr (Table S1) and
nujol (Table S2) show small differences between samples S6 and S7, although ATR spectra
(Table S3) are similar.
Table S6. FT-IR (KBr [cm-1
]) data for samples of form III.
Literature data Current work 6 S6 S7
3427
3233
1679
1600
1501
1451
1387
1365
1332
1254
1222
1125
820
693
3426
3328
•3229
3104
3040
1679
1601
1499
1449
1384
1365
1332
1254
1219
1126
820
691
*3426
•3230
3104
1679
1601
1497
1448
1385
1366
1333
1254
1220
1126
819
692
* this band is overlapped by a weaker band at higher frequency; • – the most intensive band above 3040 cm-1

S12
DIFFERENTIAL SCANNING CALORYMETRY (DSC) After detailed analysis of the FT-IR spectra, the differential scanning calorimetry (DSC)
measurements for samples S1, S2, S4, S6 and S7 were carried out. DSC curves of the samples
S1and S2 (polymorphic form I), at heating rates of 5 C min1
and 10 C min1
, respectively,
exhibit a minor endotherm with a peak temperature of about 230-240 C, and a major melting
endotherm with a peak temperature of about 260 C. The obtained results agree with the
majority of those presented in the literature for polymorphic form I (see Table S7).
Table S7. DSC data for samples of form I.
DSC
parameters
Literature data Current work 11,14
1
13
7
15
16
17 S1 S2
Heating rate
[°C min1]
20 10 10 1 10 10 ? 5 10
Endotherm
onset [°C]
peak [°C]
heat [J g-1
]
223
232
11
230
11
222
236
12
211.8
217.0
6.44
237
226.4
11.41
~230
236.6
240.1
10.08
224.3
230.3
11.50
Endotherm
onset [°C]
peak [°C]
heat [J g1]
258
261
89
257
89
253.2
71
257.7
257.9
56.09
258
258.7
81.53
257
257.7
260.0
81.58
258.0
259.4
80.91
DSC curve of the sample S4 (polymorphic form II), at heating rate of 5 C min1
,
exhibits only a single melting endotherm with a peak temperature of about 260 C. In this
case, our results are consistent with the literature data for polymorph II (see Table S8).
Table S8. DSC data for samples of form II.
DSC parameters Literature data Current
work 11
1
7 S4
Heating rate [°C min-1
] 20 10 1 5
Endotherm Onset [°C]
Peak [°C]
Heat [J g-1
]
258
261
89
257
88
257.6
257.8
46.41
258.1
260.3
77.34
Similarly, the DSC results for samples S6 and S7 (form III) are consistent with the
literature reports (see Table S9).
Table S9. DSC data for samples of form III.
DSC parameters Literature data Current work 6
14 S6 S7
a
Heating rate [°C/min] ? 10 10 10
Endotherm Onset [oC]
Peak [°C]
Heat [J g-1
]
262.7
257
259
86.5
257.9
259.4
76.77
258.0
259.4
80.21 a – form III probably contaminated by form II

S13
X-RAY POWDER DIFFRACTION (XRPD) X-ray powder diffraction (XRPD) measurements were done for samples S1 (form I), S4
(form II), S6 (form III) and S7 (form III probably contaminated by form II).
The XRPD pattern of sample S1 (form I, Figure S1), is characterized by major peaks at
2Θ values of 13.9, 14.3, 15.4, 15.8, 16.9, 17.3, 18.5, 19.9, 21.7, 25.1, 27.2 and 28.7 (Table
S10). As it is evident from the Table S10, our results agree well with literature reports.11,13-15
Fig. S1. XRPD of the sample S1 (form I).
Table S10. XRPD data for samples of form I.
Literature data Current work 11
13
14
15
S1
d *2Θ d *2Θ 2Θ 2Θ 2Θ
6.44
5.69
5.36
4.89
4.55
4.31
3.85
3.59
3.14
13.8
15.6
16.5
18.1
19.5
20.6
23.1
24.8
28.4
6.39
5.64
5.28
5.13
4.81
4.47
4.30
3.83
3.57
3.12
13.9
15.7
16.8
17.3
18.4
19.9
20.7
23.2
24.9
28.6
13.8
15.6
16.7
18.3
19.3
20.3
22.9
24.7
28.4
13.9
14.3
15.3
15.8
16.9
17.3
18.5
19.6
19.9
20.7
21.7
23.1
25.0
26.1
28.5
etc.
13.9
14.3
15.4
15.8
16.9
17.3
18.5
19.9
21.7
25.1
27.2
28.7
* - recalculated for Cu K 1.5418 Å

S14
The major peaks at 2Θ values of 6.4, 8.7, 11.3, 12.8, 14.1, 15.1, 15.9, 19.1, 19.7 and
27.6 recorded for our form II, sample S4 (Figure S2 and Table S11) could not be compared
directly with the literature data given as d values. However, our results agree with the reported
values recalculated for Cu K 1.5418 Å.
Fig. S2. XRPD of the sample S4 (form II).
Table S11. XRPD data for samples containing forms II and III.
F II F II + F
III
F III F IIIa „F X”
a
Literature
data
Current
work
Current
work
Current
work
Literature
data
Literature
data
Literature
data 11
S4 S7 S6 6
14
7,8
7
d *2Θ 2Θ 2Θ 2Θ 2Θ 2Θ 2Θ 2Θ
14.09
10.36
7.92
7.18
6.40
5.93
5.66
5.31
4.68
3.90
3.60
3.25
6.3
8.5
11.2
12.3
13.8
14.9
15.7
16.7
19.0
22.8
24.7
27.4
6.4
8.7
11.3
12.8
14.1
15.1
15.9
19.1
19.7
27.6
c5.4
b6.4
b8.7
10.1
c10.8
b11.3
b12.8
c13.7
b14.1
b,c15.1
b,c15.9
c16.2
c18.3
b19.2
b19.7
c23.1
5.4
10.8
13.8
15.1
16.0
16.2
18.3
23.2
28.5
5.32
10.70
13.64
14.96
15.86
16.12
16.56
17.20
18.22
19.60
23.04
5.2
10.6
13.5
14.8
15.8
16.0
16.4
17.1
18.1
19.4
5.4
10.7
13.7
16.2
18.3
5.4
10.7
16.2
17.3
18.3
23.1
a – extracted signals; * - recalculated for Cu K 1.5418 Å;
b - signals corresponding to form II;
c – signals
corresponding to form III The XRPD pattern of form III, sample S6 (Figure S3 and Table S11) is characterized by
major peaks at 2Θ values of 5.4, 10.8, 13.8, 15.1, 16.0, 16.2, 18.3, 23.2 and 28.5. Comparison

S15
of these values with those cited in the literature (see Table S11) showed that sample S6 is a
pure crystalline form III. However, the crystals of the sample S7, exhibiting FT-IR and DSC
data compatible with the literature data of form III, show in its XRPD peaks characteristic for
both form II (at 2Θ: 6.4, 8.7, 11.3, 12.8, 14.1, 15.1, 15.9, 19.2 and 19.7) and form III (at 2Θ:
5.4, 10.8, 13.7, 15.1, 15.9, 16.2, 18.3 and 23.1) (see Figure S4 and Table S11).
It should be noted at this point that the extracted data presented for form III and the
extracted data for the so-called “form X” are highly consistent with values cited in the patent
literature as well as with our data of form III (see Table S11).
Fig. S3. XRPD of the sample S6 (form III).
Fig. S4. XRPD of the sample S7 (a mixture of forms II and III).

S16
13C CP-MAS NMR SPECTROSCOPY
The polymorphic purity of our samples of form I (S0 and S1), II (S4) and III (S6) was
also confirmed by 13
C CP-MAS NMR measurements. The same methodology was used to
demonstrate that the sample S7 is a mixture of polymorphic forms II and III.
Comparison of the 13
C data for samples S0 or S1 (Table S12) and sample S4 (Table
S13) with the data cited in the literature showed that within an experimental error their
chemical shifts are the same as those measured for the polymorphs I and II, respectively.
These results strongly support conclusion that samples S0 and S1 are pure samples of form I,
and S4 is pure sample of form II, despite the fact that sample S0 was crystallized from
solvents different than those used in the literature.1,7,9,11-15
The 13
C CP-MAS NMR spectra of
samples S0, S1 and S4 are shown at Figures S5, S6 and S7, respectively.

S17
Table S12. Carbon-13 chemical shifts (δC/ppm) for finasteride forms I.
C No C type Literature data Current work 1
12
7,8 S1 ΔδI S0
1 CH 146.9 146.7 146.9 147.0 –0.1 147.0 2 CH 126.6 126.4 126.9 126.6 +0.3 126.6 3 CN 163.3 163.5 164.3 163.6 +0.7 163.6 5 CHN 60.1 59.9 60.6 60.4 +0.2 60.4 6 CH2 26.5 25.9 26.8 26.5 +0.3 26.6 7 CH2 30.6 30.5 30.6 30.6 0.0 30.7 8 CH 36.5 36.2 36.8 36.5 +0.3 36.5 9 CH 47.6 47.4 48.0 47.6 +0.4 47.7 10 C 39.0 39.6 40.2 39.9 +0.3 39.9 11 CH2 21.5 21.5 21.9 21.5 +0.4 21.6 12 CH2 38.4 38.3 38.8 38.5 +0.3 38.5 13 C 43.9 43.7 44.3 44.0 +0.3 44.0 14 CH 55.7 55.5 56.1 55.7 +0.4 55.7 15 CH2 25.6 25.5 26.0 25.7 +0.3 25.7 16 CH2 24.0 23.8 24.3 24.0 +0.3 24.0 17 CH 57.3 57.1 57.6 57.3 +0.3 57.3 18 CH3 14.9 14.6 15.2 14.9 +0.3 14.9 19 CH3 14.3 14.1 14.7 14.3 +0.4 14.3 20 CN 168.8 168.8 169.3 169.0 +0.3 169.0 22 CN 51.5 51.5 51.9 51.7 +0.2 51.7
23,24,25 CH3 28.9 28.6 29.3 28.9 +0.4 28.9 ΔδI = F I
7,8 – F I(S1)
Table S13. Carbon-13 chemical shifts (δC/ppm) for finasteride forms II.
C No C type Literature data Current work 1
12
7,8 S4 ΔδII
1 CH 150.1/151.6 149.9/151.4 150.4/151.9 150.2/151.7 +0.2/+0.2 2 CH 123.0 122.8 123.3 123.1 +0.2 3 CN 164.4/165.1 164.8 164.9/165.7 164.7/165.5 +0.2/+0.2 5 CHN 59.2/60.4 59.8 59.6/60.9 59.4/60.6 +0.2/+0.3 6 CH2 25.9 25.3 26.6 26.0 +0.6 7 CH2 30.8/31.4 30.8 31.1/31.7 30.8/31.5 +0.3/+0.2 8 CH 35.3 35.0 35.6 35.3 +0.3 9 CH 48.5/48.8 48.6 48.9/49.2 48.6/48.9 +0.3/+0.3
10 C 39.9/40.3 39.7/40.0 40.3/40.6 40.0/40.3 +0.3/+0.3 11 CH2 21.0/21.5 22.6 21.3/21.9 21.1/21.6 +0.2/+0.3 12 CH2 37.4/38.4 38.3 37.7/38.7 37.5/38.5 +0.2/+0.2 13 C 44.0 43.8 44.3 44.1 +0.2 14 CH 56.7/57.8 56.5 57.1/58.1 56.8/57.9 +0.3/+0.2 15 CH2 24.8 25.0 25.6 25.3 +0.3 16 CH2 23.6 24.0 24.0/25.2 23.7/25.0 +0.3/+0.2 17 CH 58.0/58.5 57.9 58.3/58.8 58.1/58.6 +0.2/+0.2 18 CH3 13.1/13.6 12.9/13.3 13.5/13.9 13.2/13.6 +0.3/+0.3 19 CH3 12.1/12.5 11.9/12.3 12.5/12.9 12.2/12.6 +0.3/+0.3 20 CN 169.4 169.2 169.7 169.4 +0.3 22 CN 50.8 50.7 50.9 50.9 0.0
23,24,25 CH3 27.9/28.2 27.7/28.1 28.3/28.7 28.0/28.4 +0.3/+0.3 ΔδII = F II
7,8 – F II(S4)

S18
Fig. S5.
13C CP-MAS NMR of the sample S0 (form I).
Fig. S6.
13C CP-MAS NMR of the sample S1 (form I).

S19
Fig. S7.
13C CP-MAS NMR of the sample S4 (form II).
Fig. S8.
13C CP-MAS NMR of the sample S6 (form III).

S20
Fig. S9.
13C CP-MAS NMR of the sample S7 (a mixture of forms II and III).
SOLUTION 1H AND
15N NMR DATA
1H NMR spectrum (600 MHz) of finasteride sample S6 in CDCl3 solution (Figure S10) shows
the following well-defined signals at : 0.67 (3H, s, 18-H), 0.95 (3H, s, 19-H), 1.32 (9H, s,
tert-Bu), 3.30 (1H, dd, J = 11.0 and 5.3 Hz, 5-H), 5.07 (1H, s, 21-NH), 5.78 (1H, dd, J =
9.95 and 2.3 Hz, 2-H), 5.82 (1H, br s, 4-NH) and 6.76 (1H, d, J = 9.94 Hz, 1-H) [lit.18
1H-
NMR (400 MHz, CDCl3, δ): 0.70 (s, 3H, 18-CH3), 0.98 (s, 3H, 19-CH3), 1.36 (s, 9H, (CH3)3),
3.34 (m, 1H, H5), 5.07 (br s, 1H, NH), 5.15 (br s, 1H, NH), 5.82 (dd, 10.0, 1H, H2), and 6.79
(d, 10.0, 1H, H1); lit.19
1H-NMR (300 MHz, CDCl3, δ): 0.71 (s, 3H), 0.98 (s, 3H), 1.34 (s,
9H), 3.34 (dd, 1H), 5.10 (brs, 1H), 5.49 (brs, 1H), 5.81 (d, 1H), 6.82 (d, 1H)].

S21
Fig. S10.
1H NMR spectrum of finasteride sample S6 (600 MHz, CDCl3).
Fig. S11.
15N NMR spectrum of finasteride sample S6 (60.8 MHz, CDCl3).

S22
Fig. S12.
1H-
15N gHMBC NMR spectrum of finasteride sample S6.
Fig. S13.
1H-
15N HSQC NMR spectrum of finasteride sample S6.

S23
SOLID 15
N CP-MAS NMR DATA
Fig. S14.
15N CP-MAS NMR of the form I, sample S0.
Fig. S15.
15N CP-MAS NMR of the form I, sample S1.

S24
Fig. S16.
15N CP-MAS NMR of the form II, sample S4.
Fig. S17.
15N CP-MAS NMR of the form III, sample S6.

S25
Fig. S18.
15N CP-MAS NMR of a mixture of forms II and III, sample S7.

S26
CONFORMATIONS OF FINASTERIDE AND RELATED MOLECULES IN THE
CRYSTALLINE FORMS (POLYMORPHS AND SOLVATOMORPHS) AND
FINASTERIDE IN SOLUTION
Table S14. Conformations of ,-unsaturated lactam (en-lactam) and amide chromophores in
finasteride and its analogs (unsolvated and solvated forms).
Note: For some structures, in the databases, are shown their enantiomers. Therefore, we changed them the signs
of the torsion angles to the opposite and marked them red.
Ring A
Side chain
Torsion angles:
a – C(5)-C(10)-C(1)-C(2)
b – C(10)-C(1)-C(2)-C(3)
c – C(1)-C(2)-C(3)-C(4)
d – C(2)-C(3)-C(4)-C(5)
e – C(3)-C(4)-C(5)-C(10)
f – C(4)-C(5)-C(10)-C(1)
g – C(16)-C(17)-C(20)-N(21)
h – C(17)-C(20)-N(21)-C(22)
i – C(20)-N(21)-C(22)-C(23)
amide – O=C(3)-N(4)-C(5) or O=C(20)-N(21)-C(22)
Comp.
[lit.]
CSD code
or
CCDC code
Ring A
En-lactam chromophore
Side chain
Amide chromophore
torsion angles
a b c d e f amide g h i amide mono(finasteride) type structures
A9 WOLXOK01 +33.4 +1.7 –15.9 –10.5 +47.3 –54.5 +172.1 +155.6 +172.6 –59.1 –5.5 A1 WOLXOK02 +34.6 +0.6 –15.3 –10.6 +47.5 –55.1 +171.4 +156.2 +173.0 –59.3 –3.8 B9 WOLXEA +30.3 +2.0 –13.8 –11.8 +45.8 –51.0 +169.3 +153.0 +174.4 –57.4 –3.2 C20 701192 +154.8 +177.5 –62.2 –0.5 D21 BEQKEN +157.6 +178.8 –56.0 +1.8 E22 +156.8 +172.6 –58.5 –4.2
bis(finasteride) structures
F1 WOLXOK03 +31.9 +3.0 –16.3 –9.8 +46.6 –54.0 +167.6 +151.9 +176.1 –54.6 –3.1 +35.1 –1.0 –13.2 –12.3 +48.4 –55.7 +168.3 +155.2 +177.0 –57.3 +1.8
G9 WOLXIE +30.7 +5.1 –17.4 –11.2 +47.6 –52.7 +169.4 +153.7 +170.3 –49.3 –9.7 +31.0 +0.2 –10.4 –15.1 +49.3 –53.0 +172.9 +162.0 +176.7 –61.1 –0.3
H8 638162 +32.0 +1.2 –13.6 –12.5 +47.5 –53.4 +170.0 +156.8 +175.8 –58.8 –0.1 +33.5 –0.8 –12.4 –12.6 +47.4 –53.9 +171.0 +162.8 +172.3 –54.3 –7.0
I8 638163 +31.7 +1.7 –14.2 –12.0 +47.3 –53.4 +169.9 +155.5 +173.4 –56.5 –3.9 +34.2 –0.3 –13.9 –11.0 +47.0 –54.4 +172.6 +161.8 +173.6 –57.0 –3.2
K8 638164 +32.2 +1.4 –15.1 –10.4 +46.2 –53.1 +172.3 +156.5 +174.3 –58.7 –1.9 +32.4 +1.3 –14.7 –10.7 +46.1 –53.0 +172.5 +164.0 +173.8 –55.6 –4.8
L16 749582 +29.2 +4.0 –14.8 –12.6 +48.0 –52.1 +169.0 +151.9 +173.0 –58.7 –5.8 +30.5 +2.7 –11.7 –14.5 +45.9 –51.5 +172.5 +162.1 +176.3 –61.4 –1.0
calculations data for finasteride solution
M Conf. 1 +30.7 +1.1 –10.9 –16.3 +49.8 –52.5 +165.8 +149.6 +179.2 –60.9 +0.1 Conf. 2 +30.6 +1.2 –11.0 –16.2 +49.7 –52.4 +165.9 +6.1 +176.3 –61.0 –1.7 Conf. 3 +30.7 +1.1 –11.1 –16.1 +49.7 –52.5 +166.0 –4.5 +178.5 –61.1 –0.7
A – finasteride form I; B – finasteride acetic acid solvate; C – 1,2-dihydrofinasteride; D – 1,2-dihydro-5-
finasteride methanol solvate; E – N-tert-butyl-5-androstane-17-carboxamide, F – finasteride form II; G –
bis(finasteride) monohydrate mono(ethyl acetate) solvate; H – bis(finasteride) monohydrate mono(1,4-dioxane)
solvate; I – bis(finasteride) monohydrate mono(propan-2-ol) solvate; K – bis(finasteride) monohydrate
mono(tetrahydrofuran) solvate; L – bis(finasteride) monohydrate mono(toluene) solvate; M – solution of
finasteride in chloroform.

S27
COMPUTED ECD SPECTRUM OF FINASTERIDE POLYMORPHIC FORM I
Figure S19. Solid-state ECD spectrum recorded in KCl pellet of Form I (S1) compared with
the TDDFT calculations based on X-ray data at CAM-B3LYP/TZVP level of theory.
Simulated curve generated with = 0.5 eV. For better comparison with experiment the
TDDFT curve was divided by 2 and red-shifted by 25 nm (UV shift correction).23,24
Vertical
blue bars represent rotational strength values (divided by 8).
98 100 101
102 (HOMO) 103 (LUMO) 107
Rotatory Strengths (R) in cgs (10-40
erg-esu-cm/Gauss)
Excited State 1: Singlet-A 4.7116 eV 263.15 nm f=0.0013 R(velocity) = −10.7137
98 ->103 0.11667
100 ->103 0.37456
101 ->103 -0.16584
102 ->103 0.52465 55% nC=O (lactam) → 1* (en-lactam)
Excited State 2: Singlet-A 5.6586 eV 219.11 nm f=0.0198 R(velocity) = −30.8683
98 ->103 -0.22778

S28
100 ->103 0.56886 65% O=C-N (lactam) → 1* (en-lactam)
102 ->103 -0.32932
Excited State 3: Singlet-A 5.6958 eV 217.68 nm f=0.0020 R(velocity) = +9.4006
101 ->104 0.19670
101 ->105 0.36421
101 ->107 0.43890 39% nC=O (amide) → 2* (amide)
101 ->108 0.10602
101 ->110 0.17642
102 ->105 0.10245
102 ->107 0.12257
Excited State 4: Singlet-A 6.3490 eV 195.28 nm f=0.4226 R(velocity) = +26.2307
98 ->103 0.64184 82% C=C-C=O (lactam) → 1* (en-lactam)
100 ->103 0.12818
102 ->103 -0.22014
SOLID-STATE VCD SPECTRA
in black – spectra recorded in 2012; in red – spectra recorded in 2013/14
Fig. S20. Reproducibility of solid-state VCD spectra of forms I-III.
SOLUTION VCD AND IR CALCULATIONS
Conf. 1
0.00 kcal/mol
80.73%
Conf. 2
0.96 kcal/mol
16.04%
Conf. 3
1.91 kcal/mol
3.23%
Fig. S21. Structures of conformers within a 5 kcal/mol–1
energy window of finasteride
calculated at the B3LYP/TZVP/PCM(CHCl3) level of theory.

S29
Fig. S22. Experimental VCD (top) and IR (bottom) spectra recorded in CDCl3, compared to
simulated spectra at the B3LYP/TZVP/PCM(CHCl3) level of theory, obtained as a
population-weighted sum of the calculated spectra of individual conformers. The simulated
spectra were scaled by 0.977.
Table S15. Vibrational analysis of selected bands for the lowest energy conformer (Conf. 1)
of finasteride in chloroform solution.
Band [cm-1
]
theor. / exp.
Mode assignment
1539 / ~1493 bending H-N(21)-C(20) within amide moiety (57%)
stretching N(21)-C(20) within amide moiety (16%)
1510 / ~1466 bending H-C-H within C(6)H2 and C(19)H3 moieties (70%)
bending H-C(19)-C(10) and C(19)-C(10)-C(5) within moiety (11%)
1489 / ~1448 bending H-C-H within tert-butyl moiety (59%)
bending H-C-C and C-C-C within tert-butyl moiety (17%)
Table S16. Rotational strengths for selected bands of conformers 1-3 of finasteride in
chloroform solution.
Conf. Torsion angle [deg]
C(16)-C(17)-C(20)-N(21)
R at ca.
1539/~1493 cm-1
R at ca.
1510/~1466 cm-1
R at ca.
1489/~1448 cm-1
1 +149.6 +15.93 −7.43 −8.65
2 +6.1 −18.39 −9.90 −16.21
3 −4.5 −21.71 −8.37 −19.45

S30
REFERENCES
1. Wenslow RM, Baum MW, Ball RG, McCauley JA, Varsolona RJ 2000. A
spectroscopic and crystallographic study of polymorphism in an aza-steroid. J Pharm Sci
89(10):1271-1285.
2. CONFLEX 7, 2012, Japan: Conflex corporation
3. Goto H, Osawa E 1993. An efficient algorithm for searching low-energy conformers
of cyclic and acyclic molecules. J Chem Soc, Perkin Trans 2:187-198.
4. Goto H, Osawa E 1989. Corner flapping: a simple and fast algorithm for exhaustive
generation of ring conformations. J Am Chem Soc 111:8950-8951.
5. Frisch MJ, Trucks GW, Schlegel HB, Scuseria GE, Robb MA, Cheeseman JR,
Scalmani G, Barone V, Mennucci B, Petersson GA, Nakatsuji H, Caricato M, Li X, Hratchian
HP, Izmaylov AF, Bloino J, Zheng G, Sonnenberg JL, Hada M, Ehara M, Toyota K, Fukuda
R, Hasegawa J, Ishida M, Nakajima T, Honda Y, Kitao O, Nakai H, Vreven T, Montgomery
Jr. JA, Peralta JE, Ogliaro F, Bearpark MJ, Heyd J, Brothers EN, Kudin KN, Staroverov VN,
Kobayashi R, Normand J, Raghavachari K, Rendell AP, Burant JC, Iyengar SS, Tomasi J,
Cossi M, Rega N, Millam NJ, Klene M, Knox JE, Cross JB, Bakken V, Adamo C, Jaramillo J,
Gomperts R, Stratmann RE, Yazyev O, Austin AJ, Cammi R, Pomelli C, Ochterski JW,
Martin RL, Morokuma K, Zakrzewski VG, Voth GA, Salvador P, Dannenberg JJ, Dapprich S,
Daniels AD, Farkas Ö, Foresman JB, Ortiz JV, Cioslowski J, Fox DJ. 2009. Gaussian 09.
D.01 ed., Wallingford, CT, USA: Gaussian, Inc.
6. Reddy MS, Rajan ST, Rao MVNB, Vyas K, Reddy SV, Rekha KS. 2002. Novel
polymorphic form of 17-beta-(N-tert.butylcarbamoyl)-4-aza-5-alpha-androst-1-en-3-one and a
process for preparing it. Patent WO 2002/020553
7. Othman A. 2006. Structural studies of two solid steroid compounds. Durham
University, http://etheses.dur.ac.uk, PhD theses.
8. Othman A, Evans JSO, Evans IR, Harris RK, Hodgkinson P 2007. Structural study of
polymorphs and solvates of finasteride. J Pharm Sci 96(5):1380-1397.
9. Wawrzycka I, Stępniak K, Matyjaszczyk S, Kozioł AE, Tadeusz L, Abboud KA 1999.
Structural characterization of polymorphs and molecular complexes of finasteride. J Mol
Struct 474(1-3):157-166.
10. Parthasaradhi RB, Rathnakar RK, Raji RR, Muralidhara RD, Subash Chander RK.
2004. Novel crystalline forms of finasteride. Patent WO 2004/083230
11. McCauley JA, Varsolona RJ. 1997. Process for the production of finasteride. Patent
US 5,652,365 A
12. Morzycki JW, Wawer I, Gryszkiewicz A, Maj J, Siergiejczyk L, Zaworska A 2002.
13C-NMR study of 4-azasteroids in solution and solid state. Steroids 67(7):621-626.
13. Silva Guisasola LO, Laderas Munoz M, Martin Juarez J. 2004. Method of obtaining
polymorphic form I of finasteride. Patent WO 2004/039828
14. Mandava VNBR, Singamsetty R, Manne N, Vujjini SK. 2007. Process to prepare
finasteride polymorphs. Patent US 2007/0167477

S31
15. Rao DVNS, Trinadhachari GN, Lenin R, Prabahar KJ, Naidu A, Dandala R 2007.
Facile water mediated synthesis of finasteride form-I, an azaandrostane steroid. Heterocycl
Commun 13(2-3):121-124.
16. Schultheiss N, Smit JP, Hanko JA 2009. Three isostructural solvates of finasteride and
their solid-state characterization. Eur J Pharm Sci 38(5):498-503.
17. Da Silva L, Montanari C, Ângelo M, Cazedey E, Bonfilio R, Araújo M. 2014.
Evaluation of polymorphism influence in the finasteride. Congress and General Assembly of
the International Union of Crystallography. 5-12 August 2014, Montreal, Quebec, Canada;
poster presentation MS107.P05.B625; Acta Cryst A70:C1567.
18. Carlin JR, Christofalo P, Arison BH, Ellsworth RE, Rosegay A, Miller RR, Chiu SHL,
Vandenheuvel WJA 1997. Disposition and Metabolism of Finasteride in Dogs. Drug Metab
Dispos 25:100-109.
19. Young HM, Dong JK, Chul-Hyun P, Kyung IL, Jae-Cheol L, Gwan SL, Young-Kil C.
2004. Method for the preparation of highly pure 1-androstene derivatives. Patent US
7,038,050 B2
20. Jasinski JP, Butcher RJ, Mallesha L, Mohana KN, Yathirajan HS, Narayana B 2009.
Acta Cryst (C55:IUC9900105.).
21. Moses Babu J, Ravindra Kumar Y, Vyas K, Om Reddy G, Rajan S, Reddy M 1999. N-
tert-Butyl-3-oxo-4-aza-5b,17b-androstane-17-carboxamide methanol solvate , a finasteride
impurity. Acta Cryst C55:IUC9900105.
22. Yan X, Xu S, Wang J, Chen Y, Xia P 2009. Acta Cryst:E65:o587, [doi:510.1107/
S1600536809005741].
23. Bruhn T, Hemberger Y, Schaumlöffel A, Bringmann G. 2013. SpecDis, 1.61 ed.,
Germany: University of Würzburg.
24. Bruhn T, Schaumlöffel A, Hemberger Y, Bringmann G 2013. SpecDis: Quantifying
the Comparison of Calculated and Experimental Electronic Circular Dichroism Spectra.
Chirality 25(4):243-249.