The Supply Side - Milken Instituteassets1c.milkeninstitute.org/assets/Publication/Research... ·...
34
Carlo De La Cruz and Matt Horton August 2016 The Supply Side: Defining a Pathway for Increasing California’s Housing Development Opportunities
-
Upload
duongtuyen -
Category
Documents
-
view
215 -
download
2
Transcript of The Supply Side - Milken Instituteassets1c.milkeninstitute.org/assets/Publication/Research... ·...

Carlo De La Cruz and Matt Horton
August 2016
The Supply Side:Defining a Pathway for Increasing California’s Housing Development Opportunities

August 2016
Carlo De La Cruz and Matt Horton
The Supply Side:Defining a Pathway for Increasing California’s Housing Development Opportunities

ACKNOWLEDGMENTS
The authors would like to thank their Milken Institute colleagues whose valuable contributions enhanced the final product. In particular, editor Mike White for his support in bringing some order to chaos, Gary Panes and Rosivaldo Novaes in Creative Services for adding visual representation to the data, and Kevin Klowden, Minoli Ratnatunga and Rebecca Simon for their important insights. The authors also thank the policy research staff at the California Housing Partnership for sharing their methodology and data sets, and Opticos Design, Inc., for the use of graphics and their overall contribution to this undertaking.
ABOUT THE MILKEN INSTITUTE
The Milken Institute is a nonprofit, nonpartisan think tank determined to increase global prosperity by advancing collaborative solutions that widen access to capital, create jobs and improve health. We do this through independent, data-driven research, action-oriented meetings and meaningful policy initiatives.
©2016 Milken Institute This work is made available under the terms of the Creative Commons Attribution-NonCommercial-NoDerivs 3.0 Unported License, available at http://creativecommons.org/licenses/by-nc-nd/3.0/

Table of Contents
I. EXECUTIVE SUMMARY ........................................................................................... 1
II. DEFINING THE CHALLENGE .................................................................................... 3
III. REGULATORY TENSION LIMITS LAND-USE ......................................................................7
IV. STREAMLINING THE CEQA REVIEW AND REFORMING THE NEEDS ASSESSMENT PROCESSES ................................................................................... 9
V. UNITE GOVERNMENT WITH MARKET FORCES TO ACCELERATE DEVELOPMENT . 13
VI. THE “MISSING MIDDLE”....................................................................................... 15
VII. MIND THE GAP: ALIGNING STATE AND LOCAL POLICIES ...................................... 17
VIII. CONCLUSIONS AND RECOMMENDATIONS ........................................................... 19
IX. APPENDIX............................................................................................................. 21
IX. ENDNOTES ...........................................................................................................27
ABOUT THE AUTHORS ..........................................................................................28


1WWW.MILKENINSTITUTE.ORG
I. Executive SummaryCalifornians face an unprecedented challenge finding affordable housing. Over the past 30 years, the precipitous rise in housing prices, development constraints, and stagnant growth in real income have cultivated a housing ecosystem that struggles to meet demand while prices far exceed the means of buyers and renters in median income brackets in urban and coastal communities.1 The solution lies not just in more construction, but the creation of a consistent policy framework that can better align investments that complement the state’s environmental priorities, such as greenhouse-gas (GHG) reduction. California needs policies that cultivate long-term economic growth and offset decades of unsustainable, economically inefficient suburban sprawl.
Intentionally or not, over the past half century state and local governments have enabled a political and regulatory culture that fosters a shortage of affordable housing. As a result, the market focuses on high-end housing, speculative purchases and rising property values at the expense of long-term economic growth, job creation, and workforce mobility. The consequences are crushing. California has the nation’s highest level of functional poverty, with residents in San Francisco and Los Angeles spending more than 70 percent of their monthly income on housing and commuting expenses.
To solve the crisis, and to meet greenhouse-gas targets, leaders need to combat entrenched anti-development pressures, inadequate funding, and tacit acceptance of sprawl. Moreover, the lingering effects of the recession and pent-up demand for adequate housing has coalesced to create a market with unique demands and opportunities.
Left to its own devices, the market is ill equipped to address the problem, yet to meet housing needs, leaders must leverage market principles, such as value capture, to encourage development. In order to establish a new framework, state and local entities must resolve regulatory barriers while also working to adjust the public’s perception of higher-density housing. Best practices, along with corresponding data, illustrate that a coordinated approach among public and private interests could accelerate increases in housing supply and moderate prices.
FIGURE 1 Median housing prices single family home, California vs. U.S. average
$
$150,000
$300,000
$450,000
$600,000
1970 1975 1980 1985 1990 1995 2000 2005 2010
CA U.S.
Source: California Association of Realtors.

2
THE
SUPP
LY S
IDE:
DEF
ININ
G A
PATH
WAY
FO
R IN
CREA
SING
CAL
IFO
RNIA
’S H
OUS
ING
DEVE
LOPM
ENT
OPP
ORT
UNIT
IES
The creation of housing that is diverse in type and price is a function of policy, not markets, and over time, supportive policies can lead to the construction of housing that is needed, but which the market tends to ignore. To accomplish this, state leaders must create a strategy that retains the traditional mix of impact fees and subsidies for market-rate units while reducing onerous regulations.
In the absence of effective policy, the market has focused on housing priced at the higher, and more profitable, end of the spectrum. The problem, which pinches middle- and lower-income buyers and renters, has been exacerbated by local jurisdictions whose broad power to make land-use decisions has had serious consequences for the state’s economy and its prospects for long-term growth.
California, a leader in the use of policy to allay the effects of climate change, must also lead the fight against rising housing costs by creating innovative strategies that address supply shortages and associated economic, social, and regulatory impediments. In the wake of inaction, vanishing open spaces, rising construction costs, and the scarcity of financing for housing development will continue. If California is to remain a place of opportunity for a 21st century workforce, it must also be able to accommodate the growing demand for housing to accommodate an ever-evolving and shifting workforce. In order to reconcile these challenges and increase the housing stock, state and local leaders should:
» Reform existing regulatory, zoning, and planning processes to limit the ability of local interests to derail development;
» Deploy new and retool existing incentive structures that preserve and support new development while incentivizing development for low-end and middle-tier housing;
» Encourage regional collaborative approaches around comprehensive zoning plans and supporting job centers;
» Provide stronger incentives for development that restores the “missing middle” of housing stock.

WWW.MILKENINSTITUTE.ORG 3
II. Defining the Challenge California has been for many years in the midst of a severe housing crisis; there are simply not enough
homes for the number of residents who need them. Continued undersupply of housing threatens
the State’s economic recovery, its environment, and the quality of life for all residents. Effectively
addressing this crisis demands the involvement and cooperation of all levels of government and the
private sector. Both the public and private sector must reexamine existing polices, programs, and
develop new strategies to ensure they operate most effectively and provide an adequate housing
supply for all Californians.
—Lyn Jacobs, director, Department of Housing and Community Development, 2009
The housing shortfall affects more than homebuyers, renters, and builders; it diminishes the economic competitiveness of the state’s workforce and of indispensable industries. The shortage led to the loss of nearly 4 million people from 2003 to 2013—mostly younger workers and families—to more affordable states, according to the California Department of Finance. Exacerbated by the housing crash of 2007-2009, the crisis continues to strain the limited supply of housing. The overall housing dynamic continues to stifle the state’s economic recovery while reinforcing the unflattering narrative surrounding the state’s business climate. A number of factors reflect this economic tension: the loss of highly skilled, educated workers; the hollowing out of California’s middle class; and diminished productivity due to increased commute times. The net effect contributes to the loss of revenue and poorer prospects for long-term economic growth.
FIGURE 2 California population growth
0.8
0.6
0.4
0.0
-0.2
-0.4
0.2
1991 1993 1995 1997 1999 2001 2003 2005 2007 2009 20132011 2015
Population, millions
Natural increase
Net domestic migration Foreign immigration
Source: California Department of Finance.
Embracing the status quo will force more Californians to make a critical economic tradeoff: endure grueling commutes from the outskirts of metropolitan areas to access jobs or move to states where housing costs less.
Increasingly, though, long commutes and the resulting traffic congestion are seen as contributors to greenhouse gases. Beginning with the passage of AB32 in 2006 (the state’s landmark greenhouse-gas reduction measure), state planners and lawmakers have begun to align transportation and land-use decisions in an effort to enhance the economic benefits of greenhouse-gas reduction by linking energy efficiency with housing and mobility infrastructure.

4
THE
SUPP
LY S
IDE:
DEF
ININ
G A
PATH
WAY
FO
R IN
CREA
SING
CAL
IFO
RNIA
’S H
OUS
ING
DEVE
LOPM
ENT
OPP
ORT
UNIT
IES
FIGURE 3 California climate change mitigation measures 2006-2015
AB32 California GlobalWarming Solutions Act
SB 375
AB32 requires California to reduce its GHG emmission to 1990 levels by 2020.
Establishes the state'scap-and-trade program.
Requires the state's regions to develop sustainable communities strategies that link land use, housing and transportation strategies that if implemented would satisfy GHG reduction targets.
Requires the state to generate half of its electricty from renewable energy sources and double energy ef�ciency in all buildings by 2030.
Established the CalRecycle GHG reductions Revolving Loan Fund for infrastructure projects with a GHG reduction component.
Stipulates that 25 percent of the cap-and-trade funding as estabilished in AB 32 go to projects that bene�t disadvantaged communities.
Directs the Governors OPR to develop a new approach for analyzing the transportation impact under CEQA for porjects in areas served by TOD.
SB 535
SB 350
SB 862
SB 743
Source: Milken Institute.
In 2014, the governor’s Office of Planning and Research (OPR) adopted a diminished level of service (LOS) when considering whether a proposed development fosters the efficient use of vehicles. Level of service was the traditional metric by which the state measured transportation impacts on major development projects, but in a major shift, the state has begun to look instead at vehicle impacts on the built environment. By aligning concerns regarding land use, housing, transportation, and efficiency, once managed from separate policy silos, to a more consolidated approach, state planners have signaled a need to balance transportation investments alongside housing to promote development. Yet this vision has not been fully embraced because of underutilized resources and entrenched policies and practices filtering down from the state to the local level. This results in an inconsistent approach that limits efforts to address the housing crisis.
The exodus of people and employers—including Tesla, Toyota and Comcast—to more affordable locales exacerbates the poverty and income inequality seen across the state. The migration also highlights state and local government’s disinvestment in infrastructure and embrace of anti-development restrictions. The skyrocketing cost of housing is the biggest reason California has the nation’s highest level of functional poverty, according to the Census Bureau and the Public Policy Institute of California. The state is home to some of the nation’s least affordable housing markets, a status that negatively affects renters and buyers even in the state’s most productive and economically vital areas.
Constraints on development keep prices out of reach, perpetuating the economic segregation and stagnation2. Research underscores this dynamic: “Local land-use regulations that restrict housing supply in dynamic labor markets have important externalities on the rest of the country,” perhaps limiting national GDP growth by nearly 10 percent3. Cities and metro areas contribute substantially to state and national overall economic growth. The nation’s 380-plus metros generated $14.6 trillion in GDP in 2012, or 90 percent of the total4. In addition to the economic loss from reduced productivity and shrinking household purchasing power, constraints on housing development are to blame for the deterioration of neighborhoods and the flight of young, educated workers to more affordable states.

WWW.MILKENINSTITUTE.ORG 5
DEFINING THE CHALLENG
E
FIGURE 4 Change in employment, wages, and rents from 2012–2015
35
% Change in employmentPercent % Change in wages % Change in rents
30
25
20
15
10
5
0OrangeCounty,
CA.
Bakers�eld,CA.
Fresno,CA.
Los Angeles,CA.
Oakland,CA.
VenturaCounty,
CA.
RiversideSan-Bernardino
CA.
Sacramento,CA.
San Diego,CA.
San Francisco, CA.
San Jose,CA.
Source: Trulia.
While the consequences of the housing shortage are clear, political, regulatory, and anti-development forces still impede new construction. Without a substantial increase in building, demand will continue to outstrip supply. This produces a reciprocal dynamic exacerbated by the state’s lack of effective tools to address the supply gap. The growth of cities, the presence of companies that lead the world in technological innovation, and steady immigration from abroad all point to California’s economic vibrancy. Yet domestic out-migration numbers, widening income inequality, rising poverty and the departure of some high-profile companies suggest that serious challenges threaten the economic landscape. If California is to remain a leader in innovation, entrepreneurship, and economic growth, then regional and state leaders, in collaboration with businesses, must drastically reimagine how the state thinks about land and how it invests in infrastructure.
Cities like Seattle and New York City have recently developed comprehensive housing strategies that seek to untangle similar, ineffective patchwork approaches. Noted for its market-based approach, New York’s 10-year housing plan combines incentives for growth in new supply while embracing necessary regulatory and zoning reforms as a method to use both the policy “carrot” and regulatory “stick” to build a diverse mix of housing to meet workforce demands. These guiding principles, along with increased capital to fund affordable housing stock, demonstrate that cities recognize the need to leverage today’s favorable market conditions to secure a more affordable future. Ultimately, California will need a state-level solution that encourages collaboration among public and private sectors while untangling the inconsistent framework that impedes development. The array of state and local programs—including special taxes, needs assessments, collaborative models and fees—when applied in a coordinated effort, can address housing needs while increasing supply and mitigating rising housing costs. Moreover, by leveraging value-capture models in existing investments in the built environment (such as transportation corridors, underutilized industrial or commercial space, and housing in need of retrofit and repairs) and targeting them for redevelopment or zoning changes can benefit the larger regional economies by triggering multiplier effects through induced local demand.


7WWW.MILKENINSTITUTE.ORG
III. Regulatory Tension Limits Land-UseAccording to the Legislative Analyst’s Office (LAO), housing costs in California, for both ownership and renting, continue to outpace the rest of the country, especially in coastal communities as highlighted in the Bay Area. Although the cost of housing varies, a majority of California communities are well above the U.S. average of $840 per month for rental units. Currently, statewide monthly rent is $1,240 on average, 50 percent higher than the rest of the country. Coastal metros such as San Francisco are more than double the state average and about six times higher than Bakersfield, the state’s least expensive metro5. The Public Policy Institute of Californian estimates that half of all Californian renters are paying more than 35 percent of their income on housing6. Illustrating perhaps the growing severity of this crisis both regionally and nationally, Los Angeles was ranked the eighth-least-affordable housing market in the world this year by The Economist’s Intelligence Unit. Among U.S. cities, it was second only to New York7. The high cost of housing in California is attributable to many factors, including the desirability of living in coastal areas and the ongoing shortfall in the development of new housing to keep up with growing demand.
Although housing prices affect communities and households of all incomes, the burden is greater for lower-income households and urban workers. Figure 4 illustrates the varying levels of average housing costs, as measured by percentage of monthly income, throughout the state.
FIGURE 5 Share of monthly income spent on housing, commuting, and utilities (2015)
90
80
% of monthly income spent on housing
Percent% of monthly income spent on commuting
% of monthly income spent on utilities
70
60
50
40
30
20
10
0
Orange County, CA.
Bakers�eld, C
A.
Fresno, CA.
Los Angeles, C
A.
Oakland, CA.
Ventura County, CA.
Riversid
e
San Bernardino CA.
Sacramento, C
A.
San Diego, CA.
San Francisco, C
A.
San Jose, C
A.
Source: Trulia.

8
THE
SUPP
LY S
IDE:
DEF
ININ
G A
PATH
WAY
FO
R IN
CREA
SING
CAL
IFO
RNIA
’S H
OUS
ING
DEVE
LOPM
ENT
OPP
ORT
UNIT
IES
Those who are priced out of the market benefit little from the current focus on building homes far from city centers and other areas where jobs are concentrated. For many working families, the lack of available housing—single-family houses and apartments alike—eliminates the option of living close to a job in the city center. By design, California’s housing ecosystem perpetuates the “drive until you qualify” mentality, taking new and low-income home owners and renters farther away from job centers, enabling sprawl and unsustainable open-space development. In addition to undesirable environmental consequences, this framework also stifles economic growth in the most congested urban areas and vital economic hubs. Figure 5 illustrates the estimated economic cost of congestion. Leaders have failed to reconcile the inconsistency between this reality and the state’s global environmental stewardship goals, which encourage new approaches to housing. The cumulative effect propagates continued economic deficits for the state and its industries as workers are forced into suburban areas with prolonged and inefficient commutes. Fatigue and loss of time result in lower productivity and economic output. Increased travel delays cost nearly $4 billion more in 2012 than in 20088.
Housing should be viewed not as a mechanism of consumer choice, but as a vital asset that
can either enable or hinder greater economic and social benefits for the state’s businesses,
workers, and environment.
FIGURE 6 The cost of congestion
Urban area Hours of delay per commuter
Population (thousands)
Hours of delay (thousands)
Cost of congestion ($ millions)
Washington, D.C. 82 4,920 204,375 4,560
Los Angeles 80 12,635 622,509 13,318
San Francisco/Oakland
78 3,480 146,013 3,143
New York 74 19,040 628,241 14,712
San Jose 67 1,950 104,559 2,230
Source: U.S. Department of Transportation.
The LAO estimates that in addition to the expected building (from 100,000 to 140,000 units) the state would need an additional 100,000 new units each year to begin reducing home prices and rents. The effects of the housing shortage reaches beyond the people priced out of the communities where they desire to live. On a macro level, it weakens the California economy; from a micro view, it undermines the health of the workforce, especially those who live in urban communities. Addressing the state’s high housing costs will require the active engagement from community-based stakeholders, the business community, and policymakers operating in an improved, incentive-based framework.

WWW.MILKENINSTITUTE.ORG 9
IV. Streamlining the CEQA Review and Reforming the Needs Assessment Processes As currently structured, the state’s policy and regulatory apparatus struggles to address gaps in the continuum of housing. The GHG reduction regulatory policies approved over the last decade to emphasize higher density are not fully supported by local housing and zoning priorities. This inherent tension over land use between state and local authorities has exacerbated the state’s inability to reconcile competing objectives—economic, environmental, and social—with development demands at the local level. Competing layers of bureaucracy have diminished the impact of limited state and federal funding and have added further delays to vital development projects.
Local governments contribute to the housing shortage through zoning restrictions, community opposition to development, and a lack of development incentives. Of all of the barriers to development, the California Environmental Quality Act is the prime target for criticism. Many view the law as a burden that creates lengthy delays in projects. Whether or not this reputation is warranted, regulatory frameworks like CEQA have become a common tool for anti-development groups to halt or severely delay the development-approval process. With no balancing mechanism to prevent systemic obstructionism or delays, CEQA has led to rising costs. Although only around 1 percent of projects that undergo the CEQA review process end up litigated in court, an analysis of 95 CEQA-related court opinions between 1997 and 2012 found that 56 percent of all challenges were filed against infill or redevelopment projects.9 Over the long term, without a suitable balancing mechanism to prevent such regulatory abuse by interest groups, the act may be contributing to a worsening feedback loop by contributing to the rising cost of land and, by extension, housing prices.
On the a statewide level, the Regional Housing Needs Assessment (RHNA) process provides local jurisdictions a mechanism to assess existing and forecasted growth with planned housing need. However, the RHNA planning process does not incentivize or support development at any level based on determined need. In practice, the RHNA distribution of housing need allocation among local jurisdictions reinforces sprawl development patterns—a condition highlighted in Southern California with additional suburban development planned in communities that are spread out and not necessary in proximity to transit.
FIGURE 7 Building permits by type, 2005–2015
225
2005 2006 2007 2008 2009 2010 2011 2012 2013 2014 2015
150
75
0
3000
2500
2000
1500
1000
500
0
1 unit
Total units, thousands Number of structures
2 units 3 & 4 units 5 units or more # of structures with 5 or more units
Source: U.S. Census.

10
THE
SUPP
LY S
IDE:
DEF
ININ
G A
PATH
WAY
FO
R IN
CREA
SING
CAL
IFO
RNIA
’S H
OUS
ING
DEVE
LOPM
ENT
OPP
ORT
UNIT
IES
Meanwhile, new build permits show the state is already falling well short of the current eight-year RHNA cycle targets, which established a need of roughly 1.2 million new housing units by 2020 (which translates to an annual need of nearly 150,000 new housing units a year from 2012-2020).
As the building patterns, trends and market indicators demonstrate, simply planning for or building housing stock does not translate into affordability or adequate supply. Nor does a lack of an incentive structure counterbalance higher-end market forces for low-end and middle-tier housing development. At the local level, unless projects are structured as affordable or workforce oriented by design, the private market is not incentivized to provide for the continuum without requirements like inclusionary zoning provisions.
The New York City new comprehensive housing plan stipulates all new housing projects reserve 25 percent of units for low-income residents through an inclusionary zoning provision. A key innovation in the plan establishes a link between design, planning and zoning enhancements with a mix of regulatory streamlining and incentives.
FIGURE 8 State housing need vs. production
Source: MetropolitanTransportation Commission.
Housing built 2013-2015
California Metropolitan Planning Regions
Projected need 2013-2022
Bay Area Region: San Francisco, Napa, Sonoma, Selano,Contra Costa, Alameda, San Mateo, Santa Clara
Sacramento Region: El Dorado Hills, Placerville , Sacramento, Sutter Creek, Yolo, Yuba
Fresno: Fresno
Southen California: Ventura, Los Angeles, San Bernardino, Orange, Riverside, Imperial
San Diego: San Diego
188K61K
41.5K 6.5K
118K15K
438K115K
162K25K

WWW.MILKENINSTITUTE.ORG 11
DEFINING THE CHALLENG
E STREAM
LINING THE CEQ
A REVIEW AN
D REFORM
ING THE NEEDS ASSESSM
ENT PRO
CESSES
When tracking RHNA conformity on a per-jurisdiction basis, it becomes clear that the current process of RHNA assessment and compliance does not reconcile with expressed housing demands. Figure 6 illustrates the varied landscape of current eight-year RHNA cycle throughout the state. For the RHNA process to be an effective platform from a planning-to-implementation perspective and a process that ultimately promotes development based on forecasted demand, state and local leaders should look to structure CEQA streamlining provisions for qualifying infill development projects that emphasize addressing gaps in local housing supply. CEQA streamlining, accompanied by RHNA reform that has an inclusionary zoning provision (at the low end of the spectrum) while de-emphasizing the jurisdictional allocation model, would allow for enhanced, targeted development approaches coordinated with business sectors to support job growth. The vital restructuring of policy to incentivize faster development of housing supplies will depend on further identification of available funding mechanisms and collaborative approaches.


13WWW.MILKENINSTITUTE.ORG
V. Unite Government with Market Forces to Accelerate DevelopmentAs the New York housing strategy demonstrates, cities and local jurisdictions around the country have found that when coupled with regulatory reform, incentives and special districts can be an effective tool for promoting development. Although both state and local funding levels remain below pre-recession levels, current funding for affordable housing development in California is in a period of transformation. Until recently, local redevelopment agencies were the single-largest locally generated source of funds available to communities supporting affordable housing programs10. With the loss of redevelopment tax-increment funding (TIF) in 2012, local jurisdictions across the state were left with a $1 billion hole in affordable housing funds, further coupled with diminished revenues from state and federal sources (California Department of Housing and Community Development and the U.S. Department of Housing and Urban Development) traditionally applied to support local level housing projects and assistance programs. During this period, while funding for affordable housing became severely restrained, construction and production of single-family homes and larger high-end multifamily unit levels increased, placing added pressures on the limited supply of middle-tier housing stock and exacerbating the affordability crisis at the lower end while extending the crisis to households with greater income.
FIGURE 9 State and federal housing funding resources
RDA HCD HUDUS$ Millions
007-08 08-09 09-10 10-11 11-12 12-13 03-14 14-15
500
1,000
1,500
2,000
2,500
3,000
3,500
Source: California Department of Housing and Community Development and U.S. Department of Housing and Urban Development.
The governor’s office has positioned cap-and-trade funds as a successor to funds previously allocated through the redevelopment agencies (RDA). This means that local governments can once again support and structure qualifying projects. However, in order to qualify, housing must contribute to the state’s greenhouse-gas reduction strategy (Greenhouse Gas Emission Reduction, SB862, 2014). Ways to achieve this include building near public transportation. These Transit Oriented Developments (TODs) are viewed as a vital element of the state’s strategy for reducing emissions to pre-1990 levels by 2020.

14
THE
SUPP
LY S
IDE:
DEF
ININ
G A
PATH
WAY
FO
R IN
CREA
SING
CAL
IFO
RNIA
’S H
OUS
ING
DEVE
LOPM
ENT
OPP
ORT
UNIT
IES
This change reflects a larger shift in the role of housing in shaping development patterns. Over the last four decades, policy has relied heavily on tax breaks to provide economic incentives for development, a tool that has yielded marginal returns for the public funds invested. Rather than rely on expensive private tax breaks to entice development, state and local leaders should instead look to harness the intense development pressure sweeping many of California’s metros to help recoup needed community investments and improvements through increased land value and public space. Still, the state lacks coordination in either an entity or policy that cannot only harness these disparate funding mechanisms but better plan and implement among available building patterns.
In the midst of historically low interest rates, policymakers should explore additional steps to not only preserve affordable housing, but increase overall available supply in order to moderate rising costs. This can be accomplished by leveraging current favorable market forces, existing need assessments and dedicated funding support mechanisms (at the local and state level) to create the adequate amount of housing units in the continuum. Such a coordinated effort to mobilize public policy to spur private development is needed to create and sustain statewide supply of housing available across incomes and regions.
WWW.MILKENINSTITUTE.ORG 15
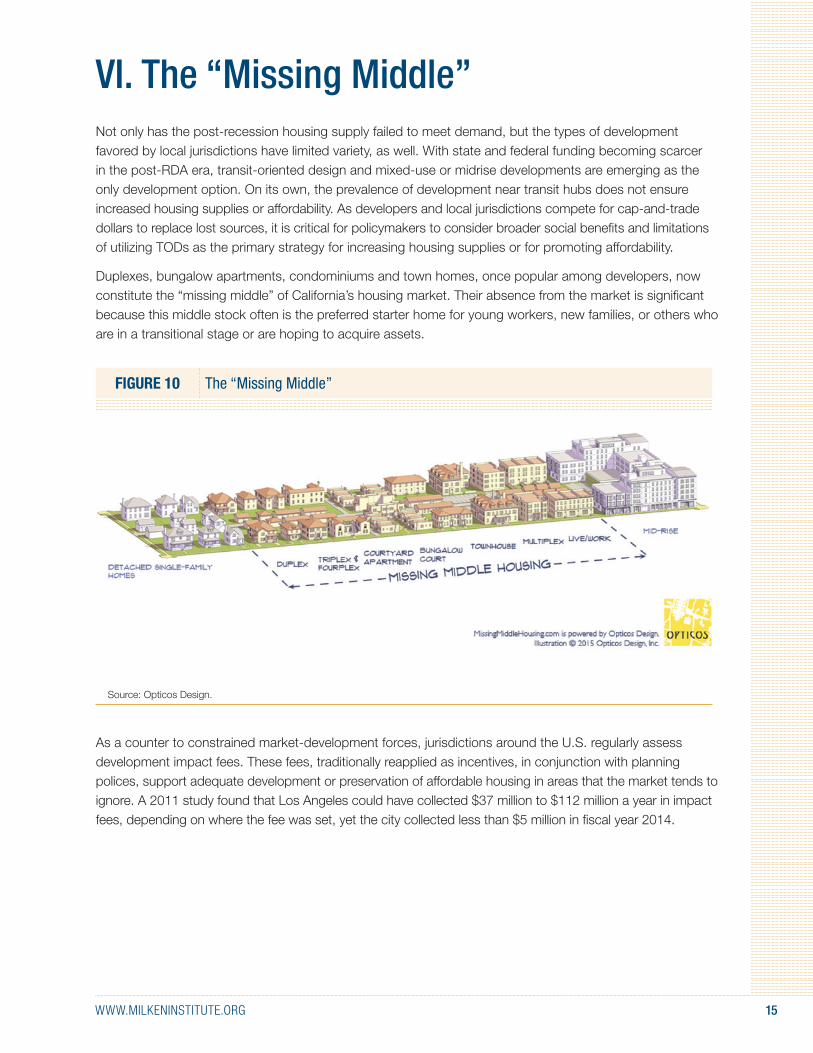
VI. The “Missing Middle”Not only has the post-recession housing supply failed to meet demand, but the types of development favored by local jurisdictions have limited variety, as well. With state and federal funding becoming scarcer in the post-RDA era, transit-oriented design and mixed-use or midrise developments are emerging as the only development option. On its own, the prevalence of development near transit hubs does not ensure increased housing supplies or affordability. As developers and local jurisdictions compete for cap-and-trade dollars to replace lost sources, it is critical for policymakers to consider broader social benefits and limitations of utilizing TODs as the primary strategy for increasing housing supplies or for promoting affordability.
Duplexes, bungalow apartments, condominiums and town homes, once popular among developers, now constitute the “missing middle” of California’s housing market. Their absence from the market is significant because this middle stock often is the preferred starter home for young workers, new families, or others who are in a transitional stage or are hoping to acquire assets.
FIGURE 10 The “Missing Middle”
Source: Opticos Design.
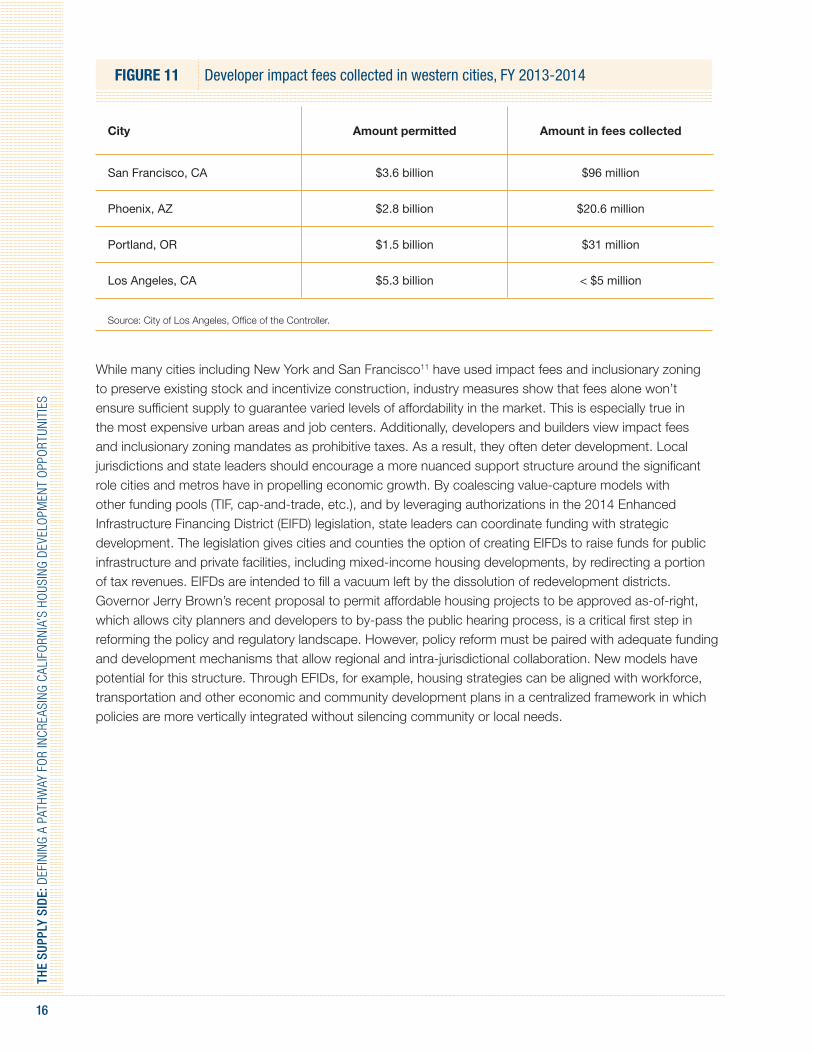
As a counter to constrained market-development forces, jurisdictions around the U.S. regularly assess development impact fees. These fees, traditionally reapplied as incentives, in conjunction with planning polices, support adequate development or preservation of affordable housing in areas that the market tends to ignore. A 2011 study found that Los Angeles could have collected $37 million to $112 million a year in impact fees, depending on where the fee was set, yet the city collected less than $5 million in fiscal year 2014.
16
THE
SUPP
LY S
IDE:
DEF
ININ
G A
PATH
WAY
FO
R IN
CREA
SING
CAL
IFO
RNIA
’S H
OUS
ING
DEVE
LOPM
ENT
OPP
ORT
UNIT
IES
FIGURE 11 Developer impact fees collected in western cities, FY 2013-2014
City Amount permitted Amount in fees collected
San Francisco, CA $3.6 billion $96 million
Phoenix, AZ $2.8 billion $20.6 million
Portland, OR $1.5 billion $31 million
Los Angeles, CA $5.3 billion < $5 million
Source: City of Los Angeles, Office of the Controller.
While many cities including New York and San Francisco11 have used impact fees and inclusionary zoning to preserve existing stock and incentivize construction, industry measures show that fees alone won’t ensure sufficient supply to guarantee varied levels of affordability in the market. This is especially true in the most expensive urban areas and job centers. Additionally, developers and builders view impact fees and inclusionary zoning mandates as prohibitive taxes. As a result, they often deter development. Local jurisdictions and state leaders should encourage a more nuanced support structure around the significant role cities and metros have in propelling economic growth. By coalescing value-capture models with other funding pools (TIF, cap-and-trade, etc.), and by leveraging authorizations in the 2014 Enhanced Infrastructure Financing District (EIFD) legislation, state leaders can coordinate funding with strategic development. The legislation gives cities and counties the option of creating EIFDs to raise funds for public infrastructure and private facilities, including mixed-income housing developments, by redirecting a portion of tax revenues. EIFDs are intended to fill a vacuum left by the dissolution of redevelopment districts. Governor Jerry Brown’s recent proposal to permit affordable housing projects to be approved as-of-right, which allows city planners and developers to by-pass the public hearing process, is a critical first step in reforming the policy and regulatory landscape. However, policy reform must be paired with adequate funding and development mechanisms that allow regional and intra-jurisdictional collaboration. New models have potential for this structure. Through EFIDs, for example, housing strategies can be aligned with workforce, transportation and other economic and community development plans in a centralized framework in which policies are more vertically integrated without silencing community or local needs.

WWW.MILKENINSTITUTE.ORG 17
VII. Mind the Gap: Aligning State and Local PoliciesDemand for the single-family home remains high as it continues to serve as the primary conduit for Americans to acquire assets. In 2005, the height of California’s housing construction boom, single-family detached homes accounted for over 65 percent of all new building permits. Post-recession, single-family homes still account for almost half of new construction, with 47 percent of permits granted in 2012 going towards single-family units. While the housing market remains strong for households seeking a single-family home, it does not ensure the affordability for homebuyers or renters. Moreover, the absence of a more diversified housing stock means that residents have fewer options. It also supports a form of development that perpetuates sprawl.
As Figure 11 illustrates, housing production in California for the last decade has focused on single-unit homes or larger multi-unit mid-to-high rises in the higher end of the market. Less than 5 percent of all production in California in any given year fell into the “missing middle” category of housing. Since 2008, recession conditions have only exacerbated the state’s ongoing neglect in addressing housing as a continuum of need. Although the production of new housing, both single-family and multi-unit, is beginning to rebound from 2008 recession levels, the market has not matched the momentum in providing similar levels of diversity or a variety of housing in the continuum that existed prior to the 2007-2008 housing crash.
FIGURE 12 New build permits by housing type
100%
2005 2006 2007 2008 2009 2010 2011 2012 2013 2014 2015
80%
60%
40%
20%
10%
0%
Percent1 unit / single family 2 units 3 & 4 units 5 units or more
Source: U.S. Census.
Although the market is strong, many communities remain averse to development, especially with respect to higher-density housing. Yet density, as a function of design, can take on a number of forms besides traditional high-rise development. Increased density is not only achievable though enhanced zoning districts and repurposing underused brownfields, but by accessing space in over-housed areas as well. Cities like Berkeley and Santa Cruz are seeking innovative solutions to meet housing challenges by encouraging Accessory Dwelling Units (ADU), commonly referred to as “in-law” or “granny flat” units. This can increase housing capacity without the risk of displacement or destruction of existing stock. Such measures could provide more options while accelerating supplies.
18
THE
SUPP
LY S
IDE:
DEF
ININ
G A
PATH
WAY
FO
R IN
CREA
SING
CAL
IFO
RNIA
’S H
OUS
ING
DEVE
LOPM
ENT
OPP
ORT
UNIT
IES
Strategic opportunities to increase density without substantial building can help meet demand while maintaining community character. Older housing stock, often located in areas rich with amenities and transportation options, are ideal for creating greater density and variety of housing, especially within the missing middle category. A balance of new production and rehabilitation of older stock will be necessary if California is to keep up with growing demand. A 2010 UCLA CityLAB study found that adding “backyard homes,” in neighborhoods zoned for single-unit houses could help Los Angeles meet its goal of adding another 100,000 housing units per year. Reforming or easing parking requirements for multi-unit buildings can also be a viable pathway towards incentivizing greater housing while lowering potential development or construction costs. A growing body of research illustrates that inefficient parking requirements, especially in dense and developed urban areas, can hinder future development as well as economic competitiveness.12 By shifting local and statewide policy to utilize urban space and public funds more strategically and more effectively through the use of infill, smart growth development, and green infrastructure, cities and the state can simultaneously address the housing crisis while upholding the state’s goal of environmental stewardship.
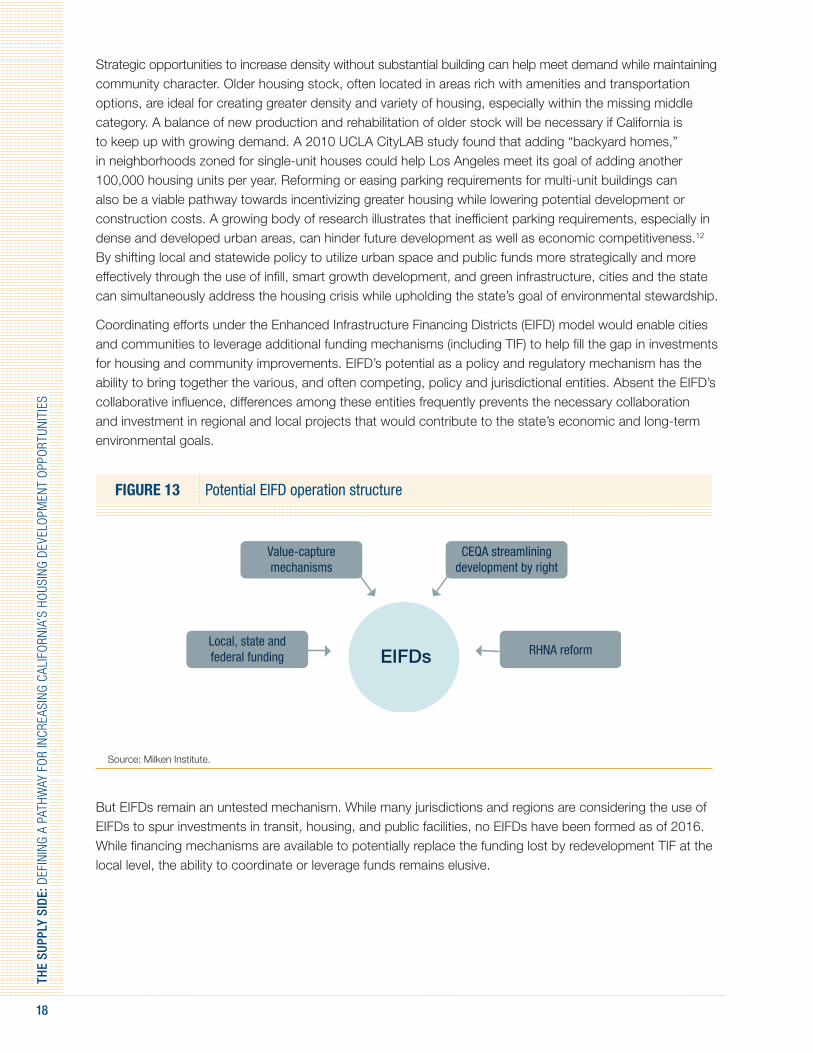
Coordinating efforts under the Enhanced Infrastructure Financing Districts (EIFD) model would enable cities and communities to leverage additional funding mechanisms (including TIF) to help fill the gap in investments for housing and community improvements. EIFD’s potential as a policy and regulatory mechanism has the ability to bring together the various, and often competing, policy and jurisdictional entities. Absent the EIFD’s collaborative influence, differences among these entities frequently prevents the necessary collaboration and investment in regional and local projects that would contribute to the state’s economic and long-term environmental goals.
FIGURE 13 Potential EIFD operation structure
EIFDs
Value-capturemechanisms
CEQA streamliningdevelopment by right
Local, state andfederal funding RHNA reform
Source: Milken Institute.
But EIFDs remain an untested mechanism. While many jurisdictions and regions are considering the use of EIFDs to spur investments in transit, housing, and public facilities, no EIFDs have been formed as of 2016. While financing mechanisms are available to potentially replace the funding lost by redevelopment TIF at the local level, the ability to coordinate or leverage funds remains elusive.

WWW.MILKENINSTITUTE.ORG 19
VIII. Conclusions and Recommendations Doing nothing all but ensures that demand for housing will continue to outstrip supply, slowing economic growth and perpetuating an unaffordable future for many of the best and brightest young workers. In short, California’s regulatory and housing development policy is inconsistent and fails to meet the state’s intended environmental stewardship goals or current housing needs. If current housing trends continue, the state’s workforce will continue to shrink and productivity will be impaired by increased traffic congestion, longer commutes and greater sprawl. These conditions will compound the negative environmental, economic and health disparities that the state is attempting to mitigate.
Luckily, the economic benefits of cultivating human capital and enhancing the built environment are no secret to business, state and local leaders. Yet the political will to secure the state’s economic future by making the necessary investments in housing and infrastructure hasn’t materialized. The solution is for state leaders to discourage historic building patterns and structure the investments in housing development that will encourage long-term job creation and reduce the need for lengthy commutes.
Ultimately, through better coordination and resource allocation, policies at the local and state level can support better linkages between regional job centers and local housing demands while conforming growth patterns to environmental priorities. By initiating regulatory reform at the regional housing needs assessment level, state and local leaders can reconcile a fractured development platform that better provides for a pathway to increased housing supply. By streamlining CEQA reviews and expediting the permitting process while easing regulatory barriers impeding development, accompanied by harnessing local value-capture mechanisms through re-zoning and upzoning strategies, local jurisdictions can leverage higher levels of investment for development. Additionally, through newly empowered EIFD’s provisions, California communities can prioritize the production of increased affordable and market-rate housing supplies on a regional collaborative level without relying upon public subsidies (tax exemptions or land swaps), project specific impact fees, or bonds to spur investments.
In order to create a housing development ecosystem that recognizes the economic and environmental benefits of higher-density, lower-cost housing closer to where people work, state leaders should consider the following:
Streamline existing CEQA review procedures to accelerate infill housing development while reforming the RHNA regulatory processes to accelerate the planning-to-development process.
» Reevaluate local zoning and land-use restrictions for long-term effects on housing development and bring policies into alignment with modern housing, environmental, and workforce needs that reflect future demand.
» Develop local and regional affordability frameworks and development approval processes that can be used to determine whether proposed projects meet local housing needs in order to help mitigate the rising housing burden.
» Enable more “development-by-right” processes at the local level for projects that meet the standard criteria for economic investments and affordability by streamlining CEQA provisions for qualifying housing projects.
» Include inclusionary zoning and low-end housing development incentives as part of the regional allocation of housing needs through a policy framework that recognizes the economic, social, and cultural benefits associated with greater density, access to jobs, and affordability.

20
THE
SUPP
LY S
IDE:
DEF
ININ
G A
PATH
WAY
FO
R IN
CREA
SING
CAL
IFO
RNIA
’S H
OUS
ING
DEVE
LOPM
ENT
OPP
ORT
UNIT
IES
Deploy new and retool existing incentive structures that harness favorable market forces to support new development while removing barriers and accelerating building for the missing middle tier of housing stock.
» Use cap-and-trade funding to leverage more investment in housing and urban infrastructure; rethink the current use of other sources of state and federal funding (i.e., TIF, Cap-and-Trade, HUD and HCD) that can be leveraged to support the continuum of housing development.
» Focus housing policy on workforce development and promote R&D with policies that recognize the need to locate housing closer to job centers.
» Structure the local value-capture model as a reciprocal funding tool to bolster low-income gaps in the continuum of housing development in highly competitive real estate markets.
Encourage the public and private sectors to work collaboratively in Enhanced Infrastructure Financing Districts in order to coordinate funding and leverage comprehensive development plans to support future growth.
» Mitigate the stifling economic effects that no-growth or limited-growth policies have on the state economic engine for growth and innovation.
» Coordinating various levels of funding to incentivize and facilitate policy frameworks that recognize the economic, social, and cultural benefits associated with greater density and affordability in housing.
» Provide a coordinated pathway toward development by allowing EFID’s to participate in the state RHNA assessment program while structuring qualifying projects to benefits from CEQA project streamlining provisions.
Through this approach, policy leaders and private developers can leverage the EIFD structure to identify barriers, align incentives with environmental stewardship priorities and strategic investments in development that are reflective of regional economic/labor demands. This EIFD model is structured to provide a coordinated and expedited development timeline between planning and project implementation, one that harnesses a local value-capture funding mechanism layered with additional sources of state and federal funds to bolster development of housing types that are missing from the market or are in inadequate supply. Moreover, through strategic application of the EFID model in major cities, metros, and revitalization districts, policy leaders and developers can mitigate the inefficiencies of the sprawl development pattern and create interconnected nodes around economic clusters that support job centers and future growth, further connecting people and providing a new pathway to the California dream.

WWW.MILKENINSTITUTE.ORG 21
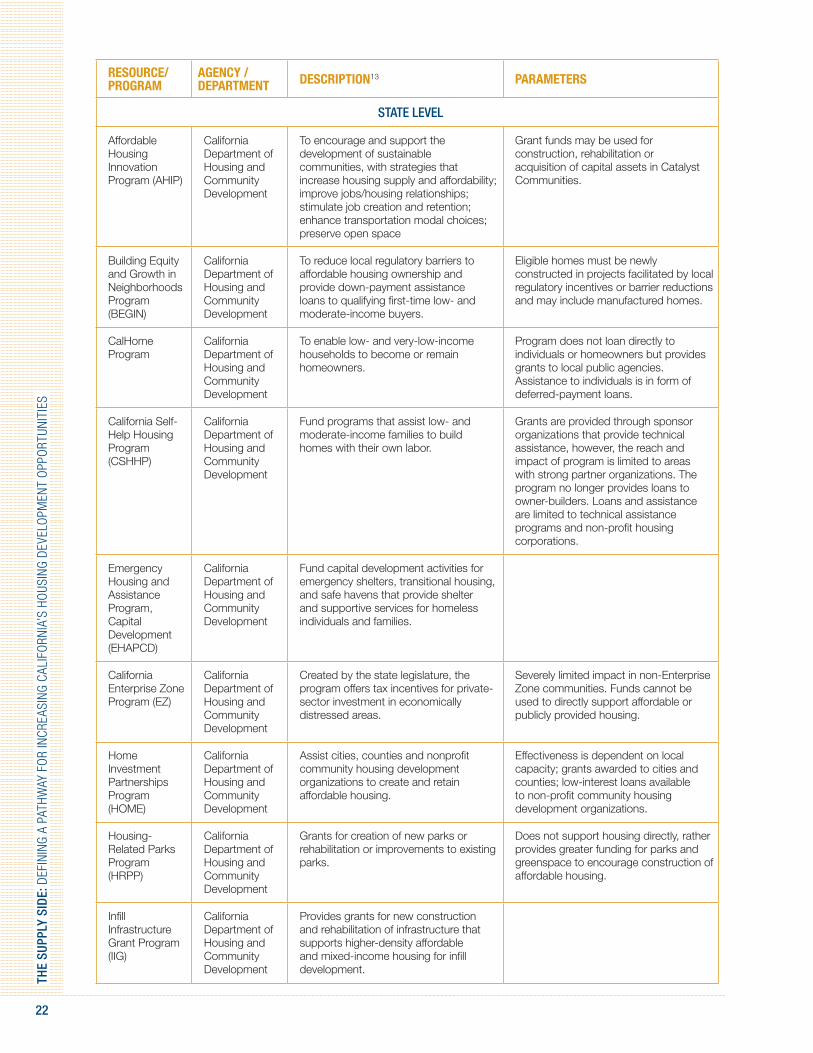
IX. Appendix Promoting housing development at a state, regional and local level will ultimately depend on the coordination from a variety of state and federal programs, existing state statutory elements and programs, as well as local resources and agencies. A snapshot of those program elements, statutory elements and agency resources are listed below.
RESOURCE/PROGRAM
AGENCY / DEPARTMENT DESCRIPTION13 PARAMETERS
FEDERAL LEVEL
Community Development Block Grant (CDBG)
U.S. Department of Housing and Urban Development
Annual federal grants provided on a formula basis to entitlement communities. Funds can be used for a variety of housing (excluding new construction) and community development purposes.
Limited funds available based on congressional budget levels. Strict income targeting requirements. Cannot be used for new housing construction or income payments (e.g. rent subsidies).
Green Retrofit Program for Multifamily Housing
U.S. Department of Housing and Urban Development
Grants and loans through HUD’s Office of Affordable Housing Preservation (OAHP) for eligible property owners to make green retrofit investments in the property to ensure the maintenance and preservation of the property.
All eligible owners submitting complete applications are accepted on a first-come, first-served basis subject to certain limitations by category.
HOME Investment Partnerships Program (HOME)
U.S. Department of Housing and Urban Development
Provides federal grants to states and designated localities by formula to provide affordable housing to low- and very-low-income households. HOME is funded through largest federal block grant to state and local governments.
Limited funds available based on congressional budget levels. Strict income targeting requirements. Activities causing displacement triggers costly Uniform Relocation Act payments. Davis-Bacon wage rates required. May not be used to assist public housing projects.
Low-Income Housing Tax Credits
Department of Treasury
Developers who receive awards of low-income housing tax credits (“LIHTCs”) sell the credits to private investors who use them to offset tax liabilities. The funds generated by sale of the credits are used to develop or preserve affordable housing for income-eligible residents.
Acquisition costs may to be eligible for credits under certain circumstances, including ownership changes within 10 years. Should a project not comply with all federal regulations under the tax code, credits may be recaptured. Volatility in the national credit markets impacts the sale and pricing of tax credits.
New Markets Tax Credit (NMTC)
Department of Treasury
Designed to spur revitalization efforts in low-income and impoverished communities.
Limited to qualifying census tracts.
Section 108 Loans
U.S. Department of Housing and Urban Development
The loan guarantee provision of the CDBG program, which provides communities with a source of financing for economic development, housing construction and rehabilitation, public facilities, and large-scale physical development projects.
Limited funds available based on congressional budget levels.
The National Housing Trust Fund (NHTF)
U.S. Department of Housing and Urban Development
The intent of this never-funded program is to complement existing federal, state and local efforts to increase and preserve the supply of safe, affordable housing for extremely low- and very-low-income households, including homeless families.
The NHTF was created in 2012, but to date has not been funded.
22
THE
SUPP
LY S
IDE:
DEF
ININ
G A
PATH
WAY
FO
R IN
CREA
SING
CAL
IFO
RNIA
’S H
OUS
ING
DEVE
LOPM
ENT
OPP
ORT
UNIT
IES
RESOURCE/PROGRAM
AGENCY / DEPARTMENT DESCRIPTION13 PARAMETERS
STATE LEVEL
Affordable Housing Innovation Program (AHIP)
California Department of Housing and Community Development
To encourage and support the development of sustainable communities, with strategies that increase housing supply and affordability; improve jobs/housing relationships; stimulate job creation and retention; enhance transportation modal choices; preserve open space
Grant funds may be used for construction, rehabilitation or acquisition of capital assets in Catalyst Communities.
Building Equity and Growth in Neighborhoods Program (BEGIN)
California Department of Housing and Community Development
To reduce local regulatory barriers to affordable housing ownership and provide down-payment assistance loans to qualifying first-time low- and moderate-income buyers.
Eligible homes must be newly constructed in projects facilitated by local regulatory incentives or barrier reductions and may include manufactured homes.
CalHome Program
California Department of Housing and Community Development
To enable low- and very-low-income households to become or remain homeowners.
Program does not loan directly to individuals or homeowners but provides grants to local public agencies. Assistance to individuals is in form of deferred-payment loans.
California Self-Help Housing Program (CSHHP)
California Department of Housing and Community Development
Fund programs that assist low- and moderate-income families to build homes with their own labor.
Grants are provided through sponsor organizations that provide technical assistance, however, the reach and impact of program is limited to areas with strong partner organizations. The program no longer provides loans to owner-builders. Loans and assistance are limited to technical assistance programs and non-profit housing corporations.
Emergency Housing and Assistance Program, Capital Development (EHAPCD)
California Department of Housing and Community Development
Fund capital development activities for emergency shelters, transitional housing, and safe havens that provide shelter and supportive services for homeless individuals and families.
California Enterprise Zone Program (EZ)
California Department of Housing and Community Development
Created by the state legislature, the program offers tax incentives for private-sector investment in economically distressed areas.
Severely limited impact in non-Enterprise Zone communities. Funds cannot be used to directly support affordable or publicly provided housing.
Home Investment Partnerships Program (HOME)
California Department of Housing and Community Development
Assist cities, counties and nonprofit community housing development organizations to create and retain affordable housing.
Effectiveness is dependent on local capacity; grants awarded to cities and counties; low-interest loans available to non-profit community housing development organizations.
Housing-Related Parks Program (HRPP)
California Department of Housing and Community Development
Grants for creation of new parks or rehabilitation or improvements to existing parks.
Does not support housing directly, rather provides greater funding for parks and greenspace to encourage construction of affordable housing.
Infill Infrastructure Grant Program (IIG)
California Department of Housing and Community Development
Provides grants for new construction and rehabilitation of infrastructure that supports higher-density affordable and mixed-income housing for infill development.

WWW.MILKENINSTITUTE.ORG 23
APPENDIX
RESOURCE/PROGRAM
AGENCY / DEPARTMENT DESCRIPTION13 PARAMETERS
Joe Serna, Jr. Farmworker Housing Grant Program (Serna)
California Department of Housing and Community Development
Finance the new construction, rehabilitation and acquisition of owner-occupied and rental units for agricultural workers, with a priority for lower-income households.
Grants and loans are limited to projects that can qualify for 100 percent match.
Multifamily Housing Program (MHP)
California Department of Housing and Community Development
Assist the new construction, rehabilitation and preservation of permanent and transitional rental housing for lower-income households.
Projects are not eligible if construction has commenced as of the application date, or if they are receiving 9 percent federal low-income housing tax credits.
Predevelopment Loan Program (PDLP)
California Department of Housing and Community Development
Short-term predevelopment capital loans to finance the start of low-income housing projects.
Maximum loan amount for purposes other than site option or site purchase is $100,000.
State Community Development Block Grant Program (CDBG)
California Department of Housing and Community Development
Provide funding to develop viable urban livable communities through decent housing and economic opportunities.
Only assigned to local jurisdictions in support of housing element needs, dependent on local jurisdiction to have adequate and relevant affordable housing element as part of general plan.
Transit-Oriented Development Housing Program (TOD)
California Department of Housing and Community Development
Low-interest loans for gap financing on TODs that include affordable units.
Limitations on viable TOD sites that can remain affordable and advantageous for low-income residents.
Cap-and-Trade Program
California Environmental Protection Agency/Air Resources Board
Market-based regulation designed to reduce greenhouse gasses by creating incentives to reduce emissions by the selling carbon emissions permits.
Funds raised by cap-and-trade can only be applied to housing if it can be proven to be an effective strategy to reduce greenhouse gases, i.e., TOD or sustainable construction and design.
Regional Housing Needs Assessment (RHNA)
California Department of Housing and Community Development
HCD assesses for Councils of Governments (COG) based on Department of Finance population projections and regional population forecasts used in preparing regional transportation plans. The COG develops a Regional Housing Need Allocation Plan (RHNA-Plan). The RHNA-Plan should promote the following objectives:
increase the housing supply and the mix of housing types, tenure, and affordability in all cities and counties within the region in an equitable manner;
promote infill development and socioeconomic equity, the protection of environmental and agricultural resources, and encourage efficient development patterns;
promote improved intraregional relationship between jobs and housing.
Housing element law recognizes the most critical decisions regarding housing development occur at the local level within the context of the periodically updated general plan. The RHNA-Plan component of the general plan requires local governments to balance the need for growth, including the need for additional housing, against other competing local interests. The RHNA-Plan process of housing element law promotes the state’s interest in encouraging open markets and providing opportunities for the private sector to address the state’s housing demand, while leaving the ultimate decision about how and where to plan for growth at the regional and local levels. The process maintains local control over where and what type of development should occur in local communities while providing the opportunity for the private sector to meet market demand.

24
THE
SUPP
LY S
IDE:
DEF
ININ
G A
PATH
WAY
FO
R IN
CREA
SING
CAL
IFO
RNIA
’S H
OUS
ING
DEVE
LOPM
ENT
OPP
ORT
UNIT
IES
RESOURCE/PROGRAM
AGENCY / DEPARTMENT DESCRIPTION13 PARAMETERS
REGIONAL LEVEL
Councils of Governments (COGs)
City and county governments
The state’s 37 COGs vary widely. Some are federally designated Metropolitan Planning Organizations (MPOs) responsible for developing regional transportation plans under federal law and sustainable communities strategies under state law, while others are transportation providers. A COG can be created by local governments to address a wide range of issues.
COGs engage in regional planning and program implementation on a wide variety of issues, including transportation, housing, the economy, energy, and the environment. As such, they are uniquely positioned to build consensus across political boundaries and create important efficiencies for local governments.
California Transportation Commission (CTC)
State and county agencies
Charged with creating a single transportation policy, the CTC replaced and assumed the responsibilities of four independent bodies: the California Highway Commission, the State Transportation Board, the State Aeronautics Board, and the California Toll Bridge Authority.
The commission is responsible for the programming and allocating of funds for highway, passenger rail and transit improvements. The commission also advises and assists the secretary of the California State Transportation Agency and the Legislature in formulating and evaluating state policies and plans for California’s transportation programs. The commission also participates in the initiation and development of state and federal legislation that seeks to secure financial stability for transportation needs.
Metropolitan Planning Organizations (MPOs) and Regional Transportation Planning Agencies (RTPA’s)
A Metropolitan Planning Organization (MPO) has authority and responsibility for transportation policy in metropolitan planning areas. Federal legislation requires that any urbanized area (UZA) with a population greater than 50,000 have an MPO. MPOs also cooperate with state and public transportation operators to set spending levels for federal funds that are meant for transportation projects.
Because MPOs typically neither own nor operate the transportation systems they serve, most MPOs will not be involved in implementing the transportation project priorities they establish. Rather, MPOs serve an overall coordination and consensus-building role in planning and programming funds for projects and operations. The MPO must involve local transportation providers in the planning process by including transit agencies, state and local highway departments, airport authorities, maritime operators, rail-freight operators, Amtrak, port operators, private providers of public transportation, and others within the MPO region.
Special Districts City and county governments
Special districts are created by local communities to meet a specific need. Inadequate tax bases and competing demands for existing taxes make it difficult for cities and counties to provide a full range of services that citizens desire. When residents or landowners want new services or higher levels of existing services, they can form a district to pay for and administer them.
Nearly 85 percent of California’s special districts perform a single function such as sewage, water, fire protection, pest abatement or cemetery management. Special districts are primarily accountable to the voters who elect their boards of directors and the customers who use their services. However, although they are not functions of the state, the state also provides critical oversight to special district operations. Special districts must submit annual financial reports to the state controller and must also follow state laws pertaining to public meetings, bonded debt, record keeping and elections.

WWW.MILKENINSTITUTE.ORG 25
APPENDIX
RESOURCE/PROGRAM
AGENCY / DEPARTMENT DESCRIPTION13 PARAMETERS
Redevelopment Agencies (Successor)
Special districts, city and county governments
Successor agencies manage remaining redevelopment projects, make payments on enforceable obligations, and dispose of redevelopment assets and properties. Each successor agency has an oversight board composed of representatives from the local agencies that serve the redevelopment project area. These are the city, county, special districts, and K-14 educational agencies.
Oversight board members have a fiduciary responsibility to holders of enforceable obligations, as well as to the local agencies that would benefit from property tax distributions from the former redevelopment project area.
Enhanced Infrastructure Financing Districts
Special districts, city and county government
Enhanced Infrastructure Financing Districts that can be established within a city or county and used to finance a variety of public infrastructure projects. EFIDs can access TIF funding from consenting jurisdictions and are authorized to combine TIF funding with other permitted local and state funding sources.
EIFDs are not permitted to fund facilities or development for schools.


27WWW.MILKENINSTITUTE.ORG
X. Endnotes1. California Legislative Analyst Office report, California’s High Housing Costs: Causes and Consequences,
2015: LAO report 2015: http://www.lao.ca.gov/reports/2015/finance/housing-costs/housing-costs.aspx
2. Michael C. Lens and Paavo Monkkonen: Do Strict Land Use Regulation Make Metropolitan Areas More Segregated by Income-January 2016 UCLA , Luskin School of Public Affairs, Journal of the American Planning Association.
3. Chang-Tai Hsieh, Enrico Moretti: Why do Cities Matter: Local Growth and Aggregate Growth, 2015: http://faculty.chicagobooth.edu/chang-tai.hsieh/research/growth.pdf
4. Ibid.
5. Legislative Analyst’s Office Report, California’s High Housing Costs: Causes and Consequences, 2015
6. Public Policy Institute of California report, “California’s Future – Housing,” Jan 2016: http://www.ppic.org/content/pubs/report/R_116HJ2R.pdf
7. The Economist Intelligence Unit, “Worldwide Cost of Living 2016,” 2016: http://bit.ly/29Cfkhc
8. Reason Foundation, “Traffic Congestion and the Economic Decline of Cities,”http://reason.org/news/show/traffic-congestion-and-the-economic#sthash.0q3oVOlF.dpuf
9. Erin Coe, January 2013: LAW 360: http://www.law360.com/articles/408307/ceqa-suits-may-be-minimal-but-delays-remain-a-concern
10. California’s Tax Increment Financing provided $1.7 billion in funding for affordable housing for the 2005-2006 and 2006-2007 fiscal years. In that same timeframe, Low Income Housing Tax Credits provided over $3.7 billion in financing and $5.2 billion in housing vouchers. Although LIHTC far exceeds the total amount of funds generated through Redevelopment in that year, TIF was the single largest source of funds generated within California. Kroll, Cynthia A.; Singa, Krute; & Wyant, Jenny. (2009). Housing in California’s Future—Nature of the Problem and Priorities for Action. Fisher Center for Real Estate & Urban Economics. UC Berkeley: Fisher Center for Real Estate and Urban Economics. Retrieved from: http://escholarship.org/uc/item/3665d116”
11. In 2012 San Francisco area voters passed Prop C, the Affordable Housing trust Fund. After the dissolution of the local Redevelopment Agency (RDA), the trust fund was established to capture local funding streams which would then be applied to help subsidize affordable housing: http://www.sfhac.org/policy-advocacy/affordable-housing-trust-fund/
12. Shoup, Donald, The High Cost of Free Parking, 2011: http://www.uctc.net/research/papers/351.pdf Descriptions derived from following sources: California Special Districts Association: http://www.csda.net/special-districts/ U.S. Department of Transportation, Federal Highways Administration: http://www.fhwa.dot.gov/planning/publications/briefing_book/part01.cfm#Toc420927561; California Transportation Commission: http://www.catc.ca.gov/ California Association of Councils of Governments: http://www.calcog.org/index.aspx?NID=35 California Department of Housing and Community Development: http://www.hcd.ca.gov/

28
THE
SUPP
LY S
IDE:
DEF
ININ
G A
PATH
WAY
FO
R IN
CREA
SING
CAL
IFO
RNIA
’S H
OUS
ING
DEVE
LOPM
ENT
OPP
ORT
UNIT
IES
About the AuthorsCarlo De La Cruz is a program associate at the Milken Institute California Center. His work focuses on workforce development, regional governance and the jobs-housing-transit balance through the Institute’s San Francisco Bay Area-based advocacy effort.
Prior to joining the Institute, De La Cruz worked in the Bay Area for over 10 years, working for and partnering with public agencies, affordable housing developers, community foundations and local nonprofits. During his tenure at the Association of Bay Area Governments, he managed and published a joint research initiative with the region’s metropolitan planning organization and Resources for Community Development that analyzed the environmental and economic benefits of locating affordable housing near transit and walkable communities.
A double graduate of the University of California, Berkeley, De La Cruz received a bachelor’s degree in Asian American studies and history of art and a master’s in city planning.
Matt Horton is an associate director of the Milken Institute California Center. In that capacity, he interacts with government officials, business leaders and other key stakeholders to provide outreach and support for California research and policy efforts while developing programming and coordinating Forums, briefings and stakeholder meetings. He also monitors policy developments at the local, state and federal levels for their potential impact on the state’s position as a global economic leader. Horton works to enhance the California Center’s statewide impact and its efforts to promote best practices.
Previously, he worked for the Southern California Association of Governments, the nation’s largest metropolitan planning organization. Horton served as the primary point of contact for external affairs with elected officials as well as sub regional, state and federal stakeholders in Los Angeles and Orange counties while helping leaders in Southern California develop plans to address growth and improve quality of life.

1250 Fourth StreetSanta Monica, CA 90401Phone: 310-570-4600
E-mail: [email protected] • www.milkeninstitute.org
1101 New York Avenue NW, Suite 620Washington, DC 20005Phone: 202-336-8930
137 Market Street #10-02Singapore 048943Phone: 65-9457-0212