The Super-Majors: Shareholder Value Creation 2001-2011 · The Super-Majors: Shareholder Value...
41
The Super-Majors: Shareholder Value Creation 2001-2011 University of Houston, C.T. Bauer College of Business Student Research Project This report is developed solely for the purpose of class discussion. Cases and reports do not represent endorsements by the faculty or the C.T. Bauer College of Business on effective or ineffective management.
Transcript of The Super-Majors: Shareholder Value Creation 2001-2011 · The Super-Majors: Shareholder Value...
The Super-Majors:
Shareholder Value Creation 2001-2011
University of Houston, C.T. Bauer College of Business
Student Research Project
This report is developed solely for the purpose of class discussion. Cases and reports do not represent endorsements by the faculty or the C.T. Bauer College of Business on effective or ineffective
management.
Super-majors Shareholder Value Creation
1. Introduction
a. Research Objectives This report documents the findings of a research project undertaken by students in the C.T. Bauer School of Business MBA program at the University of Houston.
The purpose of the project was to understand how Super-Majors have created value for the shareholders and other stakeholders in the past, and how they intend to create value in the future
The intent has been to create a vehicle that will integrate the capabilities within the C.T. Bauer School of top tier academic insights and techniques with experience-based knowledge of the challenges facing energy companies. Through this integration and our long time frame looking back and forward ten years, we hope to provide a set of analyses and commentaries that will complement existing reports available from financial institutions and will be useful both to financial institutions and to the companies studied
Our plan is to follow this report with others addressing the value creation models of different sectors of the industry (e.g., National Oil Companies, independents, refiners, midstream players), in each case updating prior analyses while detailing the new sector. Further, we hope that these reports will deepen the relationship between the University of Houston and energy companies in Houston and beyond, creating opportunities for dialog and mutual benefit.
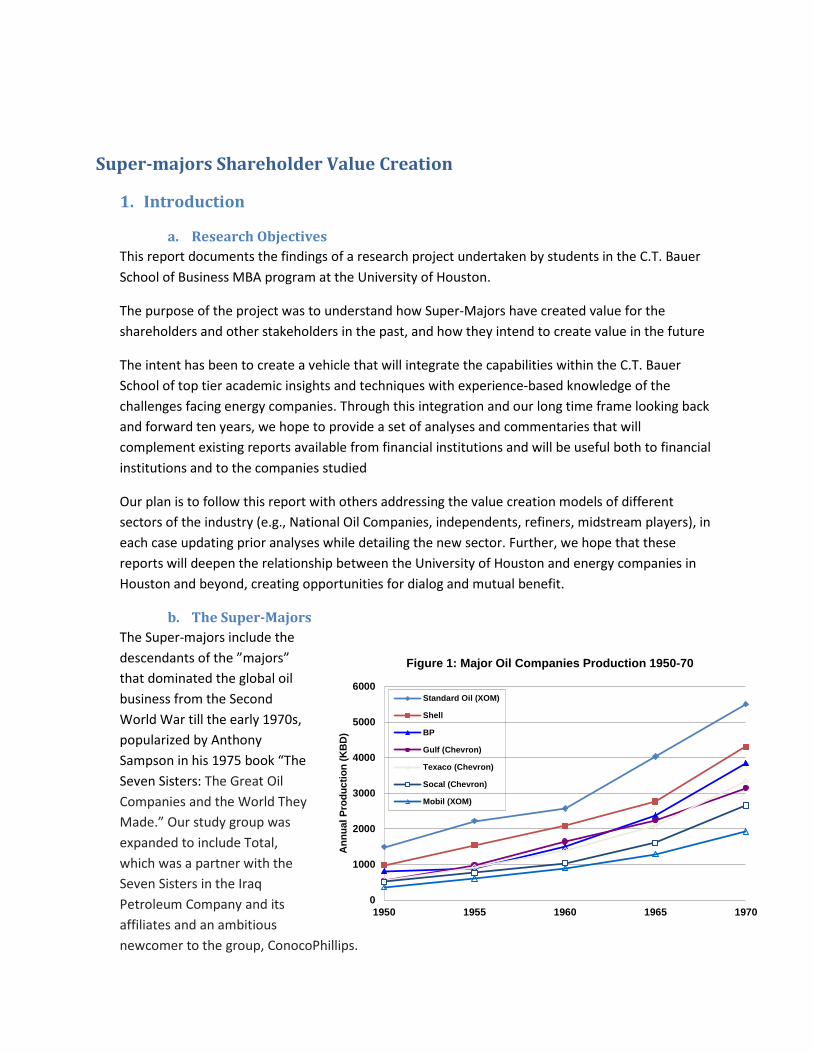
b. The Super-Majors The Super-majors include the descendants of the ”majors” that dominated the global oil business from the Second World War till the early 1970s, popularized by Anthony Sampson in his 1975 book “The Seven Sisters: The Great Oil Companies and the World They Made.” Our study group was expanded to include Total, which was a partner with the Seven Sisters in the Iraq Petroleum Company and its affiliates and an ambitious newcomer to the group, ConocoPhillips.
0
1000
2000
3000
4000
5000
6000
1950 1955 1960 1965 1970
Ann
ual P
rodu
ctio
n (K
BD
)
Figure 1: Major Oil Companies Production 1950-70
Standard Oil (XOM)
Shell
BP
Gulf (Chevron)
Texaco (Chevron)
Socal (Chevron)
Mobil (XOM)
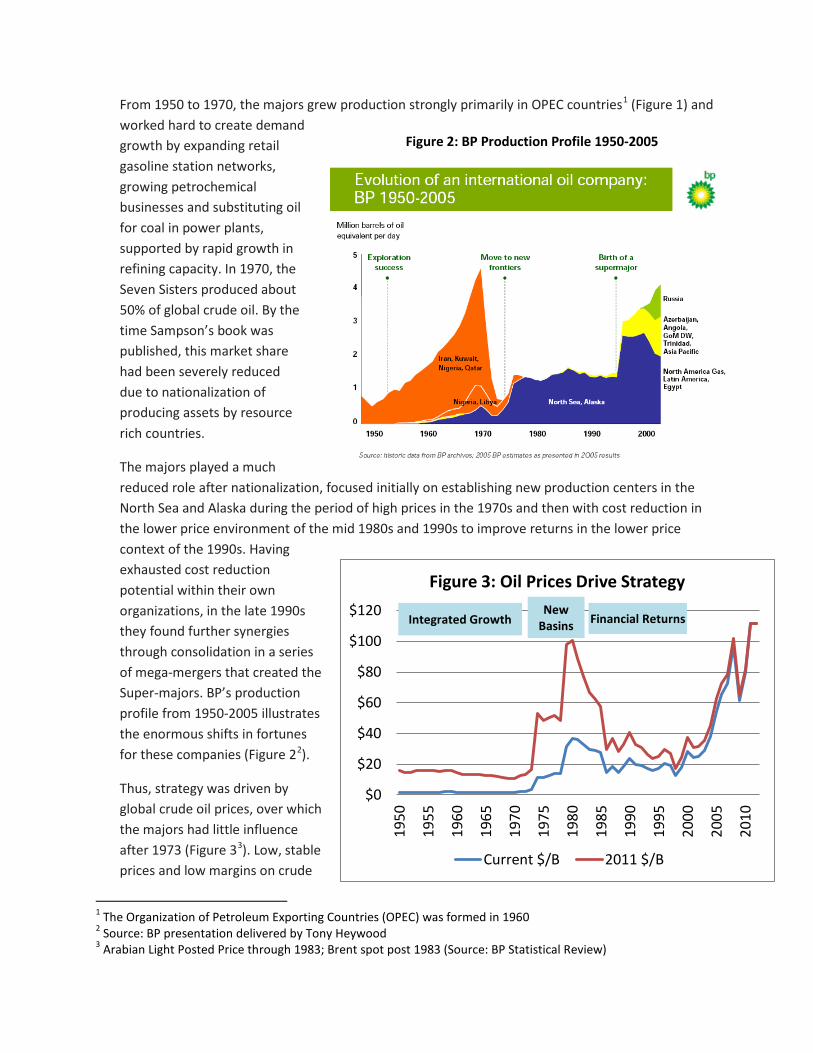
From 1950 to 1970, the majors grew production strongly primarily in OPEC countries1 (Figure 1) and worked hard to create demand growth by expanding retail gasoline station networks, growing petrochemical businesses and substituting oil for coal in power plants, supported by rapid growth in refining capacity. In 1970, the Seven Sisters produced about 50% of global crude oil. By the time Sampson’s book was published, this market share had been severely reduced due to nationalization of producing assets by resource rich countries.
The majors played a much reduced role after nationalization, focused initially on establishing new production centers in the North Sea and Alaska during the period of high prices in the 1970s and then with cost reduction in the lower price environment of the mid 1980s and 1990s to improve returns in the lower price context of the 1990s. Having exhausted cost reduction potential within their own organizations, in the late 1990s they found further synergies through consolidation in a series of mega-mergers that created the Super-majors. BP’s production profile from 1950-2005 illustrates the enormous shifts in fortunes for these companies (Figure 22).
Thus, strategy was driven by global crude oil prices, over which the majors had little influence after 1973 (Figure 33). Low, stable prices and low margins on crude
1 The Organization of Petroleum Exporting Countries (OPEC) was formed in 1960 2 Source: BP presentation delivered by Tony Heywood 3 Arabian Light Posted Price through 1983; Brent spot post 1983 (Source: BP Statistical Review)
Figure 2: BP Production Profile 1950-2005
$0
$20
$40
$60
$80
$100
$120
1950
1955
1960
1965
1970
1975
1980
1985
1990
1995
2000
2005
2010
Figure 3: Oil Prices Drive Strategy
Current $/B 2011 $/B
Integrated Growth New
Basins Financial Returns
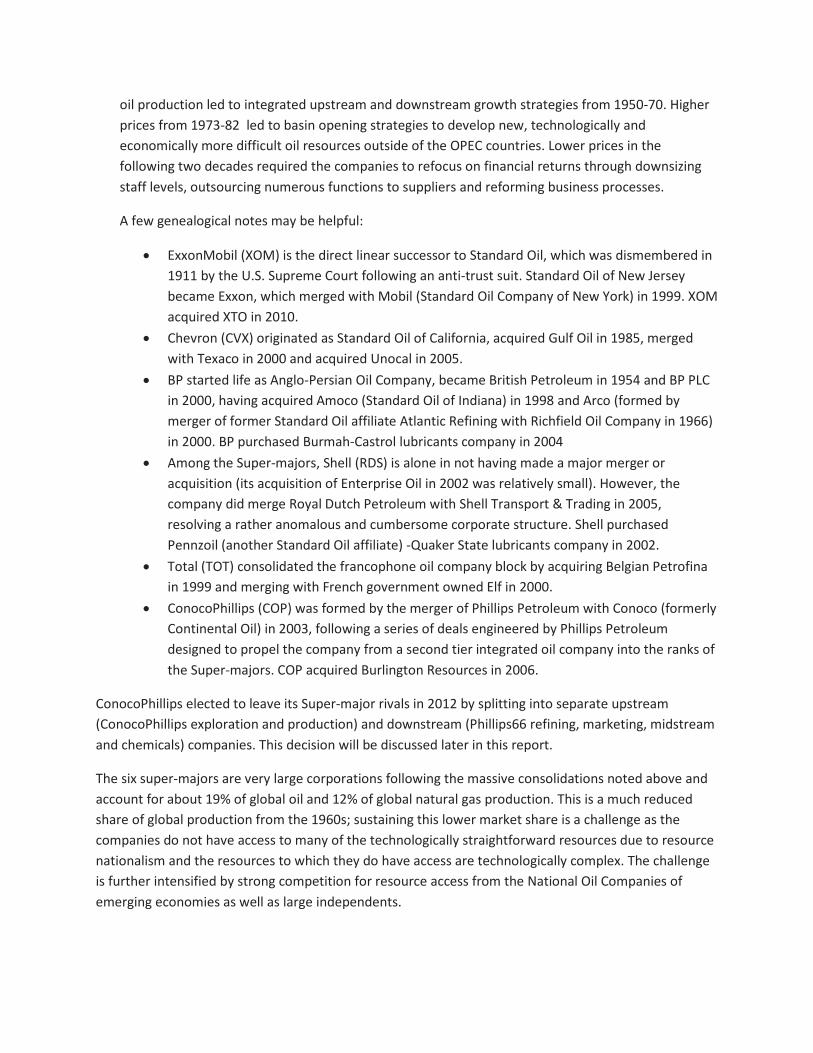
oil production led to integrated upstream and downstream growth strategies from 1950-70. Higher prices from 1973-82 led to basin opening strategies to develop new, technologically and economically more difficult oil resources outside of the OPEC countries. Lower prices in the following two decades required the companies to refocus on financial returns through downsizing staff levels, outsourcing numerous functions to suppliers and reforming business processes.
A few genealogical notes may be helpful:
• ExxonMobil (XOM) is the direct linear successor to Standard Oil, which was dismembered in 1911 by the U.S. Supreme Court following an anti-trust suit. Standard Oil of New Jersey became Exxon, which merged with Mobil (Standard Oil Company of New York) in 1999. XOM acquired XTO in 2010.
• Chevron (CVX) originated as Standard Oil of California, acquired Gulf Oil in 1985, merged with Texaco in 2000 and acquired Unocal in 2005.
• BP started life as Anglo-Persian Oil Company, became British Petroleum in 1954 and BP PLC in 2000, having acquired Amoco (Standard Oil of Indiana) in 1998 and Arco (formed by merger of former Standard Oil affiliate Atlantic Refining with Richfield Oil Company in 1966) in 2000. BP purchased Burmah-Castrol lubricants company in 2004
• Among the Super-majors, Shell (RDS) is alone in not having made a major merger or acquisition (its acquisition of Enterprise Oil in 2002 was relatively small). However, the company did merge Royal Dutch Petroleum with Shell Transport & Trading in 2005, resolving a rather anomalous and cumbersome corporate structure. Shell purchased Pennzoil (another Standard Oil affiliate) -Quaker State lubricants company in 2002.
• Total (TOT) consolidated the francophone oil company block by acquiring Belgian Petrofina in 1999 and merging with French government owned Elf in 2000.
• ConocoPhillips (COP) was formed by the merger of Phillips Petroleum with Conoco (formerly Continental Oil) in 2003, following a series of deals engineered by Phillips Petroleum designed to propel the company from a second tier integrated oil company into the ranks of the Super-majors. COP acquired Burlington Resources in 2006.
ConocoPhillips elected to leave its Super-major rivals in 2012 by splitting into separate upstream (ConocoPhillips exploration and production) and downstream (Phillips66 refining, marketing, midstream and chemicals) companies. This decision will be discussed later in this report.
The six super-majors are very large corporations following the massive consolidations noted above and account for about 19% of global oil and 12% of global natural gas production. This is a much reduced share of global production from the 1960s; sustaining this lower market share is a challenge as the companies do not have access to many of the technologically straightforward resources due to resource nationalism and the resources to which they do have access are technologically complex. The challenge is further intensified by strong competition for resource access from the National Oil Companies of emerging economies as well as large independents.
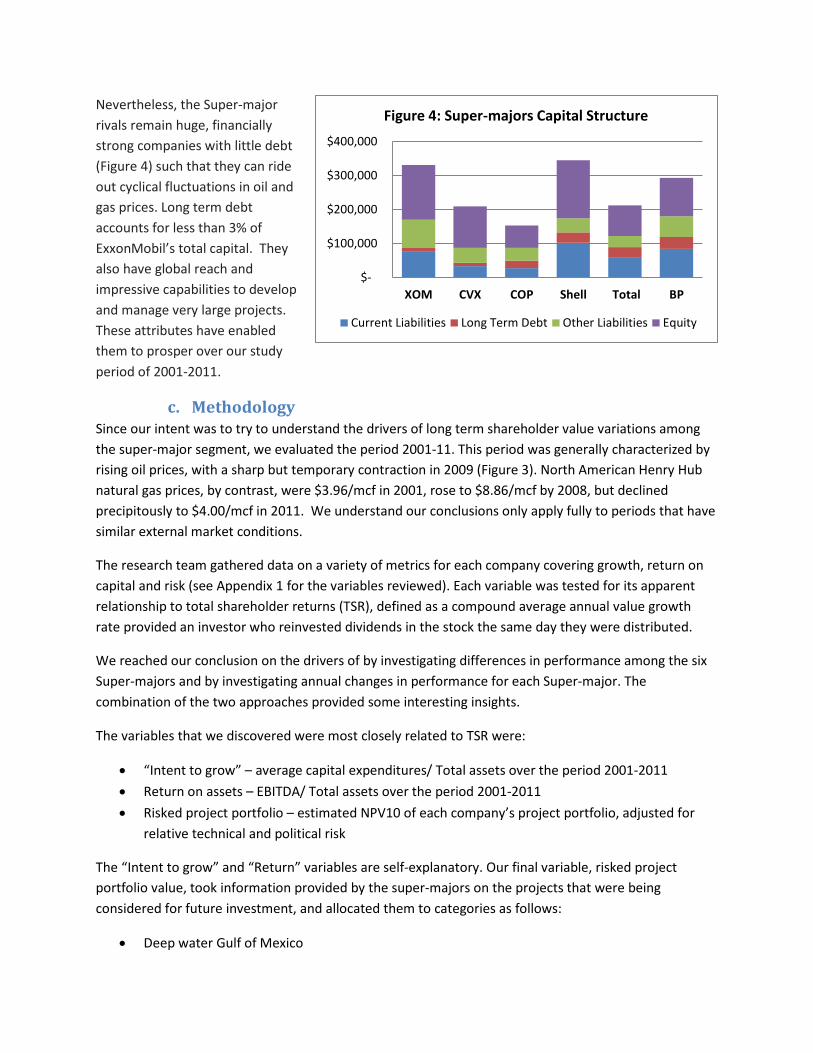
Nevertheless, the Super-major rivals remain huge, financially strong companies with little debt (Figure 4) such that they can ride out cyclical fluctuations in oil and gas prices. Long term debt accounts for less than 3% of ExxonMobil’s total capital. They also have global reach and impressive capabilities to develop and manage very large projects. These attributes have enabled them to prosper over our study period of 2001-2011.
c. Methodology Since our intent was to try to understand the drivers of long term shareholder value variations among the super-major segment, we evaluated the period 2001-11. This period was generally characterized by rising oil prices, with a sharp but temporary contraction in 2009 (Figure 3). North American Henry Hub natural gas prices, by contrast, were $3.96/mcf in 2001, rose to $8.86/mcf by 2008, but declined precipitously to $4.00/mcf in 2011. We understand our conclusions only apply fully to periods that have similar external market conditions.
The research team gathered data on a variety of metrics for each company covering growth, return on capital and risk (see Appendix 1 for the variables reviewed). Each variable was tested for its apparent relationship to total shareholder returns (TSR), defined as a compound average annual value growth rate provided an investor who reinvested dividends in the stock the same day they were distributed.
We reached our conclusion on the drivers of by investigating differences in performance among the six Super-majors and by investigating annual changes in performance for each Super-major. The combination of the two approaches provided some interesting insights.
The variables that we discovered were most closely related to TSR were:
• “Intent to grow” – average capital expenditures/ Total assets over the period 2001-2011 • Return on assets – EBITDA/ Total assets over the period 2001-2011 • Risked project portfolio – estimated NPV10 of each company’s project portfolio, adjusted for
relative technical and political risk
The “Intent to grow” and “Return” variables are self-explanatory. Our final variable, risked project portfolio value, took information provided by the super-majors on the projects that were being considered for future investment, and allocated them to categories as follows:
• Deep water Gulf of Mexico
$-
$100,000
$200,000
$300,000
$400,000
XOM CVX COP Shell Total BP
Figure 4: Super-majors Capital Structure
Current Liabilities Long Term Debt Other Liabilities Equity
• Deep water projects under production sharing agreements • Canadian oil sands and other extra-heavy oil projects • International LNG projects (including international gas pipeline projects) • North American oil shales • North American gas shales • Other conventional oil and gas projects
Using a set of generic project cash flow models developed at the C.T. Bauer School of Business, a representative NPV10 per barrel of estimated oil equivalent ultimate recovery was attributed to each project category. Each project was assigned a score of technical risk based on complexity (LNG high) and subsurface (deep water high), and on political risk based on Transparency International’s corruption index. The future project portfolio NPV10 value was adjusted upwards (for relatively low risk) or downwards (for relatively high risk) and the result was divided by the total company assets at the end of 2011. Section 4b describes our methodology in more detail.
Investigation of annual changes in TSR performance as dependant variable was limited to the “Intent to grow” and “Return” independent variables, since the companies have only recently begun to document annually their project portfolios. Both variables showed a relationship for each company to changes in TSR during years when there was no exogenous perturbation. However, external perturbations such as financial crises in some years were found to overwhelm the annual relationships, as did internally caused perturbations such as reserve restatements, unpopular acquisitions or accidents. Even after removing data that reflected internal and external perturbations, we found only a weak link on an annual basis between TSR and our Growth and Return variables (see Appendix 5).
Over the full ten year cycle, however, the external and internal perturbations that caused a lapse in the annual relationship between annual dependant (TSR) and independent variables generally manifested themselves in each company’s financial results. Thus, the differences in company TSR performance over the full time period could reasonably be linked to the three independent variables cited above.
The “intent to grow” through investing vigorously in growth projects was a stronger explanatory variable for TSR than other possible growth indicators such as realized growth in revenues, production or refinery runs. Revenue growth is a weak growth indicator since oil and gas prices change significantly from year to year. Reserves or production growth differences among the companies are influenced by acquisitions and divestments and in aggregate do not explain TSR changes. Acquisitions had the power to affect TSR on an annual basis, and we note that acquisitions that provided attractive new oil or natural gas project opportunities enabled the acquirers to expand their capital expenditures, while acquisitions without an attractive project inventory did not, at least in the short term. Similarly, synergy capture is generally well tracked and publicized and is quickly visible in improved Returns. Thus, the impact of acquisitions is over time reflected first in returns and growth metrics and later in an enhanced project portfolio.
Taking our analysis this far begs the question of how significant was each variable in explaining TSR performance. Since we were limited to the six super-majors studied, a multiple regression on TSR as the
dependent variable with the three independent variables is statistically inconclusive4. However, we could not resist “taking a peek” and the results are discussed in the next section.
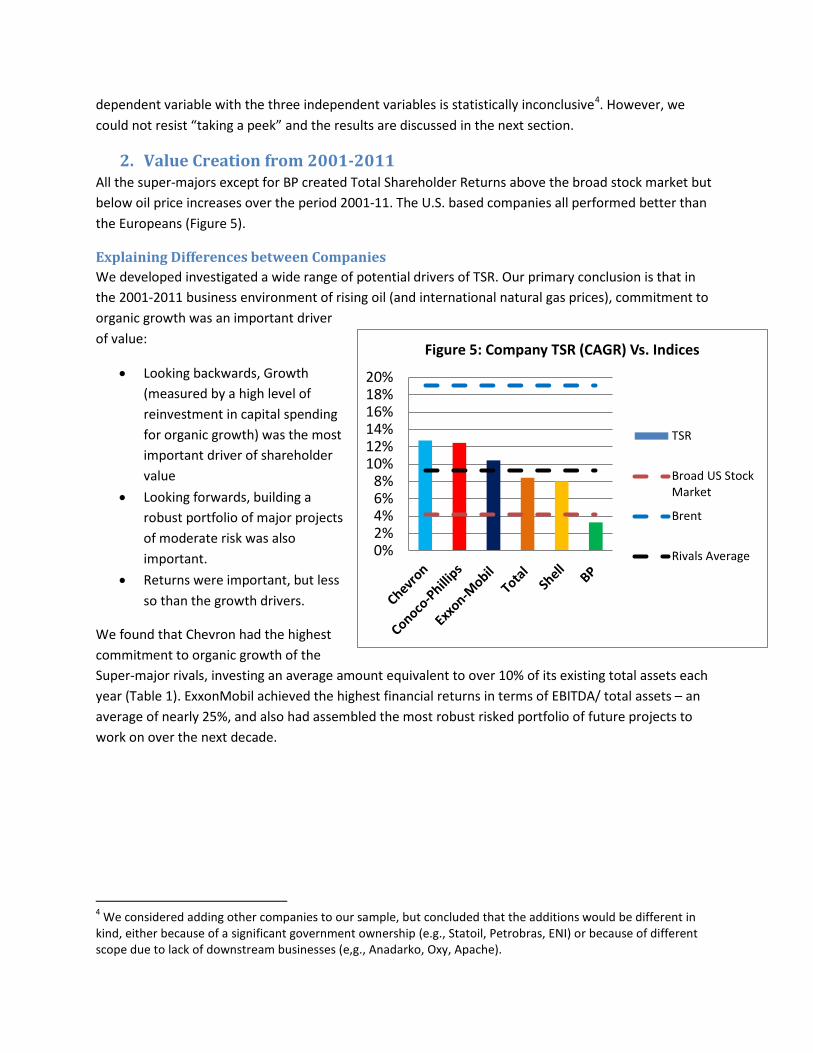
2. Value Creation from 2001-2011 All the super-majors except for BP created Total Shareholder Returns above the broad stock market but below oil price increases over the period 2001-11. The U.S. based companies all performed better than the Europeans (Figure 5).
Explaining Differences between Companies We developed investigated a wide range of potential drivers of TSR. Our primary conclusion is that in the 2001-2011 business environment of rising oil (and international natural gas prices), commitment to organic growth was an important driver of value:
• Looking backwards, Growth (measured by a high level of reinvestment in capital spending for organic growth) was the most important driver of shareholder value
• Looking forwards, building a robust portfolio of major projects of moderate risk was also important.
• Returns were important, but less so than the growth drivers.
We found that Chevron had the highest commitment to organic growth of the Super-major rivals, investing an average amount equivalent to over 10% of its existing total assets each year (Table 1). ExxonMobil achieved the highest financial returns in terms of EBITDA/ total assets – an average of nearly 25%, and also had assembled the most robust risked portfolio of future projects to work on over the next decade.
4 We considered adding other companies to our sample, but concluded that the additions would be different in kind, either because of a significant government ownership (e.g., Statoil, Petrobras, ENI) or because of different scope due to lack of downstream businesses (e,g., Anadarko, Oxy, Apache).
0%2%4%6%8%
10%12%14%16%18%20%
Figure 5: Company TSR (CAGR) Vs. Indices
TSR
Broad US StockMarket
Brent
Rivals Average
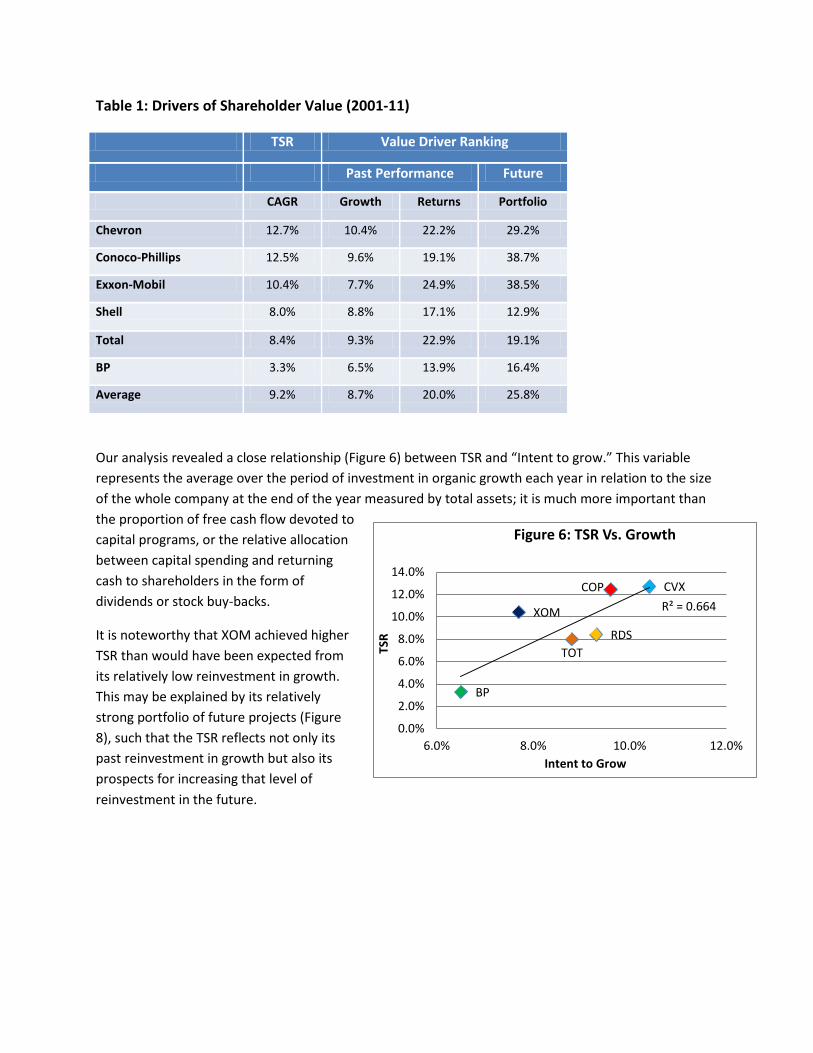
Table 1: Drivers of Shareholder Value (2001-11)
TSR Value Driver Ranking
Past Performance Future
CAGR Growth Returns Portfolio
Chevron 12.7% 10.4% 22.2% 29.2%
Conoco-Phillips 12.5% 9.6% 19.1% 38.7%
Exxon-Mobil 10.4% 7.7% 24.9% 38.5%
Shell 8.0% 8.8% 17.1% 12.9%
Total 8.4% 9.3% 22.9% 19.1%
BP 3.3% 6.5% 13.9% 16.4%
Average 9.2% 8.7% 20.0% 25.8%
Our analysis revealed a close relationship (Figure 6) between TSR and “Intent to grow.” This variable represents the average over the period of investment in organic growth each year in relation to the size of the whole company at the end of the year measured by total assets; it is much more important than the proportion of free cash flow devoted to capital programs, or the relative allocation between capital spending and returning cash to shareholders in the form of dividends or stock buy-backs.
It is noteworthy that XOM achieved higher TSR than would have been expected from its relatively low reinvestment in growth. This may be explained by its relatively strong portfolio of future projects (Figure 8), such that the TSR reflects not only its past reinvestment in growth but also its prospects for increasing that level of reinvestment in the future.
CVX COP
XOM
TOT RDS
BP
R² = 0.664
0.0%
2.0%
4.0%
6.0%
8.0%
10.0%
12.0%
14.0%
6.0% 8.0% 10.0% 12.0%
TSR
Intent to Grow
Figure 6: TSR Vs. Growth
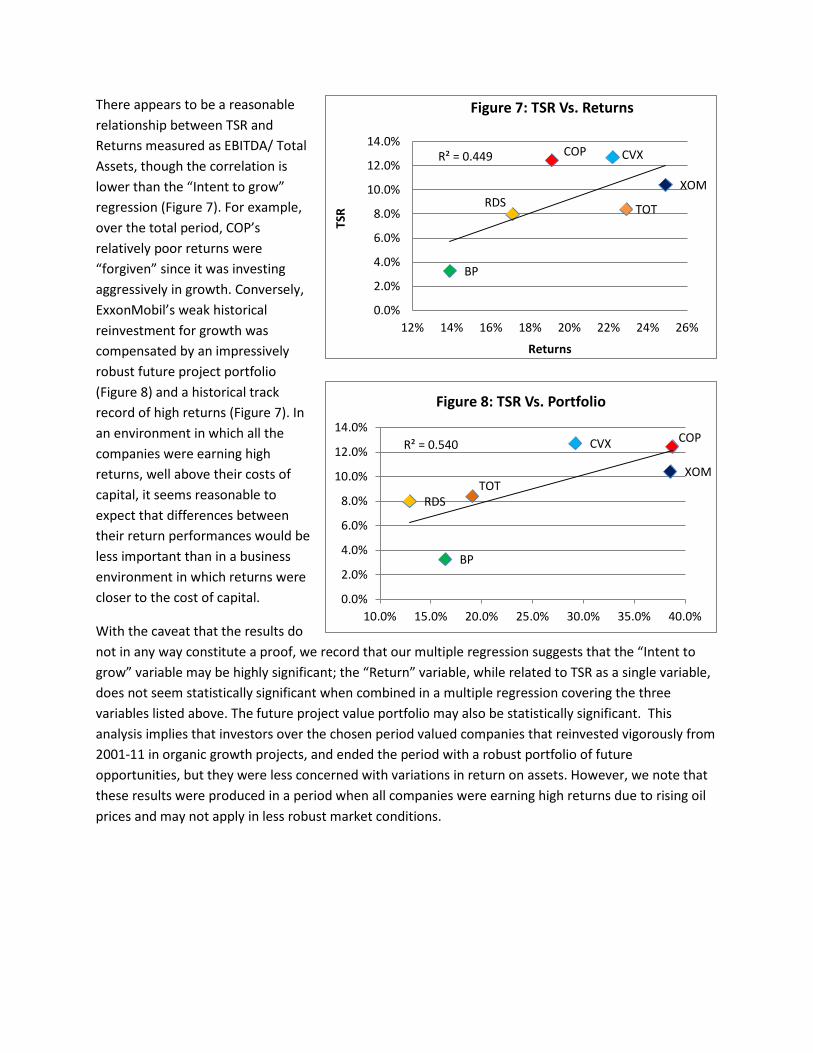
There appears to be a reasonable relationship between TSR and Returns measured as EBITDA/ Total Assets, though the correlation is lower than the “Intent to grow” regression (Figure 7). For example, over the total period, COP’s relatively poor returns were “forgiven” since it was investing aggressively in growth. Conversely, ExxonMobil’s weak historical reinvestment for growth was compensated by an impressively robust future project portfolio (Figure 8) and a historical track record of high returns (Figure 7). In an environment in which all the companies were earning high returns, well above their costs of capital, it seems reasonable to expect that differences between their return performances would be less important than in a business environment in which returns were closer to the cost of capital.
With the caveat that the results do not in any way constitute a proof, we record that our multiple regression suggests that the “Intent to grow” variable may be highly significant; the “Return” variable, while related to TSR as a single variable, does not seem statistically significant when combined in a multiple regression covering the three variables listed above. The future project value portfolio may also be statistically significant. This analysis implies that investors over the chosen period valued companies that reinvested vigorously from 2001-11 in organic growth projects, and ended the period with a robust portfolio of future opportunities, but they were less concerned with variations in return on assets. However, we note that these results were produced in a period when all companies were earning high returns due to rising oil prices and may not apply in less robust market conditions.
CVX COP
XOM RDS TOT
BP
R² = 0.449
0.0%
2.0%
4.0%
6.0%
8.0%
10.0%
12.0%
14.0%
12% 14% 16% 18% 20% 22% 24% 26%TS
R Returns
Figure 7: TSR Vs. Returns
CVX COP
XOM
RDS TOT
BP
R² = 0.540
0.0%
2.0%
4.0%
6.0%
8.0%
10.0%
12.0%
14.0%
10.0% 15.0% 20.0% 25.0% 30.0% 35.0% 40.0%
Figure 8: TSR Vs. Portfolio
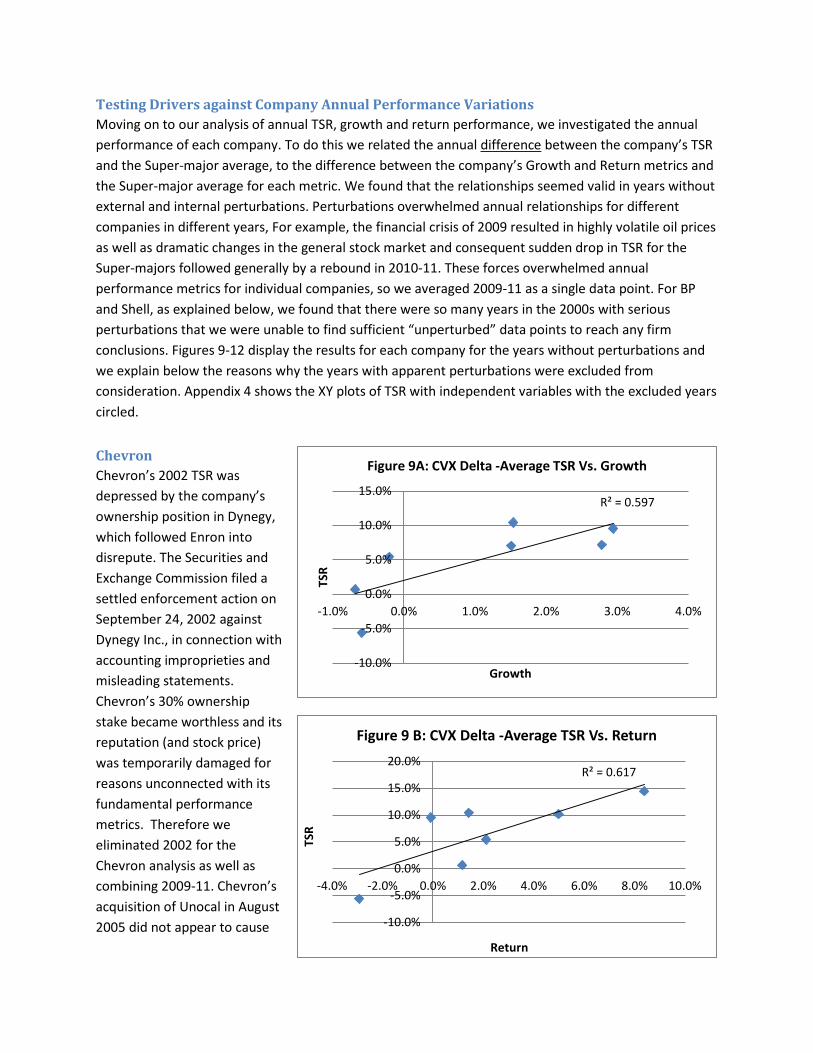
Testing Drivers against Company Annual Performance Variations Moving on to our analysis of annual TSR, growth and return performance, we investigated the annual performance of each company. To do this we related the annual difference between the company’s TSR and the Super-major average, to the difference between the company’s Growth and Return metrics and the Super-major average for each metric. We found that the relationships seemed valid in years without external and internal perturbations. Perturbations overwhelmed annual relationships for different companies in different years, For example, the financial crisis of 2009 resulted in highly volatile oil prices as well as dramatic changes in the general stock market and consequent sudden drop in TSR for the Super-majors followed generally by a rebound in 2010-11. These forces overwhelmed annual performance metrics for individual companies, so we averaged 2009-11 as a single data point. For BP and Shell, as explained below, we found that there were so many years in the 2000s with serious perturbations that we were unable to find sufficient “unperturbed” data points to reach any firm conclusions. Figures 9-12 display the results for each company for the years without perturbations and we explain below the reasons why the years with apparent perturbations were excluded from consideration. Appendix 4 shows the XY plots of TSR with independent variables with the excluded years circled.
Chevron Chevron’s 2002 TSR was depressed by the company’s ownership position in Dynegy, which followed Enron into disrepute. The Securities and Exchange Commission filed a settled enforcement action on September 24, 2002 against Dynegy Inc., in connection with accounting improprieties and misleading statements. Chevron’s 30% ownership stake became worthless and its reputation (and stock price) was temporarily damaged for reasons unconnected with its fundamental performance metrics. Therefore we eliminated 2002 for the Chevron analysis as well as combining 2009-11. Chevron’s acquisition of Unocal in August 2005 did not appear to cause
R² = 0.597
-10.0%
-5.0%
0.0%
5.0%
10.0%
15.0%
-1.0% 0.0% 1.0% 2.0% 3.0% 4.0%
TSR
Growth
Figure 9A: CVX Delta -Average TSR Vs. Growth
R² = 0.617
-10.0%
-5.0%
0.0%
5.0%
10.0%
15.0%
20.0%
-4.0% -2.0% 0.0% 2.0% 4.0% 6.0% 8.0% 10.0%
TSR
Return
Figure 9 B: CVX Delta -Average TSR Vs. Return
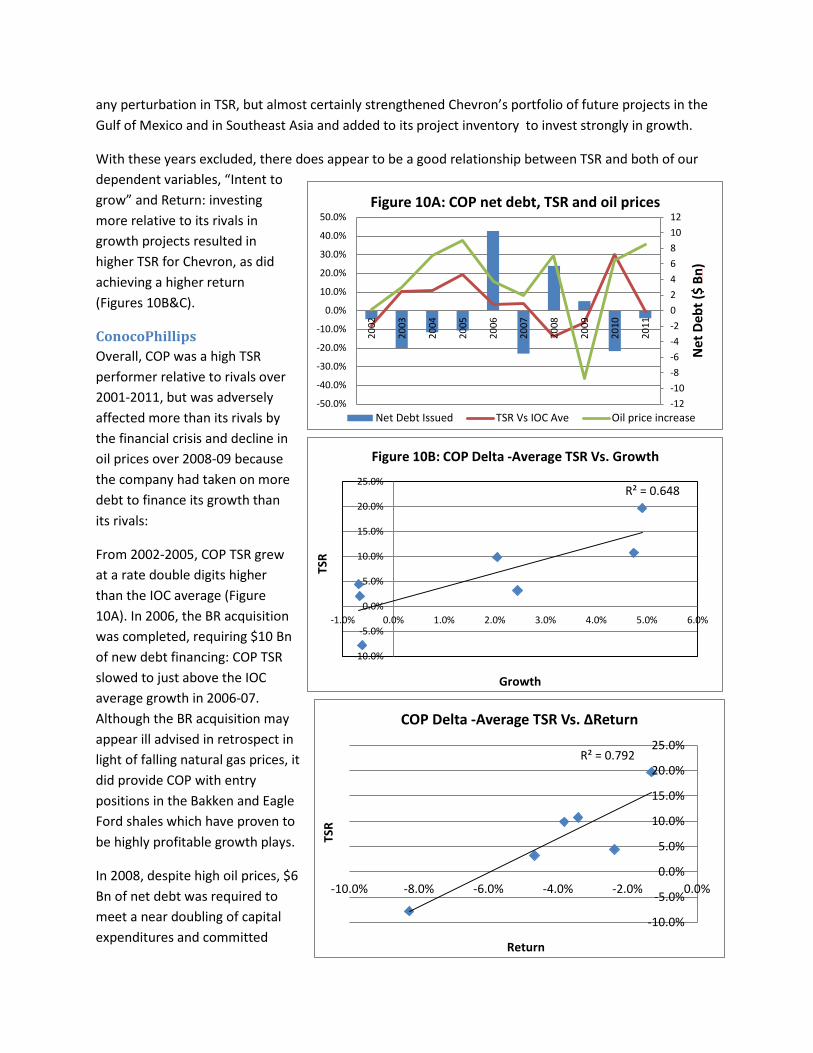
any perturbation in TSR, but almost certainly strengthened Chevron’s portfolio of future projects in the Gulf of Mexico and in Southeast Asia and added to its project inventory to invest strongly in growth.
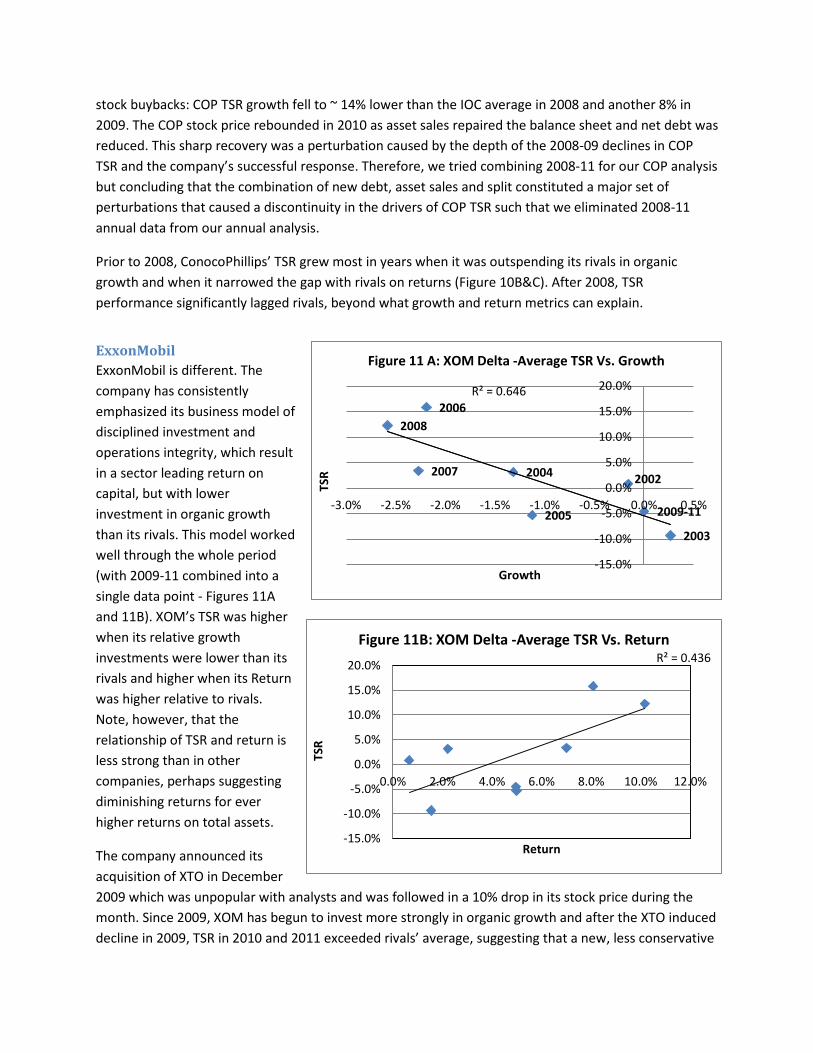
With these years excluded, there does appear to be a good relationship between TSR and both of our dependent variables, “Intent to grow” and Return: investing more relative to its rivals in growth projects resulted in higher TSR for Chevron, as did achieving a higher return (Figures 10B&C).
ConocoPhillips Overall, COP was a high TSR performer relative to rivals over 2001-2011, but was adversely affected more than its rivals by the financial crisis and decline in oil prices over 2008-09 because the company had taken on more debt to finance its growth than its rivals:
From 2002-2005, COP TSR grew at a rate double digits higher than the IOC average (Figure 10A). In 2006, the BR acquisition was completed, requiring $10 Bn of new debt financing: COP TSR slowed to just above the IOC average growth in 2006-07. Although the BR acquisition may appear ill advised in retrospect in light of falling natural gas prices, it did provide COP with entry positions in the Bakken and Eagle Ford shales which have proven to be highly profitable growth plays.
In 2008, despite high oil prices, $6 Bn of net debt was required to meet a near doubling of capital expenditures and committed
-12-10-8-6-4-2024681012
-50.0%
-40.0%
-30.0%
-20.0%
-10.0%
0.0%
10.0%
20.0%
30.0%
40.0%
50.0%
2002
2003
2004
2005
2006
2007
2008
2009
2010
2011
Net
Deb
t ($
Bn)
Figure 10A: COP net debt, TSR and oil prices
Net Debt Issued TSR Vs IOC Ave Oil price increase
R² = 0.648
-10.0%
-5.0%
0.0%
5.0%
10.0%
15.0%
20.0%
25.0%
-1.0% 0.0% 1.0% 2.0% 3.0% 4.0% 5.0% 6.0%
TSR
Growth
Figure 10B: COP Delta -Average TSR Vs. Growth
R² = 0.792
-10.0%
-5.0%
0.0%
5.0%
10.0%
15.0%
20.0%
25.0%
-10.0% -8.0% -6.0% -4.0% -2.0% 0.0%
TSR
Return
COP Delta -Average TSR Vs. ∆Return
stock buybacks: COP TSR growth fell to ~ 14% lower than the IOC average in 2008 and another 8% in 2009. The COP stock price rebounded in 2010 as asset sales repaired the balance sheet and net debt was reduced. This sharp recovery was a perturbation caused by the depth of the 2008-09 declines in COP TSR and the company’s successful response. Therefore, we tried combining 2008-11 for our COP analysis but concluding that the combination of new debt, asset sales and split constituted a major set of perturbations that caused a discontinuity in the drivers of COP TSR such that we eliminated 2008-11 annual data from our annual analysis.
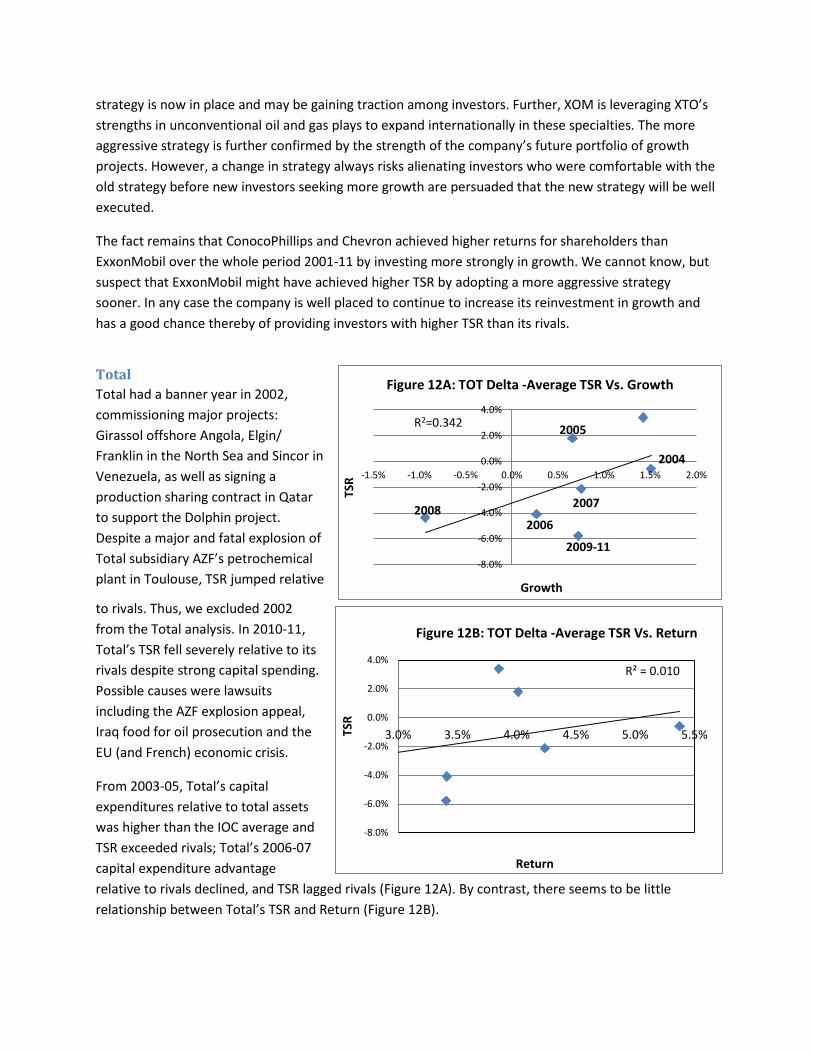
Prior to 2008, ConocoPhillips’ TSR grew most in years when it was outspending its rivals in organic growth and when it narrowed the gap with rivals on returns (Figure 10B&C). After 2008, TSR performance significantly lagged rivals, beyond what growth and return metrics can explain.
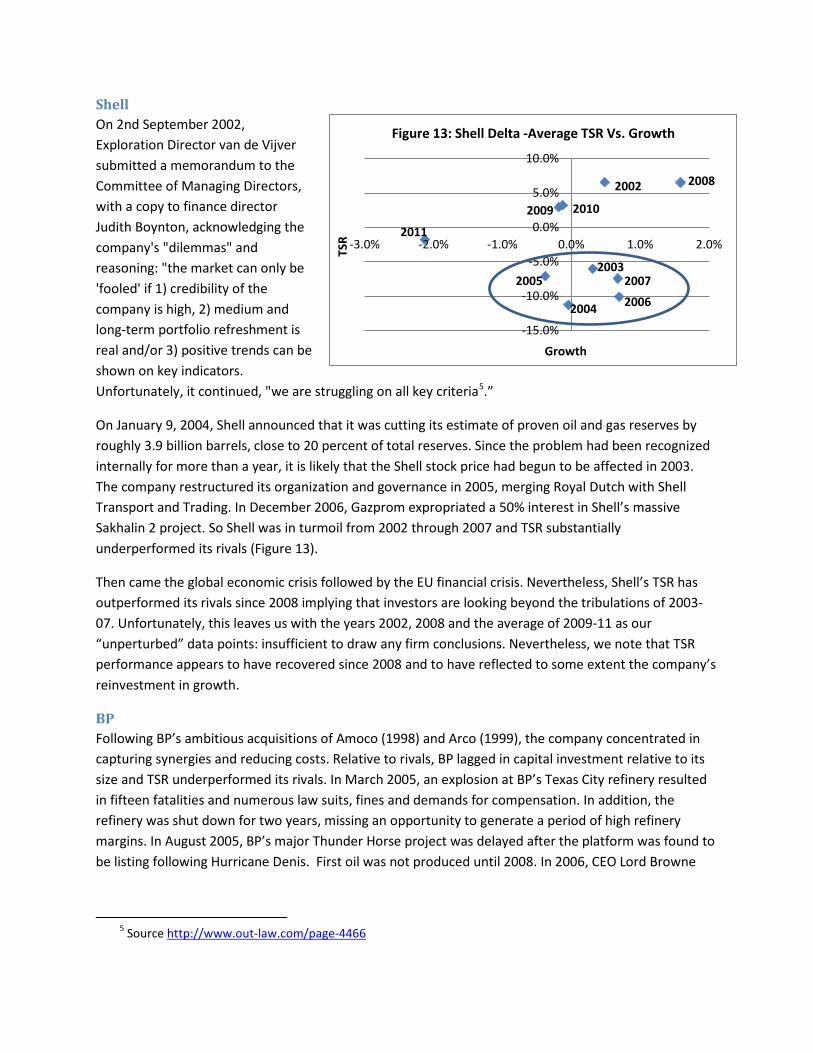
ExxonMobil ExxonMobil is different. The company has consistently emphasized its business model of disciplined investment and operations integrity, which result in a sector leading return on capital, but with lower investment in organic growth than its rivals. This model worked well through the whole period (with 2009-11 combined into a single data point - Figures 11A and 11B). XOM’s TSR was higher when its relative growth investments were lower than its rivals and higher when its Return was higher relative to rivals. Note, however, that the relationship of TSR and return is less strong than in other companies, perhaps suggesting diminishing returns for ever higher returns on total assets.
The company announced its acquisition of XTO in December 2009 which was unpopular with analysts and was followed in a 10% drop in its stock price during the month. Since 2009, XOM has begun to invest more strongly in organic growth and after the XTO induced decline in 2009, TSR in 2010 and 2011 exceeded rivals’ average, suggesting that a new, less conservative
R² = 0.436
-15.0%
-10.0%
-5.0%
0.0%
5.0%
10.0%
15.0%
20.0%
0.0% 2.0% 4.0% 6.0% 8.0% 10.0% 12.0%
TSR
Return
Figure 11B: XOM Delta -Average TSR Vs. Return
2002
2003
2004
2005
2006
2007
2008
2009-11
R² = 0.646
-15.0%
-10.0%
-5.0%
0.0%
5.0%
10.0%
15.0%
20.0%
-3.0% -2.5% -2.0% -1.5% -1.0% -0.5% 0.0% 0.5%
TSR
Growth
Figure 11 A: XOM Delta -Average TSR Vs. Growth
strategy is now in place and may be gaining traction among investors. Further, XOM is leveraging XTO’s strengths in unconventional oil and gas plays to expand internationally in these specialties. The more aggressive strategy is further confirmed by the strength of the company’s future portfolio of growth projects. However, a change in strategy always risks alienating investors who were comfortable with the old strategy before new investors seeking more growth are persuaded that the new strategy will be well executed.
The fact remains that ConocoPhillips and Chevron achieved higher returns for shareholders than ExxonMobil over the whole period 2001-11 by investing more strongly in growth. We cannot know, but suspect that ExxonMobil might have achieved higher TSR by adopting a more aggressive strategy sooner. In any case the company is well placed to continue to increase its reinvestment in growth and has a good chance thereby of providing investors with higher TSR than its rivals.
Total Total had a banner year in 2002, commissioning major projects: Girassol offshore Angola, Elgin/ Franklin in the North Sea and Sincor in Venezuela, as well as signing a production sharing contract in Qatar to support the Dolphin project. Despite a major and fatal explosion of Total subsidiary AZF’s petrochemical plant in Toulouse, TSR jumped relative
to rivals. Thus, we excluded 2002 from the Total analysis. In 2010-11, Total’s TSR fell severely relative to its rivals despite strong capital spending. Possible causes were lawsuits including the AZF explosion appeal, Iraq food for oil prosecution and the EU (and French) economic crisis.
From 2003-05, Total’s capital expenditures relative to total assets was higher than the IOC average and TSR exceeded rivals; Total’s 2006-07 capital expenditure advantage relative to rivals declined, and TSR lagged rivals (Figure 12A). By contrast, there seems to be little relationship between Total’s TSR and Return (Figure 12B).
R² = 0.010
-8.0%
-6.0%
-4.0%
-2.0%
0.0%
2.0%
4.0%
3.0% 3.5% 4.0% 4.5% 5.0% 5.5%TSR
Return
Figure 12B: TOT Delta -Average TSR Vs. Return
-8.0%
-6.0%
-4.0%
-2.0%
0.0%
2.0%
4.0%
-1.5% -1.0% -0.5% 0.0% 0.5% 1.0% 1.5% 2.0%
TSR
Growth
Figure 12A: TOT Delta -Average TSR Vs. Growth
2008 2006
2009-11
2007
2005
2004
R2=0.342
Shell On 2nd September 2002, Exploration Director van de Vijver submitted a memorandum to the Committee of Managing Directors, with a copy to finance director Judith Boynton, acknowledging the company's "dilemmas" and reasoning: "the market can only be 'fooled' if 1) credibility of the company is high, 2) medium and long-term portfolio refreshment is real and/or 3) positive trends can be shown on key indicators. Unfortunately, it continued, "we are struggling on all key criteria5.”
On January 9, 2004, Shell announced that it was cutting its estimate of proven oil and gas reserves by roughly 3.9 billion barrels, close to 20 percent of total reserves. Since the problem had been recognized internally for more than a year, it is likely that the Shell stock price had begun to be affected in 2003. The company restructured its organization and governance in 2005, merging Royal Dutch with Shell Transport and Trading. In December 2006, Gazprom expropriated a 50% interest in Shell’s massive Sakhalin 2 project. So Shell was in turmoil from 2002 through 2007 and TSR substantially underperformed its rivals (Figure 13).
Then came the global economic crisis followed by the EU financial crisis. Nevertheless, Shell’s TSR has outperformed its rivals since 2008 implying that investors are looking beyond the tribulations of 2003-07. Unfortunately, this leaves us with the years 2002, 2008 and the average of 2009-11 as our “unperturbed” data points: insufficient to draw any firm conclusions. Nevertheless, we note that TSR performance appears to have recovered since 2008 and to have reflected to some extent the company’s reinvestment in growth.
BP Following BP’s ambitious acquisitions of Amoco (1998) and Arco (1999), the company concentrated in capturing synergies and reducing costs. Relative to rivals, BP lagged in capital investment relative to its size and TSR underperformed its rivals. In March 2005, an explosion at BP’s Texas City refinery resulted in fifteen fatalities and numerous law suits, fines and demands for compensation. In addition, the refinery was shut down for two years, missing an opportunity to generate a period of high refinery margins. In August 2005, BP’s major Thunder Horse project was delayed after the platform was found to be listing following Hurricane Denis. First oil was not produced until 2008. In 2006, CEO Lord Browne
5 Source http://www.out-law.com/page-4466
-15.0%
-10.0%
-5.0%
0.0%
5.0%
10.0%
-3.0% -2.0% -1.0% 0.0% 1.0% 2.0%TSR
Growth
Figure 13: Shell Delta -Average TSR Vs. Growth
2003
2004
2005
2006
2007
2002
2011
2010 2009
2008
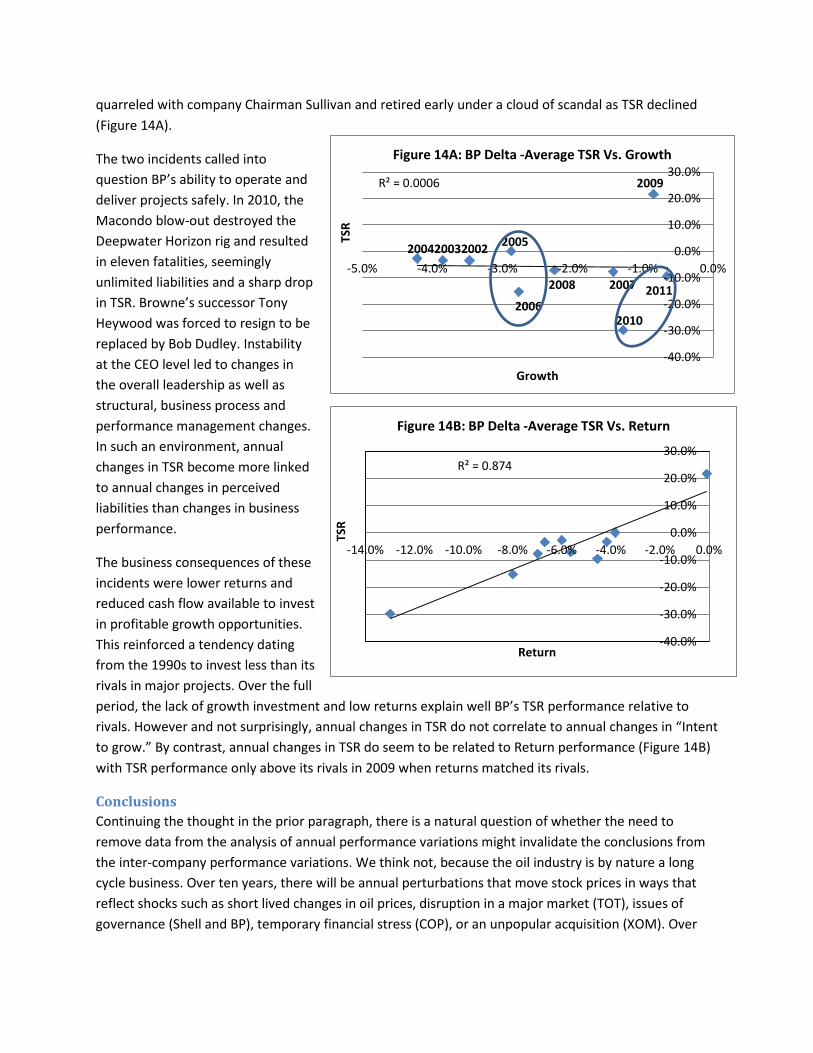
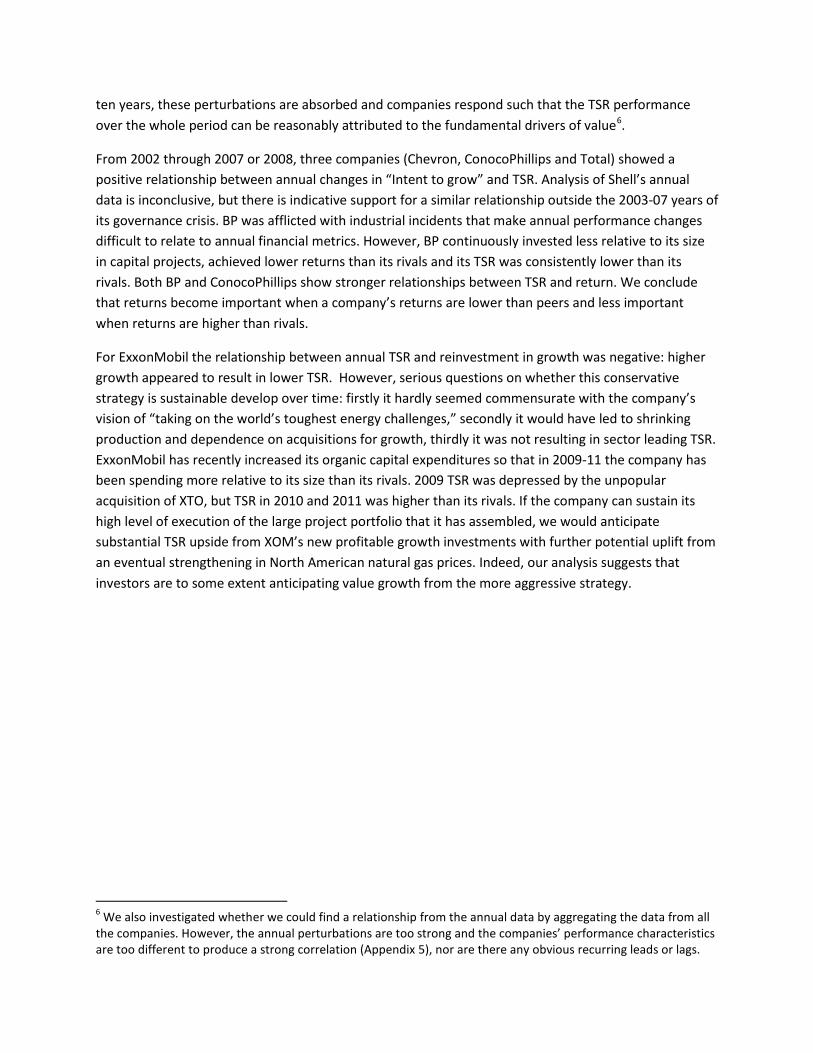
quarreled with company Chairman Sullivan and retired early under a cloud of scandal as TSR declined (Figure 14A).
The two incidents called into question BP’s ability to operate and deliver projects safely. In 2010, the Macondo blow-out destroyed the Deepwater Horizon rig and resulted in eleven fatalities, seemingly unlimited liabilities and a sharp drop in TSR. Browne’s successor Tony Heywood was forced to resign to be replaced by Bob Dudley. Instability at the CEO level led to changes in the overall leadership as well as structural, business process and performance management changes. In such an environment, annual changes in TSR become more linked to annual changes in perceived liabilities than changes in business performance.
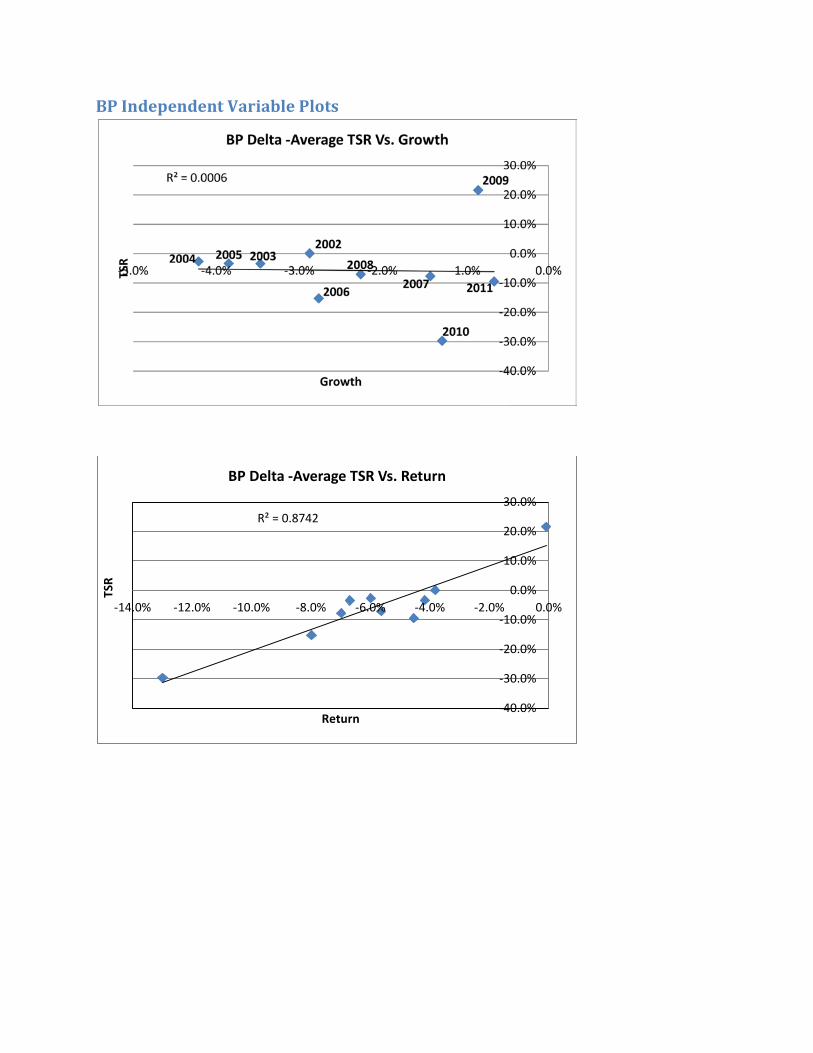
The business consequences of these incidents were lower returns and reduced cash flow available to invest in profitable growth opportunities. This reinforced a tendency dating from the 1990s to invest less than its rivals in major projects. Over the full period, the lack of growth investment and low returns explain well BP’s TSR performance relative to rivals. However and not surprisingly, annual changes in TSR do not correlate to annual changes in “Intent to grow.” By contrast, annual changes in TSR do seem to be related to Return performance (Figure 14B) with TSR performance only above its rivals in 2009 when returns matched its rivals.
Conclusions Continuing the thought in the prior paragraph, there is a natural question of whether the need to remove data from the analysis of annual performance variations might invalidate the conclusions from the inter-company performance variations. We think not, because the oil industry is by nature a long cycle business. Over ten years, there will be annual perturbations that move stock prices in ways that reflect shocks such as short lived changes in oil prices, disruption in a major market (TOT), issues of governance (Shell and BP), temporary financial stress (COP), or an unpopular acquisition (XOM). Over
R² = 0.874
-40.0%
-30.0%
-20.0%
-10.0%
0.0%
10.0%
20.0%
30.0%
-14.0% -12.0% -10.0% -8.0% -6.0% -4.0% -2.0% 0.0%
TSR
Return
Figure 14B: BP Delta -Average TSR Vs. Return
R² = 0.0006
-40.0%
-30.0%
-20.0%
-10.0%
0.0%
10.0%
20.0%
30.0%
-5.0% -4.0% -3.0% -2.0% -1.0% 0.0%
TSR
Growth
Figure 14A: BP Delta -Average TSR Vs. Growth
2002 2003 2005 2004
2006
2008
2010
2007 2011
2009
ten years, these perturbations are absorbed and companies respond such that the TSR performance over the whole period can be reasonably attributed to the fundamental drivers of value6.
From 2002 through 2007 or 2008, three companies (Chevron, ConocoPhillips and Total) showed a positive relationship between annual changes in “Intent to grow” and TSR. Analysis of Shell’s annual data is inconclusive, but there is indicative support for a similar relationship outside the 2003-07 years of its governance crisis. BP was afflicted with industrial incidents that make annual performance changes difficult to relate to annual financial metrics. However, BP continuously invested less relative to its size in capital projects, achieved lower returns than its rivals and its TSR was consistently lower than its rivals. Both BP and ConocoPhillips show stronger relationships between TSR and return. We conclude that returns become important when a company’s returns are lower than peers and less important when returns are higher than rivals.
For ExxonMobil the relationship between annual TSR and reinvestment in growth was negative: higher growth appeared to result in lower TSR. However, serious questions on whether this conservative strategy is sustainable develop over time: firstly it hardly seemed commensurate with the company’s vision of “taking on the world’s toughest energy challenges,” secondly it would have led to shrinking production and dependence on acquisitions for growth, thirdly it was not resulting in sector leading TSR. ExxonMobil has recently increased its organic capital expenditures so that in 2009-11 the company has been spending more relative to its size than its rivals. 2009 TSR was depressed by the unpopular acquisition of XTO, but TSR in 2010 and 2011 was higher than its rivals. If the company can sustain its high level of execution of the large project portfolio that it has assembled, we would anticipate substantial TSR upside from XOM’s new profitable growth investments with further potential uplift from an eventual strengthening in North American natural gas prices. Indeed, our analysis suggests that investors are to some extent anticipating value growth from the more aggressive strategy.
6 We also investigated whether we could find a relationship from the annual data by aggregating the data from all the companies. However, the annual perturbations are too strong and the companies’ performance characteristics are too different to produce a strong correlation (Appendix 5), nor are there any obvious recurring leads or lags.
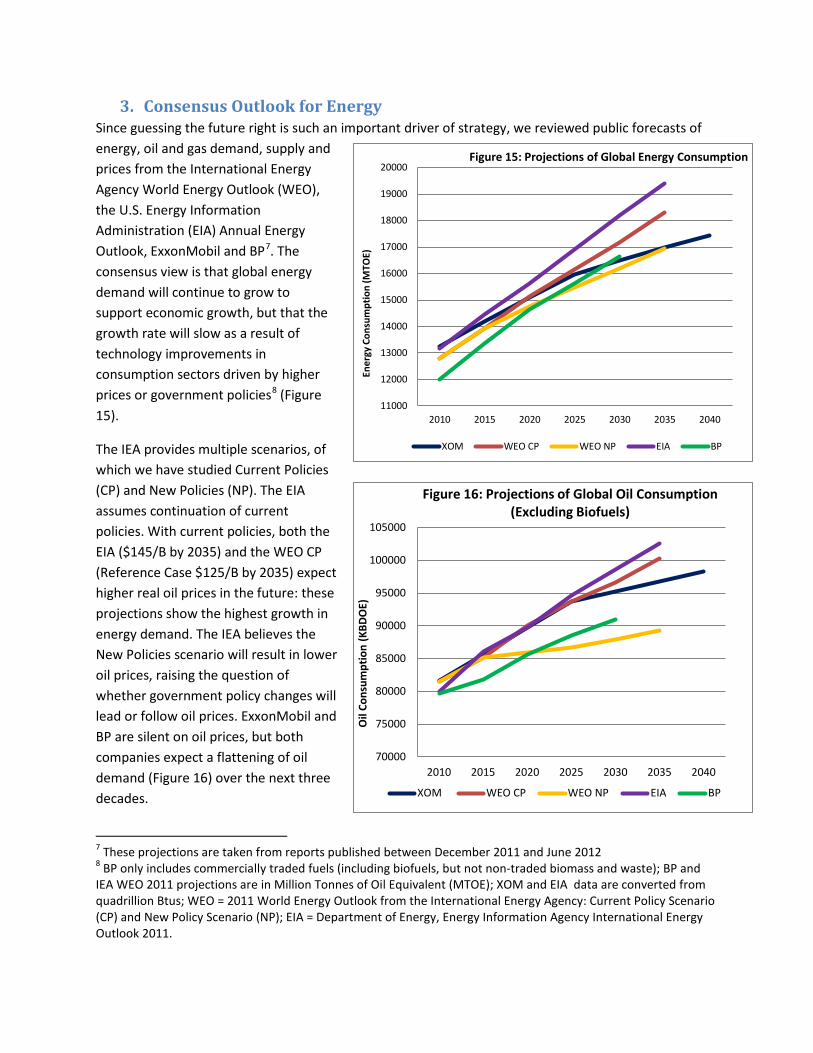
3. Consensus Outlook for Energy Since guessing the future right is such an important driver of strategy, we reviewed public forecasts of energy, oil and gas demand, supply and prices from the International Energy Agency World Energy Outlook (WEO), the U.S. Energy Information Administration (EIA) Annual Energy Outlook, ExxonMobil and BP7. The consensus view is that global energy demand will continue to grow to support economic growth, but that the growth rate will slow as a result of technology improvements in consumption sectors driven by higher prices or government policies8 (Figure 15).
The IEA provides multiple scenarios, of which we have studied Current Policies (CP) and New Policies (NP). The EIA assumes continuation of current policies. With current policies, both the EIA ($145/B by 2035) and the WEO CP (Reference Case $125/B by 2035) expect higher real oil prices in the future: these projections show the highest growth in energy demand. The IEA believes the New Policies scenario will result in lower oil prices, raising the question of whether government policy changes will lead or follow oil prices. ExxonMobil and BP are silent on oil prices, but both companies expect a flattening of oil demand (Figure 16) over the next three decades.
7 These projections are taken from reports published between December 2011 and June 2012 8 BP only includes commercially traded fuels (including biofuels, but not non-traded biomass and waste); BP and IEA WEO 2011 projections are in Million Tonnes of Oil Equivalent (MTOE); XOM and EIA data are converted from quadrillion Btus; WEO = 2011 World Energy Outlook from the International Energy Agency: Current Policy Scenario (CP) and New Policy Scenario (NP); EIA = Department of Energy, Energy Information Agency International Energy Outlook 2011.
11000
12000
13000
14000
15000
16000
17000
18000
19000
20000
2010 2015 2020 2025 2030 2035 2040
Ener
gy C
onsu
mpt
ion
(MTO
E)
Figure 15: Projections of Global Energy Consumption
XOM WEO CP WEO NP EIA BP
70000
75000
80000
85000
90000
95000
100000
105000
2010 2015 2020 2025 2030 2035 2040
Oil
Cons
umpt
ion
(KBD
OE)
Figure 16: Projections of Global Oil Consumption (Excluding Biofuels)
XOM WEO CP WEO NP EIA BP
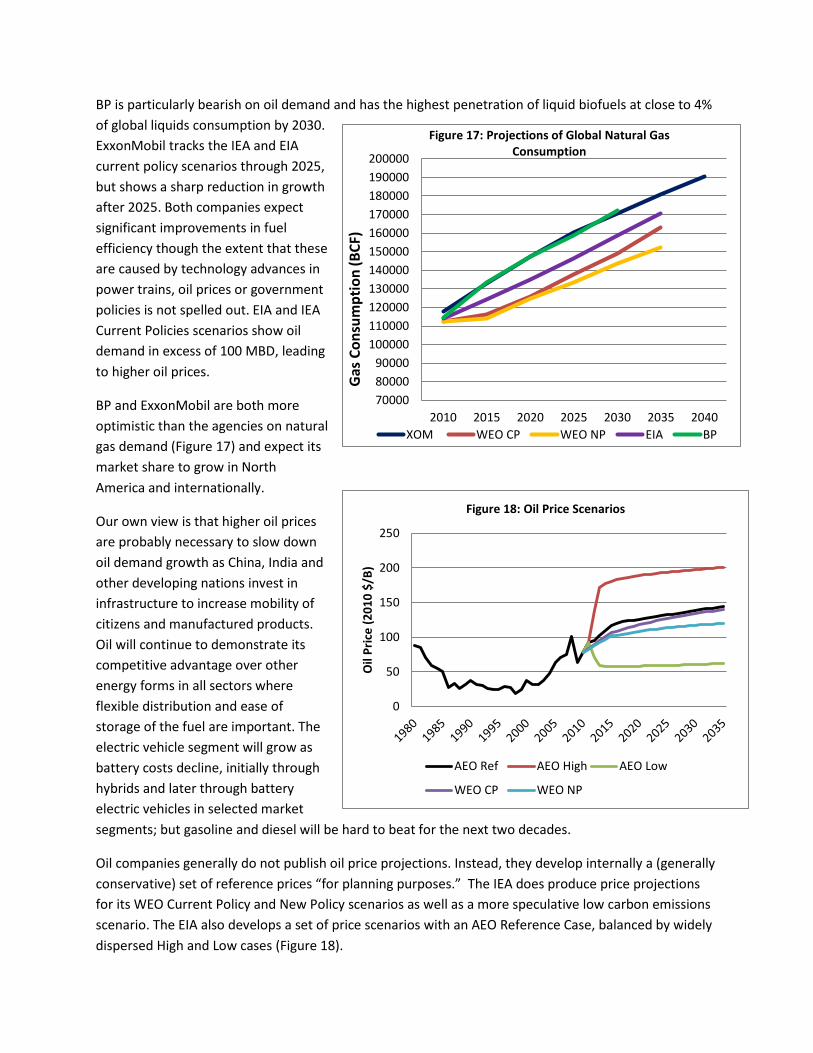
BP is particularly bearish on oil demand and has the highest penetration of liquid biofuels at close to 4% of global liquids consumption by 2030. ExxonMobil tracks the IEA and EIA current policy scenarios through 2025, but shows a sharp reduction in growth after 2025. Both companies expect significant improvements in fuel efficiency though the extent that these are caused by technology advances in power trains, oil prices or government policies is not spelled out. EIA and IEA Current Policies scenarios show oil demand in excess of 100 MBD, leading to higher oil prices.
BP and ExxonMobil are both more optimistic than the agencies on natural gas demand (Figure 17) and expect its market share to grow in North America and internationally.
Our own view is that higher oil prices are probably necessary to slow down oil demand growth as China, India and other developing nations invest in infrastructure to increase mobility of citizens and manufactured products. Oil will continue to demonstrate its competitive advantage over other energy forms in all sectors where flexible distribution and ease of storage of the fuel are important. The electric vehicle segment will grow as battery costs decline, initially through hybrids and later through battery electric vehicles in selected market segments; but gasoline and diesel will be hard to beat for the next two decades.
Oil companies generally do not publish oil price projections. Instead, they develop internally a (generally conservative) set of reference prices “for planning purposes.” The IEA does produce price projections for its WEO Current Policy and New Policy scenarios as well as a more speculative low carbon emissions scenario. The EIA also develops a set of price scenarios with an AEO Reference Case, balanced by widely dispersed High and Low cases (Figure 18).
700008000090000
100000110000120000130000140000150000160000170000180000190000200000
2010 2015 2020 2025 2030 2035 2040
Gas
Con
sum
ptio
n (B
CF)
Figure 17: Projections of Global Natural Gas Consumption
XOM WEO CP WEO NP EIA BP
0
50
100
150
200
250
Oil
Pric
e (2
010
$/B)
Figure 18: Oil Price Scenarios
AEO Ref AEO High AEO Low
WEO CP WEO NP
If current energy policies remain in place, both WEO and AEO see a future in which oil markets will be robust in price but slow growing while gas markets will be subject to price weakness in North America but stronger in Asia and Europe, and natural gas demand will be growing strongly worldwide. Only the AEO Low case and the WEO Low Carbon Emissions scenario show weaker oil prices. This view seems to be shared by the Super-majors, whose actions in making major investments in deep water oil, oil sands and liquefied natural gas (LNG) speak louder than any words.
Financial and Operating Results
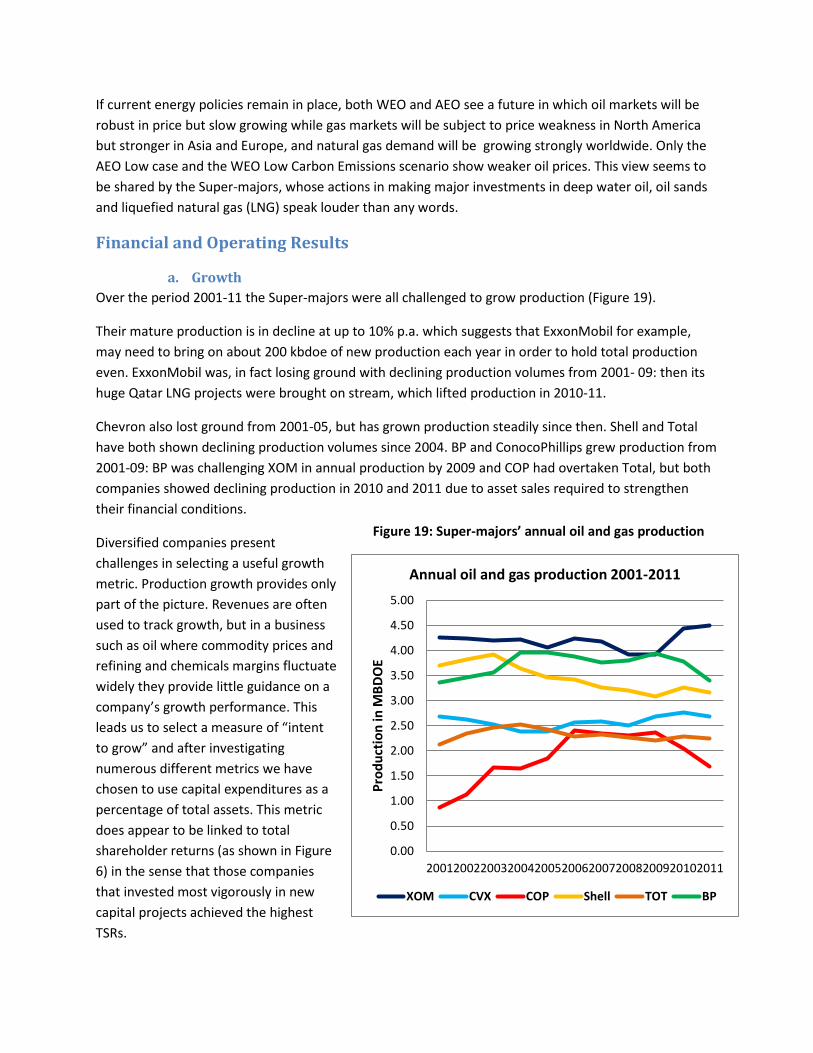
a. Growth Over the period 2001-11 the Super-majors were all challenged to grow production (Figure 19).
Their mature production is in decline at up to 10% p.a. which suggests that ExxonMobil for example, may need to bring on about 200 kbdoe of new production each year in order to hold total production even. ExxonMobil was, in fact losing ground with declining production volumes from 2001- 09: then its huge Qatar LNG projects were brought on stream, which lifted production in 2010-11.
Chevron also lost ground from 2001-05, but has grown production steadily since then. Shell and Total have both shown declining production volumes since 2004. BP and ConocoPhillips grew production from 2001-09: BP was challenging XOM in annual production by 2009 and COP had overtaken Total, but both companies showed declining production in 2010 and 2011 due to asset sales required to strengthen their financial conditions.
Diversified companies present challenges in selecting a useful growth metric. Production growth provides only part of the picture. Revenues are often used to track growth, but in a business such as oil where commodity prices and refining and chemicals margins fluctuate widely they provide little guidance on a company’s growth performance. This leads us to select a measure of “intent to grow” and after investigating numerous different metrics we have chosen to use capital expenditures as a percentage of total assets. This metric does appear to be linked to total shareholder returns (as shown in Figure 6) in the sense that those companies that invested most vigorously in new capital projects achieved the highest TSRs.
Figure 19: Super-majors’ annual oil and gas production
0.00
0.50
1.00
1.50
2.00
2.50
3.00
3.50
4.00
4.50
5.00
20012002200320042005200620072008200920102011
Prod
uctio
n in
MBD
OE
Annual oil and gas production 2001-2011
XOM CVX COP Shell TOT BP
Chevron and COP invested most vigorously in new capital projects over 2001-11 relative to their total assets and were rewarded by high TSR. We investigated whether inorganic (through mergers and acquisitions) growth contributed to TSR in the same way as organic growth but found no direct relationship. However, there may well be an indirect effect, as the acquired company provided new sources of cash flow and a new portfolio of capital projects: particularly if the acquired company lacked financial and human resources required to realize its potential, the acquirer can create value by increasing its aggregate capital spending to a higher proportion of total assets. So the value of an acquisition in this time period was more to increase access to early stage growth opportunities than to capture synergies through cost cutting, which are often given away by the buyer in the premium over market price paid by the buyer. An example may be found in the Exxon merger with Mobil, where Exxon’s financial strength and capabilities in engineering large scale LNG projects complemented Mobil’s strong relationships and experience in Qatar to allow delivery of highly profitable LNG mega-projects.
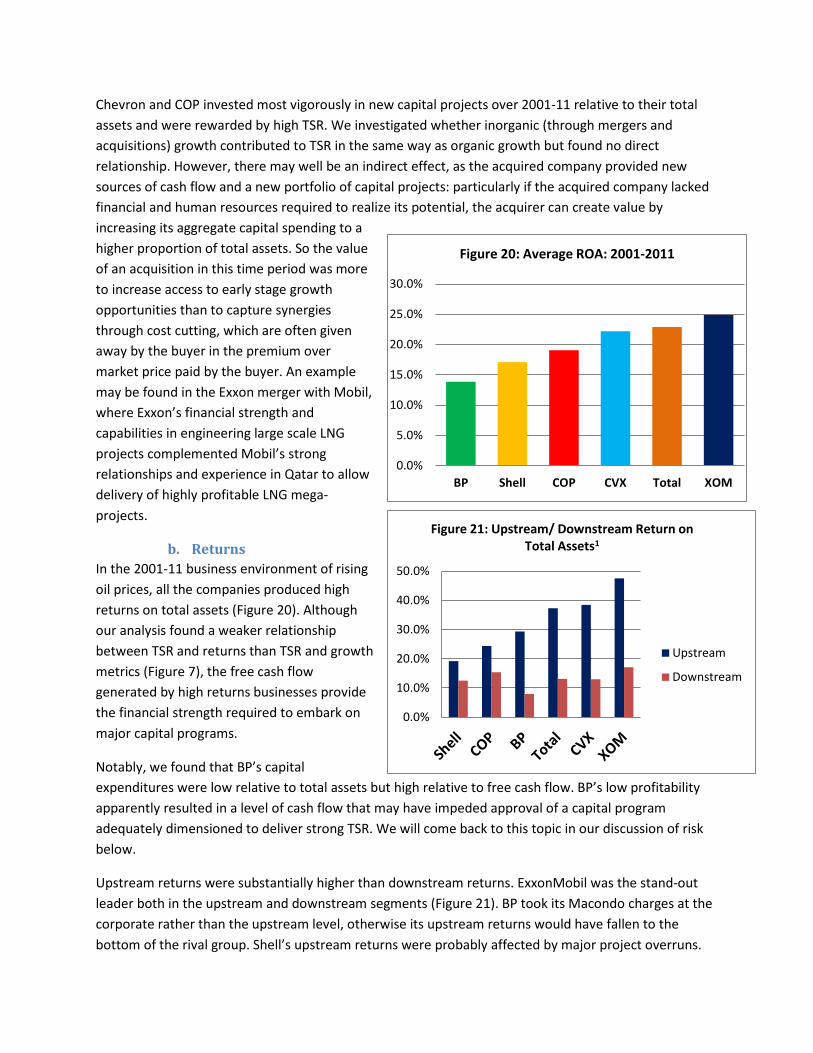
b. Returns In the 2001-11 business environment of rising oil prices, all the companies produced high returns on total assets (Figure 20). Although our analysis found a weaker relationship between TSR and returns than TSR and growth metrics (Figure 7), the free cash flow generated by high returns businesses provide the financial strength required to embark on major capital programs.
Notably, we found that BP’s capital expenditures were low relative to total assets but high relative to free cash flow. BP’s low profitability apparently resulted in a level of cash flow that may have impeded approval of a capital program adequately dimensioned to deliver strong TSR. We will come back to this topic in our discussion of risk below.
Upstream returns were substantially higher than downstream returns. ExxonMobil was the stand-out leader both in the upstream and downstream segments (Figure 21). BP took its Macondo charges at the corporate rather than the upstream level, otherwise its upstream returns would have fallen to the bottom of the rival group. Shell’s upstream returns were probably affected by major project overruns.
Figure 21: Super-major return on total assets
0.0%
10.0%
20.0%
30.0%
40.0%
50.0%
Figure 21: Upstream/ Downstream Return on Total Assets1
Upstream
Downstream
0.0%
5.0%
10.0%
15.0%
20.0%
25.0%
30.0%
BP Shell COP CVX Total XOM
Figure 20: Average ROA: 2001-2011
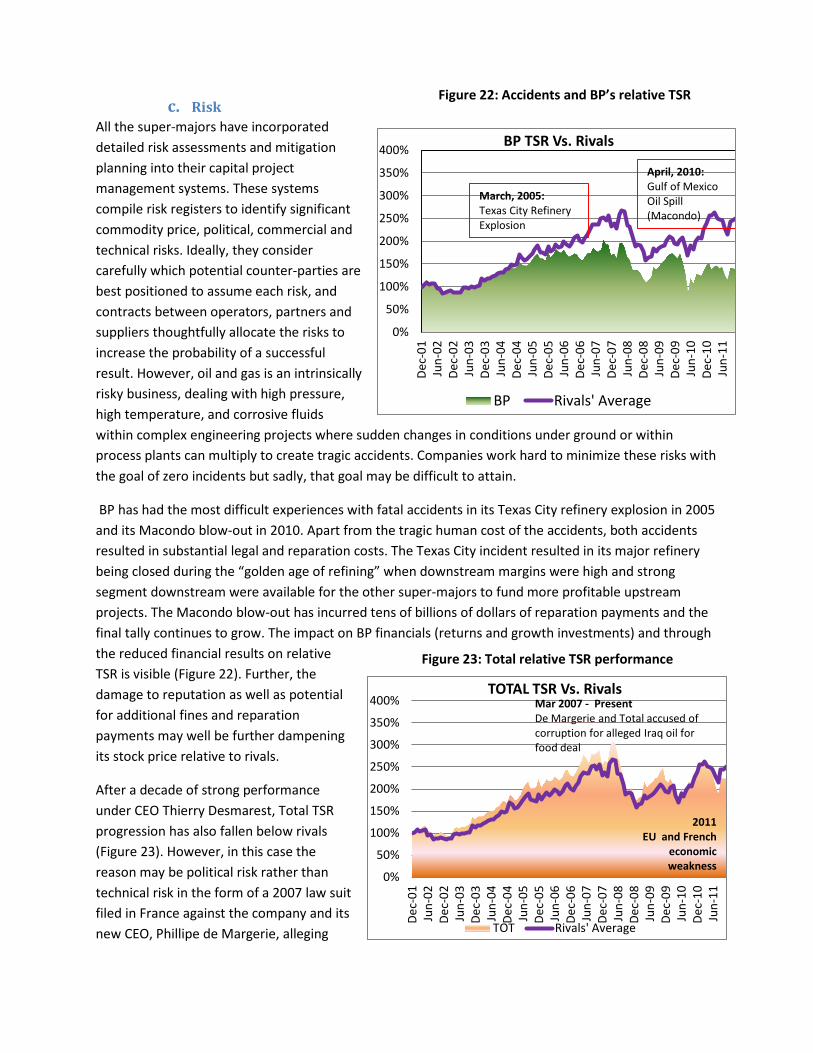
c. Risk All the super-majors have incorporated detailed risk assessments and mitigation planning into their capital project management systems. These systems compile risk registers to identify significant commodity price, political, commercial and technical risks. Ideally, they consider carefully which potential counter-parties are best positioned to assume each risk, and contracts between operators, partners and suppliers thoughtfully allocate the risks to increase the probability of a successful result. However, oil and gas is an intrinsically risky business, dealing with high pressure, high temperature, and corrosive fluids within complex engineering projects where sudden changes in conditions under ground or within process plants can multiply to create tragic accidents. Companies work hard to minimize these risks with the goal of zero incidents but sadly, that goal may be difficult to attain.
BP has had the most difficult experiences with fatal accidents in its Texas City refinery explosion in 2005 and its Macondo blow-out in 2010. Apart from the tragic human cost of the accidents, both accidents resulted in substantial legal and reparation costs. The Texas City incident resulted in its major refinery being closed during the “golden age of refining” when downstream margins were high and strong segment downstream were available for the other super-majors to fund more profitable upstream projects. The Macondo blow-out has incurred tens of billions of dollars of reparation payments and the final tally continues to grow. The impact on BP financials (returns and growth investments) and through the reduced financial results on relative TSR is visible (Figure 22). Further, the damage to reputation as well as potential for additional fines and reparation payments may well be further dampening its stock price relative to rivals.
After a decade of strong performance under CEO Thierry Desmarest, Total TSR progression has also fallen below rivals (Figure 23). However, in this case the reason may be political risk rather than technical risk in the form of a 2007 law suit filed in France against the company and its new CEO, Phillipe de Margerie, alleging
Figure 22: Accidents and BP’s relative TSR
Figure 23: Total relative TSR performance
0%
50%
100%
150%
200%
250%
300%
350%
400%
Dec-
01Ju
n-02
Dec-
02Ju
n-03
Dec-
03Ju
n-04
Dec-
04Ju
n-05
Dec-
05Ju
n-06
Dec-
06Ju
n-07
Dec-
07Ju
n-08
Dec-
08Ju
n-09
Dec-
09Ju
n-10
Dec-
10Ju
n-11
BP TSR Vs. Rivals
BP Rivals' Average
April, 2010: Gulf of Mexico Oil Spill (Macondo)
March, 2005: Texas City Refinery Explosion
0%
50%
100%
150%
200%
250%
300%
350%
400%
Dec-
01Ju
n-02
Dec-
02Ju
n-03
Dec-
03Ju
n-04
Dec-
04Ju
n-05
Dec-
05Ju
n-06
Dec-
06Ju
n-07
Dec-
07Ju
n-08
Dec-
08Ju
n-09
Dec-
09Ju
n-10
Dec-
10Ju
n-11
TOTAL TSR Vs. Rivals
TOT Rivals' Average
2011 EU and French
economic weakness
Mar 2007 - Present De Margerie and Total accused of corruption for alleged Iraq oil for food deal
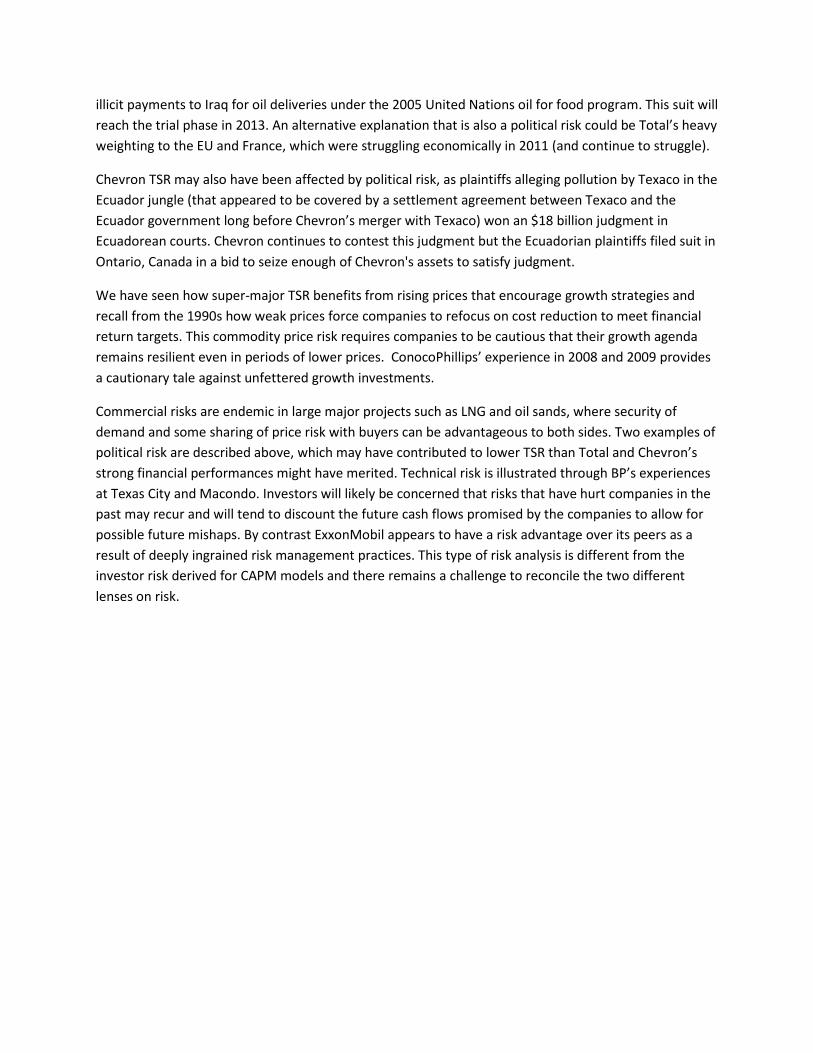
illicit payments to Iraq for oil deliveries under the 2005 United Nations oil for food program. This suit will reach the trial phase in 2013. An alternative explanation that is also a political risk could be Total’s heavy weighting to the EU and France, which were struggling economically in 2011 (and continue to struggle).
Chevron TSR may also have been affected by political risk, as plaintiffs alleging pollution by Texaco in the Ecuador jungle (that appeared to be covered by a settlement agreement between Texaco and the Ecuador government long before Chevron’s merger with Texaco) won an $18 billion judgment in Ecuadorean courts. Chevron continues to contest this judgment but the Ecuadorian plaintiffs filed suit in Ontario, Canada in a bid to seize enough of Chevron's assets to satisfy judgment.
We have seen how super-major TSR benefits from rising prices that encourage growth strategies and recall from the 1990s how weak prices force companies to refocus on cost reduction to meet financial return targets. This commodity price risk requires companies to be cautious that their growth agenda remains resilient even in periods of lower prices. ConocoPhillips’ experience in 2008 and 2009 provides a cautionary tale against unfettered growth investments.
Commercial risks are endemic in large major projects such as LNG and oil sands, where security of demand and some sharing of price risk with buyers can be advantageous to both sides. Two examples of political risk are described above, which may have contributed to lower TSR than Total and Chevron’s strong financial performances might have merited. Technical risk is illustrated through BP’s experiences at Texas City and Macondo. Investors will likely be concerned that risks that have hurt companies in the past may recur and will tend to discount the future cash flows promised by the companies to allow for possible future mishaps. By contrast ExxonMobil appears to have a risk advantage over its peers as a result of deeply ingrained risk management practices. This type of risk analysis is different from the investor risk derived for CAPM models and there remains a challenge to reconcile the two different lenses on risk.
4. Super-major Business Strategies
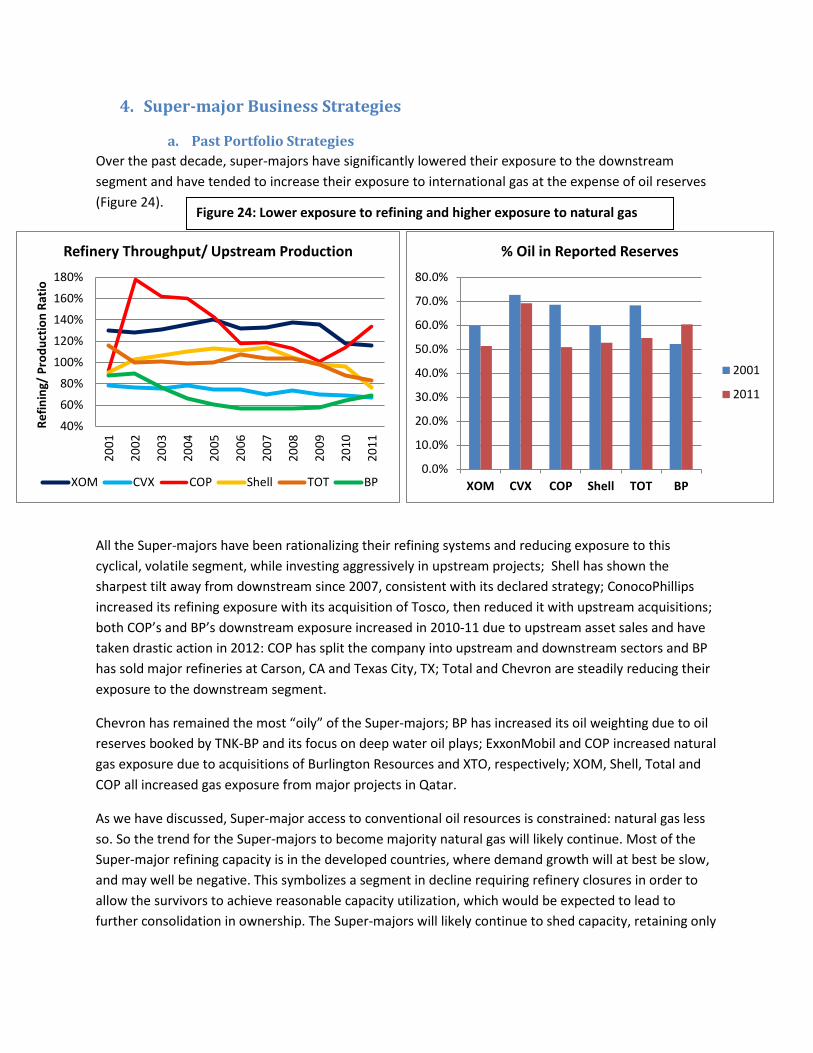
a. Past Portfolio Strategies Over the past decade, super-majors have significantly lowered their exposure to the downstream segment and have tended to increase their exposure to international gas at the expense of oil reserves (Figure 24).
All the Super-majors have been rationalizing their refining systems and reducing exposure to this cyclical, volatile segment, while investing aggressively in upstream projects; Shell has shown the sharpest tilt away from downstream since 2007, consistent with its declared strategy; ConocoPhillips increased its refining exposure with its acquisition of Tosco, then reduced it with upstream acquisitions; both COP’s and BP’s downstream exposure increased in 2010-11 due to upstream asset sales and have taken drastic action in 2012: COP has split the company into upstream and downstream sectors and BP has sold major refineries at Carson, CA and Texas City, TX; Total and Chevron are steadily reducing their exposure to the downstream segment.
Chevron has remained the most “oily” of the Super-majors; BP has increased its oil weighting due to oil reserves booked by TNK-BP and its focus on deep water oil plays; ExxonMobil and COP increased natural gas exposure due to acquisitions of Burlington Resources and XTO, respectively; XOM, Shell, Total and COP all increased gas exposure from major projects in Qatar.
As we have discussed, Super-major access to conventional oil resources is constrained: natural gas less so. So the trend for the Super-majors to become majority natural gas will likely continue. Most of the Super-major refining capacity is in the developed countries, where demand growth will at best be slow, and may well be negative. This symbolizes a segment in decline requiring refinery closures in order to allow the survivors to achieve reasonable capacity utilization, which would be expected to lead to further consolidation in ownership. The Super-majors will likely continue to shed capacity, retaining only
40%
60%
80%
100%
120%
140%
160%
180%
2001
2002
2003
2004
2005
2006
2007
2008
2009
2010
2011
Refin
ing/
Pro
duct
ion
Ratio
Refinery Throughput/ Upstream Production
XOM CVX COP Shell TOT BP0.0%
10.0%
20.0%
30.0%
40.0%
50.0%
60.0%
70.0%
80.0%
XOM CVX COP Shell TOT BP
% Oil in Reported Reserves
2001
2011
Figure 24: Lower exposure to refining and higher exposure to natural gas
their best refineries: those capable of processing a wide range of feedstocks and those integrated to petrochemicals.
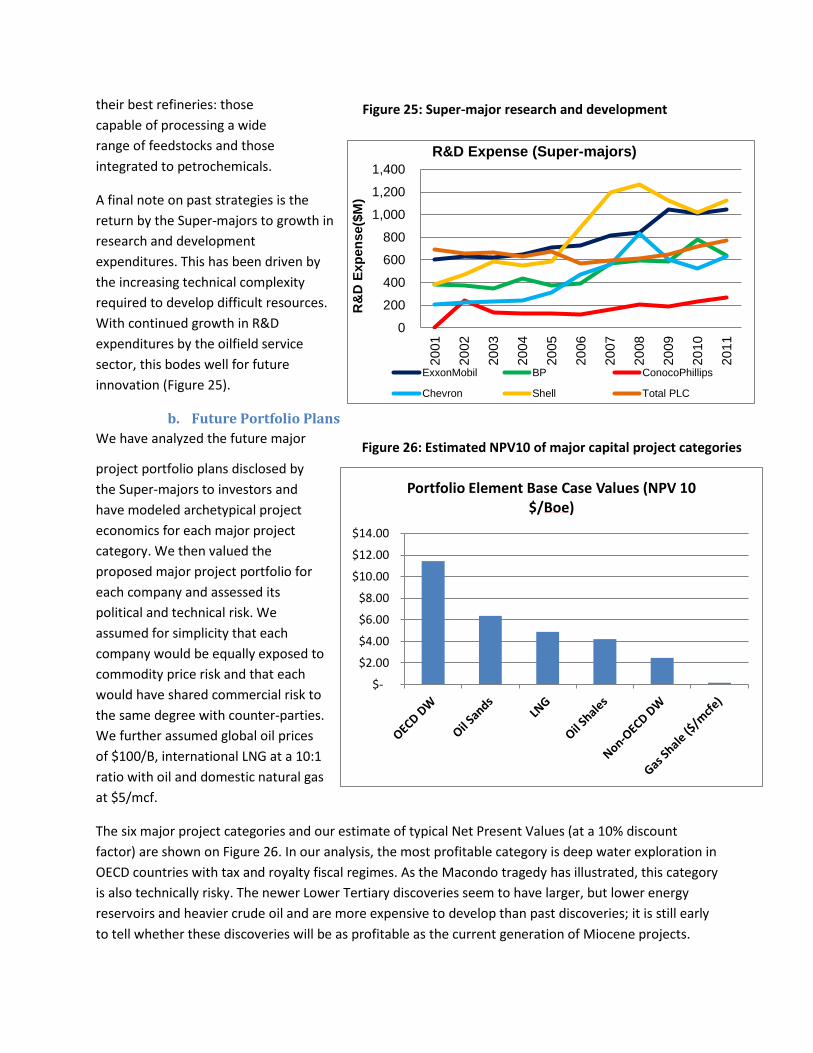
A final note on past strategies is the return by the Super-majors to growth in research and development expenditures. This has been driven by the increasing technical complexity required to develop difficult resources. With continued growth in R&D expenditures by the oilfield service sector, this bodes well for future innovation (Figure 25).
b. Future Portfolio Plans We have analyzed the future major
project portfolio plans disclosed by the Super-majors to investors and have modeled archetypical project economics for each major project category. We then valued the proposed major project portfolio for each company and assessed its political and technical risk. We assumed for simplicity that each company would be equally exposed to commodity price risk and that each would have shared commercial risk to the same degree with counter-parties. We further assumed global oil prices of $100/B, international LNG at a 10:1 ratio with oil and domestic natural gas at $5/mcf.
The six major project categories and our estimate of typical Net Present Values (at a 10% discount factor) are shown on Figure 26. In our analysis, the most profitable category is deep water exploration in OECD countries with tax and royalty fiscal regimes. As the Macondo tragedy has illustrated, this category is also technically risky. The newer Lower Tertiary discoveries seem to have larger, but lower energy reservoirs and heavier crude oil and are more expensive to develop than past discoveries; it is still early to tell whether these discoveries will be as profitable as the current generation of Miocene projects.
0
200
400
600
800
1,000
1,200
1,400
2001
2002
2003
2004
2005
2006
2007
2008
2009
2010
2011
R&
D E
xpen
se($
M)
R&D Expense (Super-majors)
ExxonMobil BP ConocoPhillips
Chevron Shell Total PLC
Figure 25: Super-major research and development
Figure 26: Estimated NPV10 of major capital project categories
$-
$2.00
$4.00
$6.00
$8.00
$10.00
$12.00
$14.00
Portfolio Element Base Case Values (NPV 10 $/Boe)
Canadian oil sands projects using Steam Assisted Gravity Drainage are also profitable assuming an international (Brent) oil price of $100/B but are vulnerable at lower prices. LNG is profitable, especially for resources with significant associated oil and natural gas liquids. Oil shales such as Bakken and Eagle Ford are also profitable. Non-OECD deep water projects are less profitable when under a standard production sharing agreement, though prospects negotiated in the early stages of a new play can be negotiated at more favorable terms. At this point in time, it is difficult to attribute any value to North American natural gas resources, which seem likely to remain a cost of capital business for some time to come.
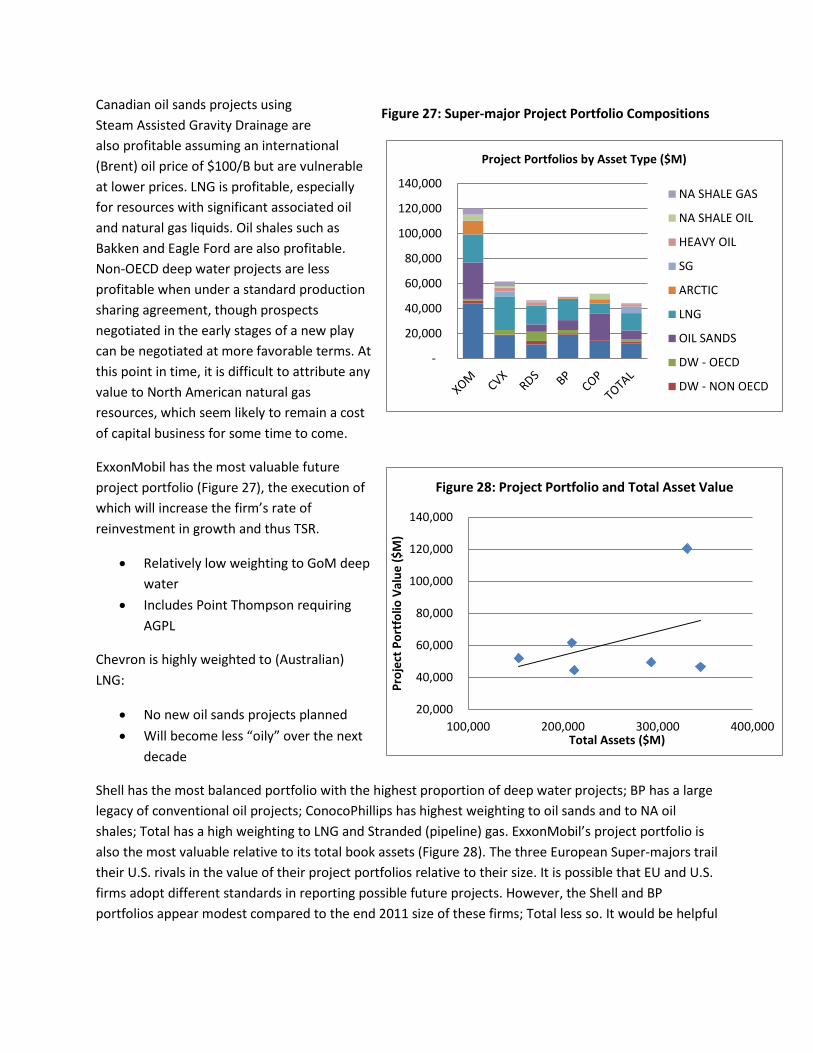
ExxonMobil has the most valuable future project portfolio (Figure 27), the execution of which will increase the firm’s rate of reinvestment in growth and thus TSR.
• Relatively low weighting to GoM deep water
• Includes Point Thompson requiring AGPL
Chevron is highly weighted to (Australian) LNG:
• No new oil sands projects planned • Will become less “oily” over the next
decade
Shell has the most balanced portfolio with the highest proportion of deep water projects; BP has a large legacy of conventional oil projects; ConocoPhillips has highest weighting to oil sands and to NA oil shales; Total has a high weighting to LNG and Stranded (pipeline) gas. ExxonMobil’s project portfolio is also the most valuable relative to its total book assets (Figure 28). The three European Super-majors trail their U.S. rivals in the value of their project portfolios relative to their size. It is possible that EU and U.S. firms adopt different standards in reporting possible future projects. However, the Shell and BP portfolios appear modest compared to the end 2011 size of these firms; Total less so. It would be helpful
Figure 27: Super-major Project Portfolio Compositions
-
20,000
40,000
60,000
80,000
100,000
120,000
140,000
Project Portfolios by Asset Type ($M)
NA SHALE GAS
NA SHALE OIL
HEAVY OIL
SG
ARCTIC
LNG
OIL SANDS
DW - OECD
DW - NON OECD
20,000
40,000
60,000
80,000
100,000
120,000
140,000
100,000 200,000 300,000 400,000
Proj
ect P
ortf
olio
Val
ue ($
M)
Total Assets ($M)
Figure 28: Project Portfolio and Total Asset Value
for the companies to adopt common threshold standards of likely completion for disclosure of their future project portfolios.
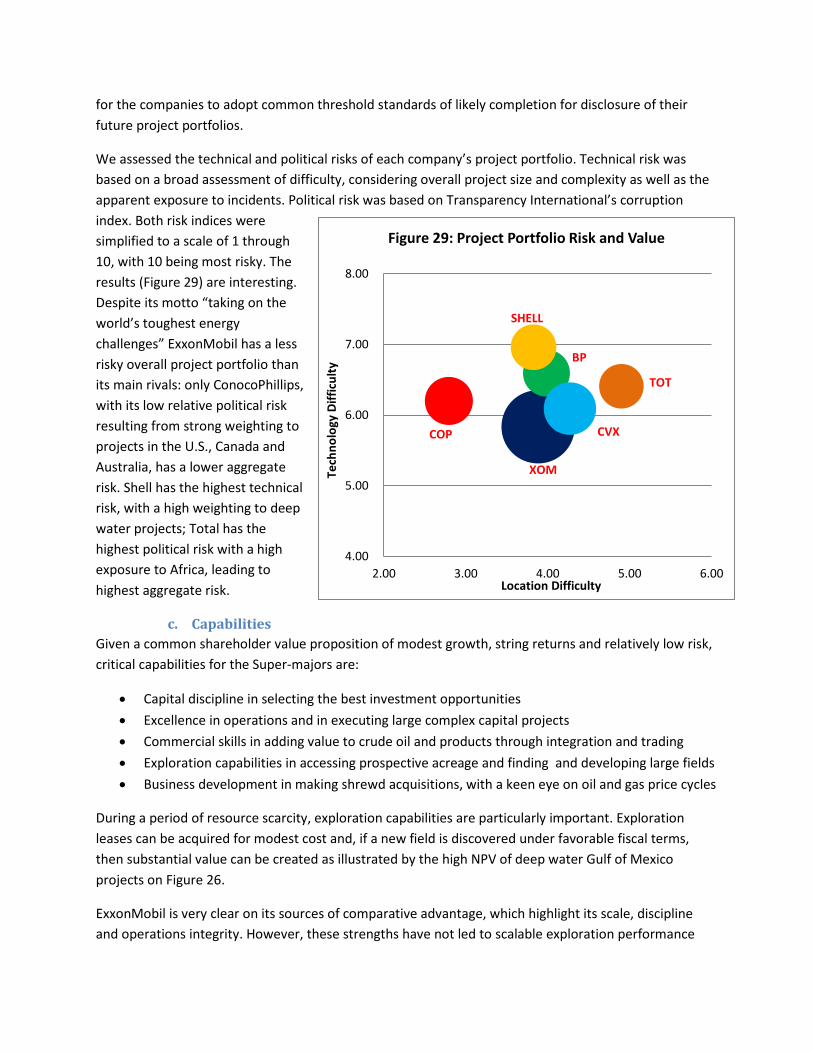
We assessed the technical and political risks of each company’s project portfolio. Technical risk was based on a broad assessment of difficulty, considering overall project size and complexity as well as the apparent exposure to incidents. Political risk was based on Transparency International’s corruption index. Both risk indices were simplified to a scale of 1 through 10, with 10 being most risky. The results (Figure 29) are interesting. Despite its motto “taking on the world’s toughest energy challenges” ExxonMobil has a less risky overall project portfolio than its main rivals: only ConocoPhillips, with its low relative political risk resulting from strong weighting to projects in the U.S., Canada and Australia, has a lower aggregate risk. Shell has the highest technical risk, with a high weighting to deep water projects; Total has the highest political risk with a high exposure to Africa, leading to highest aggregate risk.
c. Capabilities Given a common shareholder value proposition of modest growth, string returns and relatively low risk, critical capabilities for the Super-majors are:
• Capital discipline in selecting the best investment opportunities • Excellence in operations and in executing large complex capital projects • Commercial skills in adding value to crude oil and products through integration and trading • Exploration capabilities in accessing prospective acreage and finding and developing large fields • Business development in making shrewd acquisitions, with a keen eye on oil and gas price cycles
During a period of resource scarcity, exploration capabilities are particularly important. Exploration leases can be acquired for modest cost and, if a new field is discovered under favorable fiscal terms, then substantial value can be created as illustrated by the high NPV of deep water Gulf of Mexico projects on Figure 26.
ExxonMobil is very clear on its sources of comparative advantage, which highlight its scale, discipline and operations integrity. However, these strengths have not led to scalable exploration performance
XOM
BP
CVX COP
SHELL
TOT
4.00
5.00
6.00
7.00
8.00
2.00 3.00 4.00 5.00 6.00
Tech
nolo
gy D
iffic
ulty
Location Difficulty
Figure 29: Project Portfolio Risk and Value
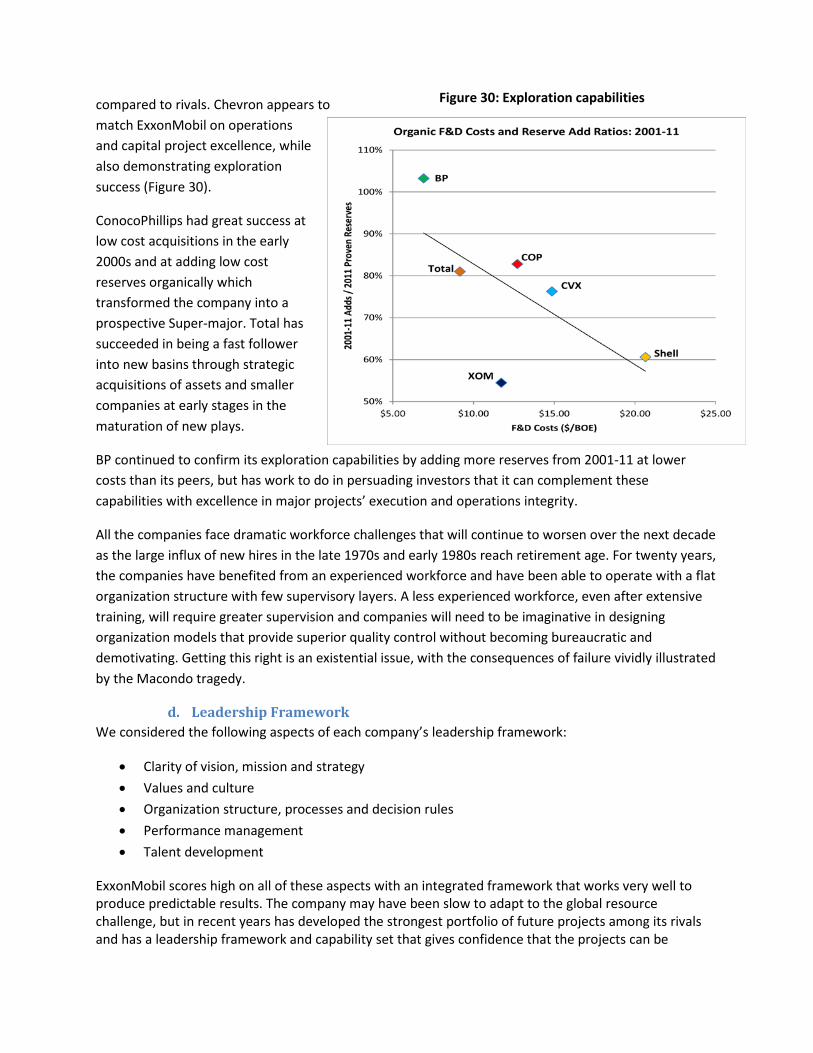
compared to rivals. Chevron appears to match ExxonMobil on operations and capital project excellence, while also demonstrating exploration success (Figure 30).
ConocoPhillips had great success at low cost acquisitions in the early 2000s and at adding low cost reserves organically which transformed the company into a prospective Super-major. Total has succeeded in being a fast follower into new basins through strategic acquisitions of assets and smaller companies at early stages in the maturation of new plays.
BP continued to confirm its exploration capabilities by adding more reserves from 2001-11 at lower costs than its peers, but has work to do in persuading investors that it can complement these capabilities with excellence in major projects’ execution and operations integrity.
All the companies face dramatic workforce challenges that will continue to worsen over the next decade as the large influx of new hires in the late 1970s and early 1980s reach retirement age. For twenty years, the companies have benefited from an experienced workforce and have been able to operate with a flat organization structure with few supervisory layers. A less experienced workforce, even after extensive training, will require greater supervision and companies will need to be imaginative in designing organization models that provide superior quality control without becoming bureaucratic and demotivating. Getting this right is an existential issue, with the consequences of failure vividly illustrated by the Macondo tragedy.
d. Leadership Framework We considered the following aspects of each company’s leadership framework:
• Clarity of vision, mission and strategy • Values and culture • Organization structure, processes and decision rules • Performance management • Talent development
ExxonMobil scores high on all of these aspects with an integrated framework that works very well to produce predictable results. The company may have been slow to adapt to the global resource challenge, but in recent years has developed the strongest portfolio of future projects among its rivals and has a leadership framework and capability set that gives confidence that the projects can be
Figure 30: Exploration capabilities
delivered effectively. Similarly, Total appears to have a stable and well integrated leadership framework that is particularly strong in fostering close relations with stakeholders in countries where it is difficult to operate. Chevron also has a stable organization structure with well defined and well observed business processes as well as a strong safety ethic. All the companies have well established approaches to building talent, though the poor reputation of the industry in the developed countries dampens access to some of the best and brightest candidates. There are increasing recent efforts to address this reputation disadvantage, which was identified in a 1996 National Petroleum Council study on “Future Issues-A View of U. S. Oil & Natural Gas to 2020” but left largely unaddressed for a decade. Shell is still working on organization and cultural issues that emerged in the reserves scandal. Cultural change in a huge multinational corporation is difficult and takes time. BP is earlier in a process of organization and cultural change and has made significant changes to its performance management and rewards system. In both companies, there has been a concern that short term performance metrics and related incentive compensation contributed to behaviors that destroyed significant shareholder value.
Given the challenge for these companies to access and develop difficult resources, often in difficult countries, it is paramount that they do not create incentive systems that encourage behaviors that cut corners in accessing opportunities or in designing and delivering major projects. Such behaviors increase both political and technical risk, with potentially large value destruction consequences.
5. Conclusions After reviewing the global energy, oil and natural gas projections by BP, ExxonMobil, the IEA and EIA, the consensus view seems to be more of the same: moderate, slowing growth in oil demand coupled with stronger growth in natural gas demand, with technical and political constraints on oil supply growth, but abundant (albeit expensive if distant from markets) natural gas supplies. The EIA and IEA expect robust prices for oil and international natural gas prices if there are no significant changes to current government policies regarding energy demand and supplies.
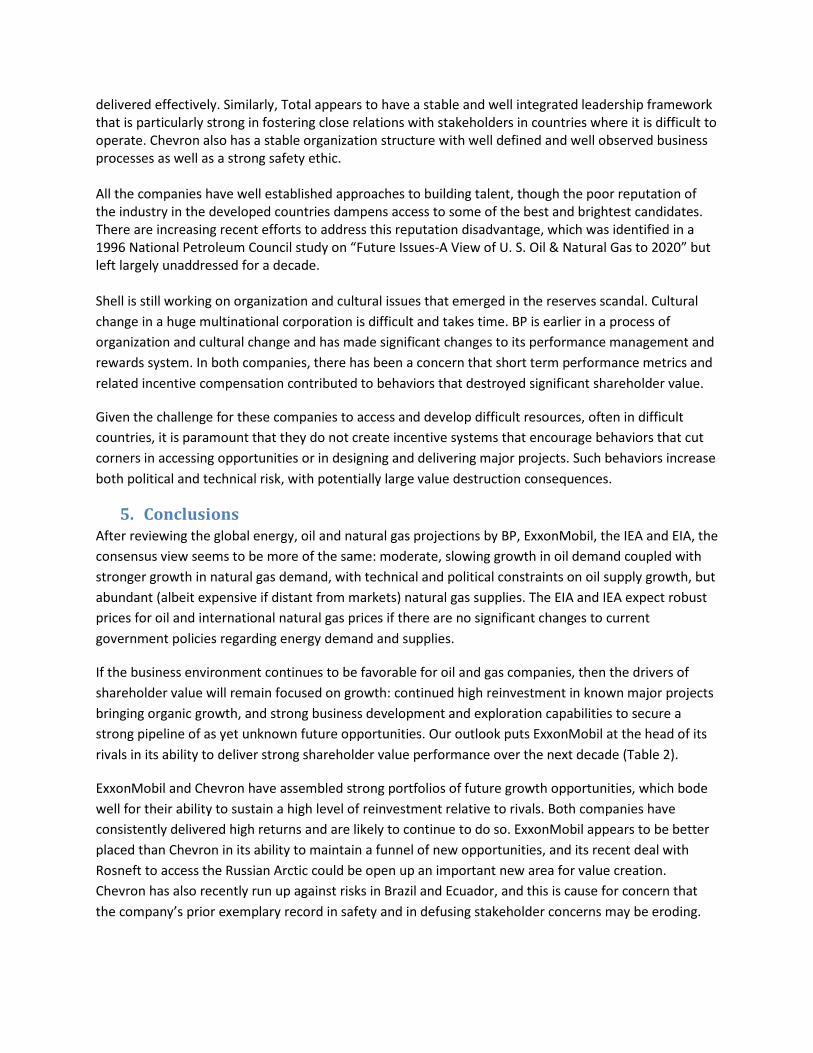
If the business environment continues to be favorable for oil and gas companies, then the drivers of shareholder value will remain focused on growth: continued high reinvestment in known major projects bringing organic growth, and strong business development and exploration capabilities to secure a strong pipeline of as yet unknown future opportunities. Our outlook puts ExxonMobil at the head of its rivals in its ability to deliver strong shareholder value performance over the next decade (Table 2).
ExxonMobil and Chevron have assembled strong portfolios of future growth opportunities, which bode well for their ability to sustain a high level of reinvestment relative to rivals. Both companies have consistently delivered high returns and are likely to continue to do so. ExxonMobil appears to be better placed than Chevron in its ability to maintain a funnel of new opportunities, and its recent deal with Rosneft to access the Russian Arctic could be open up an important new area for value creation. Chevron has also recently run up against risks in Brazil and Ecuador, and this is cause for concern that the company’s prior exemplary record in safety and in defusing stakeholder concerns may be eroding.
Of the European companies, Total has consistently invested strongly in growth, delivered good returns and, though its published project portfolio is less impressive than those of the U.S. companies, has an excellent record of being a fast follower into new centers of opportunity through targeted acquisitions. BP has tremendous upside on returns once it has rationalized its operating portfolio, but starts with a relatively meager growth portfolio. Nevertheless, its strength in exploration should over the long term provide profitable growth opportunities. The company’s Achilles Heel, of course is a high level of perceived risk stemming from its record in the 2000s and its uneasy relationship with its Russian partners. On the face of it, Shell’s TSR outlook is questionable: it has a modest growth portfolio, its returns have been damaged by cost overruns in major projects and its exploration track record is mediocre. However, there are encouraging signs that the governance issues of the period 2002-07 have been left behind and the new centralized organization structure may improve consistency in project delivery and operations.
Table 2: Outlook for Super-major Shareholder Returns (2011-21)
Note: Direction of Arrow: up= strong; down= weak Color of arrow: Green= highly likely; Red= highly uncertain
ConocoPhillips has assembled a robust portfolio of growth projects that could fuel future growth investments. However, the portfolio is heavily weighted to Canadian oil sands9 which are most
9 Since completing its split from the Phillips66 downstream business in 2012, COP has reduced its exposure to oil sands through asset sales.
valuable when integrated into a refining system. The split of upstream from downstream has severed that link and the company is now divesting some of its oil sands assets. The company’s ability to replenish its growth portfolio as an independent is a concern.
All the companies will most likely continue to reduce exposure to refining in the developed countries, though perhaps not to the extreme of ConocoPhillips’ split, and continue the shift towards natural gas. They will expand further their exploration programs.
Acquisitions will continue to play a role in Super-major value creation. In the future, the emphasis will be less on capture of “synergies” (cost cutting) and more on adding to the opportunity portfolio and expanding technical band-width. However, there will likely be few bargains and value creation over the coming decade will continue to derive mainly from investing in organic growth. In turn the organic growth will be found in developing increasingly difficult resources often in places where it is difficult to operate.
This will put great pressure on human capital, particularly in light of the bimodal demographics that characterize the Super-major work force. New organizational models must be found to promote ethical access to potential resources followed by safe and effective project delivery with a less experienced workforce; talent development will have to be accelerated; and there will probably have to be further knowledge specialization combined with new approaches to integrating the specialized knowledge elements underpinned by networked information systems.
The Super-majors outperformed the broad market TSR over the past decade and will probably do so again in the next decade assuming oil prices remain robust. Energy commodity prices will doubtless continue to be volatile, so companies will continue to adopt conservative financing strategies. Nevertheless, growth opportunities will continue to emerge: the winners will capture the best of them, allocate capital to a continuously renewing portfolio of projects and execute flawlessly. They will be imaginative in rebuilding their capabilities, and will make sure that their leadership framework encourages high performance and risk elimination in projects and operations.
To conclude, we identify a number of issues that we think would benefit from further research:
• It would be informative to contrast the value drivers of TSR during the period studied with the value drivers of TSR during a period of lower, less volatile prices such as the 1990s.
• Including a valuation of the companies’ future project portfolios appears to be supported by an encouraging statistical significance. However, we recognize that the approach used required heroic simplifying assumptions. It would be worthwhile to investigate further how robust the findings would be to variation in these assumptions.
• Is there sufficient public data on projects to allow an annual time series of the project value analysis to be assembled and would that time series help explain annual changes in TSR?
• This research has attempted to quantify relative technical and political risks of the companies’ future portfolios in simplified approach analogous to the way the companies manage project risks. Traditional CAPM focuses on investor risk of owning the target company’s stock relative to a broad based index of stocks. As has been described above,
there are also risks in operating the base business (e.g., Exxon Valdez, BP Texas City accidents, Chevron’s Ecuador judgment, Total’s oil for food trial). Further research on reconciling these various sources of risk and their implications on value would be valuable.
• The trend towards reduced exposure to refining, and increased exposure to natural gas will likely continue. These trends open up the question of whether the multi-business model perpetuated by the Super-majors is value enhancing or not. ConocoPhillips has decided that it was not working for their shareholders as on a smaller scale has Marathon. This is not a new question, but is again topical and worth deeper study.
• Perhaps the most serious area of study is on the organizational models and leadership frameworks that will allow accelerated development of a new workforce capable of continuously improving environmental, health and safety performance to lower future risks of tragic incidents, while developing an ever more technically and politically complex set of major projects.
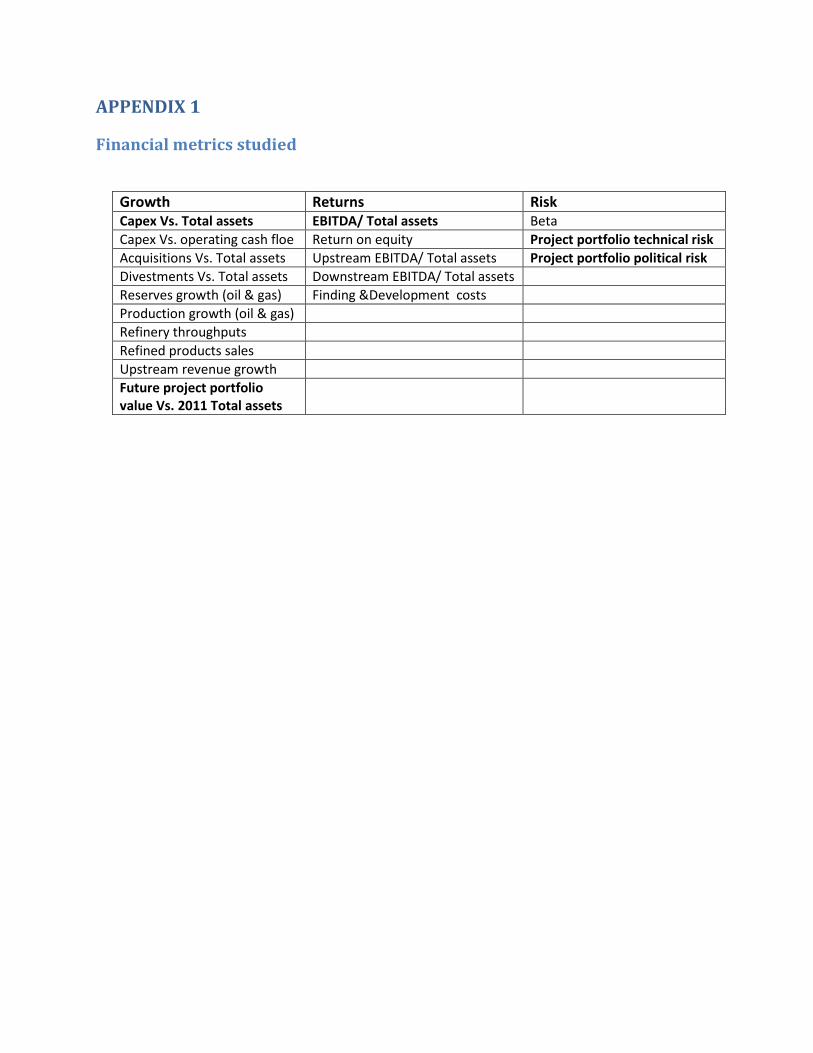
APPENDIX 1
Financial metrics studied
Growth Returns Risk Capex Vs. Total assets EBITDA/ Total assets Beta Capex Vs. operating cash floe Return on equity Project portfolio technical risk Acquisitions Vs. Total assets Upstream EBITDA/ Total assets Project portfolio political risk Divestments Vs. Total assets Downstream EBITDA/ Total assets Reserves growth (oil & gas) Finding &Development costs Production growth (oil & gas) Refinery throughputs Refined products sales Upstream revenue growth Future project portfolio value Vs. 2011 Total assets

APPENDIX 2 May be needed to elaborate further on Section 4b, our methodology for valuing project categories.
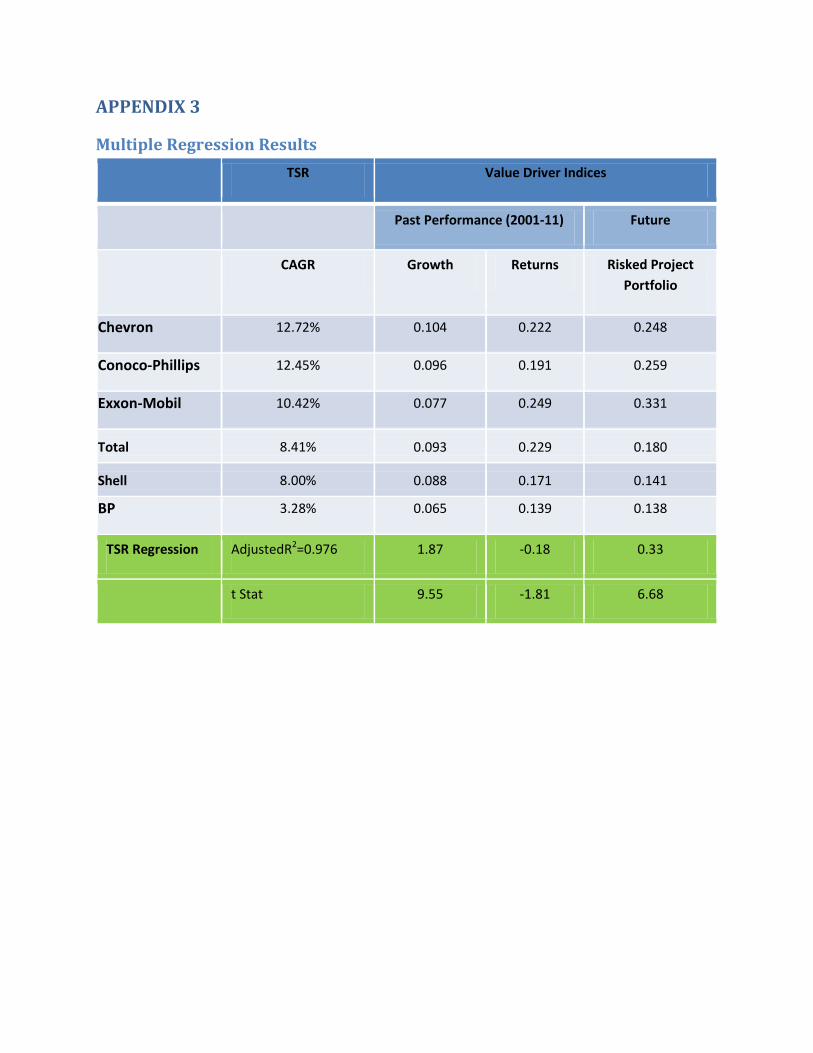
APPENDIX 3
Multiple Regression Results TSR Value Driver Indices
Past Performance (2001-11) Future
CAGR Growth Returns Risked Project Portfolio
Chevron 12.72% 0.104 0.222 0.248
Conoco-Phillips 12.45% 0.096 0.191 0.259
Exxon-Mobil 10.42% 0.077 0.249 0.331
Total 8.41% 0.093 0.229 0.180 Shell 8.00% 0.088 0.171 0.141 BP 3.28% 0.065 0.139 0.138
TSR Regression AdjustedR2=0.976 1.87 -0.18 0.33
t Stat 9.55 -1.81 6.68
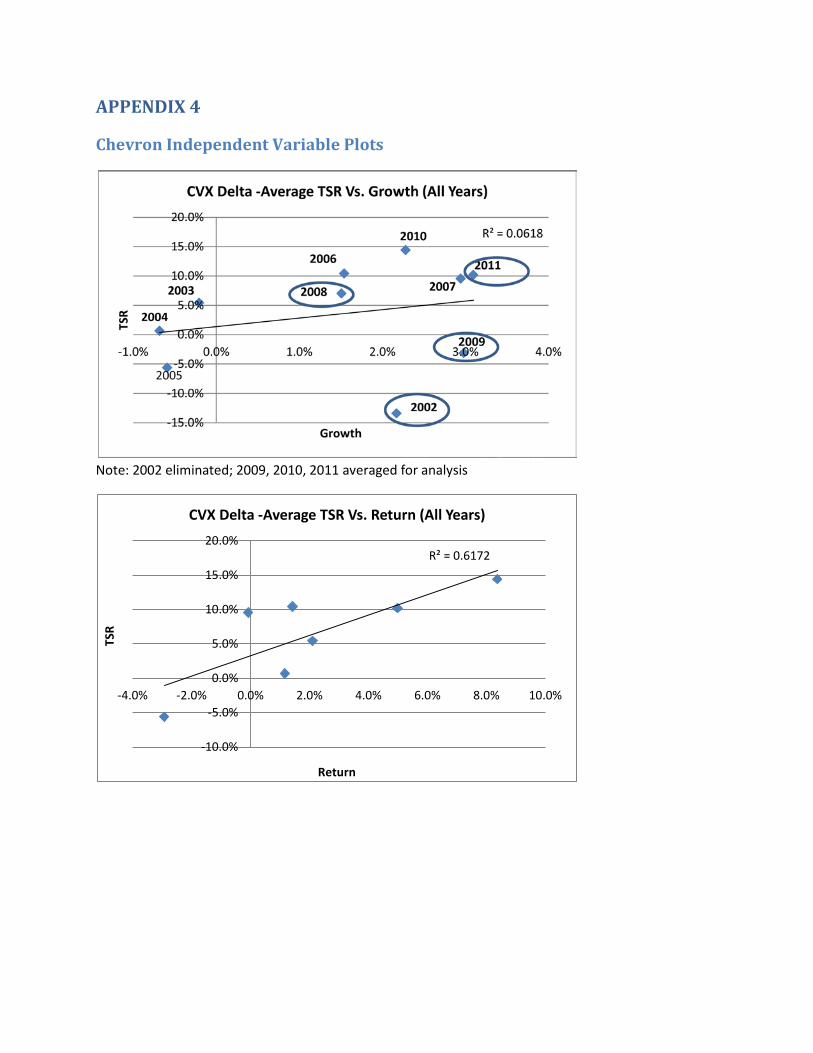
APPENDIX 4
Chevron Independent Variable Plots
Note: 2002 eliminated; 2009, 2010, 2011 averaged for analysis
R² = 0.6172
-10.0%
-5.0%
0.0%
5.0%
10.0%
15.0%
20.0%
-4.0% -2.0% 0.0% 2.0% 4.0% 6.0% 8.0% 10.0%
TSR
Return
CVX Delta -Average TSR Vs. Return (All Years)
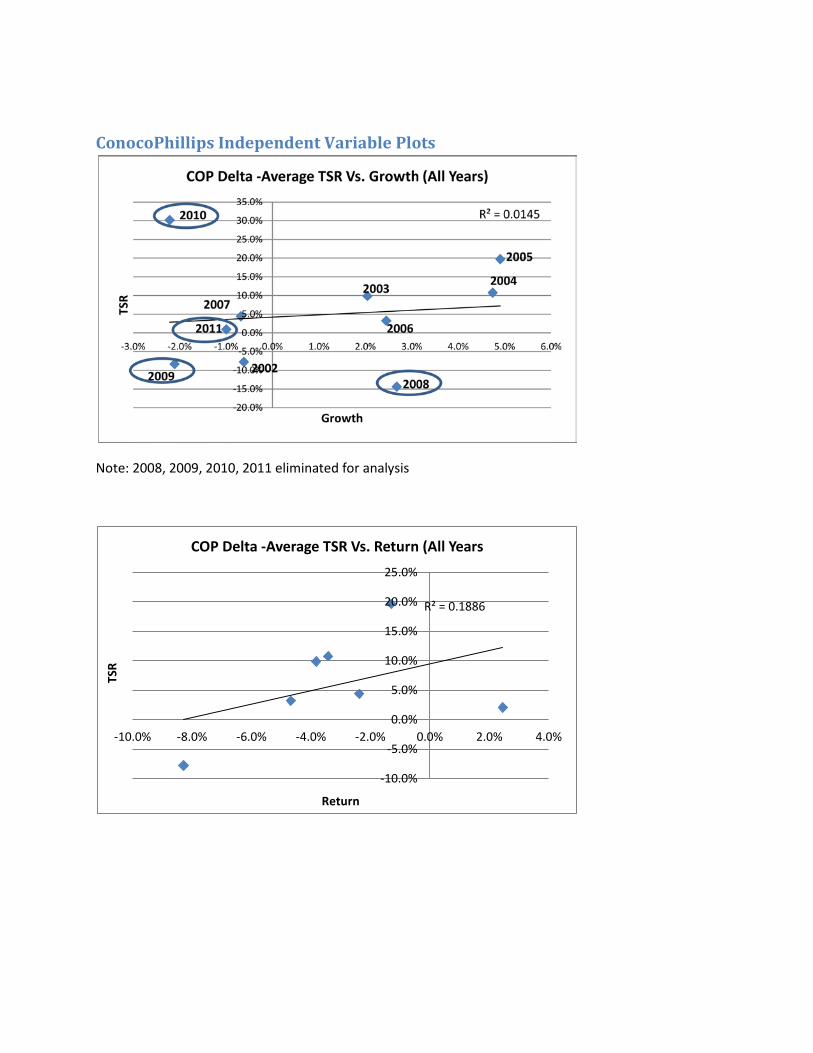
ConocoPhillips Independent Variable Plots
Note: 2008, 2009, 2010, 2011 eliminated for analysis
R² = 0.1886
-10.0%
-5.0%
0.0%
5.0%
10.0%
15.0%
20.0%
25.0%
-10.0% -8.0% -6.0% -4.0% -2.0% 0.0% 2.0% 4.0%
TSR
Return
COP Delta -Average TSR Vs. Return (All Years
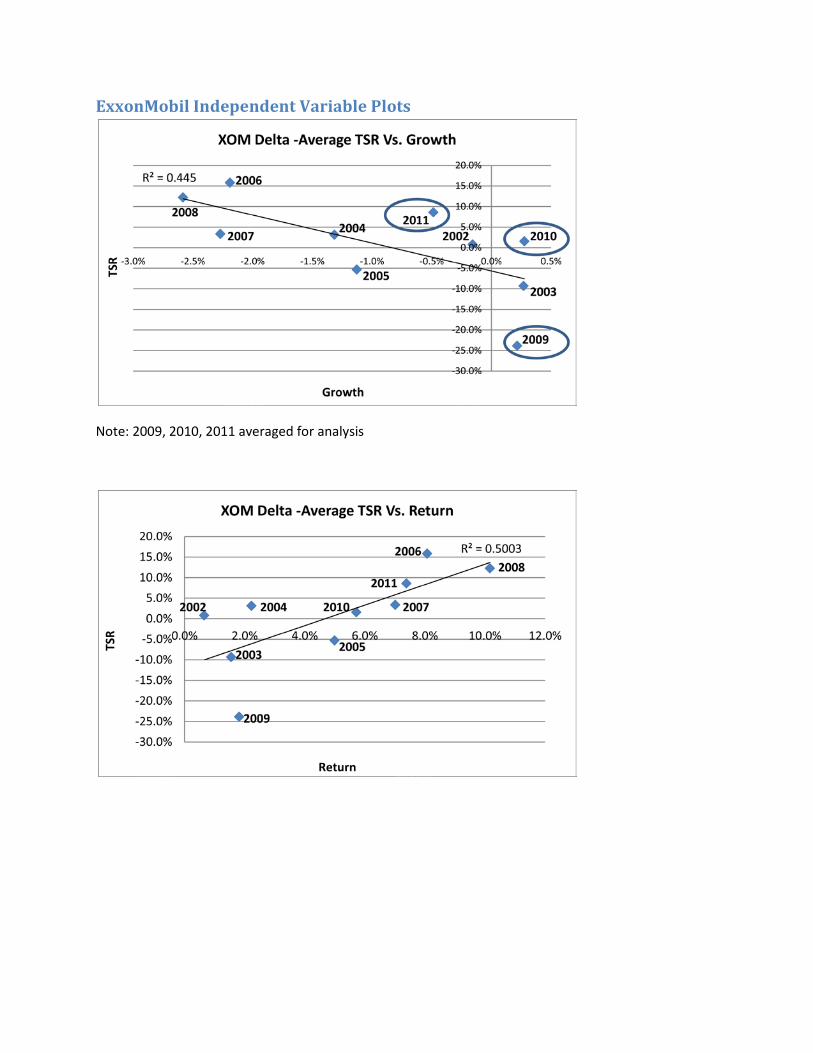
ExxonMobil Independent Variable Plots
Note: 2009, 2010, 2011 averaged for analysis
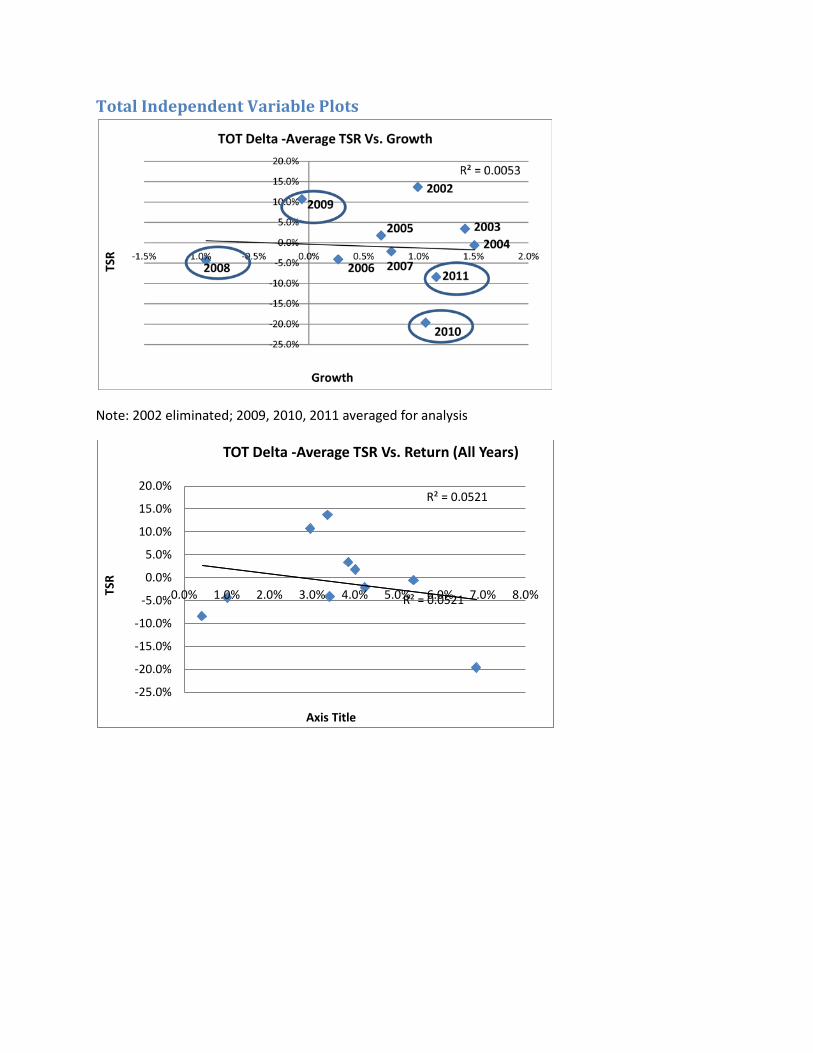
Total Independent Variable Plots
Note: 2002 eliminated; 2009, 2010, 2011 averaged for analysis
R² = 0.0521
R² = 0.0521
-25.0%
-20.0%
-15.0%
-10.0%
-5.0%
0.0%
5.0%
10.0%
15.0%
20.0%
0.0% 1.0% 2.0% 3.0% 4.0% 5.0% 6.0% 7.0% 8.0%TSR
Axis Title
TOT Delta -Average TSR Vs. Return (All Years)
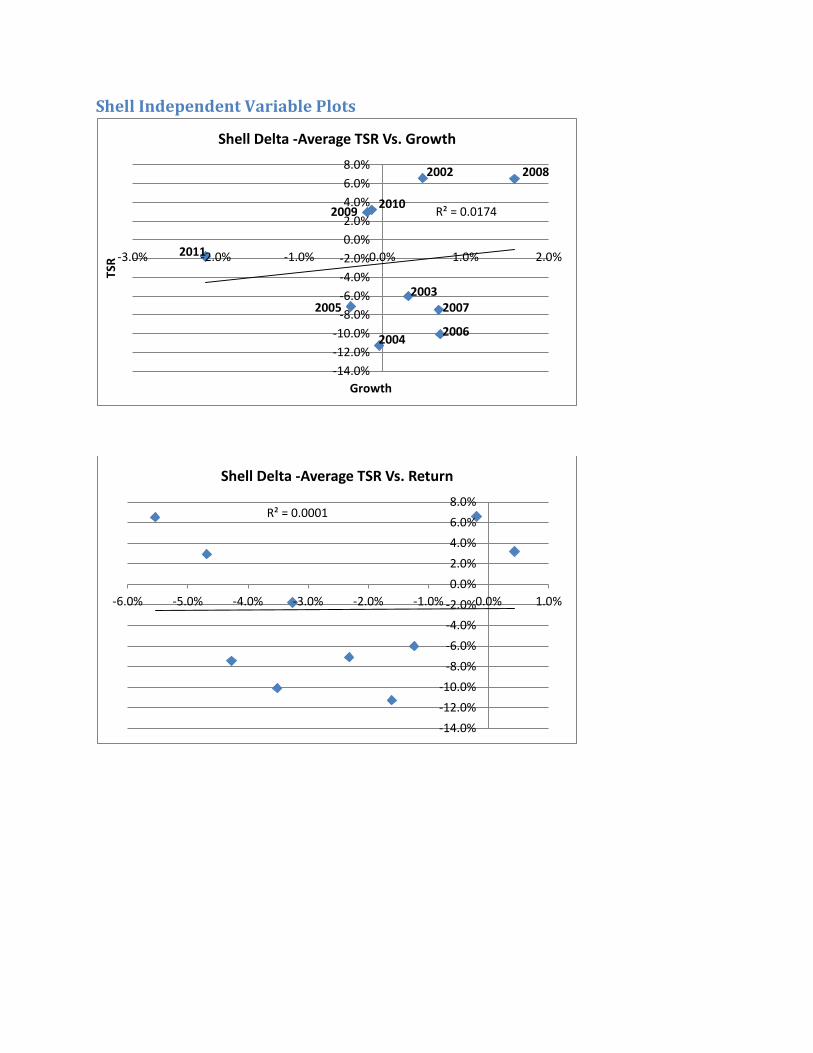
Shell Independent Variable Plots
R² = 0.0174
-14.0%-12.0%-10.0%
-8.0%-6.0%-4.0%-2.0%0.0%2.0%4.0%6.0%8.0%
-3.0% -2.0% -1.0% 0.0% 1.0% 2.0%
TSR
Growth
Shell Delta -Average TSR Vs. Growth
2003
2004
2005
2006
2007
2002
2011
2010 2009
2008
R² = 0.0001
-14.0%-12.0%-10.0%
-8.0%-6.0%-4.0%-2.0%0.0%2.0%4.0%6.0%8.0%
-6.0% -5.0% -4.0% -3.0% -2.0% -1.0% 0.0% 1.0%
Shell Delta -Average TSR Vs. Return
BP Independent Variable Plots
R² = 0.8742
-40.0%
-30.0%
-20.0%
-10.0%
0.0%
10.0%
20.0%
30.0%
-14.0% -12.0% -10.0% -8.0% -6.0% -4.0% -2.0% 0.0%
TSR
Return
BP Delta -Average TSR Vs. Return
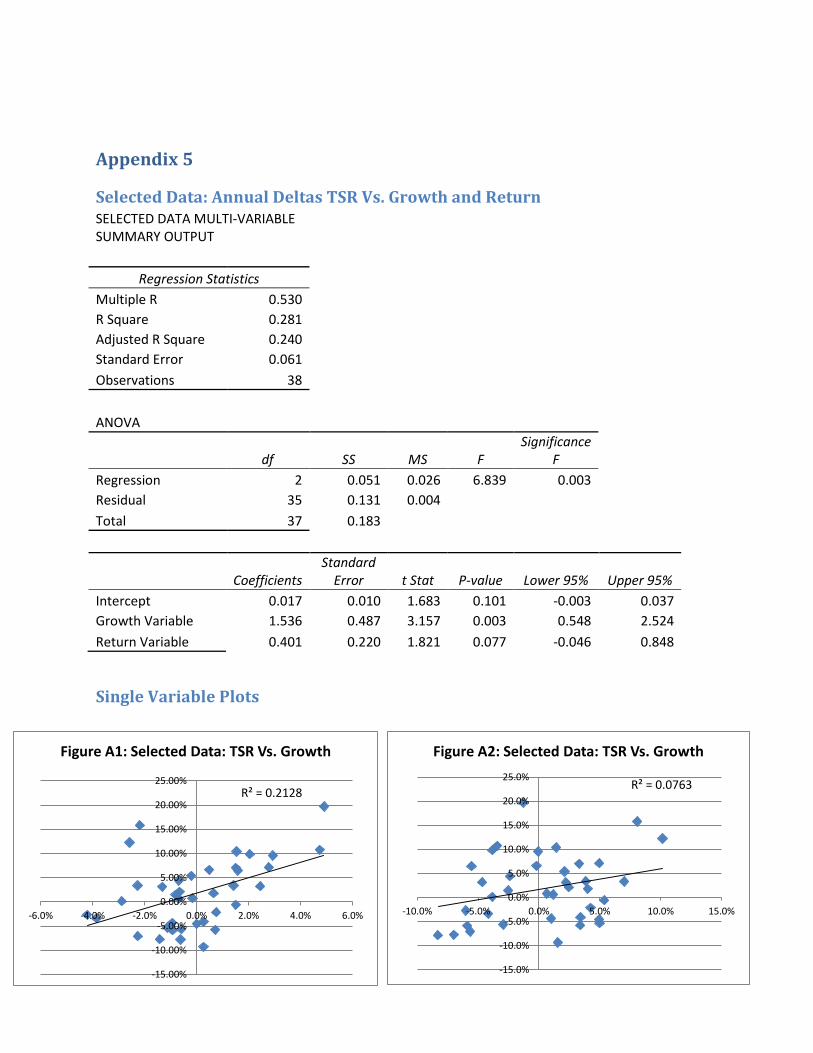
Appendix 5
Selected Data: Annual Deltas TSR Vs. Growth and Return SELECTED DATA MULTI-VARIABLE SUMMARY OUTPUT
Regression Statistics
Multiple R 0.530 R Square 0.281 Adjusted R Square 0.240 Standard Error 0.061 Observations 38
ANOVA
df SS MS F Significance
F Regression 2 0.051 0.026 6.839 0.003 Residual 35 0.131 0.004
Total 37 0.183
Coefficients
Standard Error t Stat P-value Lower 95% Upper 95%
Intercept 0.017 0.010 1.683 0.101 -0.003 0.037 Growth Variable 1.536 0.487 3.157 0.003 0.548 2.524 Return Variable 0.401 0.220 1.821 0.077 -0.046 0.848
Single Variable Plots
R² = 0.0763
-15.0%
-10.0%
-5.0%
0.0%
5.0%
10.0%
15.0%
20.0%
25.0%
-10.0% -5.0% 0.0% 5.0% 10.0% 15.0%
Figure A2: Selected Data: TSR Vs. Growth
R² = 0.2128
-15.00%
-10.00%
-5.00%
0.00%
5.00%
10.00%
15.00%
20.00%
25.00%
-6.0% -4.0% -2.0% 0.0% 2.0% 4.0% 6.0%
Figure A1: Selected Data: TSR Vs. Growth