
The Success and Relevance of Shareholder Activism through ... Szilagyi... · The Success and...
44
The Success and Relevance of Shareholder Activism through Proxy Proposals Luc Renneboog • Tilburg University, European Corporate Governance Institute Peter G. Szilagyi Judge Business School – University of Cambridge Abstract – This paper reexamines the role and effectiveness of shareholder proposals in mitigating agency problems. Previous studies report insignificant or negative stock price reactions to proposal announcements, and infer that the market interprets shareholder activists’ use of the proxy process as a negative signal of failed private negotiations with management. Using a very large sample of proposals submitted between 1996 and 2005, we show for the first time that shareholder proposals are actually met with positive price reactions, especially when takeover-related or sponsored by public pension funds. Moreover, we use sample selection models to show that the market reactions, the voting outcomes, and the very selection of target firms are all strongly related to a variety of governance considerations, including (i) the targets’ use of anti-takeover provisions, (ii) board effectiveness, and (iii) the performance sensitivity of CEO pay. Overall, we conclude that the market does perceive shareholder proposals to be a relevance control device, which actually explains why activists are prepared to bear the non-trivial costs of sponsoring them. Keywords: Shareholder proposals, shareholder voting, corporate governance, proxy proposal. JEL Classification: G34 We are grateful for valuable suggestions to Jonathan Batten, Arnoud Boot, Fabio Braggion, Hans Degryse, Piet Duffhues, Igor Loncarski, Colin Mayer, Joe McCahery, Maria Fabiana Penas, Enrico Perotti, Peter Vinderhout, and Paolo Volpin and the seminar participants at Tilburg University, the University of Oxford, the University of Cambridge, the University of Toronto, Universitat Pompeu Fabra, ESSEC Business School, the 2006 Workshop of the European Corporate Governance Institute in Venice, the 2007 European Financial Management Association Meeting in Vienna. Luc Renneboog is grateful to the Netherlands Organization for Scientific Research for funding under the ‘Shifts in Governance’ programme and to the European Commission via the ‘New Modes of Governance’-project (NEWGOV) led by the European University Institute in Florence; contract nr. CIT1-CT-2004-506392. Peter Szilagyi is grateful for funding from the European Commission through the European Corporate Governance Training Network. Renneboog: +31 (0) 13 4668210, [email protected] ; Szilagyi: +44 (0) 1223 364026, [email protected] .
Transcript of The Success and Relevance of Shareholder Activism through ... Szilagyi... · The Success and...
The Success and Relevance of Shareholder Activism
through Proxy Proposals
Luc Renneboog• Tilburg University, European Corporate Governance Institute
Peter G. Szilagyi Judge Business School – University of Cambridge
Abstract – This paper reexamines the role and effectiveness of shareholder proposals in
mitigating agency problems. Previous studies report insignificant or negative stock price
reactions to proposal announcements, and infer that the market interprets shareholder
activists’ use of the proxy process as a negative signal of failed private negotiations with
management. Using a very large sample of proposals submitted between 1996 and 2005, we
show for the first time that shareholder proposals are actually met with positive price
reactions, especially when takeover-related or sponsored by public pension funds. Moreover,
we use sample selection models to show that the market reactions, the voting outcomes, and
the very selection of target firms are all strongly related to a variety of governance
considerations, including (i) the targets’ use of anti-takeover provisions, (ii) board
effectiveness, and (iii) the performance sensitivity of CEO pay. Overall, we conclude that the
market does perceive shareholder proposals to be a relevance control device, which actually
explains why activists are prepared to bear the non-trivial costs of sponsoring them.
Keywords: Shareholder proposals, shareholder voting, corporate governance, proxy proposal.
JEL Classification: G34
We are grateful for valuable suggestions to Jonathan Batten, Arnoud Boot, Fabio Braggion, Hans Degryse, Piet Duffhues, Igor Loncarski, Colin Mayer, Joe McCahery, Maria Fabiana Penas, Enrico Perotti, Peter Vinderhout, and Paolo Volpin and the seminar participants at Tilburg University, the University of Oxford, the University of Cambridge, the University of Toronto, Universitat Pompeu Fabra, ESSEC Business School, the 2006 Workshop of the European Corporate Governance Institute in Venice, the 2007 European Financial Management Association Meeting in Vienna. Luc Renneboog is grateful to the Netherlands Organization for Scientific Research for funding under the ‘Shifts in Governance’ programme and to the European Commission via the ‘New Modes of Governance’-project (NEWGOV) led by the European University Institute in Florence; contract nr. CIT1-CT-2004-506392. Peter Szilagyi is grateful for funding from the European Commission through the European Corporate Governance Training Network. Renneboog: +31 (0) 13 4668210, [email protected]; Szilagyi: +44 (0) 1223 364026, [email protected].
1
The Success and Relevance of Shareholder Activism
through Proxy Proposals
Abstract – This paper reexamines the role and effectiveness of shareholder proposals in mitigating
agency problems. Previous studies report insignificant or negative stock price reactions to proposal
announcements, and infer that the market interprets shareholder activists’ use of the proxy process as a
negative signal of failed private negotiations with management. Using a very large sample of
proposals submitted between 1996 and 2005, we show for the first time that shareholder proposals are
actually met with positive price reactions, especially when takeover-related or sponsored by public
pension funds. Moreover, we use sample selection models to show that the market reactions, the
voting outcomes, and the very selection of target firms are all strongly related to a variety of
governance considerations, including (i) the targets’ use of anti-takeover provisions, (ii) board
effectiveness, and (iii) the performance sensitivity of CEO pay. Overall, we conclude that the market
does perceive shareholder proposals to be a relevance control device, which actually explains why
activists are prepared to bear the non-trivial costs of sponsoring them.
1. Introduction
Shareholder activism through the proxy process has been subject to much academic debate in
recent years. Despite a wealth of studies reported in surveys by Black (1998), Karpoff (2001)
and Gillan and Starks (2007), there remains little empirical evidence that shareholder
proposals would actually create firm value, or indeed be a relevant control and signaling
device. Nonetheless, shareholder activists have continued to pay the non-trivial costs of
proposal submissions, with the number of proposals continuing to rise in the 2000s (Cremers
and Romano, 2007; Thomas and Cotter, 2007).
The key question with respect to shareholder proposals is indeed whether they are an
effective means of mitigating agency concerns, or they are simply used by shareholder
activists to pursue their self-serving agenda without much success. Historically, boards have
tended to ignore most proposals because of their non-binding nature, and what has been
generally limited voting support. Nonetheless, recent studies show a continual increase in the
percentage votes cast in favor of proxy proposals, as well as manage to link the voting
patterns to important issues such as the target firm’s past performance, equity ownership by
institutional investors, and of course the issues addressed and the identity of the proposal
sponsors (Gordon and Pound, 1993; Bizjak and Marquette, 1998; Gillan and Starks, 2000).
Surprisingly, the same studies still fail to match the voting successes of proposal
submissions with positive stock price effects. In fact, some papers go as far as reporting that

2
shareholder proposals are met with a negative market response upon their disclosure in the
proxy statements (Bizjak and Marquette, 1998; Del Guercio and Hawkins, 1999). To some
extent, proposal announcements may indeed be interpreted as a negative signal, because
institutional activists only tend to turn to the proxy process once they have failed to negotiate
a satisfactory outcome with management behind the scenes (Prevost and Rao, 2000).
However, this does not explain why the same institutional activists are then prepared to bear
the non-trivial costs of proposal submissions, if the market expects these to be ineffective
anyhow in disciplining previously unresponsive managers.
This paper addresses these issues by using a sample of more than 2,800 shareholder
proposals submitted at US firms between 1996 and 2005. The results presented here make
important contributions to the literature. Firstly, we find that proposal submissions are
actually met with a positive rather than negative stock price response. The market reactions
tend to match the main voting outcomes in that the proposals which are takeover-related and
sponsored by public pension funds are by far the most successful. However, the positive
abnormal stock returns are equally robust for the full sample.
Secondly, both the voting outcomes and stock price reactions are driven very strongly by
the quality of the target firm’s corporate governance structures. The reception of proposal
submissions is tied especially closely to the incidence of anti-takeover provisions, which
obstruct the market for corporate control as an alternative means of addressing governance
concerns. However, there is also evidence for the relevance of other governance
considerations such as board effectiveness and the performance sensitivity of CEO pay.
Overall, we find that the abnormal stock returns are better predicted by the governance
proxies than by the individual proposal characteristics. In contrast, previous studies tend not
to control for governance quality at all or do so to a limited extent, which is surprising given
that most shareholder proposals are in fact directed at what are perceived to be poor
governance structures.
And thirdly, this is the first study in the literature to jointly estimate the success of proposal
submissions and the actual probability that a firm gets targeted by shareholder activists. This
is a critical issue, because the very success of shareholder proposals is likely to be
endogenous to the selection of the target firms, and the OLS estimates reported by previous
research may therefore be biased. We use Heckman’s (1979) sample selection model and a
sample of nearly 2,000 target and non-target firms to address this issue throughout our
analysis. The selection equations are very comprehensive in explaining the probability of
proposal submissions, and show that shareholder activists do tend to single out
3
underperforming firms with poor governance structures. This explains why the market
perceives shareholder proposals to be a relevant control and signaling device, to the extent
that they disclose important information over governance concerns and indicate close
monitoring by shareholder activists.
The remainder of this paper is outlined as follows. Section 2 reviews the academic
literature on shareholder activism. Section 3 provides a detailed discussion of the sample of
shareholder proposals. The voting outcomes and market reactions associated with the
proposal submissions are analyzed in Section 4 in a univariate framework, and in the
multivariate sample selection framework in Section 5. Finally, Section 6 allows for some
concluding remarks.
2. The literature on shareholder activism
2.1. The past and present of shareholder activism
Gillan and Starks (2007) place shareholder activism in a continuum of responses that
dissatisfied investors can give to concerns over corporate governance and activities. At one
extreme of the continuum, shareholders can simply vote with their feet by selling their shares.
Indeed, the act of selling shares has been shown to exert disciplinary pressure on management
and lead to changes in corporate governance (Parrino, Sias and Starks, 2003; Admati and
Pfleiderer, 2006). At the other extreme is the market for corporate control, where investors
initiate takeovers and buyouts in order to bring about fundamental corporate changes (Fama
and Jensen, 1983).
The role of shareholder activism arises when shareholders choose to hold their shares and
seek to induce changes within the firm without a change in control. Many pension funds and
other investors are either unwilling or unable to sell underperforming stocks, often because
they index a large proportion of their portfolios. Shareholder activists may then press for
corporate reforms through private negotiations with management, or – typically when
management is not sufficiently responsive – submit proxy proposals for shareholder vote.
Empirical studies show that shareholder activists indeed tend to target poorly performing
firms, often characterized by large institutional shareholdings and low inside ownership
(Karpoff, Malatesta and Walkling, 1996; Smith, 1996; Carleton, Nelson and Weisbach, 1998),
and what investors perceive as poor governance structures (John and Klein, 1995; Choi, 2001;
Akyol and Carroll, 2006; Prevost, Rao and Williams, 2006).

4
The inclusion of shareholder proposals on corporate ballots was first allowed in 1942 by
the predecessor of the SEC’s Rule 14a-8. Most proposals were sponsored by individuals until
the mid-1980s, which saw growing involvement by institutional investors and the emergence
of coordinated shareholder groups such as the United Shareholders Association (Strickland,
Wiles and Zenner, 1996; Wahal, 1996; Gillan and Starks, 2000; Prevost and Rao, 2000).
Public pension funds were particularly prolific in submitting proxy proposals until the early
1990s, when they began focusing more on behind-the-scenes negotiations with management
and targeting firms through the media (Carleton, Nelson and Weisbach, 1998; Hann, 2002;
English, Smythe and McNeil, 2004; Wu, 2004; Nelson, 2006)1. Since then, proposal
sponsoring has become dominated by labor union pension funds with the vocal backing of the
Department of Labor. Indeed, union pension funds have delivered several innovations over
the past decade in the use of proxy proposals, as well as the media, to target management
(Schwab and Thomas, 1998; Prevost, Rao and Williams, 2006). In recent years, hedge funds
have also been widely reported to develop activist strategies, taking large positions in
underperforming firms and directly targeting management as per the activist agendas
presented in their purpose statements (Bradley, Brav, Goldstein and Jiang, 2006; Brav, Jiang,
Partnoy and Thomas, 2006; Klein and Zur, 2006)2.
The prominence of institutional investors in the activist arena coincides with the dramatic
surge in institutional equity ownership since the 1980s. This corresponds to the efficient
monitor hypothesis that due to a free rider problem, only large institutional shareholders have
the means and incentive to undertake costly monitoring and other control activities (Grossman
and Hart, 1980; Shleifer and Vishny, 1986; Admati, Pfleiderer and Zechner, 1994; Maug,
1998; Noe, 2002). The literature warns however that activism by even the most prolific
institutions may be beset with conflict of interest motivations, which is referred to as the
incentive conflict hypothesis. Public pension funds have been generally praised for their
advocacy of shareholder interests, but Woidtke (2002) argues that political and social
influences may divert their focus from maximizing shareholder value. More explicit are
Prevost, Rao and Williams (2006) in their criticism of activist union funds. The authors argue
1 Public pension funds began having more direct dialogue with management after the SEC passed new rules
allowing shareholders to directly communicate with each other in 1992. This change reduced the cost of creating
shareholder coalitions and made the sponsoring of proxy proposals comparatively more expensive.
2 Becht et al. (2006) are the first to investigate non-US evidence on hedge fund activism, by examining the
activities of the Hermes Focus Fund in the UK.
5
that unions may use activism as a tool to achieve their self-serving agenda, pointing to their
role in the collective bargaining process and their other political interests.
A further important issue is the notable lack of activism by insurance companies and
banks’ trust departments. Brickley, Lease and Smith (1988) and Pound (1988) regard these
investors as being pressure-sensitive due to their existing or potential business ties with the
firms they invest in. Pension funds, investment firms, and independent investment advisors –
indeed the more prolific shareholder activists – are deemed to be more pressure-insensitive,
because they are unlikely to have such business relations and are thus more willing to
challenge management3. That conflicts of interest may make investors reluctant to confront or
even vote against management has long been voiced by union pension funds and other
activists. This eventually prompted the SEC to introduce the mutual fund proxy vote
disclosure rule in June 2003, which requires mutual funds to report how they voted on
shareholder proposals.
2.2. The success of shareholder activism: voting outcomes
The central question with respect to shareholder proposals is whether the target firms actually
implement the proposed changes. There is evidence that firms are more likely to remove anti-
takeover devices and limit executive compensation when targeted by public pension funds in
particular (Bizjak and Marquette, 1998; Thomas and Martin, 1999; Thomas and Cotter, 2007).
Nonetheless, boards have tended to ignore most proposals because of their non-binding
nature, and what has been generally limited voting support. The literature finds that the
proportion of yes votes for proxy proposals increased consistently during the 1990s, but
majority support in excess of 50% was relatively infrequent until the 2000s (Gillan and
Starks, 2000 and 2007; Thomas and Cotter, 2007).
The same studies report several factors which the voting patterns depend on, including the
issue addressed by the proposal, the identity of the sponsor, and the identity of the voting
shareholders. Takeover-related proposals, especially those targeting classified boards and
poison pills receive by far the most votes, suggesting that these are perceived to maximize
firm value the most. Voting support is highest for proposals sponsored by public pension
funds, which are relatively unlikely to be beset with incentive conflicts and are generally
3 Accordingly, greater ownership by pressure-insensitive investors has been associated with greater emphasis on
pay for performance (Almazan, Hartzell and Starks, 2005), better acquisition decisions (Chen, Harford and Li,
2007), and better overall financial performance (Cornett, Marcus, Saunders and Tehranian, 2007).
6
viewed as having shareholder value maximization as their primary objective. Nonetheless,
hedge funds and other investment firms, coordinated investor associations, and unions are
also fairly strong in building voting coalitions. Unsurprisingly, the number of yes votes
increases in the number of shares held by institutional owners, and decreases in the number of
shares held by executives, directors and Employee Stock Ownership Plans (ESOP).
The literature shows that shareholder support for proxy proposals also depends on
particular target firm’s characteristics. Favorable votes are notably higher when the target is
relatively small and poorly performing. Perhaps surprisingly, most studies do not control for
the target’s governance characteristics, even though shareholders should regard activism as
contributing the most value in firms with what they perceive as being poor governance
structures. Thus far, the voting outcomes have been shown to be unaffected by the target’s use
of anti-takeover devices (Gordon and Pound, 1993) and level of board independence (Bizjak
and Marquette, 1998).
2.3. The success of shareholder activism: market reactions
An alternate measure of the success of proposal submissions is how the stock market
responds to them. This kind of analysis has a number of limitations, however. Previous
studies conclude that the wealth effects of the proposals should be examined around the date
the proxies are mailed (Bhagat, 1983; Bhagat and Brickley, 1984). This is because the market
should have reasonable predictions on the voting outcomes, and the proposals are otherwise
uncertain to be implemented even if they pass due to their advisory nature. One problem
however is that the wealth effects of individual proposals are difficult to ascertain, because
proxy statements typically contain multiple management and shareholder proposals, as well as
disclose other important information. In addition, there is a question as to whether the
announcement is good news or bad. In terms of the real effect, the market should respond
favorably if it views the proposals as an effective means of resolving agency concerns and the
proposal sponsors as valuable monitoring agents. However, the wealth implications of
proposal announcements are also likely to be affected by a signaling effect. Indeed, Prevost
and Rao (2000) stress that institutional activists in particular first try to negotiate behind the
scenes, and only submit a proposal if management is not sufficiently responsive. In this sense,
institutionally sponsored proposals should induce a negative response, because they signal
management’s reluctance to negotiate even with significant shareholders who can build strong
voting coalitions.

7
Previous event studies are typically inclined to confirm the prevalence of this negative
signaling effect. Many papers find that proposal announcements induce insignificant market
reactions (Karpoff, Malatesta and Walkling, 1996; Smith, 1996; Wahal, 1996; Thomas and
Cotter, 2007), while others report outright negative abnormal returns for proposals targeting
poison pills (Bizjak and Marquette, 1998; Del Guercio and Hawkins, 1999; Prevost and Rao,
2000). Gillan and Starks (2000) specifically compare market reactions to proposals sponsored
by institutional activists versus individual investors who are less likely to negotiate with
management, and find that the abnormal returns in the former case are significantly lower and
mostly negative. The authors do detect evidence of a real effect, however. They find that like
the voting outcomes, the abnormal returns around proposal submissions are higher when the
target firms are poorly performing and have high levels of institutional ownership.
Borokhovich, Brunarski, Harman and Parrino (2006) further investigate this latter result for
takeover-related proposals, and confirm that the abnormal returns are positively related to
ownership by pressure-insensitive, but not by pressure-sensitive, institutional investors.
That the positive real effect may actually be stronger that the signaling effect is only
concluded by Prevost, Rao and Williams (2006), in their study examining proposals
sponsored by union pension funds. The authors find that the market reaction to takeover-
related proposals is significantly positive, as well as significantly more positive than the
reaction to proposals targeting other issues. This basically reflects the observed voting
patterns, in that takeover-related proposals both tend to receive by far the most votes and are
the most likely to pass. The authors cannot confirm that the abnormal returns are related to the
target firm’s prior performance and level of institutional ownership. However, they are the
first to include board-related governance variables in their analysis, and find that the market
response to proposal submissions is much more favorable when the target firms have what are
perceived to be inferior board structures.
3. Sample description
The shareholder proposals studied in this paper are all related to corporate governance and
were submitted in the period between 1996 and 2005. The proposals are mostly taken from
the Investor Responsibility Research Center’s (IRRC) database of proxy voting, which tracks
the proxy votes of over 1,900 firms, including the Standard & Poor’s 1500. Our analysis uses
all firms in the IRRC universe except those with dual class common stock; these are omitted
because their governance structures are difficult to compare with those of single class firms

8
due to extensive voting and ownership differences4. The final dataset consists of 2819
shareholder proposals submitted at 654 firms; 2666 of these were reported by the IRRC, and
the rest were obtained from the proxy firm Georgeson or hand-collected from proxy
statements. The remainder of this section provides an overview of these proposals by the
identity of the proposal sponsors and the particular issues addressed.
3.1. Proposal sponsors
Table 1 reviews the proxy proposals submitted in each year by sponsor identity. The sponsors
are classified by whether they are (i) union pension funds, (ii) public pension funds, (iii)
coordinated investor associations, (iv) investment firms, (v) religious organizations or socially
responsible investors, or (vi) individual investors. The sponsors of 27 proposals could not be
identified.
(Insert Table 1 about here)
The most notable development over the sample period is the remarkable increase in the
number of proposal submissions made by union pension funds. Union activists sponsored 926
proxy proposals between 1996 and 2005, compared with just 119 between 1987 and 1994 as
reported by Gillan and Starks (2000). The most prolific activists were the United Brotherhood
of Carpenters and Joiners of America (UBCJA), the International Brotherhood of Teamsters,
and the Longview Collective Investment Fund. Prevost, Rao and Williams (2006) point out
that Longview is different somewhat from the other union funds in that it is less likely to be
beset with conflict of interest motivations. This is because the fund has strong fiduciary
responsibilities to its depositors, despite being ultimately owned – through the Amalgamated
Bank of New York – by the UNITE HERE union (formed in 2004 by the merger between the
Union of Needletrades, Industrial and Textile Employees and the Hotel Employees and
Restaurant Employees International Union).
Public pension funds sponsored a comparatively modest 136 proposals, or 5% of all
submissions. That these institutions nonetheless remain highly prolific in the activist arena is
demonstrated by studies looking at their behind-the-scenes negotiations with target firms. As
has been mentioned, public pension funds did not begin focusing on private dialogue with
management until the early 1990s. Indeed, Gillan and Starks (2000) report that they made
4 We omit 269 proposals submitted at 65 dual class firms, representing about 9% of the initial sample.

9
substantially more, 344 proposal submissions between 1987 and 1994. The subsequent
withdrawal of the California Public Employees' Retirement System (CalPERS) and the
Teachers Insurance and Annuity Association - College Retirement Equities Fund (TIAA-
CREF) from proposal sponsorship is particularly well-known. The various funds of New
York City public employees remained reasonably active, however, with a total of 84
submissions made between 1996 and 2005.
Coordinated investor associations sponsored 197 proposals over the sample period, or 7%
of the total. The most prolific advocacy group was the Investor Rights Association of
America (IRAA), a spin-off of the now-defunct USA. The IRAA also disbanded in 1998, but
its founding members, Charles Miller and William Steiner, himself the former chair of the
USA’s New York Chapter, continued to make proposal submissions. Another active
shareholder group was the Association of BellTel Retirees and its members, acting mostly as
a de facto union for the former employees of Verizon Communications and its predecessors.
Between 1996 and 2005, proposal sponsorship by hedge funds and other investment firms
remained relatively modest, with 62 submissions. As has been mentioned, these institutions
are much better known for negotiating directly with management, although the advisory firm
GAMCO Investors became a significant proposal sponsor after 2000. Socially responsible
investors and religious organizations were considerably more prolific, submitting 121
proposals, many of which were co-sponsored by multiple institutions. The most significant
socially responsible activists were the Interfaith Center on Corporate Responsibility (ICCR)
and the United for a Fair Economy (UFE) movement through its Responsible Wealth project.
The remaining 1350 proposals, or 48% of the total, were submitted by individual activists.
The most prominent proposal sponsors, often referred to as “gadfly” investors, included
Evelyn Y. Davis and the Chevedden, Rossi and Gilbert families, with a total of 681 proposals.
The Gilbert brothers are especially well-known for their presence in the activist arena since
the 1930s, and continued to submit proposals until 2003. Prominent individuals previously
involved in well-publicized proxy contests sponsored 20 proposals over the sample period,
and included Steve Bostic, Patrick Jorstad, and Selim Zilka.
3.2. Proposal types
Table 2 groups the proposal submissions by year and the issue addressed. The issues are
categorized by whether the proposal concerned (i) anti-takeover devices, (ii) executive
10
compensation, (iii) the board of directors, (iv) voting rules, (v) the sale of the target firm (vi)
auditing services, (vii) the annual meeting, or (viii) other miscellaneous issues.
(Insert Table 2 about here)
The results show that, as has been the case historically, anti-takeover devices were by far
the most popular subjects of proxy proposals between 1996 and 2005. A total of 987
proposals were takeover-related, targeted primarily at the removal of classified boards (442),
poison pills (314), and golden parachutes (130). Shareholder activists targeted these devices
particularly intensely after 2000, coinciding with the stock market downturn of the early
2000s and the exacerbation of corporate governance concerns as a result of the Enron and
subsequent accounting scandals.
Shareholders sponsored an additional 611 compensation-related proposals, more than
double the 247 proposals reported for 1987-1994 by Gillian and Starks (2000). Over two
thirds of these were submitted after 2003, reflecting the growing discontent of activists with
the recent widely-discussed hikes in stock-based managerial pay. Activism related to board
and voting issues remained comparatively stable over time with a total of 499 and 357
proposals, respectively. The number of proposals calling for the sale of the target firm was
117 overall, much higher than the 17 reported by Gillan and Starks (2000) but declining
considerably in the early 2000s. Audit-related activism remained moderate with a total of 71
proposals, but picked up after the Enron scandal and the ensuing prosecution of Arthur
Andersen.
The recent surge in the number of takeover- and compensation-related proposals was
largely driven by unions becoming increasingly prolific activists in recent years. Though not
reported in the table, anti-takeover devices and board independence were uniformly targeted
by all institutional investors. However, unions were by far the most active in also engaging
firms over executive compensation, with emphasis on stock option expensing and the granting
of performance-based options and restricted shares. That unions also sought to achieve their
own self-serving agenda is shown by their use of the proxy process to demand employee
representation on corporate boards and the linking of managerial pay to employee welfare.
Public pension funds, investment firms, and coordinated investors were somewhat more
focused on engaging firms over anti-takeover devices. Public pension funds were also active
sponsors of board independence and confidential voting, while investment firms and
coordinated investors called the most often for the sale of the target firm. Socially responsible

11
investors and religious organizations tended to pursue softer governance objectives. While
they submitted several takeover-related proposals, they most commonly sought board
inclusiveness. The same activists often targeted executive pay as well, calling for
compensation reviews and restrictions, as well as compensation being tied to social criteria.
The issues addressed by individual activists were by far the most dispersed. The figures often
show a very strong association between the identity of the individual proponent and the
particular issues addressed. For example, Evelyn Y. Davis sponsored 39 of the 47 proposals
on director tenure, 42 of the 45 proposals on compensation disclosure, and 28 of the 38
proposals on the date and location of the annual meeting. Even more remarkably, Davis and
the Gilbert brothers sponsored 161 of the 222 submissions on cumulative voting, while 151 of
the 314 poison pill proposals were submitted either by the Chevedden or Rossi families.
4. The success of shareholder proposals: voting outcomes and market
reactions
4.1. Voting outcomes
A key measure of the success of shareholder proposals is the voting support they receive
when going to shareholder vote. That proposal submissions have become increasingly
successful over the years is well-documented, including most recently by Gillan and Starks
(2007). Indeed, we find that the share of votes cast in favor of the average proposal increased
by approximately 8.4% points between 1996 and 2005, regardless of the identity of the
sponsor or the issue addressed. More importantly, there was a quadrupling in the proportion
of proposals receiving majority support, from 7% in 1996 to 31% in 2005. To some extent,
these trends may be contributed to the on-going rise in the equity holdings of institutional
investors. However, a jump in the percentage vote was particularly apparent between 2001
and 2003, coinciding with the stock market downturn and corporate accounting scandals of
the early 2000s, as well as the introduction of the mutual fund proxy vote rule in June 2003.
Table 3 shows how the voting results were affected by the issue addressed and the identity
of the proponent shareholder, for the 2750 proposals for which we have voting data
available5. The results confirm that the proposals targeting anti-takeover provisions received
5 The remaining 69 proxy proposals also went to shareholder vote but the target firms did not report the detailed
voting outcomes. Proposals are sometimes withdrawn either because the sponsor has successfully negotiated a

12
by far the most votes in favor, with an average 53.4% of the votes cast. In fact, most of these
proposals passed the vote, such that nearly two thirds received majority support over the
sample period, and as many as 84% in 2005. The number of votes received was uniformly
high for each provision targeted, with the most successful proposals seeking to eliminate
poison pills, classified boards and supermajority provisions, and restore special meeting and
written consent rights. The sole exception was the ten, mostly union-sponsored proposals
calling for reincorporation, typically in Delaware, with 16.9% of the votes on average.
(Insert Table 3 about here)
The proposals pertaining to other issues enjoyed only moderate success, although those
tackling the well-publicized aspects of corporate governance often attracted considerable
support. On average, the compensation-related proposals received 21.5% of the votes cast.
The more successful ones sought greater shareholder say in approving compensation
packages, or concerned the pay-performance sensitivity and accounting treatment of stock-
based compensation. Standing out among these were the mostly union-sponsored proposals
calling for the expensing of stock options, which had an average 49.0% voting support and
actually passed in half of the cases. The board-related proposals received only 19.4% of the
votes cast on average. Of these, the highest percentage votes were attracted by the proposals
related to the independence of the board and the board chairman. In comparison, the
outcomes achieved by the voting-related proposals were significantly better, with an average
32.3% of the votes in favor. The proposals calling for confidential voting were particularly
successful, receiving 45.5% of the votes on average and passing in a third of the cases. The
audit-related proposals, as well as those related to the annual meeting or seeking the sale of
the target firm did not receive considerable shareholder support.
Panel B of Table 3 shows how the identity of the proposal sponsors affected the voting
results. Previous studies point out that the proponent shareholders best able to build voting
coalitions should be those which are the least likely to be beset with incentive conflicts, and
are therefore perceived to be the most focused on shareholder value. The table shows strong
support for this argument. The proposals submitted by public pension funds and investment
firms received by far the most votes in favor, at an average 43.0% and 41.0% of the votes
resolution with the target firm, or because the SEC has allowed the firm to exclude the proposal from its ballot
due to its improper subject matter or technical reasons (Carleton, Nelson, and Weisbach, 1998; Gillan and
Starks, 2000). The IRRC data do not include these withdrawn proposals, however.

13
cast, respectively. The percentage votes were consistently high across all the major pension
funds. Of the investment firms, GAMCO Investors was the most successful, with its strictly
takeover-related proposals attracting an average 55.7% of the votes.
The proposals sponsored by union pension funds received considerably lower voting
support, at an average 34.8%. This is consistent with the view that unions may use the proxy
process to achieve their self-serving agenda rather than to maximize firm value. Indeed, the
percentage votes gathered by union-sponsored proposals were lower on all proposal types,
including on the subset of takeover-related proposals. The proposals submitted by coordinated
investor groups, and religious and socially responsible investors received only 28.6% and
19.9% voting support, respectively. We find the poor support drawn by the IRAA and its
former members unexpected, given their historical focus on shareholder value and association
with the previously very successful USA. Finally, individual activists received an average
percentage vote of 32.1%, much higher than the 18.7% reported for 1987-1994 by Gillan and
Starks (2000). Indeed, several “gadfly” investors popular in the business media emerged as
being very powerful in building voting coalitions. The voting outcomes achieved by the
Chevedden and Rossi families were particularly remarkable, with their mostly takeover-
related proposals typically attracting majority support.
4.2. Market reactions
We now employ an alternate measure of the success of shareholder proposals, that being the
market reaction to their announcement in the proxy statements. Section 2.3 already discussed
the limitations of this type of analysis. Firstly, it is difficult to identify the wealth effects of
individual proposals, because proxy statements typically contain multiple proposals and
disclose other important information. In addition, information leakages are likely to occur,
especially given the propensity of institutional activists to announce which firms they are
going to target (Gillan and Starks, 2000).
Secondly, the market reaction to proposal announcements may be driven by both a positive
real effect and a negative signaling effect. In terms of the real effect, the market should
respond positively if it views the proposal as an effective tool of mitigating agency concerns,
and the proposal sponsor as a valuable monitoring agent. In this respect, we expect the market
reaction to be broadly in line with the voting outcomes. In terms of the signaling effect,
however, the very submission of the proposal may indicate that the proponent shareholder has
previously tried and failed to settle the issue of concern through private negotiations. Existing

14
studies tend to conclude that this signaling effect is as strong as the real effect, because they
find little or no relation between return behavior and the voting patterns, or indeed no
evidence that proposal announcements would be met with a positive market response. Of
course, this argument does not explain why activists are actually prepared to bear the
considerable costs of submitting proxy proposals, if the market expects these to be ineffective
anyhow in disciplining management.
To address this problem, we now examine the cumulative abnormal returns (CAR) induced
by proposal announcements in the three-day period [-1,+1] surrounding the proxy mailing
date6. As has been mentioned, previous studies find that all information from the proxy
statement should be incorporated in the share price around this time (Bhagat, 1983; Bhagat
and Brickley, 1984). The mailing dates are hand-collected from the SEC’s EDGAR database,
because they are not reported by the IRRC. The CARs are calculated using the market model
event study methodology. We estimate the market model parameters over the 200-day period
preceding 20 days before the proxy mailing date, using the CRSP equal-weighted index. Of
the 1756 initial proxy mailing dates, the parameters can be calculated for 1754 events.
In Table 4, we report the CARs for the full sample as well as the subsamples partitioned by
proposal issue and sponsor identity. The significance of the CARs is tested using Boehmer,
Musumeci and Poulsen’s (1991) standardized cross-sectional Z-test7 and Corrado’s (1989)
non-parametric rank test.
(Insert Table 4 about here)
Remarkably, the results show strong evidence of a positive real effect for the sample as a
whole, notwithstanding a potential negative signaling effect. The mean three-day CAR is
0.24% with a Z-statistic significant at the 1% level.
Table 4 shows that the positive market reaction to the shareholder proposals was most
fundamentally driven by the proposals targeting anti-takeover provisions. The three-day
CARs around takeover-related proposal announcements are 0.44% on average, and are
significant using both the parametric and non-parametric tests. The strength of these results
suggests that the market does perceive the proxy process as a relevant control mechanism.
6 We experiment with a number of event windows other than [-1,+1], including [-1,0], [0,+1], [-2,+2], [-1,+3], [-
1,+5], and [-1,+7], and find that the results are similar but considerably weaker.
7 Boehmer, Musumeci and Poulsen’s (1991) z-statistic compensates for a possible increase in the variance of
returns on the event date. The authors find that when an event causes even small increases in variance, the
standard z-statistic rejects the null hypothesis of zero excess returns too frequently when it is true.
15
Furthermore, these results are a notable departure from previous studies which systematically
find insignificant or outright negative abnormal returns. Our findings fully correspond to the
observed voting patterns, in so much as takeover-related proposals both tend to receive by far
the most votes and are the most likely to pass. More interesting in light of the voting
outcomes is that the market response is also significantly positive to board-related proposals,
with a mean CAR of 0.38%.
Of the proponent shareholders, public pension funds stand out as attracting by far the most
positive market reaction with their proposal submissions. The CARs around their proposal
announcements are highly significant both statistically and economically, at an average
1.08%. The union-sponsored proposals also induce small wealth gains of an average 0.16%,
although these are only significant using the parametric test. The CARs are positive but
statistically insignificant for the remaining sponsor types, including investment firms which
are otherwise very successful in building voting coalitions.
That the proposals submitted by public pension funds are so well received by the market
has two important implications. On one hand, it confirms that public pension funds are
viewed as very effective monitors of corporate governance. On the other, it suggests that these
institutions are indeed successful in using the proxy process to openly confront management,
once they have failed to reach a satisfactory outcome through private dialogue. This latter
inference explains why activist institutions are actually motivated to sponsor proxy proposals,
despite the non-trivial cost of doing so. It also poses a clear challenge to the signaling
hypothesis propagated by the literature, which implies that managers who have not responded
to behind-the-scenes pressure will also ignore proposal submissions.
5. Multivariate analysis of the probability and success of proposal
submissions
We now answer two very important questions with respect shareholder activists’ use of the
proxy process: (i) what drives the success of proposal submissions in terms of the voting
outcomes and market reactions and (ii) why firms actually get targeted by shareholder
proposals. Previous studies stop short of addressing these two questions simultaneously. This
is a critical issue, because the very success of proposal submissions is likely to be endogenous
to the selection of the target firms. Moreover, while independent studies show that the
probability and success of proposal submissions are related to the target firms’ prior
16
performance and ownership structures, there is very little evidence on the issue of whether the
quality of the firms’ governance structures also has any relevance at all. This is surprising,
since the vast majority of shareholder proposals are indeed targeted at what are perceived to
be poor corporate governance structures.
We use Heckman’s (1979) sample selection model, often referred to as a type-2 tobit
model, to jointly analyze the probability and success of proposal submissions. To compare the
financial, performance, ownership, and governance characteristics of target versus non-target
firms, we collect data on a total of 1961 firms which are covered by each of the Compustat,
CRSP, IRRC, Thomson Financial CDA/Spectrum, and ExecuComp databases.
5.1. Descriptive statistics on target versus non-target firms
Table 5 compares a large set of descriptive statistics on the target versus non-target firms. The
difference in means t-tests assume unequal variances between the two groups when the tests
of equal variances are rejected at the 10% level. The significance of the differences in the
medians is based on Wilcoxon rank-sum tests. The variable descriptions are provided in
Appendix 1.
(Insert Table 5 about here)
Panel A first shows how the two groups compared in terms of their financial
characteristics. The figures show that shareholder activists tended to target very large firms,
with average assets and sales of $46.5 billion and $15.8 billion, respectively. The non-target
firms were only fairly small in comparison, with the respective asset and sales figures at $7.3
billion and $3.3 billion. The mean debt-to-equity ratios of the two groups, at 1.45 and 1.35,
were not statistically different, but the non-parametric rank-sum test indicates that the typical
target firm was more levered. The market-to-book ratios were not significantly different by
either statistic, and had means of 3.02 and 4.32, respectively.
The market performance data show that most target firms indeed performed rather poorly
during the year up to two months before being targeted. The average raw return on the target
stocks was 14.5%, underperforming the CRSP equal-weighted index by 17.8%. In
comparison, the non-target stocks fared much better with a raw return of 20.6% and a relative

17
underperformance of 11.2%8. Surprisingly, share turnover was nonetheless lower in the target
than in the non-target stocks, at 1.37 and 1.73, respectively.
Panel A shows no evidence that the target firms had higher institutional ownership than the
non-target firms. On the contrary, the mean equity share of institutional investors was 62.8%
and 63.9% in the two groups, respectively. It is notable that pressure-insensitive institutions,
including pension funds, investment firms and independent investment advisors, were
particularly underrepresented in the target firms. Correspondingly, the equity interests of
insurance companies and banks’ trust departments, which Brickley, Lease and Smith (1988)
and Pound (1988) regard as being pressure-sensitive investors, were actually larger.
Panel B of Table 5 uses a very diverse set of variables to describe the quality of
governance structures, in terms of the use of takeover defenses, board effectiveness, and CEO
wealth and compensation. The incidence of takeover defenses is particularly relevant in the
context of shareholder activism, since they block investors from using the market for
corporate control as an alternative means of addressing governance concerns. The most
commonly used measure of takeover protection is the Gompers, Ishii and Metrick (2003)
Governance Index, which captures the incidence of 24 anti-takeover provisions. Based on this
index, the target firms were relatively well-protected from takeover threat, with an average
9.9 provisions in place. In comparison, the non-target firms employed only 9.4 provisions,
with the difference significant at the 1% level. The alternative Entrenchment Index created by
Bebchuk, Cohen and Ferrell (2005) uses only the six most important anti-takeover provisions
to capture governance quality: classified boards, poison pills, golden parachutes, limits to
bylaw and charter amendments, and supermajority provisions for mergers9. Of these, the
targets and non-targets surprisingly employed exactly the same 2.3 provisions.
Similar to Prevost, Rao and Williams (2006), we report four variables which may be
related to board effectiveness in monitoring management: (i) board size, (ii) the proportion of
employee directors, (iii) the average age of non-employee directors, and (iv) the independence
of the board’s chairman. The good governance practices of activist institutions prescribe that
the board’s monitoring effectiveness is positively related to each of these variables (Council
of Institutional Investors, 2006). It must be noted however that the empirical literature has
8 The CRSP equal-weighted index is customarily used to price stock returns in the literature. However, it is
extremely diversified, encompassing all NYSE-, AMEX- and NASDAQ-traded stocks. This explains why the
large firms examined in this paper, both targets and non-targets, consistently underperform the index.
9 The authors find that these six provisions are by far the most correlated with firm value and stock returns.

18
largely failed to confirm this contention (Baysinger and Butler, 1985; Mehran, 1995; Klein,
1998; Romano, 2001).
Panel B shows that the target firms had 11.3 board members on average, considerably
higher than the 9.6 members non-targets had and the optimal board size of six to eight
members suggested by Jensen (1993) and Yermack (1996). However, employee directors
constituted only an average 16.3% of the board, compared with a much higher 20.4% in the
non-targets. The average age of non-employee directors was also higher in the target than in
the non-target firms, at 59.9 and 59.1 years, respectively. The targets nonetheless fared
considerably worse in terms of board chairman independence, with only 12% separating the
CEO and chairman posts, compared with 21% in the non-target firms.
Finally, Panel B reports five variables on three critical aspects of CEO wealth and
compensation: the CEO’s equity ownership, pay-performance sensitivity, and the actual level
of compensation. Linking CEO wealth to firm performance through ownership and stock-
based compensation is viewed as a remedy to agency concerns, to the extent that it provides
CEOs with efficient incentives to maximize firm value (Jensen and Murphy, 1990). However,
Bebchuk and Fried (2003) argue that if stock-based compensation becomes very high, as has
been since the late 1990s, it may actually reflect agency problems of managerial rent-seeking.
The figures show that CEO wealth was considerably less sensitive to firm value changes in
targets than in non-targets. On one hand, the equity share of the target CEOs was 1.2% on
average, less than half of the 2.5% held by the non-target CEOs. On the other, the total stock
option holdings of the target CEOs gained only $6.56 dollars for every $1,000 increase in
firm value, compared with $10.73 in the non-target firms. Nonetheless, CEO compensation
itself tended to be reasonably high-powered in the target firms, with grants of stock options
and restricted shares comprising an average 45% of total pay, compared with 42% in the non-
targets. However, the average compensation package was also worth considerably more, at
$8.7 million and $4.1 million respectively. To determine whether these last figures were
excessive compared to those granted by other firms in the ExecuComp database, we use
Cremers and Romano’s (2007) proxy for abnormal compensation. The authors define this
proxy as the residual from an annual regression of the log of total compensation on firm size
and industry dummies. Surprisingly, the results show that the average target firm actually
underpaid its CEO compared to its size and industry peers.
5.2 Methodology

19
The sample selection model we use to jointly analyze the probability and success of proposal
submissions is specified as follows:
(1a) * '
1 1 1 1it it ity X β ε= + ,
(1b) * '
2 2 2 2it it ity X β ε= + ,
(2) 1
1
0ity
=
*
1
*
1
0
0
it
it
if y
if y
>
≤ ,
(3)
*
2
20
it
it
yy
=
*
1
*
1
0
0
it
it
if y
if y
>
≤ ,
where { }1 2,it itε ε are drawn from a normal distribution with mean 0, variances 2
1σ and 2
2σ , and
correlation 12ρ (Amemiya, 1984). The variable *
1ity is a dummy variable capturing whether firm
i is targeted in year t , while the variable *
2ity is the outcome of interest i.e. the voting outcome
observed at the proposal level, or the CAR observed at the firm-level around the disclosure of
one or more proposals in the proxy statement. It is assumed that only the sign of *
1ity is
observed, and that *
2ity is observed only when *
1 0ity > . The X variables correspond to the
explanatory variables. 1itX and 2itX are not disjoint but do differ. 1itX is observed for all i , and
includes firm-level variables as well as year and industry dummies. 2itX additionally includes
proposal-related variables which are not observed when *
1 0ity ≤ . Finally, 1β and 2β are
vectors of the model coefficients.
In a standard setting, the error terms are assumed to be i.i.d. drawings. In our model, i
corresponds to a firm and t to a year. We relax the assumption of independence of the error
terms across t and allow the clustering of observations corresponding to a given firm, i.e. we
assume the error terms to be i.i.d. across firms but not necessarily for different observations
within the same firm. All reported standard error estimates are adjusted for clustering. This
procedure enhances the robustness of our findings and allows us to take the panel data
structure of our sample explicitly into account.
Throughout the paper we call Equation (1a) the selection equation and Equation (1b) the
outcome equation. As has been mentioned, estimating the parameters of the outcome equation
on the basis of the target sample only would not be a valid alternative to the method proposed
above, because the OLS estimator of 2β is biased when the selection of the outcome sample is
endogenous i.e. 12 0ρ ≠ . Our sample selection model addresses the endogeneity of selection,

20
and therefore renders reliable parameter estimates for the outcome equation (Greene, 2000;
Renneboog and Trojanowski, 2007).
5.3. Joint analysis of the voting outcomes and the probability of proposal submissions
5.3.1. Model specification and hypotheses
We first use the sample selection model to jointly determine the drivers of the probability and
voting outcomes of the proposal submissions. This part of the analysis is at the proposal rather
than the firm level, therefore the target firms with multiple proposals are overweighted in the
selection equations. Alternative firm-level model specifications yield unbiased results for the
selection equations but lead to considerable information loss10.
The outcome equations include 14 explanatory variables capturing the various
characteristics of the proposal submissions. Times submitted captures the number of times a
proposal had been submitted in consecutive years. We include this variable because Gillan
and Starks (2000) find that consecutive resubmissions tend to garner a great deal of additional
voting support11. Number of proposals in proxy shows the total number of proposals included
in a proxy statement. While it is less immediate how this would affect the voting outcomes, it
is likely that the more proposals shareholder activists submit, the stronger the negative signal
sent to the voting shareholders over governance concerns, thereby increasing their propensity
to vote in favor. Finally, we use seven and five dummies, respectively, to capture how a
proposal’s voting outcome was affected by the issue addressed and the sponsor’s identity.
Each variable equals 1 if the variable description holds and 0 otherwise. All proposals are
10 Alternative specifications which allow for the analysis to be run at the firm level exclude firms targeted by
multiple proposals in a given year, or are based on average voting results.
11 Indeed, we find that the proportion of votes cast in favor was 30.4% for first-time submissions but increased to
48.6% for proposals submitted for the fifth time. Gillan and Starks (2000) point out that some of additional
voting support gathered by consecutive resubmissions is likely to be due to selection bias. That is, one observes
only those proposals being resubmitted which the sponsors expect to achieve better outcomes. In addition, the
increase in voting support may be influenced by the SEC’s submission rules. If a proposal receives less than a
specified level of support, the target firm may refuse to put proposals of the same subject matter on its ballot for
three years. In order to avoid possible exclusion, a proposal must receive at least 3% voting support on its first
submission, 6% on the second, and 10% on the third. In September 1997, the SEC proposed a further increase in
the hurdles to a respective 6%, 15%, and 30%, amid claims that firms were becoming inundated with
shareholder proposals (Romano, 2001). Since then, no changes have been implemented, however.
21
uniquely allocated to an issue and sponsor type, such that the intercept represents proposals
addressing miscellaneous issues and sponsored by individual investors.
In both the outcome and selection equations, we use the variables discussed in Section 5.1
and described in Appendix 1 to control for the firm-level characteristics of both targets and
non-targets. The financial controls included are (i) the log of assets, (ii) the debt-to-equity
ratio, and (iii) the market-to-book ratio. We expect firm size to be positively related to the
probability of proposal submissions, but negatively to the actual voting outcomes because
building voting coalitions should be more difficult in large firms with dispersed ownership. In
both the selection and outcome equations the signs on debt-to-equity and market-to-book
should be negative, to the extent that they are reliable proxies for agency concerns (Fama and
French, 2001). Prior poor stock performance and high share turnover convey negative
information on recent market reassessments of the firms’ outlook. Accordingly, we expect
that both the probability and voting outcomes of proposal submissions are related negatively
to the sample firms’ abnormal stock performance relative to the CRSP equal-weighted index.
In a similar vein, we expect the signs on the share turnover variable to be positive in each
model. The models separately control for ownership by (i) pressure-sensitive and (ii)
pressure-insensitive institutional investors. The signs should be positive on each variable in
both equations, but with the caveat that pressure-sensitive investors are less likely to support
proposal submissions due to conflicts of interest.
We finally include ten explanatory variables to capture the quality of governance structures
in both target and non-target firms. The level of takeover protection is measured by the
Bebchuk, Cohen and Ferrell (2005) Entrenchment Index. We expect the signs on the index to
be always positive, because firms with more anti-takeover provisions in place should get both
targeted and voted against more. Board effectiveness is controlled for by (i) board size, (ii) the
square of board size, (iii) the proportion of employee directors, (iv) the average age of non-
employee directors, and (v) a dummy equal to 1 if the CEO and board chairman are separate
and 0 otherwise. The square of board size is included to detect any concavities in the relation
between board effectiveness and the number of directors. We expect the signs on board size to
be negative and on squared board size to be positive, to the extent that board effectiveness is
maximized at six to eight members (Jensen, 1993; Yermack, 1996). The signs should always
be positive on the proportion of employee directors chairman independence, and negative on
director age, insofar as greater board independence and experience are associated with
stronger governance. Finally, the agency aspects of CEO wealth and compensation are
captured by (i) ownership, (ii) the firm value sensitivity of total option holdings, (iii) the

22
proportion of stock-based to total compensation, and (iv) the level of abnormal compensation
as proposed by Cremers and Romano (2007). We expect the signs to be negative on variables
(i) to (iii) due to the incentive effects of wealth-performance sensitivity, and to be positive on
variable (iv) to the extent that excessive compensation reflects managerial rent-seeking.
5.3.2. Empirical results
Table 6 shows five sample selection models with the voting results plugged into the outcome
equations. The models provide different combinations of the three sets of explanatory
variables in both the outcome and selection equations, in order to ensure robustness and detect
potential identification problems. The final Model 5 encompasses the full set of explanatory
variables. The results confirm that the probability of firms being targeted by shareholder
activists and the actual voting outcomes on shareholder proposals are not independent. The
model statistics show that the correlation ρ between the error terms of the selection and
outcome equations is significantly different from zero in all but one specification. This
underlines the importance of using the sample selection framework to examine the voting
results of proposal submissions, and suggests that the OLS estimates reported by previous
studies may be biased.
(Insert Table 6 about here)
We begin our analysis with the selection equations shown in Panel A. As has been
mentioned, the predictive power of these equations is affected by the fact that the voting
outcomes are analyzed at the proposal rather than the firm level. Nonetheless, the analysis still
shows that shareholder activists pick their targets based on a very diverse set of criteria.
The regressions confirm that large firms are by far the most likely to be confronted with
shareholder proposals. The strength of this result is unsurprising, given the large size
difference between the target and non-target firms in Table 5. We additionally confirm that
shareholder activists are less likely to target firms with high debt-to-equity ratios, which Fama
and French (2001) find to have an inverse relationship with the level of agency problems.
Surprisingly, however, we find that firms with high market-to-book ratios are more rather
than less likely to be targeted. This is likely due to the fact that the market-to-book ratio also
proxies for the level of informational asymmetries. To the extent that this is indeed the case,
this result confirms the role of shareholder proposals as a signaling device, whereby activists
sponsor proposals to warn over corporate governance concerns. We find that shareholder

23
proposals are indeed more likely to be directed at firms which have performed relatively
poorly. However, there is only marginal evidence that the probability of proposal submissions
would increase in institutional ownership.
The selection equations detect little statistical relationship between the probability of firms
being targeted and the quality of their governance structures. The results confirm that
proposals are less likely to be submitted against firms with high CEO ownership. However,
the firm value sensitivity of the CEO’s total options holdings is related positively rather than
negatively to the probability of a proposal submission. This suggests that only direct CEO
ownership is desirable from an agency perspective, and that large option holdings may speak
of excessive compensation in the past rather than incentive realignment. The remaining
governance-related variables are statistically insignificant in each model.
The outcome equations of the five models are shown in Panel B of the table. The results
confirm that the actual voting support achieved by shareholder proposals is most strongly
driven by the characteristics of the proposals themselves. In Model 5, the coefficient on the
intercept, which represents the votes cast for miscellaneous proposals sponsored by
individuals, is 28.4%. In comparison, takeover- and voting-related submissions attract a
hugely significant 39.0% and 20.0% additional voting support, respectively. Board- and
compensation-related proposals achieve a respective 8.0% and 6.6% more votes, while those
concerning audit services, the annual meeting, or the sale of the target firm receive even less.
Of the proposal sponsors, investment firms and public pension funds collect 10.2% and 6.3%
more votes than do individual activists, respectively, while union pension funds get only
about 2.6% more. Coordinated investor groups, and religious or socially responsible investors
fail to outperform individual sponsors. Proposal resubmissions in consecutive years improve
the voting outcome by approximately 0.9% each time. There is some evidence that other
proposals included in the proxy statements also draw in some additional votes, of
approximately 0.4%.12
The financial, performance, and ownership variables add comparatively modest but still
very significant explanatory power to the models. The results confirm that the percentage
votes decline considerably in the size of the target firm. However, there is no robust evidence
that the debt-to-equity or market-to-book ratio would have an effect. Of the target’s stock
market track record, prior performance surprisingly has no statistical impact, but prior share
turnover now shows a strong positive relationship with the voting outcome. The results finally
12 For an overview of the economic effects, see Appendix 2.

24
confirm that the voting results are strongly affected by the target firm’s ownership
distribution. Model 5 shows that a 10% rise in the equity holdings of pressure-insensitive
institutions increases the number of votes in favor by around 1.1%. However, the impact of
ownership by pressure-sensitive institutions is insignificantly negative rather than positive,
which suggests that these investors may indeed be beset by conflict of interest issues.
A critical result in Panel B that the target firm’s governance characteristics are just as
important in determining the actual voting outcome as its other attributes. The impact of the
Entrenchment Index is highly significant and fully robust, with Model 5 showing that the
voting support for shareholder proposals increases by around 0.9% for every additional anti-
takeover provision in place. We also experiment with Gompers, Ishii and Metrick’s (2003)
broader Governance Index, and find that the results are very similar and only slightly less
significant. Of the board characteristics, board size shows the expected non-linear relation
with the voting outcome. However, the independence and experience of board members have
no statistical impact. We also find no robust evidence that the various aspects of CEO wealth
and compensation would affect the percentage votes.
5.4. Joint analysis of the market reactions and the probability of proposal submissions
5.4.1. Model specification and hypotheses
We now use the sample selection framework to jointly determine what drives the probability
of proposal submissions and the actual market reactions to their disclosure in the proxy
statements. The CARs used in the outcome equations are calculated at the firm level,
therefore the selection equations are now unbiased. Previous studies often stop short of fully
analyzing the market reactions as measured by CARs, while others find only a weak
association between returns and either proposal- or firm-specific attributes. There is
nonetheless some evidence that the market response is related to the target firm’s prior
performance and ownership distribution (Gillan and Starks, 2000; Borokhovich, Brunarski,
Harman and Parrino, 2006). Prevost, Rao and Williams (2006) also control for certain aspects
of the target’s governance quality, and find that proposals are better received when directed at
firms with ineffective boards.
The outcome equations again include 14 variables related to the proposal submissions.
However, the proposal-level Times submitted variable is now replaced by the firm-level
Targeted in previous year dummy. We expect the sign on this variable to be negative, to the
extent that the first-time confrontation of management has the greatest signaling effect. The
25
variables corresponding to the issues addressed and to the sponsor identities are dummies
equal to 1 if a firm’s proxy statement included at least one proposal with the corresponding
issue or sponsor type, respectively. We expect the firm-specific regressors to affect return
behavior in the way hypothesized in Section 5.3.1 for the voting results. There are two
important exceptions from this rule, given that the market should actually respond to the
agency implications of the firm characteristics rather than their impact on the voting results.
Firstly, we expect the CARs to decrease in institutional ownership, because agency concerns
should be lower in the presence of institutional investors with superior monitoring skills and
incentives. Secondly, we expect the CARs to increase in firm size, to the extent that size is an
appropriate proxy for agency problems as discussed by Fama and French (2001).
5.4.2. Empirical results
Table 7 contains the sample selection models with the CARs plugged into the outcome
equations. As before, the models show different combinations of the explanatory variables in
the outcome and selection equations, with the final Model 5 including all variables.
Surprisingly, we now find only limited evidence that the equation pairs are not independent,
with the correlation coefficient ρ significantly different from zero in just two of the five
models.
(Insert Table 7 about here)
The selection equations in Panel A are now well-defined, and show strongly robust
evidence on why firms get targeted by shareholder proposals. The results confirm that firm
size is the single most important determinant of proposal submissions, and that firms with
high debt-to-equity ratios are less likely to be targeted. There is also some evidence that firms
with high market-to-book ratios are more probable targets. The regressions fully confirm that
poorly performing firms are more likely to be singled out by shareholder activists. Moreover,
we now find that institutional ownership also has a very strong impact. On one hand, Model 5
shows that the probability of a proposal submission increases by 1% for every 1% increase in
the equity share of pressure-insensitive institutions. On the other, the same probability
actually decreases by 1.8% for every 1% increase in the equity share of pressure-sensitive
institutions, shedding further light on their potential incentive conflicts.
The most important finding in the selection equations is that shareholder proposals are
indeed much more likely to be directed at firms with what are perceived to be poor

26
governance structures. The Entrenchment Index by Bebchuk et al. (2005) is significant at the
1% level across all specifications, and suggests that the probability of a proposal submission
increases by 24.8% percent for every additional anti-takeover provision in place.13 This result
is also robust to the broader Governance Index of Gompers et al. (2003). We also detect the
predicted non-linear relation between submission probability and board size, as well as find
that firms whose non-employee directors are older and more experienced are less likely to be
targeted. As before, the independence of either the board or the board chairman has no
impact. Finally, the regressions fully confirm that the probability of a proposal submission is
closely linked to the perceived wealth- and compensation-related incentives of the CEO. On
one hand, a firm is less likely to be targeted if its CEO has a considerable equity stake or
receives mostly stock-based compensation. On the other, we again find that the firm value
sensitivity of the CEO’s total options holdings increases rather than decreases the probability
of a proposal submission.
The outcome equations are provided in Panel B. The results surprisingly show that the
market reaction to shareholder proposals is driven to a fairly limited extent by the proposal
characteristics. As expected, takeover-related submissions achieve the strongest market
response, with the associated CARs higher by 0.57% compared to the intercept representing
miscellaneous proposals. Of the proposal sponsors, public pension funds stand out in terms of
the reception of their proposal submissions, with their respective CARs 1.09% higher than
those accrued to individual activists. Surprisingly, the CARs appear to decrease rather than
increase in the number of proposals presented in the proxy statement. This suggests that the
intense confrontation of firms with multiple submissions may actually dilute the positive
wealth effect attributed to shareholder proposals.
The panel shows that the market responds considerably better to proposals submitted
against large firms. This suggests that the marginal control benefits associated with
shareholder activism are higher in firms which, through their sheer size, are more likely to be
beset with agency problems and protected from the takeover market. The prior stock price
performance and share turnover of target firms are also strongly related to the eventual market
reaction to proposal announcements. The analysis detects no statistical relationship between
the CARs and either the debt-to-equity and market-to-book ratios or the size of institutional
ownership.
13 For an overview of the economic effects, see Appendix 2.

27
Of the governance-related variables, two have an impact on the market reaction to proposal
submissions. Firstly, the Entrenchment Index is consistently significant at the 1% level, with
Model 5 suggesting that for every additional anti-takeover provision in place, the CARs
increase by as much as 0.24%. Secondly, the CARs are lower in firms with relatively high-
powered CEO pay packages in terms of stock-based compensation, corresponding to the
positive incentive effects of pay-performance sensitivity.
Overall, it is important to emphasize that the market responds as much to the act of
shareholder activists confronting management through the proxy process, as to the actual
objectives and characteristics of the proposals they sponsor. Indeed, Table 7 shows that the
joint significance of the outcome and selection equations actually suffers the most when the
governance-related variables, and the Entrenchment Index in particular, are excluded. From a
corporate governance perspective, this has key economic implications: it shows that the
market perceives proposal submissions to be a relevant control and signaling device, to the
extent that they disclose important information on governance concerns and indicate close
monitoring by the proponent shareholders.
6. Conclusions
This paper has studied how shareholder activism through proxy proposals evolved in the
period between 1996 and 2005, and examined the success of proposal submissions in terms of
the voting outcomes and stock price reactions. The use and effectiveness of shareholder
proposals has been subject to much debate in recent years, with very little empirical evidence
that they would create firm value, or indeed be a relevant control and signaling device. Some
legal scholars have even suggested that the costs of shareholder activism are likely to exceed
its benefits, and that the SEC should accordingly consider raising the hurdles for submitting
shareholder proposals.
The results presented here make the following important contributions to the literature.
Firstly, we have found that proposal submissions are actually met with a positive rather than
negative stock price response. The market reactions also tend to match the main voting
outcomes in that the proposals which are takeover-related and sponsored by public pension
funds are by far the most successful. This latter result poses a clear challenge to the signaling
hypothesis advocated by previous studies, which implies that the real price effect of proposal
submissions made by institutional activists is counterbalanced by a negative signaling effect.

28
Secondly, the results have shown that both the voting outcomes and stock price reactions
are driven very strongly by the quality of the target firm’s corporate governance structures,
and especially by its use of anti-takeover provisions. Previous studies tend not to control for
governance quality at all or do so to a limited extent, which is surprising given that most
shareholder proposals are in fact directed at what are perceived to be poor governance
structures. Our analysis suggests that the market reaction to proposal announcements is
actually better predicted by the governance proxies than by the individual proposal
characteristics. The market responds as much to the act of shareholder activists confronting
management through the proxy process, as to the actual objectives and characteristics of the
proposals they sponsor.
And thirdly, this has been the first study to use a Heckman sample selection model to
jointly estimate the success of proposal submissions and the actual probability that a firm is
targeted by shareholder activists. This is a critical issue, because the very success of
shareholder proposals is likely to be endogenous to the selection of the target firms, and the
OLS estimates reported by previous research may therefore be biased. The selection equations
have shown that shareholder activists do tend to single out underperforming firms with poor
governance structures. This explains why the market perceives shareholder proposals to be a
relevant control and signaling device, to the extent that they disclose important information
about governance concerns and indicate close monitoring by shareholder activists. Overall,
our results suggest that despite the concerns in the public domain, shareholder activism
through the proxy process should be regarded as a useful means of resolving agency concerns
and the proposal sponsors as valuable monitoring agents. Whether and how this translates into
better operating and stock price performance by the target firm is left for future research.
References
Admati, Anat R., and Paul C. Pfleiderer, 2005, The 'Wall Street Walk' as a form of shareholder activism,
Stanford Law and Economics Olin Working Paper 315.
Admati, Anat R., Paul C. Pfleiderer, and Josef Zechner, 1994, Large shareholder activism, risk sharing, and
financial market equilibrium, Journal of Political Economy 102, 1097-1130.
Akyol, Ali C., and Carolyn Carroll, 2006, Removing poison pills: A case of shareholder activism, University of
Alabama Working Paper.
Almazan, Andres, Jay C. Hartzell, and Laura T. Starks, 2005, Active institutional shareholders and costs of
monitoring: Evidence from executive compensation, Financial Management 34, 5-34.
Amemiya, Takeshi, 1984, Tobit models: A survey, Journal of Econometrics 24, 3-61.
Baysinger, Barry D., and Henry N. Butler, 1985, Corporate governance and the board of directors: Performance
effects of changes in board composition, Journal of Law, Economics and Organization 1, 101-124.

29
Bebchuk, Lucian Arye, Alma Cohen, and Allen Ferrell, 2005, What matters in corporate governance? Harvard
Olin Working Paper 491.
Bebchuk, Lucian Arye, and Jesse M. Fried, 2003, Executive compensation as an agency problem, Journal of
Economic Perspectives 17, 71-92.
Becht, Marco, Julian Franks, Colin Mayer, and Stefano Rossi, 2006, Returns to shareholder activism: Evidence
from a clinical study of the Hermes U.K. Focus Fund, ECGI Finance Working Paper 138/2006.
Bhagat, Sanjai, 1983, The effect of pre-emptive right amendments on shareholder wealth, Journal of Financial
Economics 12, 289-310.
Bhagat, Sanjai, and James A. Brickley, 1984, Cumulative voting: The value of minority shareholder voting
rights, Journal of Law and Economics 27, 339-365.
Bizjak, John M., and Christopher J. Marquette, 1998, Are shareholder proposals all bark and no bite? Evidence
from shareholder resolutions to rescind poison pills, Journal of Financial and Quantitative Analysis 33, 499-
521.
Boehmer, Ekkehart, Jim Masumeci, and Annette B. Poulsen, 1991, Event-study methodology under conditions
of event-induced variance, Journal of Financial Economics 30, 253-272.
Borokhovich, Kenneth A, Kelly Brunarski, Yvette S Harman, and Robert Parrino, 2006, Variation in the
monitoring incentives of outside stockholders, Journal of Law and Economics 49, 651-680.
Bradley, Michael H., Alon Brav, Itay Goldstein, and Wei Jiang, 2005, Costly communication, shareholder
activism, and limits to arbitrage: Evidence from closed-end funds, Duke University Working Paper.
Brav, Alon, Wei Jiang, Frank Partnoy, and Randall S. Thomas, 2006, Hedge fund activism, corporate
governance, and firm performance, ECGI Finance Working Paper 139/2006.
Brickley, James A., 1986, Interpreting common stock returns around proxy statement disclosures and annual
shareholder meetings, Journal of Financial and Quantitative Analysis 21, 343-349.
Brickley, James A., Ronald C. Lease, and Clifford Jr. Smith, 1988, Ownership structure and voting on
antitakeover amendments, Journal of Financial Economics 20, 267-291.
Carleton, William T., James M. Nelson, and Michael S. Weisbach, 1998, The influence of institutions on
corporate governance through private negotiations: Evidence from TIAA-CREF, Journal of Finance 53,
1335-1362.
Chen, Xia, Jarrad Harford, and Kai Li, 2007, Monitoring: Which institutions matter? Journal of Financial
Economics forthcoming.
Choi, Stephen J., 2000, Proxy issue proposals: Impact of the 1992 SEC proxy reforms, Journal of Law,
Economics and Organization 16, 233-268.
Cornett, Marcia Millon, Alan J. Marcus, Anthony Saunders, and Hassan Tehranian, 2007, The impact of
institutional ownership on corporate operating performance, Journal of Banking and Finance 31, 1771-1794.
Corrado, Charles J., 1989, A nonparametric test for abnormal security-price performance in event studies,
Journal of Financial Economics 23, 385-395.
Council of Institutional Investors, 2006, Corporate governance practices. Available at:
http://www.cii.org/policies/corpgovernance.htm.
Cremers, Martijn, and Roberta Romano, 2007, Institutional investors and proxy voting: The impact of the 2003
mutual fund voting disclosure regulation, ECGI Law Working Paper 83/2007.
Davis, Gerald F., and E. Han Kim, 2007, Business ties and proxy voting by mutual funds, Journal of Financial
Economics, forthcoming.
Del Guercio, Diane, and Jennifer Hawkins, 1999, The motivation and impact of pension fund activism, Journal
of Financial Economics 52, 293-340.
Dlugosz, Jennifer, Rudiger Fahlenbrach, Paul A. Gompers, and Andrew Metrick, 2006, Large blocks of stock:
Prevalence, size, and measurement, Journal of Corporate Finance 12, 594-618.
30
English, Philip C. II., Thomas I. Smythe, and Chris R. McNeil, 2004, The "CalPERS effect" revisited, Journal of
Corporate Finance 10, 157-174.
Fama, Eugene F., and Michael C. Jensen, 1983, Separation of ownership and control, Journal of Law and
Economics 26, 301-325.
Fama, Eugene F., and Kenneth R. French, 2001, Disappearing dividends: Changing firm characteristics or lower
propensity to pay? Journal of Financial Economics 60, 3-43.
Gillan, Stuart L., and Laura T. Starks, 2000, Corporate governance proposals and shareholder activism: The role
of institutional investors, Journal of Financial Economics 57, 275-305.
Gillan, Stuart L., and Laura T. Starks, 2007, The evolution of shareholder activism in the United States, Journal
of Applied Corporate Finance 19, 55-73.
Gompers, Paul A., Joy L. Ishii, and Andrew Metrick, 2003, Corporate governance and equity prices, Quarterly
Journal of Economics 118, 107-155.
Gordon, Lilli A., and John Pound, 1993, Information, ownership structure, and shareholder voting: Evidence
from shareholder-sponsored corporate governance proposals, Journal of Finance 48, 697-718.
Grossman, Sanford J., and Oliver D. Hart, 1980, Takeover bids, the free-rider problem, and the theory of the
corporation, Bell Journal of Economics 11, 42-64.
Hann, Rebecca N., 2002, On the effectiveness of pension fund activism, University of Southern California
Working Paper.
Heckman, James J., 1979, Sample selection bias as a specification error, Econometrica 47, 153-161.
Jensen, Michael C., 1986, Agency costs of free cash flow, corporate finance, and takeovers, American Economic
Review 76, 323-329.
Jensen, Michael C., 1993, The modern industrial revolution, exit, and the failure of internal control systems,
Journal of Finance 48, 831-880.
Jensen, Michael C., and Kevin J. Murphy, 1990, Performance pay and top-management incentives, Journal of
Political Economy 98, 225-264.
John, Kose, and April Klein, 1995, Shareholder proposals and corporate governance, New York University
Working Paper FIN-98-046.
Karpoff, Jonathan M., Paul H. Malatesta, and Ralph A. Walkling, 1996, Corporate governance and shareholder
initiatives: Empirical evidence, Journal of Financial Economics 42, 365-395.
Klein, April, 1998, Firm performance and board committee structure, Journal of Law and Economics 41, 275-
303.
Klein, April, and Emanuel Zur, 2006, Hedge fund activism, ECGI Finance Working Paper 140/2006.
Maug, Ernst, 1998, Large shareholders as monitors: Is there a trade-off between liquidity and control? Journal of
Finance 53, 65-98.
Mehran, Hamid, 1995, Executive compensation structure, ownership, and firm performance, Journal of
Financial Economics 38, 163-184.
Nelson, James M., 2006, The "CalPERS effect" revisited again, Journal of Corporate Finance 12, 187-213.
Noe, Thomas H., 2002, Investor activism and financial market structure, Review of Financial Studies 15, 289-
318.
Parrino, Robert, Richard W. Sias, and Laura T. Starks, 2003, Voting with their feet: Institutional ownership
changes around forced CEO turnover, Journal of Financial Economics 68, 3-46.
Pound, John, 1988, Proxy contests and the efficiency of shareholder oversight, Journal of Financial Economics
20, 237-265.
Prevost, Andrew K., and Ramesh P. Rao, 2000, Of what value are shareholder proposals sponsored by public
pension funds? Journal of Business 73, 177-204.
Prevost, Andrew K., Ramesh P. Rao, and Melissa A. Williams, 2006, Labor unions as shareholder activists:
Champions or detractors?, Ohio University Working Paper.

31
Renneboog, Luc and Grzegorz Trojanowski, 2007, The managerial labor market and the governance role of
shareholder control structures, Tilburg University Working Paper.
Romano, Roberta, 2001, Less is more: Making shareholder activism a valuable mechanism of corporate
governance, Yale Journal of Regulation 18, 174-252.
Rothberg, Burton G., and Steven B. Lilien, 2005, Mutual fund proxy votes, City University of New York
Working Paper.
Schwab, Stewart J., and Randall S. Thomas, 1998, Realigning corporate governance: Shareholder activism by
labor unions, Michigan Law Review 96, 1018-1094.
Shleifer, Andrei, and Robert W. Vishny, 1986, Large shareholders and corporate control, Journal of Political
Economy 94, 461-488.
Smith, Michael P., 1996, Shareholder activism by institutional investors: Evidence from CalPERS, Journal of
Finance 51, 227-252.
Strickland, Deon, Kenneth W. Wiles, and Marc Zenner, 1996, A requiem for the USA: Is small shareholder
monitoring effective? Journal of Financial Economics 40, 319-338.
Thomas, Randall S., and James F. Cotter, 2007, Shareholder proposals in the new millennium: Shareholder
support, board response, and market reaction, Journal of Corporate Finance 13, 368-391.
Thomas, Randall S., and Kenneth J. Martin, 1999, The effect of shareholder proposals on executive
compensation, University of Cincinnati Law Review 67, 1021-1081.
Wahal, Sunil, 1996, Pension fund activism and firm performance, Journal of Financial and Quantitative
Analysis 31, 1-23.
White, Halbert, 1980, A heteroskedasticity-consistent covariance matrix estimator and a direct test for
heteroskedasticity, Econometrica 48, 817-838.
Woidtke, Tracie, 2002, Agents watching agents? Evidence from pension fund ownership and firm value, Journal
of Financial Economics 63, 99-131.
Wu, YiLin, 2004, The impact of public opinion on board structure changes, director career progression, and
CEO turnover: Evidence from CalPERS' corporate governance program, Journal of Corporate Finance 10,
199-227.
Yermack, David, 1996, Higher market valuation of companies with a small board of directors, Journal of
Financial Economics 40, 185-211.

32
Table 1. Number of proposal submissions by sponsor identity and year.
Year Total 1996 1997 1998 1999 2000 2001 2002 2003 2004 2005
Investment firms 62 2 5 3 7 16 6 4 5 7 7
GAMCO Investors 17 - - 1 - 2 2 3 4 3 2 Jewelcor Management 9 - - - 2 5 2 - - - - Greenway Partners 6 1 3 1 - - 1 - - - -
Public pension funds 136 13 8 18 15 12 10 21 12 11 16
New York City 84 10 6 10 8 7 7 11 7 7 11 CalPERS 19 - 1 4 2 3 2 2 - 2 3 TIAA-CREF 16 1 1 2 3 2 1 3 2 1 - Connecticut 10 - - - - - - 4 3 1 2
Union pension funds 926 49 36 44 55 42 60 81 215 178 166
UBCJA 159 8 2 3 - 1 2 13 36 44 50 Teamsters 120 12 12 9 7 6 27 14 18 6 9 Longview 91 7 5 5 6 11 10 11 16 10 10 Sheet Metal Workers 74 - - - - 1 - 2 23 21 27 Plumbers and Pipefitters 70 - - - 6 - 1 7 25 24 7 AFL-CIO 67 - - 1 4 3 3 3 18 15 20 IBEW 67 1 3 3 7 4 6 8 20 8 7 Laborers 65 4 - 2 4 - 3 10 20 14 8 AFSCME 51 - - - - 5 5 5 13 13 10
Coordinated investors 197 48 35 24 16 16 18 7 2 9 22
IRAA 174 47 34 22 14 14 14 2 - 7 20 BellTel Retirees 20 - - 2 2 2 4 5 2 2 1
Religious/socially responsible investors 121 5 11 8 16 15 7 7 17 10 25
ICCR 61 5 11 7 8 8 2 1 3 6 10 Catholic Funds 13 - - - - - - - 2 - 11 UFE/Responsible Wealth 13 - - - 8 - 1 2 2 - -
Individuals 1350 88 130 121 132 116 124 140 194 177 128
Evelyn Y. Davis 301 21 35 38 32 29 33 29 32 28 24 Chevedden family 150 2 4 7 11 13 16 17 30 27 23 Rossi family 134 3 3 3 4 4 6 27 44 28 12 Gilbert family 96 22 23 24 11 6 5 5 - - - Gerald R. Armstrong 44 1 4 5 5 4 4 3 7 5 6 Morse family 34 6 3 - 5 4 1 3 - 12 - Prominent individuals 20 - - - - 1 3 2 8 2 4
Unidentified 27 16 - 1 1 1 2 1 3 2 -
Total proposals 2819 221 225 219 242 218 227 261 448 394 364

33
Table 2. Number of proposal submissions by issue addressed and year.
Year N 1996 1997 1998 1999 2000 2001 2002 2003 2004 2005
Takeover issues 987 86 59 66 97 89 91 119 161 120 99
Repeal classified board 442 56 35 44 57 48 43 40 47 34 38 Redeem or vote on poison pill 314 14 18 12 25 25 20 48 82 49 21 Remove golden parachutes 130 12 4 4 9 6 12 18 17 26 22 Eliminate/reduce supermajority provision 66 1 - 2 3 7 12 10 9 7 15 Restore right to special meeting/written consent 10 - - 3 1 1 1 - 3 - 1 Reincorporate in a different state 10 1 1 - 1 - - 2 2 3 - Remove all antitakeover provisions 6 - - - 1 2 3 - - - - Prohibit targeted share placement 4 1 1 1 - - - - - - 1 Opt out of state takeover statute 3 - - - - - - 1 1 1 - Adopt antigreenmail provision 1 - - - - - - - - - 1 Repeal fair price provision 1 1 - - - - - - - - -
Voting issues 357 33 38 46 36 27 25 25 17 33 77
Adopt cumulative voting 222 21 31 37 26 20 17 17 17 20 16 Adopt majority vote to elect directors 69 - 1 - - - - - - 11 57 Adopt confidential voting 45 10 3 6 5 5 7 5 - 1 3 Allow vote against directors 5 - - 1 1 - - 3 - - - No discretionary voting 9 2 3 - 4 - - - - - - Counting shareholder votes 7 - - 2 - 2 1 - - 1 1
Board Issues 499 59 58 43 43 38 45 47 62 59 45
Independent board chairman 102 1 3 6 3 2 4 2 27 31 23 Increase board independence 74 4 9 7 11 8 6 11 6 9 3 Increase key committee independence 52 5 5 7 4 4 6 13 3 2 3 Independent lead director 6 - 1 1 2 1 - - - 1 - Director tenure/retirement age 47 3 7 5 4 3 5 5 6 6 3 Limit number of directorships 8 2 - - 1 2 - - - 1 2 Director liability 5 2 1 - - - - - - - 2 Double board nominees 46 - - - 2 5 16 8 10 4 1 Equal access to the proxy 7 - 1 1 - 1 1 - - 1 2 Eliminate advance notice requirement 2 - - - - - - 1 1 - - Create key committee 11 2 1 4 2 - - 1 - 1 - Board inclusiveness 44 4 5 4 6 5 5 4 6 2 3 Board size 2 - - - - - 1 - 1 - - Board attendance 2 1 1 - - - - - - - - Union/employee representation on board 8 1 2 1 3 - - 1 - - - Director ownership 10 2 4 - 1 3 - - - - - Pay directors in stock 33 13 11 3 - 2 1 1 - - 2 Restrict director compensation 11 2 2 1 2 - - - 2 1 1 Restrict director pensions 29 17 5 3 2 2 - - - - -
Executive Compensation 611 24 33 26 39 22 30 26 170 137 104
Implement compensation plan 27 - - - - - - - - 25 2 Approval of deferred compensation plan 15 - - - - - - - 5 7 3 Approve compensation 7 1 1 1 - - - 1 2 - 1 Restrict compensation 80 6 6 7 13 4 1 2 7 6 28 Abolish/suspend stock options/stock grants 64 6 4 - 7 5 3 4 10 18 7 Performance-based stock options/stock grants 96 1 - - 4 1 8 4 56 3 19 Performance/time-based restricted shares 44 - - - - - - - - 25 19 Link pay to performance 29 3 4 4 2 1 6 1 2 4 2 Link pay to dividends 11 2 5 2 2 - - - - - - Link pay to social criteria 17 - 1 - 2 3 4 4 1 1 1 Disclose compensation 45 5 8 9 6 4 2 2 3 3 3 Review/report on executive compensation 25 - 4 1 1 2 3 - 10 1 3 Expense stock options 115 - - - - - - 2 68 34 11 Require option shares to be held 16 - - - - 1 - - 2 9 4 No repricing of underwater stock options 7 - - 2 2 1 1 1 - - - Pension fund surplus 13 - - - - - 2 5 4 1 1
Study sale of company 117 6 17 19 17 26 18 1 2 5 6 Audit-related 71 1 1 1 1 1 1 25 17 16 7 Annual meeting 38 4 6 10 3 2 6 3 2 2 - Other 139 8 13 8 6 13 11 15 17 22 26
Total proposals 2819 221 225 219 242 218 227 261 448 394 364

34
Table 3. Percentage of votes FOR shareholder proposals by issue addressed and sponsor identity.
N Mean Median St. dev. Min Max
All proposals 2750 32.9 30.4 22.3 0.0 97.6
Panel A: Issue addressed
Anti-takeover issues 973 53.4 54.2 16.3 2.2 97.2
Voting issues 344 32.3 30.9 14.7 0.4 97.6
Board issues 488 19.3 17.1 13.4 0.0 95.7
Study sale of company 113 14.2 9.6 12.3 1.7 83.0
Executive compensation issues 594 21.5 13.6 17.8 1.6 96.0
Annual meeting 35 5.4 4.5 4.0 1.9 19.7
Audit-related issues 70 21.7 15.4 14.1 3.8 70.8
Panel B: Sponsor identity
Investment firms 56 41.0 40.1 22.2 5.5 97.1
Public pension funds 133 43.0 42.7 20.1 3.8 95.7
Unions and union pension funds 914 34.8 33.9 20.8 0.0 87.7
Coordinated investors 194 28.6 26.2 20.6 2.1 88.0
Religious/socially responsible investors 121 19.9 11.7 18.7 2.0 79.8
Individuals 1308 32.1 28.4 23.3 0.0 97.6
Table 4. Cumulative abnormal returns surrounding proxy mailing dates.
N Mean Median Std. dev. Min Max Z stat Rank stat
All proposals 1754 0.25 0.02 4.14 -19.33 33.17 2.40*** 0.18
Panel A: Issue addressed
Anti-takeover issues 862 0.44 0.13 4.27 -17.02 33.17 2.97*** 1.59*
Voting issues 353 -0.03 0.03 3.47 -17.08 13.10 0.02 -0.33
Board issues 480 0.38 0.06 3.87 -13.58 21.20 1.83** 0.87 Study sale of company 123 0.55 -0.13 4.80 -11.46 21.20 1.17 0.24 Executive compensation issues 495 0.01 -0.17 3.88 -19.33 29.02 0.52 -0.66 Annual meeting 38 0.02 -0.27 3.10 -5.17 6.69 1.03 0.20
Audit-related issues 69 0.03 -2.40 3.44 -9.25 10.78 -0.48 -0.56
Panel B: Sponsor identity
Investment firms 54 0.53 0.05 4.26 -14.08 13.72 1.01 0.64 Public pension funds 131 1.08 0.53 5.93 -16.14 33.17 2.56*** 2.01**
Unions and union pension funds 703 0.16 0.07 3.57 -19.33 18.45 1.59* 0.17 Coordinated investors 141 0.34 0.03 3.68 -9.65 21.20 0.95 0.65
Religious/socially responsible investors 113 0.14 -0.05 4.16 -10.15 21.39 0.19 -0.27 Individuals 945 0.06 -0.13 4.14 -32.73 29.02 0.17 -1.20
Note to Table 4. This table shows percent cumulative abnormal returns in the days -1 to +1 surrounding the date that the proxy statements are mailed. Market model parameters are estimated over the 200-day period ending 30 days before the proxy mailing date, using the CRSP equal-weighted index. The significance of the means and medians is tested using Boehmer, Musumeci and Poulsen’s (1991) standardized cross-sectional Z-test and Corrado’s (1989) non-parametric rank test, respectively. *, ** and *** denote significance at the 10, 5 and 1% level, respectively.
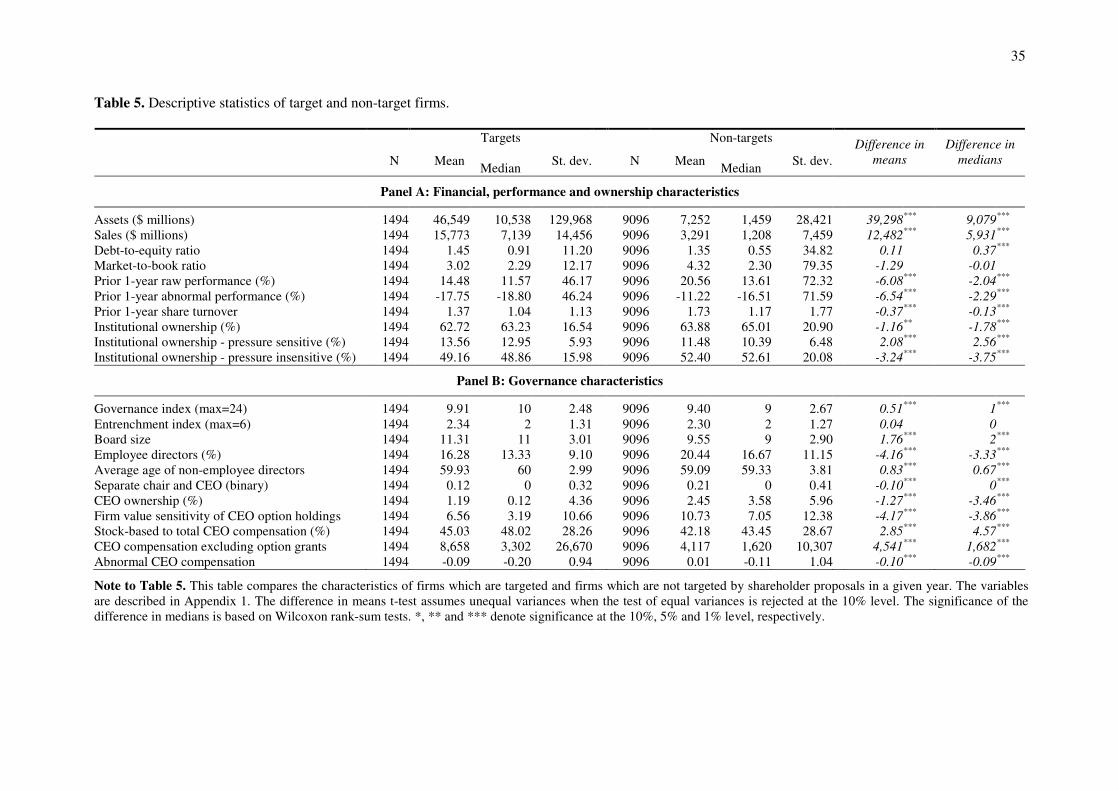
35
Table 5. Descriptive statistics of target and non-target firms.
Targets Non-targets
N Mean
Median St. dev. N Mean
Median
St. dev.
Difference in
means
Difference in
medians
Panel A: Financial, performance and ownership characteristics
Assets ($ millions) 1494 46,549 10,538 129,968 9096 7,252 1,459 28,421 39,298***
9,079***
Sales ($ millions) 1494 15,773 7,139 14,456 9096 3,291 1,208 7,459 12,482***
5,931***
Debt-to-equity ratio 1494 1.45 0.91 11.20 9096 1.35 0.55 34.82 0.11
0.37***
Market-to-book ratio 1494 3.02 2.29 12.17 9096 4.32 2.30 79.35 -1.29
-0.01
Prior 1-year raw performance (%) 1494 14.48 11.57 46.17 9096 20.56 13.61 72.32 -6.08***
-2.04***
Prior 1-year abnormal performance (%) 1494 -17.75 -18.80 46.24 9096 -11.22 -16.51 71.59 -6.54***
-2.29***
Prior 1-year share turnover 1494 1.37 1.04 1.13 9096 1.73 1.17 1.77 -0.37***
-0.13***
Institutional ownership (%) 1494 62.72 63.23 16.54 9096 63.88 65.01 20.90 -1.16**
-1.78***
Institutional ownership - pressure sensitive (%) 1494 13.56 12.95 5.93 9096 11.48 10.39 6.48 2.08***
2.56***
Institutional ownership - pressure insensitive (%) 1494 49.16 48.86 15.98 9096 52.40 52.61 20.08 -3.24***
-3.75***
Panel B: Governance characteristics
Governance index (max=24) 1494 9.91 10 2.48 9096 9.40 9 2.67 0.51***
1***
Entrenchment index (max=6) 1494 2.34 2 1.31 9096 2.30 2 1.27 0.04
0
Board size 1494 11.31 11 3.01 9096 9.55 9 2.90 1.76***
2***
Employee directors (%) 1494 16.28 13.33 9.10 9096 20.44 16.67 11.15 -4.16***
-3.33***
Average age of non-employee directors 1494 59.93 60 2.99 9096 59.09 59.33 3.81 0.83***
0.67***
Separate chair and CEO (binary) 1494 0.12 0 0.32 9096 0.21 0 0.41 -0.10***
0***
CEO ownership (%) 1494 1.19 0.12 4.36 9096 2.45 3.58 5.96 -1.27***
-3.46***
Firm value sensitivity of CEO option holdings 1494 6.56 3.19 10.66 9096 10.73 7.05 12.38 -4.17***
-3.86***
Stock-based to total CEO compensation (%) 1494 45.03 48.02 28.26 9096 42.18 43.45 28.67 2.85***
4.57***
CEO compensation excluding option grants 1494 8,658 3,302 26,670 9096 4,117 1,620 10,307 4,541***
1,682***
Abnormal CEO compensation 1494 -0.09 -0.20 0.94 9096 0.01 -0.11 1.04 -0.10***
-0.09***
Note to Table 5. This table compares the characteristics of firms which are targeted and firms which are not targeted by shareholder proposals in a given year. The variables are described in Appendix 1. The difference in means t-test assumes unequal variances when the test of equal variances is rejected at the 10% level. The significance of the difference in medians is based on Wilcoxon rank-sum tests. *, ** and *** denote significance at the 10%, 5% and 1% level, respectively.
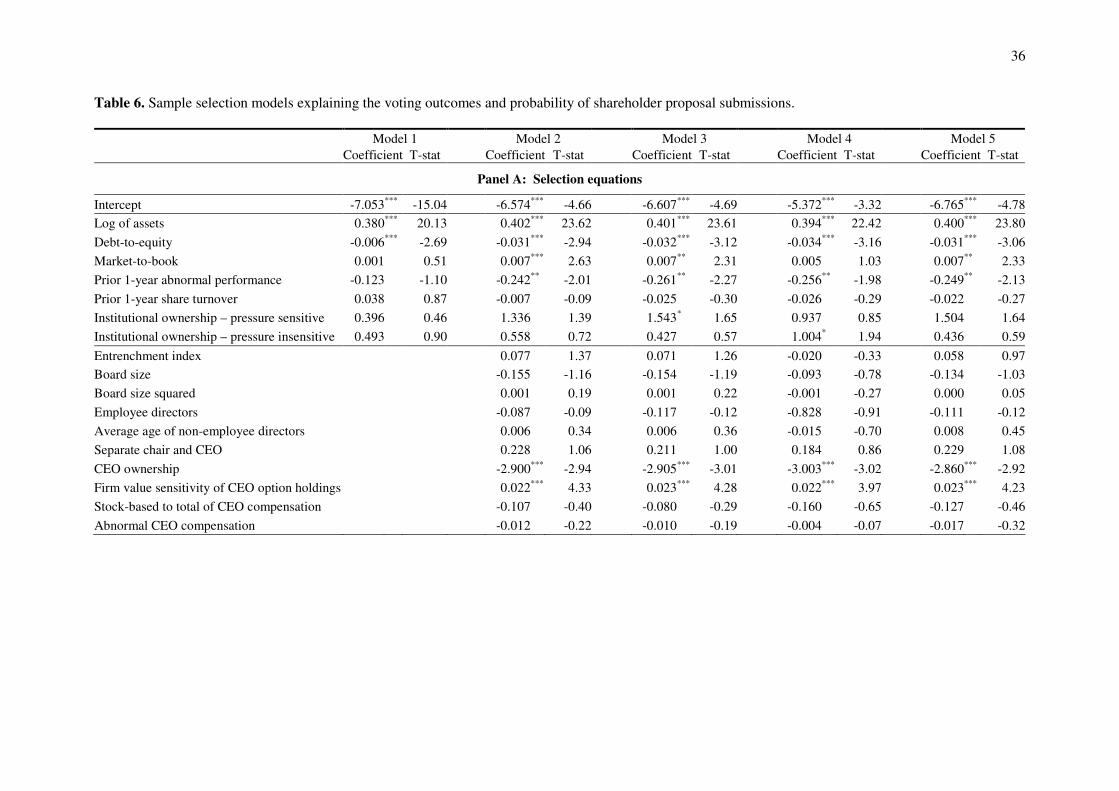
36
Table 6. Sample selection models explaining the voting outcomes and probability of shareholder proposal submissions.
Model 1 Model 2 Model 3 Model 4 Model 5
Coefficient T-stat Coefficient T-stat Coefficient T-stat Coefficient T-stat Coefficient T-stat
Panel A: Selection equations
Intercept -7.053*** -15.04 -6.574*** -4.66 -6.607 *** -4.69 -5.372*** -3.32 -6.765*** -4.78
Log of assets 0.380*** 20.13 0.402*** 23.62 0.401 *** 23.61 0.394*** 22.42 0.400*** 23.80
Debt-to-equity -0.006*** -2.69 -0.031*** -2.94 -0.032 *** -3.12 -0.034*** -3.16 -0.031*** -3.06
Market-to-book 0.001 0.51 0.007*** 2.63 0.007 ** 2.31 0.005 1.03 0.007** 2.33
Prior 1-year abnormal performance -0.123 -1.10 -0.242** -2.01 -0.261 ** -2.27 -0.256** -1.98 -0.249** -2.13
Prior 1-year share turnover 0.038 0.87 -0.007 -0.09 -0.025 -0.30 -0.026 -0.29 -0.022 -0.27
Institutional ownership – pressure sensitive 0.396 0.46 1.336 1.39 1.543 * 1.65 0.937 0.85 1.504 1.64
Institutional ownership – pressure insensitive 0.493 0.90 0.558 0.72 0.427 0.57 1.004* 1.94 0.436 0.59
Entrenchment index 0.077 1.37 0.071 1.26 -0.020 -0.33 0.058 0.97
Board size -0.155 -1.16 -0.154 -1.19 -0.093 -0.78 -0.134 -1.03
Board size squared 0.001 0.19 0.001 0.22 -0.001 -0.27 0.000 0.05
Employee directors -0.087 -0.09 -0.117 -0.12 -0.828 -0.91 -0.111 -0.12
Average age of non-employee directors 0.006 0.34 0.006 0.36 -0.015 -0.70 0.008 0.45
Separate chair and CEO 0.228 1.06 0.211 1.00 0.184 0.86 0.229 1.08
CEO ownership -2.900*** -2.94 -2.905 *** -3.01 -3.003*** -3.02 -2.860*** -2.92
Firm value sensitivity of CEO option holdings 0.022*** 4.33 0.023 *** 4.28 0.022*** 3.97 0.023*** 4.23
Stock-based to total of CEO compensation -0.107 -0.40 -0.080 -0.29 -0.160 -0.65 -0.127 -0.46
Abnormal CEO compensation -0.012 -0.22 -0.010 -0.19 -0.004 -0.07 -0.017 -0.32
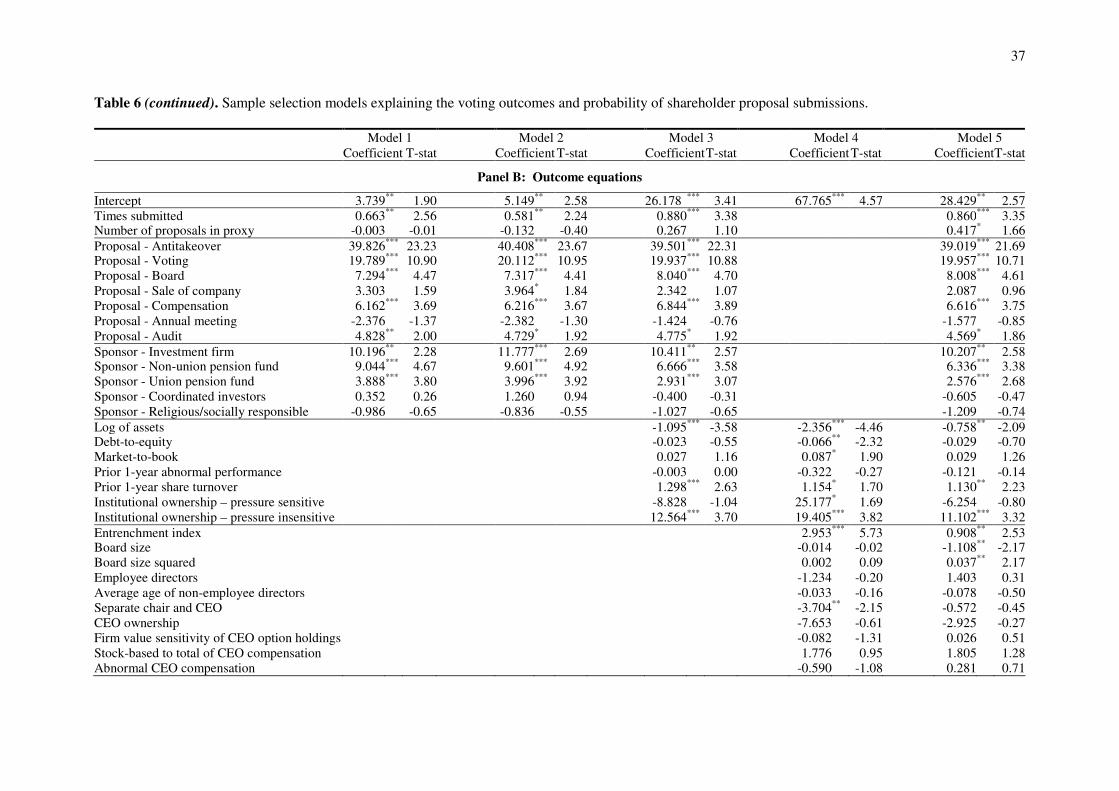
37
Table 6 (continued). Sample selection models explaining the voting outcomes and probability of shareholder proposal submissions.
Model 1 Model 2 Model 3 Model 4 Model 5 Coefficient T-stat Coefficient T-stat Coefficient T-stat Coefficient T-stat Coefficient T-stat
Panel B: Outcome equations
Intercept 3.739** 1.90 5.149** 2.58 26.178 *** 3.41 67.765*** 4.57 28.429** 2.57Times submitted 0.663** 2.56 0.581** 2.24 0.880*** 3.38 0.860*** 3.35Number of proposals in proxy -0.003 -0.01 -0.132 -0.40 0.267 1.10 0.417* 1.66Proposal - Antitakeover 39.826*** 23.23 40.408*** 23.67 39.501*** 22.31 39.019*** 21.69Proposal - Voting 19.789*** 10.90 20.112*** 10.95 19.937*** 10.88 19.957*** 10.71Proposal - Board 7.294*** 4.47 7.317*** 4.41 8.040*** 4.70 8.008*** 4.61Proposal - Sale of company 3.303 1.59 3.964* 1.84 2.342 1.07 2.087 0.96Proposal - Compensation 6.162*** 3.69 6.216*** 3.67 6.844*** 3.89 6.616*** 3.75Proposal - Annual meeting -2.376 -1.37 -2.382 -1.30 -1.424 -0.76 -1.577 -0.85Proposal - Audit 4.828** 2.00 4.729* 1.92 4.775* 1.92 4.569* 1.86Sponsor - Investment firm 10.196** 2.28 11.777*** 2.69 10.411** 2.57 10.207** 2.58Sponsor - Non-union pension fund 9.044*** 4.67 9.601*** 4.92 6.666*** 3.58 6.336*** 3.38Sponsor - Union pension fund 3.888*** 3.80 3.996*** 3.92 2.931*** 3.07 2.576*** 2.68Sponsor - Coordinated investors 0.352 0.26 1.260 0.94 -0.400 -0.31 -0.605 -0.47Sponsor - Religious/socially responsible -0.986 -0.65 -0.836 -0.55 -1.027 -0.65 -1.209 -0.74Log of assets -1.095*** -3.58 -2.356*** -4.46 -0.758** -2.09Debt-to-equity -0.023 -0.55 -0.066** -2.32 -0.029 -0.70Market-to-book 0.027 1.16 0.087* 1.90 0.029 1.26Prior 1-year abnormal performance -0.003 0.00 -0.322 -0.27 -0.121 -0.14Prior 1-year share turnover 1.298*** 2.63 1.154* 1.70 1.130** 2.23Institutional ownership – pressure sensitive -8.828 -1.04 25.177* 1.69 -6.254 -0.80Institutional ownership – pressure insensitive 12.564*** 3.70 19.405*** 3.82 11.102*** 3.32Entrenchment index 2.953*** 5.73 0.908** 2.53Board size -0.014 -0.02 -1.108** -2.17Board size squared 0.002 0.09 0.037** 2.17Employee directors -1.234 -0.20 1.403 0.31Average age of non-employee directors -0.033 -0.16 -0.078 -0.50Separate chair and CEO -3.704** -2.15 -0.572 -0.45CEO ownership -7.653 -0.61 -2.925 -0.27Firm value sensitivity of CEO option holdings -0.082 -1.31 0.026 0.51Stock-based to total of CEO compensation 1.776 0.95 1.805 1.28Abnormal CEO compensation -0.590 -1.08 0.281 0.71
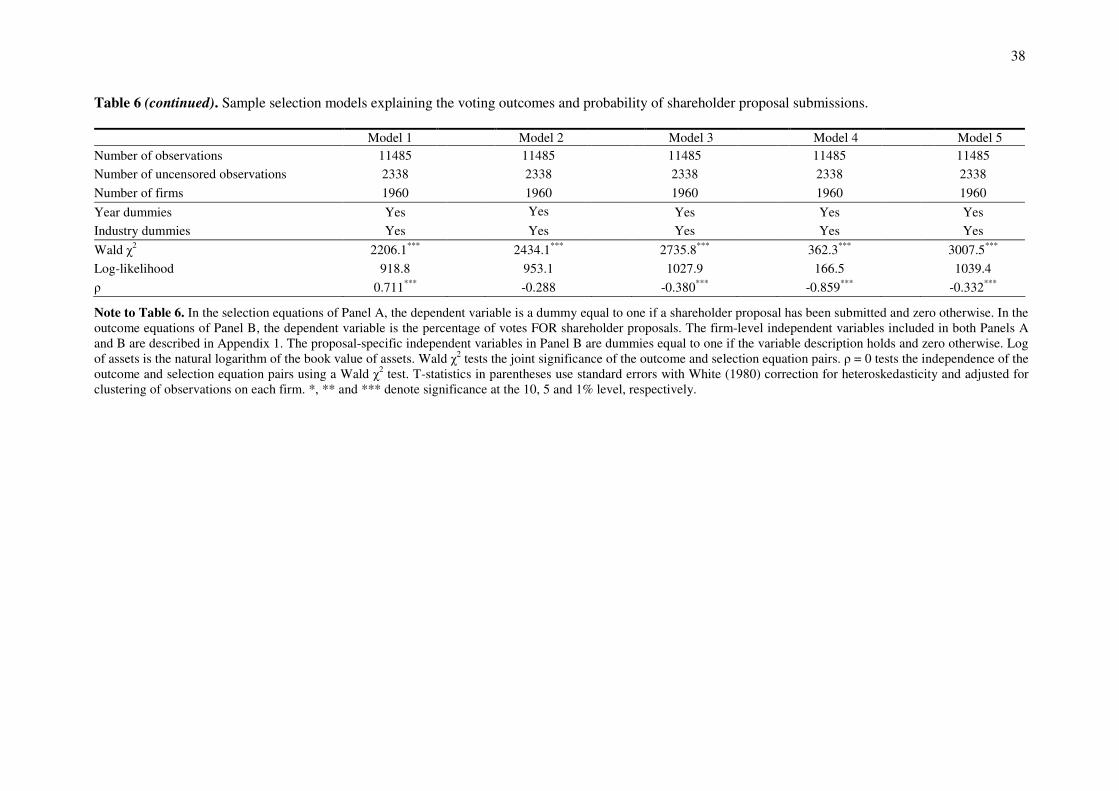
38
Table 6 (continued). Sample selection models explaining the voting outcomes and probability of shareholder proposal submissions.
Model 1 Model 2 Model 3 Model 4 Model 5
Number of observations 11485 11485 11485 11485 11485
Number of uncensored observations 2338 2338 2338 2338 2338
Number of firms 1960 1960 1960 1960 1960
Year dummies Yes Yes
Yes Yes Yes
Industry dummies Yes Yes Yes Yes Yes
Wald χ2 2206.1*** 2434.1*** 2735.8*** 362.3*** 3007.5***
Log-likelihood 918.8 953.1 1027.9 166.5 1039.4
ρ 0.711*** -0.288 -0.380*** -0.859*** -0.332***
Note to Table 6. In the selection equations of Panel A, the dependent variable is a dummy equal to one if a shareholder proposal has been submitted and zero otherwise. In the outcome equations of Panel B, the dependent variable is the percentage of votes FOR shareholder proposals. The firm-level independent variables included in both Panels A and B are described in Appendix 1. The proposal-specific independent variables in Panel B are dummies equal to one if the variable description holds and zero otherwise. Log of assets is the natural logarithm of the book value of assets. Wald χ2 tests the joint significance of the outcome and selection equation pairs. ρ = 0 tests the independence of the outcome and selection equation pairs using a Wald χ2 test. T-statistics in parentheses use standard errors with White (1980) correction for heteroskedasticity and adjusted for clustering of observations on each firm. *, ** and *** denote significance at the 10, 5 and 1% level, respectively.

39
Table 7. Sample selection models explaining the cumulative abnormal returns and probability of shareholder proposal submissions.
Model 1 Model 2 Model 3 Model 4 Model 5 Coefficient T-stat Coefficient T-stat Coefficient T-stat Coefficient T-stat Coefficient T-stat
Panel A: Selection equations
Intercept -8.838*** -11.76 0.037 0.01 -0.002 0.00 -0.169 -0.07 -0.144 -0.06
Log of assets 0.548*** 12.96 0.598*** 16.38 0.595*** 16.62 0.592*** 16.45 0.592*** 16.56
Debt-to-equity -0.004*** -3.81 -0.030*** -5.03 -0.030*** -5.18 -0.030*** -5.39 -0.030*** -5.33
Market-to-book 0.000 0.23 0.004* 1.82 0.003* 1.67 0.003 1.57 0.003 1.59
Prior 1-year abnormal performance -0.200** -2.12 -0.274** -2.13 -0.238* -1.88 -0.220* -1.73 -0.224* -1.77
Prior 1-year share turnover 0.095*** 6.88 0.044 1.22 0.041 1.11 0.045 1.29 0.044 1.25
Institutional ownership - pressure sensitive -3.137*** -2.95 -1.895* -1.73 -1.904* -1.69 -1.784 -1.63 -1.815* -1.65
Institutional ownership - pressure insensitive 1.361*** 4.07 1.035*** 3.61 1.019*** 3.67 0.994*** 3.73 0.998*** 3.71
Entrenchment index 0.264*** 2.74 0.259*** 2.71 0.247*** 2.65 0.248*** 2.65
Board size -0.246*** -3.31 -0.244*** -3.34 -0.236*** -3.19 -0.237*** -3.21
Board size squared 0.007*** 3.30 0.007*** 3.29 0.007*** 3.13 0.007*** 3.15
Employee directors -0.096 -0.10 -0.061 -0.06 0.007 0.01 0.010 0.01
Average age of non-employee directors -0.139*** -3.29 -0.137*** -3.27 -0.134*** -3.23 -0.135*** -3.23
Separate chair and CEO 0.102 0.38 0.104 0.39 0.097 0.36 0.098 0.36
CEO ownership -1.115* -1.78 -1.061* -1.81 -0.971* -1.84 -0.979* -1.84
Firm value sensitivity of CEO option holdings 0.022*** 5.78 0.022*** 5.83 0.022*** 5.88 0.022*** 5.87
Stock-based to total of CEO compensation -1.111*** -3.38 -1.090*** -3.39 -1.038*** -3.40 -1.041*** -3.39
Abnormal CEO compensation 0.107* 1.64 0.103 1.56 0.095 1.38 0.096 1.41

40
Table 7 (continued). Sample selection models explaining the cumulative abnormal returns and probability of shareholder proposal submissions.
Model 1 Model 2 Model 3 Model 4 Model 5 Coefficient T-stat Coefficient T-stat Coefficient T-stat Coefficient T-stat Coefficient T-stat
Panel A: Outcome equations
Intercept -0.586 -1.53 -0.588 -1.53 -5.137*** -2.92 -0.023 -0.75 -3.481 -1.16Targeted in previous year -0.347 -1.43 -0.351 -1.45 -0.397 -1.62 -0.382 -1.57Number of proposals in proxy -0.236 -1.37 -0.236 -1.37 -0.310* -1.83 -0.299* -1.78
Proposal - Antitakeover 0.614** 2.06 0.615** 2.06 0.675** 2.27 0.565* 1.89Proposal - Voting 0.082 0.26 0.085 0.27 0.081 0.26 0.161 0.53Proposal - Board 0.500 1.46 0.500 1.47 0.465 1.37 0.509 1.48Proposal - Sale of company 0.407 0.66 0.406 0.66 0.580 0.93 0.531 0.84Proposal - Compensation 0.147 0.48 0.149 0.49 0.104 0.34 0.088 0.29Proposal - Annual meeting 0.121 0.21 0.120 0.21 -0.009 -0.02 0.015 0.02Proposal - Audit -0.019 -0.04 -0.016 -0.03 0.028 0.06 0.106 0.20
Sponsor - Investment firm -0.060 -0.08 -0.047 -0.07 0.131 0.19 0.077 0.11Sponsor - Non-union pension fund 1.002* 1.70 1.007* 1.71 1.119* 1.88 1.094* 1.82Sponsor - Union pension fund 0.254 1.12 0.253 1.12 0.238 1.04 0.232 1.02Sponsor - Coordinated investors 0.069 0.18 0.074 0.19 0.197 0.52 0.197 0.51Sponsor - Religious/socially responsible 0.015 0.03 0.014 0.03 0.009 0.02 0.177 0.38
Log of assets 0.184** 2.32 0.170* 1.91 0.244*** 2.59Debt-to-equity 0.008 1.62 0.005 1.25 0.006 1.31Market-to-book 0.006 0.97 0.006 1.24 0.006 1.15Prior 1-year abnormal performance -0.456 -1.59 -0.483* -1.70 -0.485* -1.68Prior 1-year share turnover 0.252** 2.26 0.258** 2.37 0.242** 2.12Institutional ownership - pressure sensitive 1.292 0.66 1.715 0.93 1.644 0.88Institutional ownership - pressure insensitive -0.202 -0.28 -0.194 -0.26 -0.388 -0.51
Entrenchment index 0.309*** 3.91 0.252*** 3.17Board size -0.244 -1.39 -0.232 -1.28Board size squared 0.010 1.45 0.009 1.31Employee directors -0.523 -0.45 -1.170 -1.00Average age of non-employee directors -0.021 -0.50 -0.029 -0.66Separate chair and CEO 0.108 0.35 0.088 0.28CEO ownership -2.253 -0.91 -2.264 -0.90Firm value sensitivity of CEO option holdings 0.006 0.49 0.005 0.43Stock-based to total of CEO compensation -0.694 -1.62 -0.739* -1.74Abnormal CEO compensation 0.081 0.67 0.096 0.80

41
Table 7 (continued). Sample selection models explaining the cumulative abnormal returns and probability of shareholder proposal submissions.
Model 1 Model 2 Model 3 Model 4 Model 5
Number of observations 10551 10551 10551 10551 10551
Number of uncensored observations 1451 1451 1451 1451 1451
Number of firms 1961 1961 1961 1961 1961
Year dummies Yes Yes
Yes Yes Yes
Industry dummies Yes Yes Yes Yes Yes
Wald χ2 41.56*** 41.74*** 59.94*** 71.76*** 87.94***
Log-likelihood 2628.7 2637.6 2646.3 2645.7 2654.9
ρ -0.095 -0.220** -0.170* -0.091 -0.104
Note to Table 7. In the selection equations of Panel A, the dependent variable is a dummy equal to one if a shareholder proposal has been submitted and zero otherwise. In the outcome equations of Panel B, the dependent variable is the cumulative abnormal return in the days -1 to +1 surrounding the date that the proxy statement is mailed. Market model parameters are estimated over the 200-day period ending 30 days before the proxy mailing date, using the CRSP equal-weighted index. The firm-level independent variables included in both Panels A and B are described in Appendix 1. The proposal-specific independent variables in Panel B are dummies equal to one if the variable description holds and zero otherwise. Log of assets is the natural logarithm of the book value of assets. Wald χ2 tests the joint significance of the outcome and selection equation pairs. ρ = 0 tests the independence of the outcome and selection equation pairs using a Wald χ2 test. T-statistics use standard errors with White (1980) correction for heteroskedasticity and adjusted for clustering of observations on each firm. *, ** and *** denote significance at the 10, 5 and 1% level, respectively.

42
Appendix 1. Variable descriptions.
Variable name Description and source
Panel A: Financial, performance, and ownership characteristics
Assets ($ millions) The book value of total assets. Source: Compustat.
Sales ($ millions) The value of total net sales. Source: Compustat.
Debt-to-equity ratio Total debt divided by the book value of equity. Source: Compustat.
Market-to-book ratio Market capitalization of equity divided by the book value of equity. Source: Compustat.
Prior 1-year performance The dividend-adjusted stock price return in the year up to two months before the proxy mailing date. Source: CRSP.
Prior 1-year abnormal performance The dividend-adjusted stock price return minus the return on the CRSP equal-weighted index, in the year up to two months before the proxy mailing date. Source: CRSP.
Prior 1-year share turnover The total number of shares sold during the year up to two months before the proxy mailing date, divided by total shares outstanding. Source: CRSP.
Institutional ownership The number of shares held by institutions, divided by total shares outstanding. Source: Thomson Financial CDA/Spectrum.
Institutional ownership –
pressure sensitive
The number of shares held by banks and insurance companies, divided by total shares outstanding. Source: Thomson Financial CDA/Spectrum.
Institutional ownership –
pressure insensitive
The number of shares held by private and public pension and labor union funds, investment companies and their managers, independent investment advisors, and university endowments, divided by total shares outstanding. Source: Thomson
Financial CDA/Spectrum.
Panel B: Governance characteristics
Governance Index (Max=24) Gompers, Ishii and Metrick (2003) index of 24 governance-related charter and by-law provisions. Source: Investor Responsibility Research Center.
Entrenchment Index (Max=6) Bebchuk, Cohen and Ferrell (2005) index of 6 governance-related charter and by-law provisions. Source: Investor Responsibility Research Center.
Board size The number of executive and non-executive directors on the board of directors. Source: Investor Responsibility Research Center.
Employee directors The number of directors employed by the firm, divided by total board size. Source: Investor Responsibility Research Center.
Age of non-employee directors The average age of non-employee directors. Source: Investor Responsibility Research
Center.
Separate chair and CEO A dummy variable equal to 1 if the CEO is also the current chairman of the board, and 0 otherwise. Source: Investor Responsibility Research Center.
CEO ownership The number of shares held by the CEO divided by total shares outstanding. Source: ExecuComp.
Firm value sensitivity of
CEO option holdings
The value change in the CEO's total option holdings for a $1,000 change in the market value of equity. Source: ExecuComp.
Stock-based to total CEO
compensation
The value of stock options and restricted stock grants, divided by total CEO compensation for the individual year. Source: ExecuComp.
CEO compensation excluding
option grants ($000s)
Total CEO compensation for the individual year, including salary, bonus, restricted stock, stock options, long-term incentive payouts and other compensation. Source: ExecuComp.
Abnormal CEO compensation The natural logarithm of the residual from an annual regression, which regresses the log of total CEO compensation excluding stock option grants on the book value of assets and industry dummies. Source: ExecuComp.

43
Appendix 2. Economic effects.
Proposal probability Voting outcome
Cumulative abnormal return
Exp.
Sign
Economic
effect
Exp.
Sign
Economic
effect
Exp.
Sign
Economic
effect
Panel A: Proposal characteristics
Times submitted + 0.860***
Targeted in previous year - nss
Number of proposals in proxy + 0.417* + -0.299*
Proposal - Antitakeover + 39.019*** + 0.565*
Proposal - Voting 19.957*** nss
Proposal - Board 8.008*** nss
Proposal - Sale of company nss nss
Proposal - Compensation 6.616*** nss
Proposal - Annual meeting nss nss
Proposal - Audit 4.569* nss
Sponsor - Investment firm + 10.207** + nss
Sponsor - Non-union pension fund + 6.336*** + 1.094*
Sponsor - Union pension fund + 2.576*** + nss
Sponsor - Coordinated investors nss nss
Sponsor - Religious/socially responsible nss nss
Panel B: Financial, performance and ownership characteristics
Log of assets + 0.592*** - -0.758** + 0.244***
Debt-to-equity - -0.030*** - nss - nss
Market-to-book - nss - nss - nss
Prior 1-year abnormal performance - -0.224* - nss - -0.485*
Prior 1-year share turnover + nss + 1.130** + 0.242**
Institutional ownership – pressure sensitive + -1.815* + nss - nss
Institutional ownership – pressure insensitive + 0.998*** + 11.102*** - nss
Panel C: Governance characteristics
Entrenchment index + 0.248*** + 0.908** + 0.252***
Board size - -0.237*** - -1.108** - nss
Board size squared + 0.007*** + 0.037** + nss
Employee directors + nss + nss + nss
Average age of non-employee directors - -0.135*** - nss - nss
Separate chair and CEO - nss - nss - nss
CEO ownership - -0.979* - nss - nss
Firm value sensitivity of CEO option holdings - 0.022*** - nss - nss
Stock-based to total of CEO compensation - -1.041*** - nss - -0.739*
Abnormal CEO compensation + nss + nss + nss
Note to Appendix 2. This table summarizes the economic effects of proposal and firm characteristics on the voting outcomes of shareholder proposals as shown in Model 5 of Table 6, and on the probability of proposal submissions and the cumulative abnormal returns induced their announcement as shown in Model 5 of Tables 7. The variables are described in Appendix 1. *, ** and *** denote significance at the 10, 5 and 1% level, respectively.