The submission of Bangladesh’s Forest...The submission of Bangladesh’s Forest Reference Level...
161
The submission of Bangladesh’s Forest Reference Level for REDD+ under the UNFCCC Ministry of Environment, Forest and Climate Change (MoEFCC) Government of the People’s Republic of Bangladesh DECEMBER 2018
Transcript of The submission of Bangladesh’s Forest...The submission of Bangladesh’s Forest Reference Level...
The submission of Bangladesh’s Forest
Reference Level for REDD+ under the UNFCCC
Ministry of Environment, Forest and Climate Change (MoEFCC)
Government of the People’s Republic of Bangladesh
DECEMBER 2018
2 | P a g e
3 | P a g e
Preface
Bangladesh is developing its capacity for assessing and implementing REDD+ activities with the
support from the UN-REDD Programme since 2011. Stakeholders from different government and
non-government organizations, academia, research organization as well as the civil society were
involved in the Forest Reference Level (FRL) Development process through trainings, workshops,
seminars and consultations at national and subnational levels.
Land cover maps from 2000 to 2015 were prepared for assessing and monitoring the changes. Tree
cover change for the period 2000-2015 were integrated with the land cover maps for identifying
the degraded forest areas. Deforestation, forest degradation and enhancement of forest cover
were identified as REDD+ activities for calculation of FRL. National stakeholders were trained,
involved and engaged from the beginning of the process of the development of the different
products and their integration for the preparation of the FRL (e.g. field data collection, land cover
map, accuracy assessment, calculation of activity data etc.).
FRL has been developed at national level and for the five zones developed for the national forest
monitoring system. While developing the FRL considerable improvement in technical capacity has
been achieved and subsequent submissions will help further in consolidation. The FRL estimation
is based on most recent guidelines of UNFCCC.
The FRL is expected to be a guiding tool towards reducing deforestation and forest degradation and
enhance forest carbon stocks in Bangladesh.
Dr. Nurul Quadir Additional Secretary Climate Change Wing Ministry of Environment, Forest and Climate Change
4 | P a g e
Acknowledgement
The submission of Bangladesh Forest Reference Level (FRL) is an effort of series of studies that have been
conducted by the Bangladesh Forest Department under the Ministry of Environment, Forest and Climate
Change (MoEFCC). The policy makers, key government officials, experts, academia, and civil societies have
been involved to prepare this national document.
At the beginning, the Bangladesh Forest Department wishes to express sincere gratitude to the Honorable
Minister, Ministry of Environment, Forest and Climate Change (MoEFCC), Mr. Anisul Islam Mahmud, MP for
his effective leadership in preparing this important national document. We are also grateful to the Honorable
Deputy Minister, Ministry of Environment, Forest and Climate Change (MoEFCC), Mr. Abdullah Al Islam Jakob
for his guidance towards the successful preparation of the report. We are also thankful to Mr. Abdullah Al
Mohsin Chowdhury, Secretary, Ministry of Environment, Forest and Climate Change (MoEFCC) for his active
guidance to prepare the report. Sincere gratitude to Mr. Mohammed Shafiul Alam Chowdhury, Chief
Conservator of Forests, Bangladesh Forest Department, for his immense support and direction for the
completion of this report.
We express our gratitude to the concerned officials of Bangladesh Forest Department, MRV working group
and FAO for their technical assistance during the preparation of the report.
Md. Rakibul Hasan Mukul
Conservator of Forests
Bangladesh Forest Department
&
National Project Director
UN-REDD Bangladesh National Programme
5 | P a g e
Contributions:
Ministry of Environment, Forest and Climate Change (MoEFCC), Bangladesh
Nurul Quadir, Additional Secretary (Climate Change)
Abu Nasar Mohammad Abdullah, Deputy Secretary (Climate Change-1)
A S M Ferdoush, Deputy Secretary
Md. Saifur Rahman, Senior Assistant Chief
Bangladesh Forest Department (BFD)
Mohammed Shafiul Alam Chowdhury, Chief Conservator of Forests
Zahir Uddin Ahmed, Deputy Chief Conservator of Forests
Md. Rakibul Hasan Mukul, Conservator of Forests & National Project Director of UN-REDD Bangladesh
National Programme
Gobinda Roy, Conservator of Forests
Marufa Akther, Conservator of Forests
Hossain Mohammad Nishad, Divisional Forest Officer
Md. Ariful Hoque Belal, Assistant Chief Conservator of Forests
R.S.M. Munirul Islam, Divisional Forest Officer
Mihir Kumar Doe, Divisional Forest Officer
Md. Baktiar Nur Siddiqui, Divisional Forest Officer
Md. Zaheer Iqbal, Deputy Conservator of Forests
Mariam Akhter, Assistant Conservator of Forests
6 | P a g e
Table of Contents Table of Contents .......................................................................................................................................... 6
1. Introduction ...........................................................................................................................................14
2. National Context ....................................................................................................................................15
2.1 Forest resources in Bangladesh ........................................................................................................15
2.2 Land cover, zoning and tree cover maps ...........................................................................................16
2.2.1 Land cover maps .......................................................................................................................16
2.2.2 Zoning for national tree and forest assessment .........................................................................17
2.2.3 Tree cover maps ........................................................................................................................20
2.3 Trees outside forest .........................................................................................................................20
2.4 Forest trends and government strategic plans in Bangladesh ...........................................................20
3. Elements of forest reference level/forest reference emission level ........................................................22
3.1 Forest definition ...............................................................................................................................22
3.2 Pools and greenhouse gases (GHGs) .................................................................................................23
3.3 REDD+ activities ...............................................................................................................................23
3.3.1 Included REDD+ activities ..........................................................................................................23
3.3.2 Excluded REDD+ activities ..........................................................................................................25
3.4 Scale of forest reference level/forest reference emission level .........................................................25
4. Data and construction approach ............................................................................................................26
4.1 Activity Data .....................................................................................................................................26
4.1.1 National land cover map 2015 ...................................................................................................26
4.1.2 National land cover map 2000 ...................................................................................................29
4.1.3 Harmonization of Land Cover Map 2015 and 2000.....................................................................31
4.1.4 Calculation steps to generate activity data ................................................................................32
4.2 Emission and removal factors ...........................................................................................................33
4.2.1 Above-ground and belowground biomass estimates..................................................................33
4.2.2 Integration of tree cover 2000-2014 maps .................................................................................35
4.2.3 Average percentage tree cover and average biomass per percent tree cover ............................38
4.2.4 Emission and removal factors ....................................................................................................39
4.3 Reference period..............................................................................................................................40
4.4 Construction method .......................................................................................................................40
5. Proposed forest reference level .............................................................................................................42
6. Uncertainty Analysis ..............................................................................................................................43
6.1 Uncertainty analysis of Activity Data ................................................................................................43
6.1.1 Sampling design ........................................................................................................................43
6.1.2 Response design ........................................................................................................................46
7 | P a g e
6.1.3 Estimating accuracy and area ....................................................................................................46
6.2 Uncertainty analysis of Emission Factors ..........................................................................................48
7. National circumstances, future potentials and challenges ......................................................................49
8. Transparent, accurate, complete, and consistent information ................................................................50
9. Future improvement opportunities ........................................................................................................53
10. References ...........................................................................................................................................54
11. Appendix..............................................................................................................................................57
8 | P a g e
List of Tables Table 1: State-owned ‘forest land’ by legal categories (BFD 2017) ..............................................................15
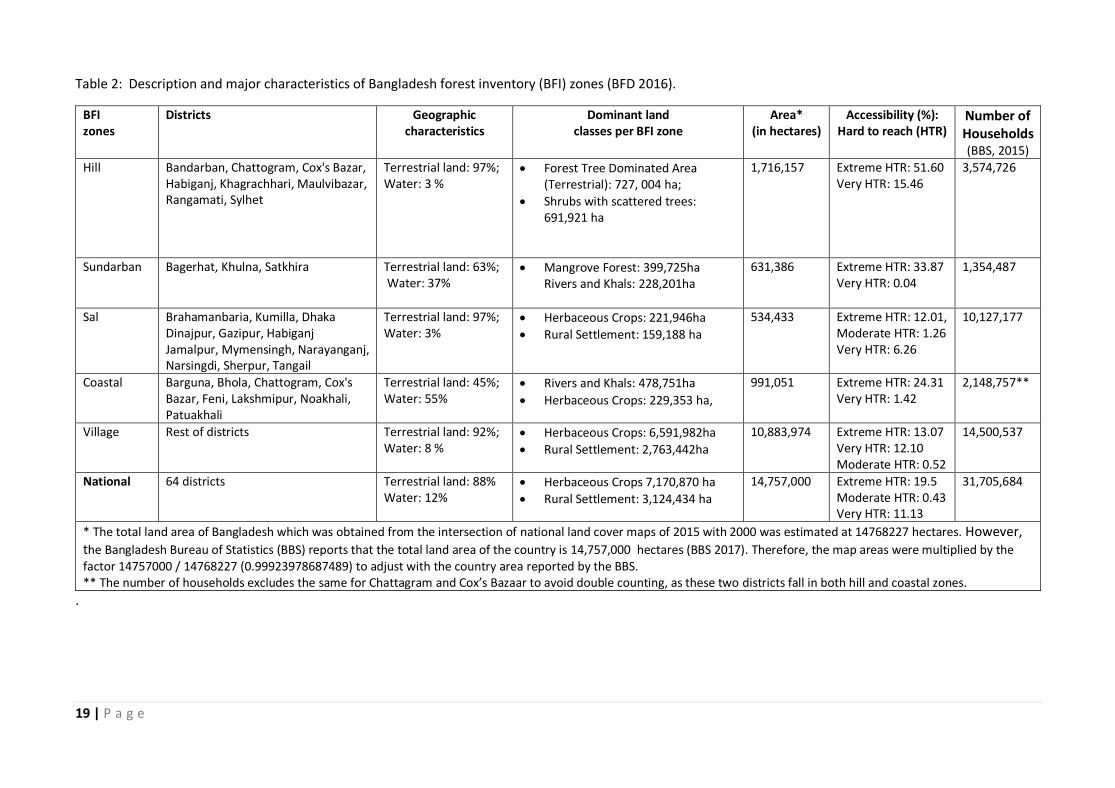
Table 2: Description and major characteristics of Bangladesh forest inventory (BFI) zones (BFD 2016). .....19
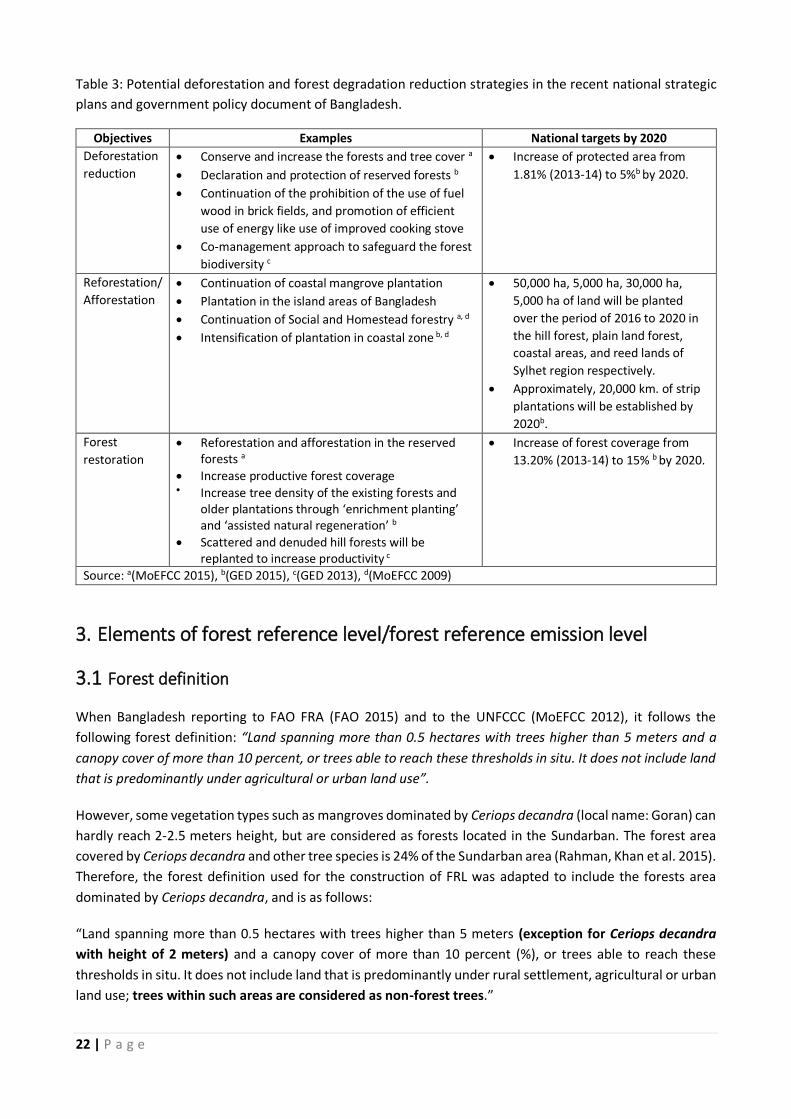
Table 3: Potential deforestation and forest degradation reduction strategies in the recent national strategic
plans and government policy document of Bangladesh. .............................................................22
Table 4. Matrix of REDD+ activities which were defined in Bangladesh’s FRL. .............................................25
Table 5: Area (in hectares) of land classes at the zone and national level in 2015. ......................................27
Table 6: Area (in hectares) of land classes at the zone and national level in 2000. .....................................29
Table 7: Harmonization between the land classes of the national land cover maps of 2015 and 2000. .......31
Table 8: The first ten polygons of the attribute table of the land cover change map (2000-2015). ..............32
Table 9: National and sub-national forest inventories conducted between 1997 and 2014 (Sola, Costello et
al. 2016). ....................................................................................................................................34
Table 10: Mean above-ground biomass (agb in ton/ha) per land class (Sola, Costello et al. 2016) ..............35
Table 11: Weighted average above-ground biomass (w_agb_class), weighted average percentage of tree
cover (w_avg_ptc) and above-ground biomass per percent tree cover (agb_ptc) of each of the
harmonized FRL land use classes. NA: not available ....................................................................39
Table 12: Activity data (ha/year) of REDD+ activities for BFI zones and national level. ................................40
Table 13: Emission and removal factors (tCO2eq/ha) for REDD+ activities for the BFI zone and national
level. ..........................................................................................................................................41
Table 14: Emissions and removals (t CO2e/year) from REDD+ activities at the zone and national level. ......41
Table 15: Emission and Removal (t CO2e/year) at the zone and national level. The numbers within the
parentheses are confidence interval (%). ....................................................................................42
Table 16. Sampling design for the accuracy assessment of activity classes .................................................44
Table 17: Error matrix of the uncertainty analysis .....................................................................................47
Table 18. Accuracy and area estimate for the REDD+ activities ..................................................................47
Table 19: Zone area adjustment after accuracy assessment .......................................................................48
Table 20: Differences between GHG inventory for third national communication and FRL for REDD+.........52
Table 21. Country-specific forestry activities conducted in the 5 zones of Bangladesh. ...............................60
Table 22: Adjusted areas (in hectares) of deforestation, reforestation and stable non-forest at the National
level. ..........................................................................................................................................71
Table 23: Adjusted emission and removal factors (in tCO2e/ha) associated with the adjusted areas (in ha)
of deforestation, reforestation and stable non-forest at the National level. ...............................72
Table 24: Annual emissions and removals (in tCO2e/year) from deforestation, reforestation and stable
non-forest at the National level. .................................................................................................73
Table 25: Adjusted areas (in hectares) of high degradation at the National level. .......................................74
Table 26: Adjusted emission factors (in tCO2e/ha) associated with the adjusted areas (in ha) of high
degradation at the National level. ..............................................................................................75
Table 27: Annual emissions (in tCO2e/year) from high degradation at the National level. ..........................76
Table 28: Adjusted areas (in hectares) of low degradation at the National level. ........................................77
Table 29: Adjusted emission and removal factors (in tCO2e/ha) associated with the adjusted areas (in ha)
of low degradation at the National level. ....................................................................................78
Table 30: Annual emissions and removals (in tCO2e/year) from low degradation at the National level. .....79
Table 31: Adjusted areas (in hectares) of high restoration at the National level. ........................................80
Table 32: Adjusted removal factors (in tCO2e/ha) associated with the adjusted areas (in ha) of high
restoration at the National level. ...............................................................................................81
Table 33: Annual removals (in tCO2e/year) from high restoration at the National level. ............................82
Table 34: Adjusted areas (in hectares) of low restoration at the National level...........................................83
9 | P a g e
Table 35: Adjusted emission and removal factors (in tCO2e/ha) associated with the adjusted areas (in ha)
of low restoration at the National level. ....................................................................................84
Table 36: Annual emissions and removals (in tCO2e/year) from low restoration at the National level. ......85
Table 37: Adjusted areas (in hectares) of deforestation, reforestation and stable non-forest in the coastal
zone. ..........................................................................................................................................86
Table 38: Adjusted emission and removal factors (in tCO2e/ha) associated with the adjusted areas (in ha)
of deforestation, reforestation and stable non-forest in the coastal zone. ..................................87
Table 39: Annual emissions and removals (in tCO2e/year) from deforestation, reforestation and stable
non-forest in the coastal zone. ...................................................................................................88
Table 40: Adjusted areas (in hectares) of high degradation in the coastal zone. ........................................89
Table 41: Adjusted emission factors (in tCO2e/ha) associated with the adjusted areas (in ha) of high
degradation in the coastal zone. ................................................................................................90
Table 42: Annual emissions (in tCO2e/year) from high degradation in the coastal zone. ...........................91
Table 43: Adjusted areas (in hectares) of low degradation in the coastal zone. .........................................92
Table 44: Adjusted emission factors (in tCO2e/ha) associated with the adjusted areas (in ha) of low
degradation in the coastal zone. ................................................................................................93
Table 45: Annual emissions (in tCO2e/year) from low degradation in the coastal zone. ............................94
Table 46: Adjusted areas (in hectares) of high restoration in the coastal zone. ..........................................95
Table 47: Adjusted removal factors (in tCO2e/ha) associated with the adjusted areas (in ha) of high
restoration in the coastal zone. ..................................................................................................96
Table 48: Annual removals (in tCO2e/year) from high restoration in the coastal zone. .............................97
Table 49: Adjusted areas (in hectares) of low restoration in the coastal zone. ...........................................98
Table 50: Adjusted removal factors (in tCO2e/ha) associated with the adjusted areas (in ha) of low
restoration in the coastal zone. ..................................................................................................99
Table 51: Annual removals (in tCO2e/year) from low restoration in the coastal zone. .............................100
Table 52: Adjusted areas (in hectares) of deforestation, reforestation and stable non-forest in the hill zone.
................................................................................................................................................101
Table 53: Adjusted emission and removal factors (in tCO2e/ha) associated with the adjusted areas (in ha)
of deforestation, reforestation and stable non-forest in the hill zone.....................................102
Table 54: Annual emissions and removals (in tCO2e/year) from deforestation, reforestation and stable
non-forest in the hill zone. ......................................................................................................103
Table 55: Adjusted areas (in hectares) of high degradation in the hill zone. .............................................104
Table 56: Adjusted emission factors (in tCO2e/ha) associated with the adjusted areas (in ha) of high
degradation in the hill zone. ....................................................................................................105
Table 57: Annual emissions (in tCO2e/year) from high degradation in the hill zone. ...............................106
Table 58: Adjusted areas (in hectares) of low degradation in the hill zone. ..............................................107
Table 59: Adjusted emission and removal factors (in tCO2e/ha) associated with the adjusted areas (in ha)
of low degradation in the hill zone. ..........................................................................................108
Table 60: Annual emissions and removals (in tCO2e/year) from low degradation in the hill zone. ..........109
Table 61: Adjusted areas (in hectares) of high restoration in the hill zone. ..............................................110
Table 62: Adjusted removal factors (in tCO2e/ha) associated with the adjusted areas (in ha) of high
restoration in the hill zone. ......................................................................................................111
Table 63: Annual removals (in tCO2e/year) from high restoration in the hill zone. .................................112
Table 64: Adjusted areas (in hectares) of low restoration in the hill zone. ................................................113
Table 65: Adjusted emission and removal factors (in tCO2e/ha) associated with the adjusted areas (in ha)
of low restoration in the hill zone. ...........................................................................................114
Table 66: Annual emissions and removals (in tCO2e/year) from low restoration in the hill zone. ...........115
Table 67: Adjusted areas (in hectares) of deforestation, reforestation and stable non-forest in the sal zone.
................................................................................................................................................116

10 | P a g e
Table 68: Adjusted emission and removal factors (in tCO2e/ha) associated with the adjusted areas (in ha)
of deforestation, reforestation and stable non-forest in the sal zone........................................117
Table 69: Annual emissions and removals (in tCO2e/year) from deforestation, reforestation and stable
non-forest in the sal zone. ......................................................................................................118
Table 70: Adjusted areas (in hectares) of high degradation in the sal zone. ............................................119
Table 71: Adjusted emission factors (in tCO2e/ha) associated with the adjusted areas (in ha) of high
degradation in the sal zone. ....................................................................................................120
Table 72: Annual emissions (in tCO2e/year) from high degradation in the sal zone. ................................121
Table 73: Adjusted areas (in hectares) of low degradation in the sal zone. .............................................122
Table 74: Adjusted emission factors (in tCO2e/ha) associated with the adjusted areas (in ha) of low
degradation in the sal zone. ....................................................................................................123
Table 75: Annual emissions (in tCO2e/year) from low degradation in the sal zone. .................................124
Table 76: Adjusted areas (in hectares) of high restoration in the sal zone. ..............................................125
Table 77: Adjusted removal factors (in tCO2e/ha) associated with the adjusted areas (in ha) of high
restoration in the sal zone. ......................................................................................................126
Table 78: Annual removals (in tCO2e/year) from high restoration in the sal zone. ..................................127
Table 79: Adjusted areas (in hectares) of low restoration in the sal zone. ...............................................128
Table 80: Adjusted removal factors (in tCO2e/ha) associated with the adjusted areas (in ha) of low
restoration in the sal zone. .......................................................................................................129
Table 81: Annual emissions and removals (in tCO2e/year) from low restoration in the sal zone. ..............130
Table 82: Adjusted areas (in hectares) of deforestation, reforestation and stable non-forest in the
sundarban zone. ......................................................................................................................131
Table 83: Adjusted emission and removal factors (in tCO2e/ha) associated with the adjusted areas (in ha)
of deforestation, reforestation and stable non-forest in the sundarban zone. ........................132
Table 84: Annual emission and removals (in tCO2e/year) from deforestation, reforestation and stable non-
forest in the sundarban zone. ...................................................................................................133
Table 85: Adjusted areas (in hectares) of high degradation in the sundarban zone. ..................................134
Table 86: Adjusted emission factors (in tCO2e/ha) associated with the adjusted areas (in ha) of high
degradation in the sundarban zone. .........................................................................................135
Table 87: Annual emissions (in tCO2e/year) from high degradation in the sundarban zone. .....................136
Table 88: Adjusted areas (in hectares) of low degradation in the sundarban zone. ...................................137
Table 89: Adjusted emission factors (in tCO2e/ha) associated with the adjusted areas (in ha) of low
degradation in the sundarban zone. .......................................................................................138
Table 90: Annual emissions (in tCO2e/year) from low degradation in the sundarban zone. ......................139
Table 91: Adjusted areas (in hectares) of high restoration in the sundarban zone. ...................................140
Table 92: Adjusted removal factors (in tCO2e/ha) associated with the adjusted areas (in ha) of high
restoration in the sundarban zone. ..........................................................................................141
Table 93: Annual removals (in tCO2e/year) from high restoration in the sundarban zone. .......................142
Table 94: Adjusted areas (in hectares) of low restoration in the sundarban zone....................................143
Table 95: Adjusted removal factors (in tCO2e/ha) associated with the adjusted areas (in ha) of low
restoration in the sundarban zone. ..........................................................................................144
Table 96: Annual removals (in tCO2e/year) from low restoration in the sundarban zone. ........................145
Table 97: Adjusted areas (in hectares) of deforestation, reforestation and stable non-forest in the village
zone. ........................................................................................................................................146
Table 98: Adjusted emission and removal factors (in tCO2e/ha) associated with the adjusted areas (in ha)
of deforestation, reforestation and stable non-forest in the village zone. .............................147
Table 99: Annual emissions and removals (in tCO2e/year) from deforestation, reforestation and stable
non-forest in the village zone. ..................................................................................................148
Table 100: Adjusted areas (in hectares) of high degradation in the village zone. ......................................149
11 | P a g e
Table 101: Adjusted emission factors (in tCO2e/ha) associated with the adjusted areas (in ha) of high
degradation in the village zone.................................................................................................150
Table 102: Annual emissions (in tCO2e/year) from high degradation in the village zone...........................151
Table 103: Adjusted areas (in hectares) of low degradation in the village zone. .......................................152
Table 104: Adjusted emission factors (in tCO2e/ha) associated with the adjusted areas (in ha) of low
degradation in the village zone.................................................................................................153
Table 105: Annual emissions (in tCO2e/year) from low degradation in the village zone. ..........................154
Table 106: Adjusted areas (in hectares) of high restoration in the village zone. ........................................155
Table 107: Adjusted removal factors (in tCO2e/ha) associated with the adjusted areas (in ha) of high
restoration in the village zone. .................................................................................................156
Table 108: Annual removals (in tCO2e/year) from high restoration in the village zone. ............................157
Table 109: Adjusted areas (in hectares) of low restoration in the village zone. .........................................158
Table 110: Adjusted emission and removal factors (in tCO2e/ha) associated with the adjusted areas (in ha)
of low restoration in the village zone. ......................................................................................159
Table 111: Annual emissions and removals (in tCO2e/year) from low restoration in the village zone. ......160
List of Figures Figure 1: Zoning for national tree and forest assessment under the Bangladesh forest inventory (BFD 2016).
..................................................................................................................................................18
Figure 2: National Land Cover map 2015 (GoB 2017)..................................................................................28
Figure 3: National Land cover map 2000 (GoB 2017) ..................................................................................30
Figure 4: Tree cover change map 2000-2014 (Potapov, Siddiqui et al. 2017). .............................................37
Figure 5: Distribution of accuracy assessment location over activity classes. .............................................45
Figure 6: Reference data collection employing Open foris collect earth .....................................................46
Figure 7: Schematic overview of the terrestrial vegetation land classes of the land representation system of
Bangladesh. ...............................................................................................................................57
Figure 8: Schematic overview of the aquatic or regularly flooded vegetation land classes of the land
representation system of Bangladesh.........................................................................................58
Figure 9: Schematic overview of the terrestrial non vegetated land classes of the Land representation
system of Bangladesh.................................................................................................................59
12 | P a g e
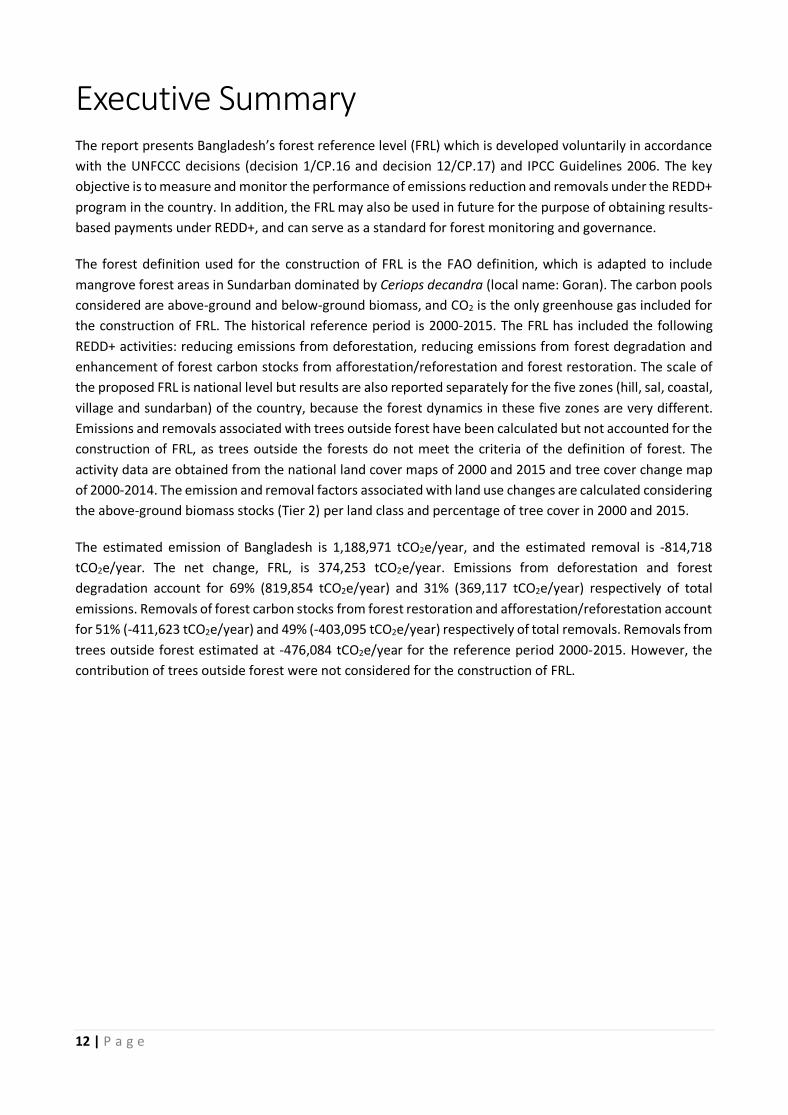
Executive Summary The report presents Bangladesh’s forest reference level (FRL) which is developed voluntarily in accordance
with the UNFCCC decisions (decision 1/CP.16 and decision 12/CP.17) and IPCC Guidelines 2006. The key
objective is to measure and monitor the performance of emissions reduction and removals under the REDD+
program in the country. In addition, the FRL may also be used in future for the purpose of obtaining results-
based payments under REDD+, and can serve as a standard for forest monitoring and governance.
The forest definition used for the construction of FRL is the FAO definition, which is adapted to include
mangrove forest areas in Sundarban dominated by Ceriops decandra (local name: Goran). The carbon pools
considered are above-ground and below-ground biomass, and CO2 is the only greenhouse gas included for
the construction of FRL. The historical reference period is 2000-2015. The FRL has included the following
REDD+ activities: reducing emissions from deforestation, reducing emissions from forest degradation and
enhancement of forest carbon stocks from afforestation/reforestation and forest restoration. The scale of
the proposed FRL is national level but results are also reported separately for the five zones (hill, sal, coastal,
village and sundarban) of the country, because the forest dynamics in these five zones are very different.
Emissions and removals associated with trees outside forest have been calculated but not accounted for the
construction of FRL, as trees outside the forests do not meet the criteria of the definition of forest. The
activity data are obtained from the national land cover maps of 2000 and 2015 and tree cover change map
of 2000-2014. The emission and removal factors associated with land use changes are calculated considering
the above-ground biomass stocks (Tier 2) per land class and percentage of tree cover in 2000 and 2015.
The estimated emission of Bangladesh is 1,188,971 tCO2e/year, and the estimated removal is -814,718
tCO2e/year. The net change, FRL, is 374,253 tCO2e/year. Emissions from deforestation and forest
degradation account for 69% (819,854 tCO2e/year) and 31% (369,117 tCO2e/year) respectively of total
emissions. Removals of forest carbon stocks from forest restoration and afforestation/reforestation account
for 51% (-411,623 tCO2e/year) and 49% (-403,095 tCO2e/year) respectively of total removals. Removals from
trees outside forest estimated at -476,084 tCO2e/year for the reference period 2000-2015. However, the
contribution of trees outside forest were not considered for the construction of FRL.
13 | P a g e
Acronyms and Abbreviations
BCCSAP Bangladesh Climate Change Strategy and Action Plan
BFD Bangladesh Forest Department
CHT Chittagong Hill Tracts
COP Conference of parties
FAO Food and Agriculture Organization of the United Nations
FREL Forest emission reference level
FRL Forest reference level
GHG Greenhouse gas
GLAD Global Land Analysis and Discovery
GoB Government of Bangladesh
IPCC Intergovernmental Panel on Climate Change
ISO Inter National Organization for Standardization
LCCS Land Cover Classification System
LCML Land Cover Meta Language
LULUCF Land use, land use change and forestry
MoEF Ministry of Environment and Forests
NDC Nationally determined contribution
LRS Land Representation System
OBIA Object-Based Image Analysis
RIMS Resources Information Management System
R-PP REDD+ Readiness Preparation Proposal
RSC REDD+ Steering Committee
UNFCCC United Nations Framework Convention on Climate Change
USF Unclassified State Forest

14 | P a g e
1. Introduction
Bangladesh, as a signatory country to the United Nations Framework Convention on Climate Change
(UNFCCC) (ratified in 1994), is voluntarily submitting the National Forest Reference Emission Level/ Forest
Reference Level (FRL) based on the decision 1/CP.16, paragraph 71(b), and measures mentioned in
paragraph 70 of the same decision (UNFCCC 2011). The country welcomes the opportunity to avail the
technical assessment of the FRL in accordance with the guidelines and procedures adopted under Decision
13/CP.19 (UNFCCC 2014), in the context of results-based payment for reducing emissions from deforestation
and forest degradation and the role of conservation, sustainable management of forests and enhancement
of forest carbon stocks in developing countries (REDD+).
As one of the most vulnerable countries to climate change induced natural disasters, Bangladesh is fully
aware of the causes of climate change (MoEFCC 2009). According to Bangladesh’s Second National
Communication on greenhouse gas (GHG) inventory to UNFCCC, submitted in 2012, the Land-use, Land-use
Change and Forestry (LULUCF) sector was the second biggest contributor to CO2 emissions in the country
after the energy sector. The former sector contributed to about 31% of total CO2 emissions while the latter
sector contributed 64% of the total national emissions (MoEFCC 2012). Although no precise estimate is
available, the LULUCF sector is thought to remain one of the biggest contributors to GHG emissions in the
country. Consequently, reducing emissions from the LULUCF sector has become a priority to the
Government of Bangladesh (GoB). Indeed, as a long-term strategy of GoB to reduce GHG emissions from
LULUCF sector, the National REDD+ Steering Committee (RSC) was formed in July 2011. The REDD+
Readiness Roadmap was prepared and endorsed by the RSC in December 2012. Subsequently, in June 2013,
the UN-REDD Programme invited Bangladesh to submit a REDD+ Readiness Preparation Proposal (R-PP),
based on which the government is implementing UN-REDD Bangladesh National Programme since 2015. The
goal of the National Programme is to support GoB to initiate the implementation of its REDD+ Readiness
Roadmap by establishing necessary management processes, identifying strategic readiness options, and
developing the capacities required to begin implementation of REDD+ activities. Hence, as a part of the
National REDD+ Readiness Roadmap, the country has developed the FRL for submission to the UNFCCC.
The overarching objective of this voluntary submission of the FRL report is to facilitate the receipt of results-
based payments, as per Decisions 9/CP.19, 13/CP.19 and 14/CP.19 (UNFCCC 2014). This submission
therefore does not represent any commitment under the Nationally Determined Contribution (NDC) of
Bangladesh. Rather, the preparation and development of national FRL will enhance the documentation and
monitoring of forest resources, which will eventually strengthen capacity of Bangladesh Forest Department
(BFD) on management information focusing on current status of forest resources and stored carbon in the
forests, as well as vulnerable land-use zones. Hence, this document will facilitate natural resources
management planning in future and be able to provide better concept and tools for forest monitoring and
governance.
The document is structured in such a way that it includes all necessary components of FRL in a logical order.
The next section (section 2) explains the national context of Bangladesh in terms of forest governance and
management as well as forest resources. Section 3 starts with definition of forests used for, and then
specifies the pools and gasses, and REDD+ activities included in as well as the scale of constructing the FRL
with appropriate justifications. The following section (section 4) presents the activity data (i.e. land and tree
cover maps), emission factors, reference period and methodology used for FRL. The proposed national FRL
is presented in section 5. The uncertainty and national circumstances related to REDD+ activities and
15 | P a g e
transparency of data and process used for constructing FRL are explained in the following three sections
(Section 6 - 8), before future improvement opportunities are identified in the final section (section 9).
2. National Context
2.1 Forest resources in Bangladesh
In Bangladesh, ‘forest land’ is defined as a government-owned land. The legal entity and governance of
‘forest land’ is established through gazette notifications under the Forest Act of 1927 (amended up to 2000)
and other forest related acts, ordinances, regulations and policies (Mohammad 2013, Rashid, Craig et al.
2013). Some of the prevailing acts, ordinances, regulations and policies are:
• Wildlife (Conservation and Preservation) Act 2012
• Biodiversity Act 2017
• Social Forestry Rules 2004 (amended up to 2011)
• Forest Transit (control) rules 2011
• Environmental Conservation Rules 1997 (amended up to 2017)
• Environmental Conservation Act 1995 (amended up to 2002)
• National Forest Policy 1994
• Forestry Master Plan 1994
• Atia Forest Ordinance 1982
• Private Forest Ordinance 1959
• State Acquisition and Tenancy Act 1950
• Assam Forest Regulations 1891 and
• National Environmental Management Action Plan (NEMAP) 1995.
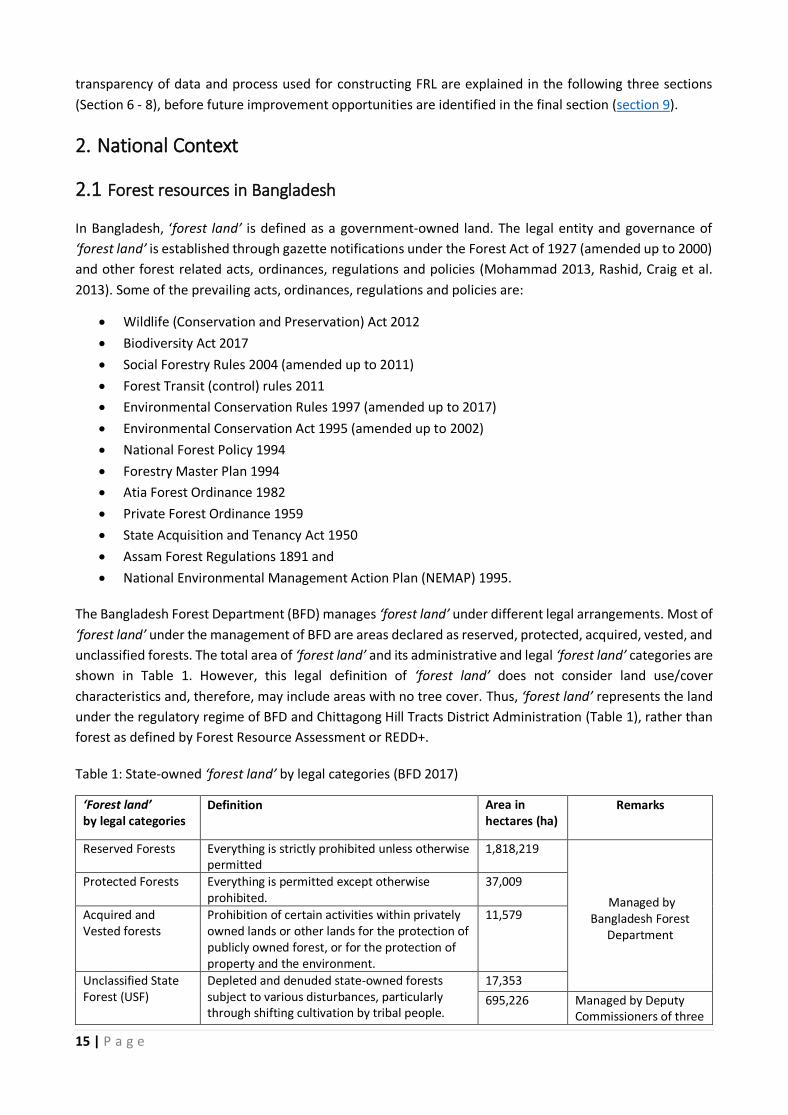
The Bangladesh Forest Department (BFD) manages ‘forest land’ under different legal arrangements. Most of
‘forest land’ under the management of BFD are areas declared as reserved, protected, acquired, vested, and
unclassified forests. The total area of ‘forest land’ and its administrative and legal ‘forest land’ categories are
shown in Table 1. However, this legal definition of ‘forest land’ does not consider land use/cover
characteristics and, therefore, may include areas with no tree cover. Thus, ‘forest land’ represents the land
under the regulatory regime of BFD and Chittagong Hill Tracts District Administration (Table 1), rather than
forest as defined by Forest Resource Assessment or REDD+.
Table 1: State-owned ‘forest land’ by legal categories (BFD 2017)
‘Forest land’ by legal categories
Definition Area in hectares (ha)
Remarks
Reserved Forests Everything is strictly prohibited unless otherwise permitted
1,818,219
Managed by Bangladesh Forest
Department
Protected Forests Everything is permitted except otherwise prohibited.
37,009
Acquired and Vested forests
Prohibition of certain activities within privately owned lands or other lands for the protection of publicly owned forest, or for the protection of property and the environment.
11,579
Unclassified State Forest (USF)
Depleted and denuded state-owned forests subject to various disturbances, particularly through shifting cultivation by tribal people.
17,353
695,226 Managed by Deputy Commissioners of three
16 | P a g e
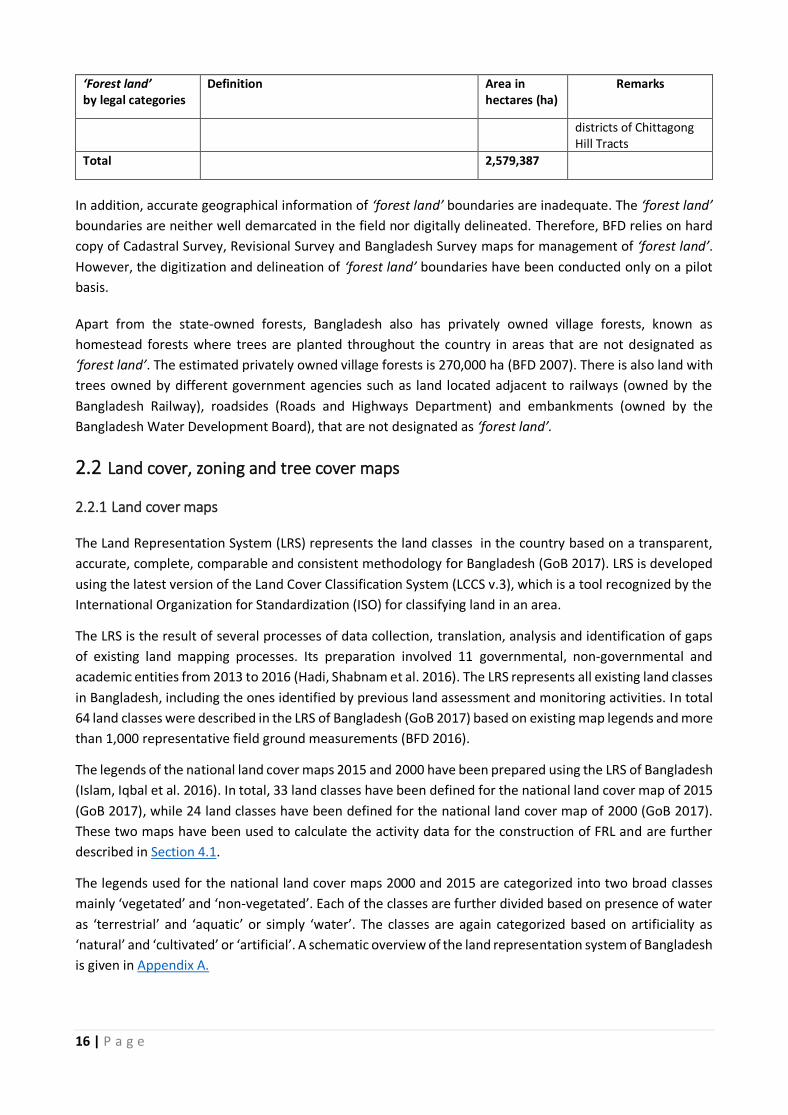
‘Forest land’ by legal categories
Definition Area in hectares (ha)
Remarks
districts of Chittagong Hill Tracts
Total 2,579,387
In addition, accurate geographical information of ‘forest land’ boundaries are inadequate. The ‘forest land’
boundaries are neither well demarcated in the field nor digitally delineated. Therefore, BFD relies on hard
copy of Cadastral Survey, Revisional Survey and Bangladesh Survey maps for management of ‘forest land’.
However, the digitization and delineation of ‘forest land’ boundaries have been conducted only on a pilot
basis.
Apart from the state-owned forests, Bangladesh also has privately owned village forests, known as
homestead forests where trees are planted throughout the country in areas that are not designated as
‘forest land’. The estimated privately owned village forests is 270,000 ha (BFD 2007). There is also land with
trees owned by different government agencies such as land located adjacent to railways (owned by the
Bangladesh Railway), roadsides (Roads and Highways Department) and embankments (owned by the
Bangladesh Water Development Board), that are not designated as ‘forest land’.
2.2 Land cover, zoning and tree cover maps
2.2.1 Land cover maps
The Land Representation System (LRS) represents the land classes in the country based on a transparent,
accurate, complete, comparable and consistent methodology for Bangladesh (GoB 2017). LRS is developed
using the latest version of the Land Cover Classification System (LCCS v.3), which is a tool recognized by the
International Organization for Standardization (ISO) for classifying land in an area.
The LRS is the result of several processes of data collection, translation, analysis and identification of gaps
of existing land mapping processes. Its preparation involved 11 governmental, non-governmental and
academic entities from 2013 to 2016 (Hadi, Shabnam et al. 2016). The LRS represents all existing land classes
in Bangladesh, including the ones identified by previous land assessment and monitoring activities. In total
64 land classes were described in the LRS of Bangladesh (GoB 2017) based on existing map legends and more
than 1,000 representative field ground measurements (BFD 2016).
The legends of the national land cover maps 2015 and 2000 have been prepared using the LRS of Bangladesh
(Islam, Iqbal et al. 2016). In total, 33 land classes have been defined for the national land cover map of 2015
(GoB 2017), while 24 land classes have been defined for the national land cover map of 2000 (GoB 2017).
These two maps have been used to calculate the activity data for the construction of FRL and are further
described in Section 4.1.
The legends used for the national land cover maps 2000 and 2015 are categorized into two broad classes
mainly ‘vegetated’ and ‘non-vegetated’. Each of the classes are further divided based on presence of water
as ‘terrestrial’ and ‘aquatic’ or simply ‘water’. The classes are again categorized based on artificiality as
‘natural’ and ‘cultivated’ or ‘artificial’. A schematic overview of the land representation system of Bangladesh
is given in Appendix A.
17 | P a g e
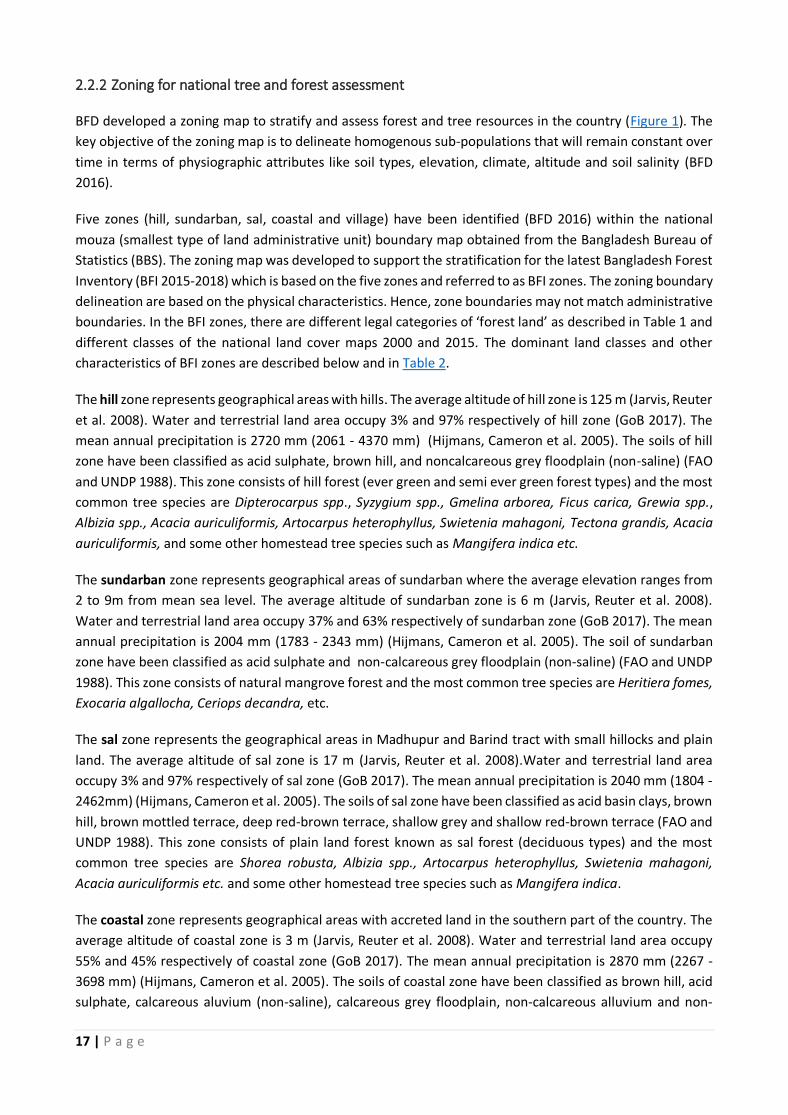
2.2.2 Zoning for national tree and forest assessment
BFD developed a zoning map to stratify and assess forest and tree resources in the country (Figure 1). The
key objective of the zoning map is to delineate homogenous sub-populations that will remain constant over
time in terms of physiographic attributes like soil types, elevation, climate, altitude and soil salinity (BFD
2016).
Five zones (hill, sundarban, sal, coastal and village) have been identified (BFD 2016) within the national
mouza (smallest type of land administrative unit) boundary map obtained from the Bangladesh Bureau of
Statistics (BBS). The zoning map was developed to support the stratification for the latest Bangladesh Forest
Inventory (BFI 2015-2018) which is based on the five zones and referred to as BFI zones. The zoning boundary
delineation are based on the physical characteristics. Hence, zone boundaries may not match administrative
boundaries. In the BFI zones, there are different legal categories of ‘forest land’ as described in Table 1 and
different classes of the national land cover maps 2000 and 2015. The dominant land classes and other
characteristics of BFI zones are described below and in Table 2.
The hill zone represents geographical areas with hills. The average altitude of hill zone is 125 m (Jarvis, Reuter
et al. 2008). Water and terrestrial land area occupy 3% and 97% respectively of hill zone (GoB 2017). The
mean annual precipitation is 2720 mm (2061 - 4370 mm) (Hijmans, Cameron et al. 2005). The soils of hill
zone have been classified as acid sulphate, brown hill, and noncalcareous grey floodplain (non-saline) (FAO
and UNDP 1988). This zone consists of hill forest (ever green and semi ever green forest types) and the most
common tree species are Dipterocarpus spp., Syzygium spp., Gmelina arborea, Ficus carica, Grewia spp.,
Albizia spp., Acacia auriculiformis, Artocarpus heterophyllus, Swietenia mahagoni, Tectona grandis, Acacia
auriculiformis, and some other homestead tree species such as Mangifera indica etc.
The sundarban zone represents geographical areas of sundarban where the average elevation ranges from
2 to 9m from mean sea level. The average altitude of sundarban zone is 6 m (Jarvis, Reuter et al. 2008).
Water and terrestrial land area occupy 37% and 63% respectively of sundarban zone (GoB 2017). The mean
annual precipitation is 2004 mm (1783 - 2343 mm) (Hijmans, Cameron et al. 2005). The soil of sundarban
zone have been classified as acid sulphate and non-calcareous grey floodplain (non-saline) (FAO and UNDP
1988). This zone consists of natural mangrove forest and the most common tree species are Heritiera fomes,
Exocaria algallocha, Ceriops decandra, etc.
The sal zone represents the geographical areas in Madhupur and Barind tract with small hillocks and plain
land. The average altitude of sal zone is 17 m (Jarvis, Reuter et al. 2008).Water and terrestrial land area
occupy 3% and 97% respectively of sal zone (GoB 2017). The mean annual precipitation is 2040 mm (1804 -
2462mm) (Hijmans, Cameron et al. 2005). The soils of sal zone have been classified as acid basin clays, brown
hill, brown mottled terrace, deep red-brown terrace, shallow grey and shallow red-brown terrace (FAO and
UNDP 1988). This zone consists of plain land forest known as sal forest (deciduous types) and the most
common tree species are Shorea robusta, Albizia spp., Artocarpus heterophyllus, Swietenia mahagoni,
Acacia auriculiformis etc. and some other homestead tree species such as Mangifera indica.
The coastal zone represents geographical areas with accreted land in the southern part of the country. The
average altitude of coastal zone is 3 m (Jarvis, Reuter et al. 2008). Water and terrestrial land area occupy
55% and 45% respectively of coastal zone (GoB 2017). The mean annual precipitation is 2870 mm (2267 -
3698 mm) (Hijmans, Cameron et al. 2005). The soils of coastal zone have been classified as brown hill, acid
sulphate, calcareous aluvium (non-saline), calcareous grey floodplain, non-calcareous alluvium and non-

18 | P a g e
calcareous grey floodplain (FAO and UNDP 1988). The most common tree species in the coastal zone are
Sonneratia apetala, Avicennia officinalis, Excoecaria agallocha, Areca catechu and other homestead tree
species such as Artocarpus heterophyllus, Samanea saman, Azadirachta indica, Mangifera indica etc.
The village zone covers the rest of the area not occupied by hill, sundarban, sal and coastal zone. The average
altitude of village zone is 16m (Jarvis, Reuter et al. 2008). Water and terrestrial land area occupy 8% and 92%
respectively of village zone (GoB 2017). The mean annual precipitation is 1600 mm (Hijmans, Cameron et al.
2005). The soils of village zone have been classified as acid basin clays, brown hill, calcareous alluvium (non-
saline), calcareous brown floodplain, calcareous dark grey floodplain, deep grey terrace, grey piedmont, non-
calcareous alluvium, non-calcareous brown floodplain, non-calcareous dark grey floodplain, non-calcareous
grey floodplain (non-saline), and shallow Grey Terrace (FAO and UNDP 1988). The most common tree species
of village zone are Swietenia mahagoni, Areca catechu, Mangifera indica, Acacia auriculiformis, Samanea
saman, Eucalyptus camaldulensis, etc.
Figure 1: Zoning for national tree and forest assessment under the Bangladesh forest inventory (BFD 2016).
19 | P a g e
Table 2: Description and major characteristics of Bangladesh forest inventory (BFI) zones (BFD 2016).
BFI zones
Districts Geographic characteristics
Dominant land classes per BFI zone
Area* (in hectares)
Accessibility (%): Hard to reach (HTR)
Number of Households (BBS, 2015)
Hill Bandarban, Chattogram, Cox's Bazar, Habiganj, Khagrachhari, Maulvibazar, Rangamati, Sylhet
Terrestrial land: 97%; Water: 3 %
• Forest Tree Dominated Area (Terrestrial): 727, 004 ha;
• Shrubs with scattered trees: 691,921 ha
1,716,157 Extreme HTR: 51.60 Very HTR: 15.46
3,574,726
Sundarban Bagerhat, Khulna, Satkhira Terrestrial land: 63%; Water: 37%
• Mangrove Forest: 399,725ha Rivers and Khals: 228,201ha
631,386 Extreme HTR: 33.87 Very HTR: 0.04
1,354,487
Sal Brahamanbaria, Kumilla, Dhaka Dinajpur, Gazipur, Habiganj Jamalpur, Mymensingh, Narayanganj, Narsingdi, Sherpur, Tangail
Terrestrial land: 97%; Water: 3%
• Herbaceous Crops: 221,946ha
• Rural Settlement: 159,188 ha
534,433 Extreme HTR: 12.01, Moderate HTR: 1.26 Very HTR: 6.26
10,127,177
Coastal Barguna, Bhola, Chattogram, Cox's Bazar, Feni, Lakshmipur, Noakhali, Patuakhali
Terrestrial land: 45%; Water: 55%
• Rivers and Khals: 478,751ha
• Herbaceous Crops: 229,353 ha,
991,051 Extreme HTR: 24.31 Very HTR: 1.42
2,148,757**
Village
Rest of districts Terrestrial land: 92%; Water: 8 %
• Herbaceous Crops: 6,591,982ha
• Rural Settlement: 2,763,442ha
10,883,974 Extreme HTR: 13.07 Very HTR: 12.10 Moderate HTR: 0.52
14,500,537
National 64 districts Terrestrial land: 88% Water: 12%
• Herbaceous Crops 7,170,870 ha
• Rural Settlement: 3,124,434 ha
14,757,000 Extreme HTR: 19.5 Moderate HTR: 0.43 Very HTR: 11.13
31,705,684
* The total land area of Bangladesh which was obtained from the intersection of national land cover maps of 2015 with 2000 was estimated at 14768227 hectares. However, the Bangladesh Bureau of Statistics (BBS) reports that the total land area of the country is 14,757,000 hectares (BBS 2017). Therefore, the map areas were multiplied by the factor 14757000 / 14768227 (0.99923978687489) to adjust with the country area reported by the BBS. ** The number of households excludes the same for Chattagram and Cox’s Bazaar to avoid double counting, as these two districts fall in both hill and coastal zones.
.

20 | P a g e
2.2.3 Tree cover maps
In 2016, the Resources Information Management System (RIMS) unit of the BFD in collaboration with the
Global Land Analysis and Discovery (GLAD) Laboratory of the University of Maryland published the tree cover
change map of the country over the period of 2000 to 2014 (Potapov, Siddiqui et al. 2017). The tree cover
mapping and monitoring system is based on the integrated use of wall-to-wall Landsat-based mapping and
sample-based area estimation using freely available high spatial resolution imagery and Landsat time-series
data.
A two-stage method for national tree cover monitoring was established. At the first stage, wall-to-wall
Landsat-based tree cover extent and change maps were created. These maps served to stratify the whole
country for the implementation of a stratified random sampling protocol (Potapov, Siddiqui et al. 2017). The
second stage of the analysis consisted of characterizing tree cover area and change based on samples of
multi-resolution time-series data. Stratified random sampling design was used based on Landsat-derived
wall-to-wall maps as sampling strata. A set of 1486 samples consisting of 30 x 30 m Landsat pixels was visually
interpreted to estimate fractional (% of pixel area) tree canopy cover and canopy loss and gain. Accuracy
assessment of the tree cover maps were conducted (Potapov, Siddiqui et al. 2017). Though very useful to
understand the tree cover gains and losses, the tree cover maps do not provide information on the forest or
non-forest status of land. Since, these maps provide information on presence of trees, this information can
be used within the land classes to detect gains or losses of trees, and therefore emissions or removals of CO2.
2.3 Trees outside forest
Due to land scarcity and rapid population growth, expanding designated ‘forest land’ is extremely difficult in
Bangladesh. In this context, BFD is trying to increase the tree cover outside ‘forest land’ through encouraging
tree plantations in homestead and participatory approaches like social forestry on embankments in the
coastal area, road side plantations, and other forestry activities (Appendix B). As a result of these activities,
over the period of 2000 to 2014 total tree canopy cover increased by 135,700 ha, and most of the tree cover
gain was found within trees outside forest areas located in the boundaries between woodlots and croplands,
near houses, and along roads (Potapov, Siddiqui et al. 2017).
In Bangladesh, trees outside forest play a key role in rural livelihoods. More than 70% of fuelwood, 80% of
bamboo and more than half of national wood production comes from homestead forests (Islam 2004).
Hence, the role of trees outside forest is important because they directly reduce the pressure on the
designated forests of the country by supplying additional forests resources. Trees outside forest also
contribute to households income and are important for water purification, biodiversity conservation and land
restoration (Islam 2004). For these reasons, carbon sequestration in trees outside forest has been assessed
and is presented in this report. However, the emissions and removals associated with trees outside forest
are not accounted for the construction of FRL, as they do not meet the definition of forest described in
Section 3.1
2.4 Forest trends and government strategic plans in Bangladesh
Despite the tree cover gain in the country, 2,600 ha of forest lost annually over the period of 1990 to 2015
(FAO 2015). A study on the direct and indirect drivers of deforestation and forest degradation has been
conducted and is based on data collected from a literature review and workshops carried out in BFD districts
(BFD 2018). The results from this study showed that the key drivers of deforestation and forest degradation
are common across the country and include illegal harvesting of forests, fuelwood harvesting, subsistence
21 | P a g e
and commercial agriculture (including shifting cultivation in hill forests), and encroachment by industry
and/or settlements (BFD 2018). The insufficient demarcation of boundaries of ‘forestland’ has further worsen
the situation. In addition, between 1971 and 2015 more than 64,000 ha of ‘forestland’ has been transferred
to other agencies for non-forest purposes (BFD 2018). While most drivers are common to all forest types,
there are some drivers that are specific to each forest type.
More specifically, in Hill forests, apart from illegal and excessive wood and fuelwood harvest other drivers of
deforestation include jhum agriculture (shifting cultivation practiced by ethnic groups) and commercial
agriculture such as horticulture, tobacco and root crops. Tobacco farming is spreading in Hill forests with an
increased demand for fuelwood for leaf curing. In addition, anthropogenic fires (to support agricultural
activities) and encroachment drive deforestation in Hill forests. The key drivers of degradation in addition to
illegal felling and fuelwood collection are shifting cultivation, cattle-grazing and betel vine cultivation (BFD
2018).
In Sal forests, the main key drivers of deforestation are encroachment by industry and settlements,
agricultural conversion (both commercial and subsistence), illegal and excessive harvesting, industrial use of
fuelwood and infrastructure (e.g. roads). Degradation is largely and directly driven by illegal and excessive
harvesting, fuelwood collection and encroachment (BFD 2018).
In Coastal forests, the direct drivers of deforestation include: illegal and excessive harvesting, shrimp farming,
agriculture, infrastructure development (e.g. roads), fuelwood collection and natural disturbances (e.g.
cyclones) (BFD 2018). The direct drivers of degradation include illegal and excessive harvesting, fuelwood
harvesting and natural disturbances (BFD 2018).
In Sundarban, there is no deforestation due to anthropogenic causes. The key drivers of degradation are
fuelwood harvesting, illegal harvesting, increasing salinity (which is related to canopy thinning through
disease), reduced freshwater flows as result of water diversions, and natural disturbances (e.g. cyclones)
(BFD 2018).
To reduce deforestation and degradation and address the direct and indirect drivers, several programs and
strategies are being targeted at the national scale (Table 3). Furthermore, the national strategy for REDD+
where the key drivers of deforestation and forest degradation will be addressed is being designed. Up to this
point, the policies and measures (PAMS) have been identified.
Through social forestry, coastal afforestation and reforestation programs of BFD, 84,378 ha and 68,830 km
plantations have been raised from 1981-1982 to 2016-2017. These activities are taking place in forests and
‘forest lands’. The percent of protected area in Bangladesh has also increased from 1.81% (2013-14) to 4.19%
in 2017 with the aim to reach 5% by 2020 (MoEFCC 2009, GED 2015). According to the 7th Five-Year Plan
(2016-2020), the country aims to increase forest cover to 15% by 2020, which is consistent with the relevant
targets of sustainable development goal (SDG), and the Environment Forestry and Climate Change Country
Investment Plan (GoB 2017). Moreover, afforestation and reforestation in the coastal areas, islands and
degraded areas are mentioned as climate change mitigation strategies and actions in the Bangladesh Climate
Change Strategy and Action Plan (BCCSAP) (MoEFCC 2009, GED 2015). A brief description of activities
undertaken by BFD to address the drivers of deforestation and forest degradation is in Appendix B.
22 | P a g e
Table 3: Potential deforestation and forest degradation reduction strategies in the recent national strategic
plans and government policy document of Bangladesh.
Objectives Examples National targets by 2020
Deforestation
reduction
• Conserve and increase the forests and tree cover a
• Declaration and protection of reserved forests b
• Continuation of the prohibition of the use of fuel
wood in brick fields, and promotion of efficient
use of energy like use of improved cooking stove
• Co-management approach to safeguard the forest
biodiversity c
• Increase of protected area from
1.81% (2013-14) to 5%b by 2020.
Reforestation/
Afforestation
• Continuation of coastal mangrove plantation
• Plantation in the island areas of Bangladesh
• Continuation of Social and Homestead forestry a, d
• Intensification of plantation in coastal zone b, d
• 50,000 ha, 5,000 ha, 30,000 ha,
5,000 ha of land will be planted
over the period of 2016 to 2020 in
the hill forest, plain land forest,
coastal areas, and reed lands of
Sylhet region respectively.
• Approximately, 20,000 km. of strip
plantations will be established by
2020b.
Forest
restoration
• Reforestation and afforestation in the reserved forests a
• Increase productive forest coverage • Increase tree density of the existing forests and
older plantations through ‘enrichment planting’ and ‘assisted natural regeneration’ b
• Scattered and denuded hill forests will be replanted to increase productivity c
• Increase of forest coverage from
13.20% (2013-14) to 15% b by 2020.
Source: a(MoEFCC 2015), b(GED 2015), c(GED 2013), d(MoEFCC 2009)
3. Elements of forest reference level/forest reference emission level
3.1 Forest definition
When Bangladesh reporting to FAO FRA (FAO 2015) and to the UNFCCC (MoEFCC 2012), it follows the
following forest definition: “Land spanning more than 0.5 hectares with trees higher than 5 meters and a
canopy cover of more than 10 percent, or trees able to reach these thresholds in situ. It does not include land
that is predominantly under agricultural or urban land use”.
However, some vegetation types such as mangroves dominated by Ceriops decandra (local name: Goran) can
hardly reach 2-2.5 meters height, but are considered as forests located in the Sundarban. The forest area
covered by Ceriops decandra and other tree species is 24% of the Sundarban area (Rahman, Khan et al. 2015).
Therefore, the forest definition used for the construction of FRL was adapted to include the forests area
dominated by Ceriops decandra, and is as follows:
“Land spanning more than 0.5 hectares with trees higher than 5 meters (exception for Ceriops decandra
with height of 2 meters) and a canopy cover of more than 10 percent (%), or trees able to reach these
thresholds in situ. It does not include land that is predominantly under rural settlement, agricultural or urban
land use; trees within such areas are considered as non-forest trees.”
23 | P a g e
3.2 Pools and greenhouse gases (GHGs)
Carbon pools
The carbon pools considered are above-ground and below-ground biomass. Field data on above-ground
biomass are collected through harmonizing the sub-national forest inventories conducted from 1997 to 2014
(Sola, Costello et al. 2016). The below-ground biomass pool is estimated using the default below-ground
biomass to above-ground biomass ratio (R) obtained from 2006 IPCC Guidelines.
Carbon in deadwood, litter and soils are excluded from the construction of FRL due to lack of data in these
pools at the national scale. Additionally, data available for deadwood, litter and soils in protected areas
indicate they are relatively low in carbon compared to above- and below-ground biomass having 0.86 Mg/ha
(0.4% of the total), 6.7 Mg/ha (3%) and 31 Mg/ha (13%) respectively (Latif, Chowdhury et al. 2015). Changes
in these pools are also likely to be modest compared to above-ground biomass pool. Nonetheless, field data
on soil, deadwood and litter are currently being collected through the ongoing forest inventory of Bangladesh
(BFI), and will be considered in future submissions.
Greenhouse gases
CO2 is the only greenhouse gas (GHG) included for the construction of FRL due to lack of national data for
other gases.
Methane (CH4) is emitted from clearance and conversion of peat land as well as extraction of peat (Brown,
Humphreys et al. 2014). In Bangladesh, peatland occupies 1.6 % of the total land area and more importantly,
peat is not extracted in the country (Masud, Moniruzzaman et al. 2011, MoEFCC 2016). Hence, CH4 emissions
from peat land are not considered for this submission.
Other non-CO2 GHGs are emitted from forest fires (IPCC 2006). The Bangladesh - Global Forest Resources
Assessment (FRA) – Country Report (2015) suggests that on average 16,473 ha of forest were burnt annually
from 2003 to 2012 (FAO 2015). However, there is no other national document that can verify the FRA (2015)
data. The FRA (2015) data are based on the Moderate Resolution Imaging Spectroradiometer (MODIS) pixels,
which are prone to systematic over-or underestimation because of the MODIS pixel size limitation to
detecting truly fine- scale change. In addition, the MODIS definition of woody vegetation includes areas that
are not forest as per the FAO forest definition (van Lierop, Lindquist et al. 2015). The forest area burned data
is not representative of the country context based on the forest definition.
Moreover, the area reported in the FRA report mainly covered the shifting cultivation that occurs in the
Chittagong Hill Tracts (CHT). Most of the hills in CHT, where shifting cultivation is being practiced are
denuded and covered by herbs and small shrubs. The fire which occurs in CHT cannot be characterized as
forest fire, rather ground fire used for shifting cultivation. In Bangladesh, it is difficult to distinguish between
natural and anthropogenic forest fires and obtain accurate data on forests affected by shifting cultivation.
For these reasons, non-CO2 emissions from forest fires are not included in this FRL submission.
3.3 REDD+ activities
3.3.1 Included REDD+ activities
The proposed FRL includes the following REDD+ activities defined below.
24 | P a g e
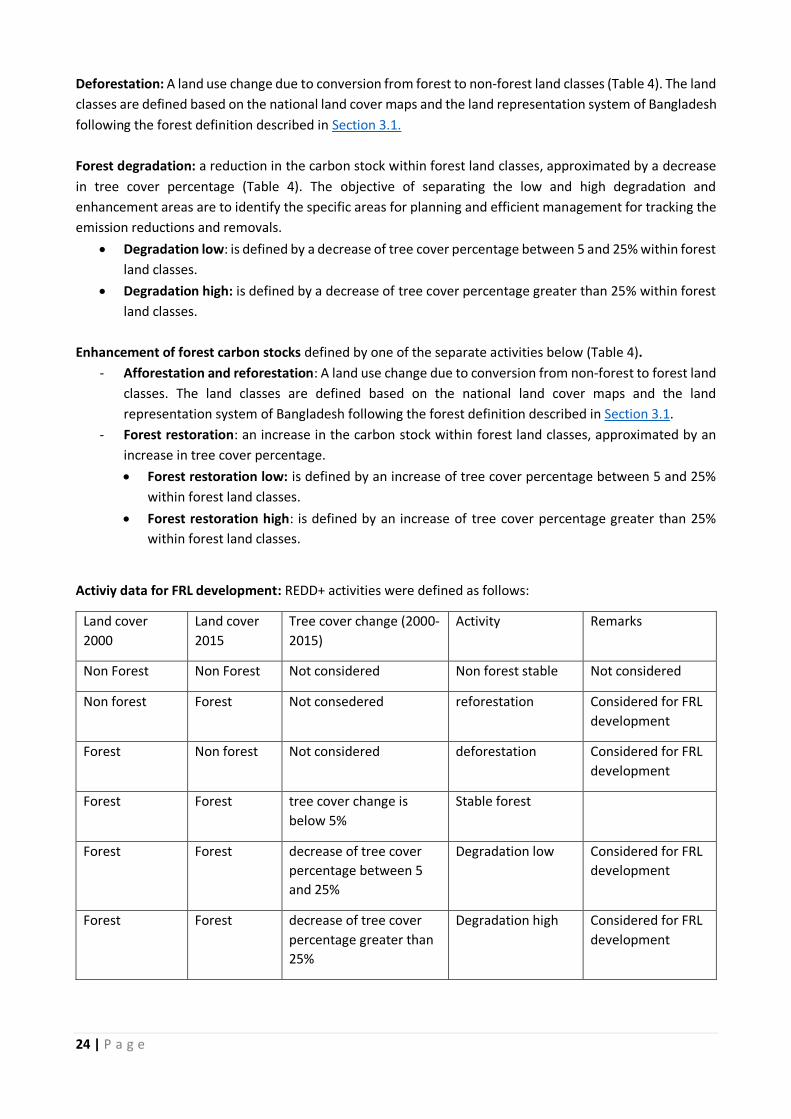
Deforestation: A land use change due to conversion from forest to non-forest land classes (Table 4). The land
classes are defined based on the national land cover maps and the land representation system of Bangladesh
following the forest definition described in Section 3.1.
Forest degradation: a reduction in the carbon stock within forest land classes, approximated by a decrease
in tree cover percentage (Table 4). The objective of separating the low and high degradation and
enhancement areas are to identify the specific areas for planning and efficient management for tracking the
emission reductions and removals.
• Degradation low: is defined by a decrease of tree cover percentage between 5 and 25% within forest
land classes.
• Degradation high: is defined by a decrease of tree cover percentage greater than 25% within forest
land classes.
Enhancement of forest carbon stocks defined by one of the separate activities below (Table 4).
- Afforestation and reforestation: A land use change due to conversion from non-forest to forest land
classes. The land classes are defined based on the national land cover maps and the land
representation system of Bangladesh following the forest definition described in Section 3.1.
- Forest restoration: an increase in the carbon stock within forest land classes, approximated by an
increase in tree cover percentage.
• Forest restoration low: is defined by an increase of tree cover percentage between 5 and 25%
within forest land classes.
• Forest restoration high: is defined by an increase of tree cover percentage greater than 25%
within forest land classes.
Activiy data for FRL development: REDD+ activities were defined as follows:
Land cover
2000
Land cover
2015
Tree cover change (2000-
2015)
Activity Remarks
Non Forest Non Forest Not considered Non forest stable Not considered
Non forest Forest Not consedered reforestation Considered for FRL
development
Forest Non forest Not considered deforestation Considered for FRL
development
Forest Forest tree cover change is
below 5%
Stable forest
Forest Forest decrease of tree cover
percentage between 5
and 25%
Degradation low Considered for FRL
development
Forest Forest decrease of tree cover
percentage greater than
25%
Degradation high Considered for FRL
development
25 | P a g e
Forest Forest increase of tree cover
percentage between 5
and 25%
Enhancement low Considered for FRL
development
Forest Forest increase of tree cover
percentage greater than
25%
Enhancement high Considered for FRL
development
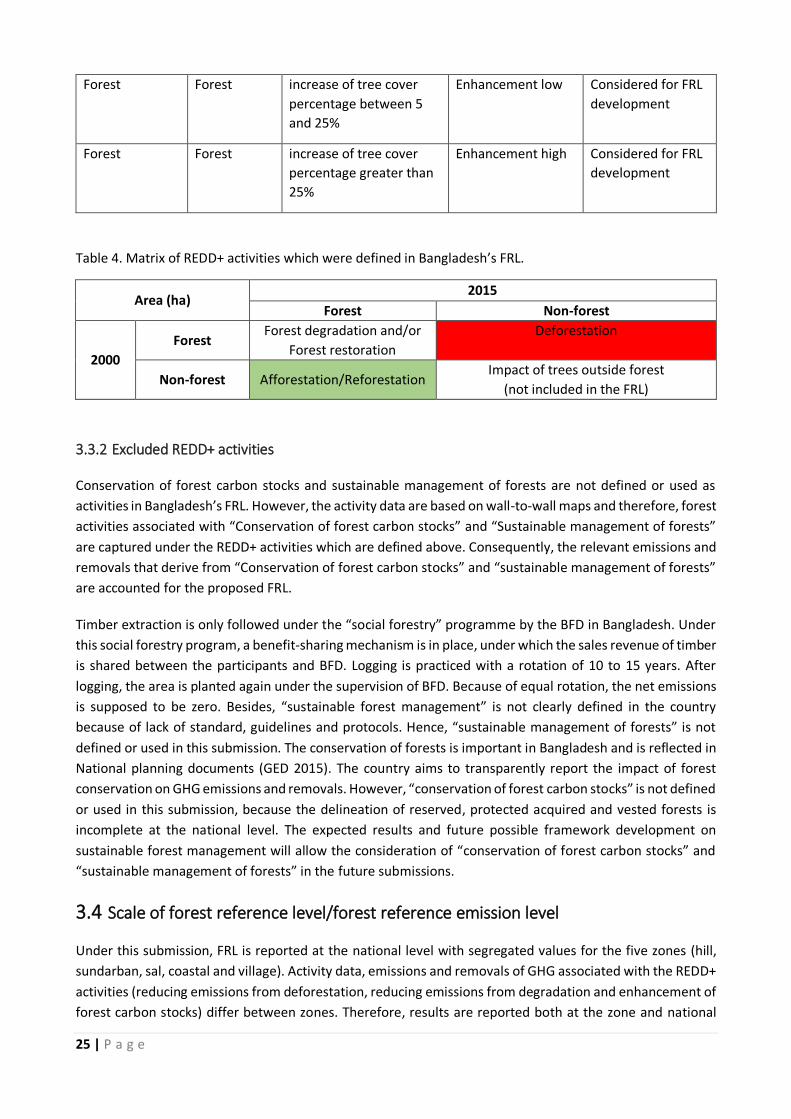
Table 4. Matrix of REDD+ activities which were defined in Bangladesh’s FRL.
Area (ha) 2015
Forest Non-forest
2000
Forest Forest degradation and/or
Forest restoration
Deforestation
Non-forest Afforestation/Reforestation Impact of trees outside forest
(not included in the FRL)
3.3.2 Excluded REDD+ activities
Conservation of forest carbon stocks and sustainable management of forests are not defined or used as
activities in Bangladesh’s FRL. However, the activity data are based on wall-to-wall maps and therefore, forest
activities associated with “Conservation of forest carbon stocks” and “Sustainable management of forests”
are captured under the REDD+ activities which are defined above. Consequently, the relevant emissions and
removals that derive from “Conservation of forest carbon stocks” and “sustainable management of forests”
are accounted for the proposed FRL.
Timber extraction is only followed under the “social forestry” programme by the BFD in Bangladesh. Under
this social forestry program, a benefit-sharing mechanism is in place, under which the sales revenue of timber
is shared between the participants and BFD. Logging is practiced with a rotation of 10 to 15 years. After
logging, the area is planted again under the supervision of BFD. Because of equal rotation, the net emissions
is supposed to be zero. Besides, “sustainable forest management” is not clearly defined in the country
because of lack of standard, guidelines and protocols. Hence, “sustainable management of forests” is not
defined or used in this submission. The conservation of forests is important in Bangladesh and is reflected in
National planning documents (GED 2015). The country aims to transparently report the impact of forest
conservation on GHG emissions and removals. However, “conservation of forest carbon stocks” is not defined
or used in this submission, because the delineation of reserved, protected acquired and vested forests is
incomplete at the national level. The expected results and future possible framework development on
sustainable forest management will allow the consideration of “conservation of forest carbon stocks” and
“sustainable management of forests” in the future submissions.
3.4 Scale of forest reference level/forest reference emission level
Under this submission, FRL is reported at the national level with segregated values for the five zones (hill,
sundarban, sal, coastal and village). Activity data, emissions and removals of GHG associated with the REDD+
activities (reducing emissions from deforestation, reducing emissions from degradation and enhancement of
forest carbon stocks) differ between zones. Therefore, results are reported both at the zone and national

26 | P a g e
scale to increase transparency and improve understanding about how REDD+ sub-national and national
activities, impact forests in each zone.
4. Data and construction approach
4.1 Activity Data
The national land cover maps 2000 (GoB 2017) and 2015 (GoB 2017) are the only sources of spatial
information that give estimates of forest land area based on the forest definition as described in Section 3.1.
The area of forest land remaining as forest land, other land converted to forest land and forest land converted
to other land are calculated using the national land cover maps 2000 and 2015. While the maps are developed
using different methods because of the difference of satellite image availability, the same classification
system is used to describe the different land classes and ensure the consistency between the two maps
(Section 4.1.3). The National land cover map 2015 is presented first because it is based on very high-
resolution satellite images and was used, along with coarse resolution images to create the national land
cover map 2000.
4.1.1 National land cover map 2015
Multi-spectral ortho (Level 3) SPOT6/7 images of 6-meter spatial resolution with maximum 10% cloud
coverage are used for the whole country. To delineate some land classes with temporal variability (e.g., single
and multiple crops) Landsat 8 and Sentinel 2 images are used. Land cover mapping is done separately for
each of the 64 districts. For SPOT image classification, the Object-Based Image Analysis (OBIA) technique is
adopted to create polygons (i.e., image objects) defined by spectral, spatial, contextual, and hierarchical
properties. The multi resolution segmentation algorithm is used to develop image objects using the bands
green, red and NIR with equal weights as input layers. The image objects developed are used as the basic
unit of classification. Meaningful image segments were directly assigned with land cover code. Not-qualified
image segments were manually edited to correspond well to geo-objects in geometry before assigning
appropriate land cover code.
Quality checking is an integral part of the development of geospatial databases , and includes topology,
attribute, and consistency checks (Franceschini, Jalal et al. 2016). The accuracy assessment analysis is
designed using a pseudo-ground truth validation technique, with a stratified random sampling by district and
land class (Tasnim, Franceschini et al. 2017). Sample numbers for each of the land classes within a district are
chosen based on the district size and the relative occurrence (in terms of area) of the land class in the district.
The legend of the national land cover map 2015 has 33 land classes (Figure 2) out of which 9 are forest land
classes. All classes are harmonized with the classification system prepared for the national land cover map
2000 (Table 6, Table 7), which is less detailed because of the lower resolution of the images in 2000. The
methodology and the process for the preparation of the national land cover map 2015 is detailed and well
documented (Islam, Iqbal et al. 2016, GoB 2017, GoB 2017).
27 | P a g e
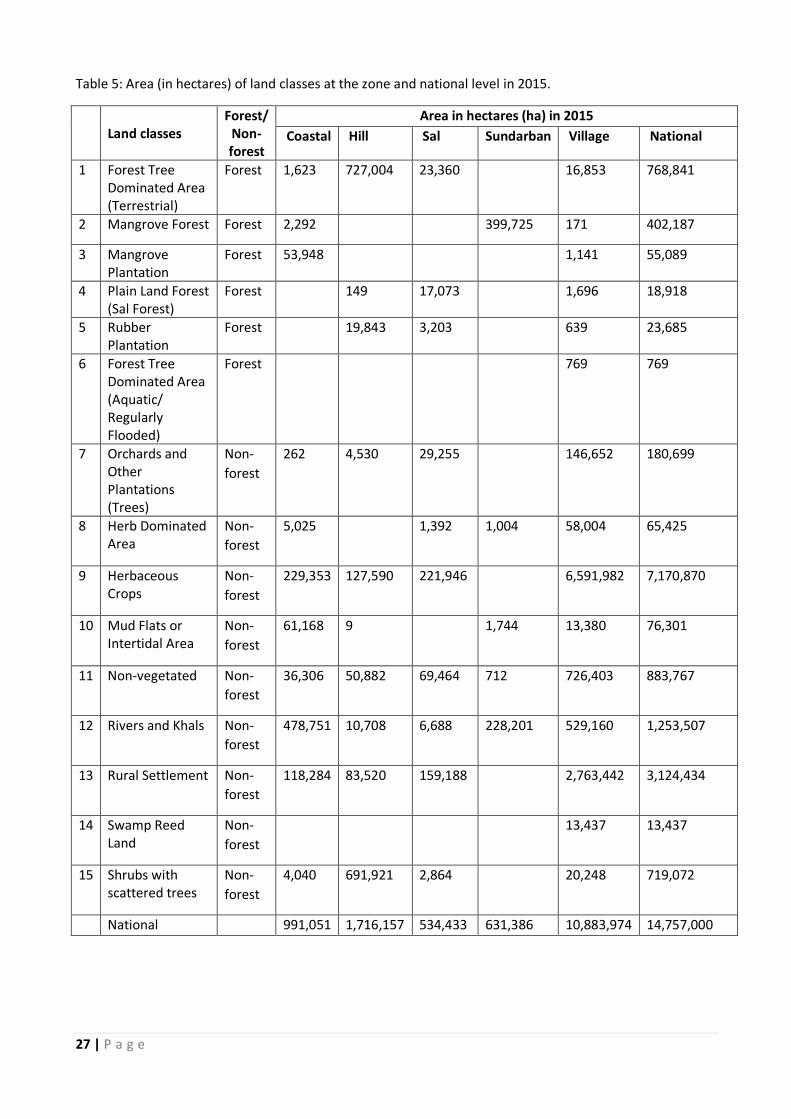
Table 5: Area (in hectares) of land classes at the zone and national level in 2015.
Land classes
Forest/ Non- forest
Area in hectares (ha) in 2015
Coastal Hill Sal Sundarban Village National
1 Forest Tree Dominated Area (Terrestrial)
Forest 1,623 727,004 23,360
16,853 768,841
2 Mangrove Forest Forest 2,292
399,725 171 402,187
3 Mangrove Plantation
Forest 53,948
1,141 55,089
4 Plain Land Forest (Sal Forest)
Forest
149 17,073
1,696 18,918
5 Rubber Plantation
Forest
19,843 3,203
639 23,685
6 Forest Tree Dominated Area (Aquatic/ Regularly Flooded)
Forest
769 769
7 Orchards and Other Plantations (Trees)
Non-
forest
262 4,530 29,255
146,652 180,699
8 Herb Dominated Area
Non-
forest
5,025
1,392 1,004 58,004 65,425
9 Herbaceous Crops
Non-
forest
229,353 127,590 221,946
6,591,982 7,170,870
10 Mud Flats or Intertidal Area
Non-
forest
61,168 9
1,744 13,380 76,301
11 Non-vegetated Non-
forest
36,306 50,882 69,464 712 726,403 883,767
12 Rivers and Khals Non-
forest
478,751 10,708 6,688 228,201 529,160 1,253,507
13 Rural Settlement Non-
forest
118,284 83,520 159,188
2,763,442 3,124,434
14 Swamp Reed Land
Non-
forest
13,437 13,437
15 Shrubs with scattered trees
Non-
forest
4,040 691,921 2,864
20,248 719,072
National 991,051 1,716,157 534,433 631,386 10,883,974 14,757,000
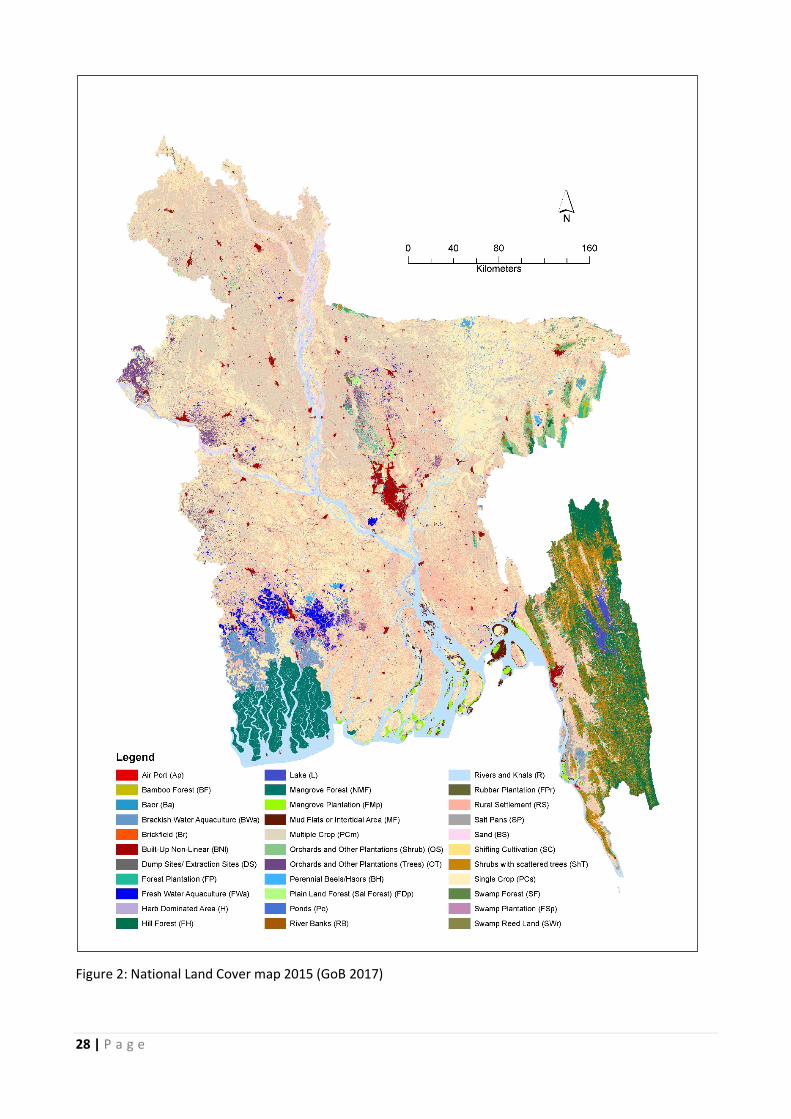
28 | P a g e
Figure 2: National Land Cover map 2015 (GoB 2017)
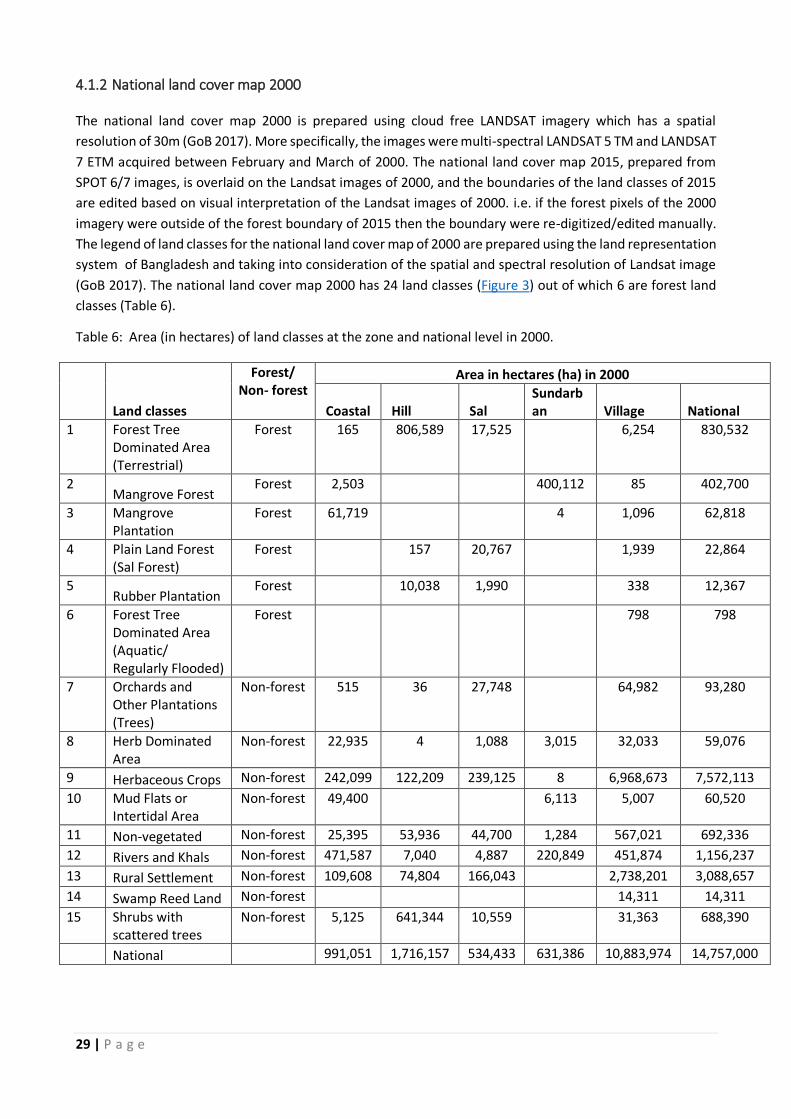
29 | P a g e
4.1.2 National land cover map 2000
The national land cover map 2000 is prepared using cloud free LANDSAT imagery which has a spatial
resolution of 30m (GoB 2017). More specifically, the images were multi-spectral LANDSAT 5 TM and LANDSAT
7 ETM acquired between February and March of 2000. The national land cover map 2015, prepared from
SPOT 6/7 images, is overlaid on the Landsat images of 2000, and the boundaries of the land classes of 2015
are edited based on visual interpretation of the Landsat images of 2000. i.e. if the forest pixels of the 2000
imagery were outside of the forest boundary of 2015 then the boundary were re-digitized/edited manually.
The legend of land classes for the national land cover map of 2000 are prepared using the land representation
system of Bangladesh and taking into consideration of the spatial and spectral resolution of Landsat image
(GoB 2017). The national land cover map 2000 has 24 land classes (Figure 3) out of which 6 are forest land
classes (Table 6).
Table 6: Area (in hectares) of land classes at the zone and national level in 2000.
Land classes
Forest/ Non- forest
Area in hectares (ha) in 2000
Coastal Hill Sal Sundarban Village National
1 Forest Tree Dominated Area (Terrestrial)
Forest 165
806,589
17,525
6,254
830,532
2 Mangrove Forest
Forest 2,503
400,112 85 402,700
3 Mangrove Plantation
Forest 61,719
4 1,096 62,818
4 Plain Land Forest (Sal Forest)
Forest
157 20,767
1,939 22,864
5 Rubber Plantation
Forest
10,038 1,990
338 12,367
6 Forest Tree Dominated Area (Aquatic/ Regularly Flooded)
Forest
798
798
7 Orchards and Other Plantations (Trees)
Non-forest 515 36 27,748
64,982 93,280
8 Herb Dominated Area
Non-forest 22,935 4 1,088 3,015 32,033 59,076
9 Herbaceous Crops Non-forest 242,099 122,209 239,125 8 6,968,673 7,572,113
10 Mud Flats or Intertidal Area
Non-forest 49,400
6,113 5,007 60,520
11 Non-vegetated Non-forest 25,395 53,936 44,700 1,284 567,021 692,336
12 Rivers and Khals Non-forest 471,587 7,040 4,887 220,849 451,874 1,156,237
13 Rural Settlement Non-forest 109,608 74,804 166,043
2,738,201 3,088,657
14 Swamp Reed Land Non-forest
14,311 14,311
15 Shrubs with scattered trees
Non-forest 5,125 641,344 10,559
31,363 688,390
National 991,051 1,716,157 534,433 631,386 10,883,974 14,757,000
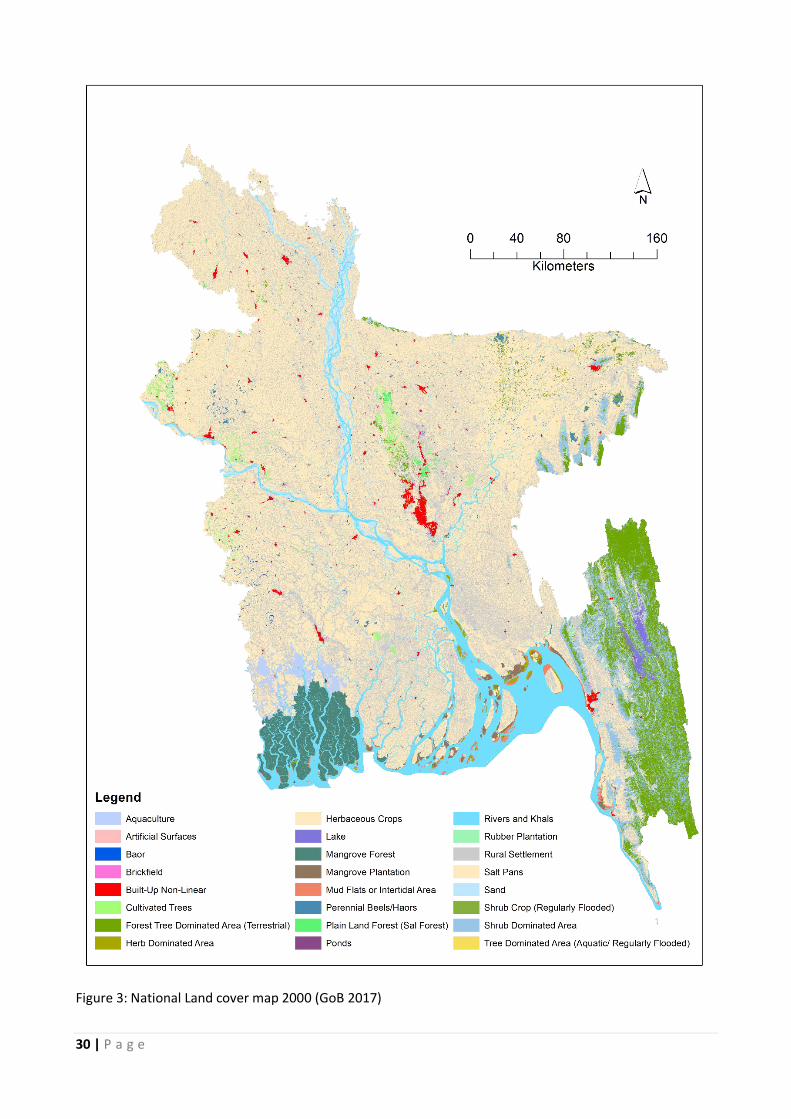
30 | P a g e
Figure 3: National Land cover map 2000 (GoB 2017)

31 | P a g e
4.1.3 Harmonization of Land Cover Map 2015 and 2000
Due to the lower resolution of the national land cover map of 2000 and different number of classes in both
maps, steps were taken to harmonize the two maps and facilitate historical land cover change assessment.
The national land cover map 2015 detects 17 out of 24 classes of the national land cover map 2000, while
the remaining classes were aggregated to 7 higher level classes using the LRS and LCCS (Table 7). The classes
of ‘Hill Forest’, ‘Bamboo Forest’, ‘Forest Plantation’ of the national land cover map 2015 were aggregated
into one class named ‘Forest Tree Dominated Area (Terrestrial)’ for the national land cover map 2000. The
classes of ‘Shrubs with scattered trees’, ‘Orchards and Other Plantations (Shrub)’ and ‘Shifting Cultivation’ of
the national land cover map 2015 were aggregated in one class named ‘Shrubs with scattered trees’. The
land classes of ‘Multiple Crop’ and ‘Single Crop’ were aggregated in one class named ‘Herbaceous crops’.
To further simplify the harmonization of these two maps, all the non-vegetated classes were grouped in one
class named ‘Non-vegetated’ which includes the following classes: ‘Aquaculture’, ‘Built-Up Non-Linear’,
‘Artificial Surfaces’, ‘Baor’, ‘Brickfield’, ‘Lake’, ‘Perennial Beels/Haors’, ‘Ponds’, ‘Salt Pans’ and ‘Sand’. The
classes ‘Mud Flats or Intertidal Area’ and ‘Rivers and Khals’ remain as in 2015 to reflect the natural accretion
and erosion activity and the consequential effects on forests. The resulting number of harmonized classes is
15 (Table 7).
Table 7: Harmonization between the land classes of the national land cover maps of 2015 and 2000.
Classes of the national land cover map of 2015
Classes of the national land cover map of 2000
Harmonized land classes
used in the FRL
IPCC
1 Hill Forest Forest Tree Dominated Area (Terrestrial)
Forest Tree Dominated Area (Terrestrial)
Forest land
2 Bamboo Forest
3 Forest Plantation
4 Mangrove Forest Mangrove Forest Mangrove Forest Forest land
5 Mangrove Plantation Mangrove Plantation Mangrove Plantation Forest land
6 Plain Land Forest (Sal Forest)
Plain Land Forest (Sal Forest)
Plain Land Forest (Sal Forest)
Forest land
7 Rubber Plantation Rubber Plantation Rubber Plantation Forest land
8 Swamp Forest Forest Tree Dominated Area (Aquatic/ Regularly Flooded
Forest Tree Dominated Area (Aquatic/ Regularly Flooded)
Forest land
9 Swamp Plantation
10 Orchards and Other Plantations (Trees)
Orchards and Other Plantations (Trees)
Orchards and Other Plantations (Trees)
Cropland
11 Herb Dominated Area Herb Dominated Area Herb Dominated Area Grassland
12 Single Crop Herbaceous Crops Herbaceous Crops
Cropland
13 Multiple Crop
14 Mud Flats or Intertidal Area
Mud Flats or Intertidal Area
Mud Flats or Intertidal Area Wetland
15 Brackish Water Aquaculture Aquaculture
Non-vegetated
Other land
16 Fresh Water Aquaculture
17 Built-Up Non-Linear Built-Up Non-Linear 18 Air Port
19 Dump Sites/ Extraction Sites Artificial Surfaces
20 Baor Baor
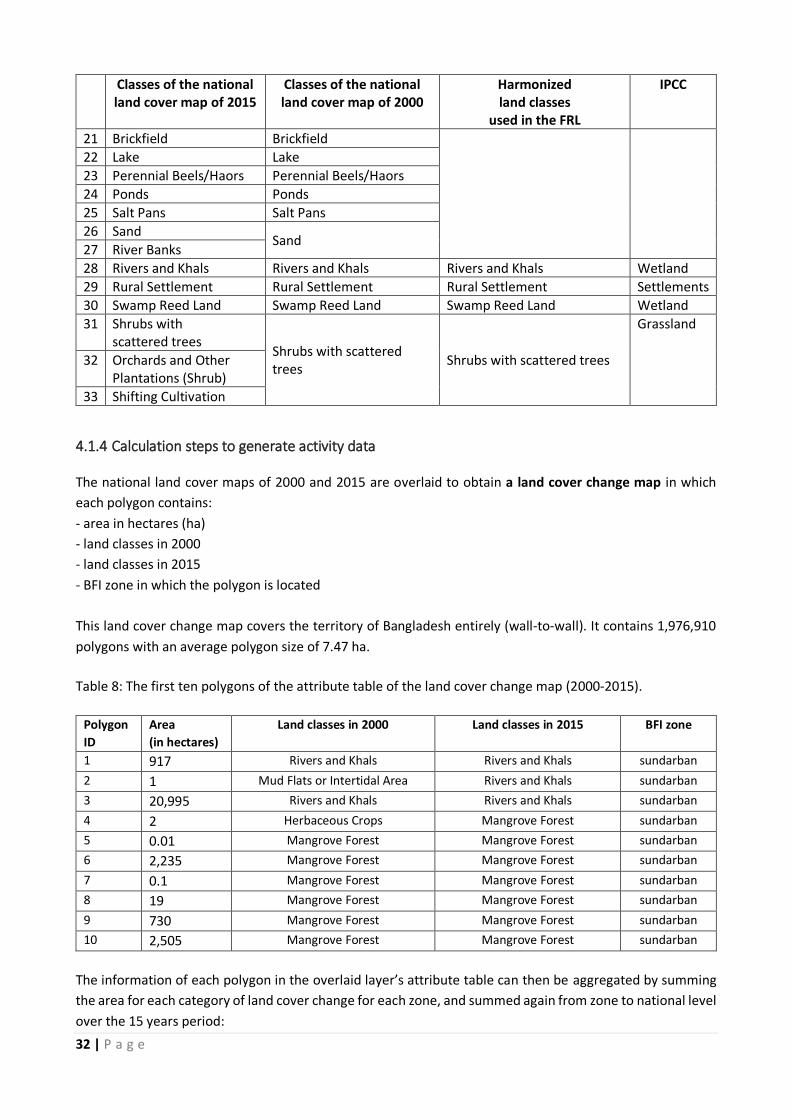
32 | P a g e
Classes of the national land cover map of 2015
Classes of the national land cover map of 2000
Harmonized land classes
used in the FRL
IPCC
21 Brickfield Brickfield
22 Lake Lake
23 Perennial Beels/Haors Perennial Beels/Haors
24 Ponds Ponds
25 Salt Pans Salt Pans
26 Sand Sand
27 River Banks
28 Rivers and Khals Rivers and Khals Rivers and Khals Wetland
29 Rural Settlement Rural Settlement Rural Settlement Settlements
30 Swamp Reed Land Swamp Reed Land Swamp Reed Land Wetland
31 Shrubs with scattered trees
Shrubs with scattered trees
Shrubs with scattered trees
Grassland
32 Orchards and Other Plantations (Shrub)
33 Shifting Cultivation
4.1.4 Calculation steps to generate activity data
The national land cover maps of 2000 and 2015 are overlaid to obtain a land cover change map in which
each polygon contains:
- area in hectares (ha)
- land classes in 2000
- land classes in 2015
- BFI zone in which the polygon is located
This land cover change map covers the territory of Bangladesh entirely (wall-to-wall). It contains 1,976,910
polygons with an average polygon size of 7.47 ha.
Table 8: The first ten polygons of the attribute table of the land cover change map (2000-2015).
Polygon
ID
Area
(in hectares)
Land classes in 2000 Land classes in 2015 BFI zone
1 917 Rivers and Khals Rivers and Khals sundarban
2 1 Mud Flats or Intertidal Area Rivers and Khals sundarban
3 20,995 Rivers and Khals Rivers and Khals sundarban
4 2 Herbaceous Crops Mangrove Forest sundarban
5 0.01 Mangrove Forest Mangrove Forest sundarban
6 2,235 Mangrove Forest Mangrove Forest sundarban
7 0.1 Mangrove Forest Mangrove Forest sundarban
8 19 Mangrove Forest Mangrove Forest sundarban
9 730 Mangrove Forest Mangrove Forest sundarban
10 2,505 Mangrove Forest Mangrove Forest sundarban
The information of each polygon in the overlaid layer’s attribute table can then be aggregated by summing
the area for each category of land cover change for each zone, and summed again from zone to national level
over the 15 years period:

33 | P a g e
𝐴𝐷𝑖,𝑗 =∑ (𝑎𝑟𝑒𝑎𝑖,𝑗,𝑘)𝑛
𝑖
15 (Equation 1)
where
𝐴𝐷𝑖,𝑗: the activity data - i.e. the area in ha/year - changing from the land class i in 2000 to j in 2015
𝑛 the number of polygons following this change
𝑎𝑟𝑒𝑎𝑖,𝑗,𝑘 : the area (ha) of each polygon k following this change
4.2 Emission and removal factors
The emission and removal factors associated with land cover changes are calculated considering the above-
ground biomass stocks per land class, as well as the tree cover change for the period 2000-2015. The different
steps involved in this calculation are as follows:
- Step 1: Estimation of the above-ground and below-ground biomass (in ton biomass per ha) for the main
forest land classes are based on the 15 harmonized land classes based on the LRS (Table 7). These estimates
are derived from the analysis of past forest inventories conducted at sub-national and national level.
Weighted average is used considering the size of the forest inventory plots. The weighted averages were
calculated as the sum of the aboveground biomass of each plot in a given land cover class multiplied by its
plot area and divided by the total area of all the plots in this given land cover class. Table 9 and Appendix C
is showing the summary table of inventory plots, and different inventories followed different plot designs.
The weighted average worked well to over represent large scale large plots over small scale small plots and
therefore avoid potential bias from small scale forest inventories.
-Step 2: Integration of the tree cover map 2000-2014 with the land cover change map to assess the percent
of tree cover in 2000 and in 2015 for each polygon of the land cover change map. Calculation of the
percentage of tree cover change in land cover change polygon and assigning the activity is illustrated in
Appendix D.
-Step 3: Estimation of the weighted average percent of tree cover per land class, and calculation of the
average biomass per percent of tree cover for each class of the land cover map.
- Step 4: Estimation of the carbon stock in 2000 and in 2015 for each polygon of the land cover change map
as the product of percent tree cover and average biomass per percent tree cover.
- Step 5: Calculation of the emission and removal factors as the difference between the carbon stock in 2000
and in 2015.
4.2.1 Above-ground and belowground biomass estimates
Country-specific above-ground biomass carbon stocks of the land classes are obtained from previous six
national and sub-national forest inventories that were conducted in the five zones between 1997 and 2014
(Table 9). Historical inventory data were harmonized for forest biomass estimation. The harmonization
process was carried out in multiple stages, the complexity of which depended on the original format of the
data and the condition of the data in terms of data entry or collection errors. A detailed description of the
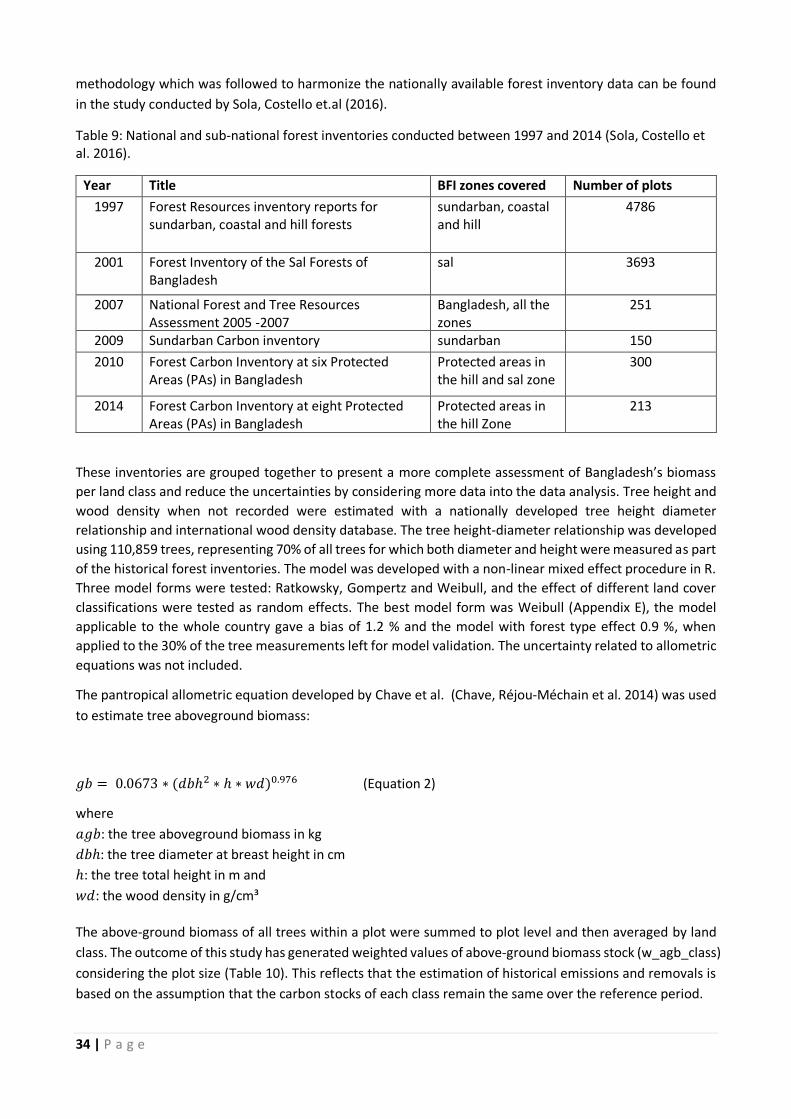
34 | P a g e
methodology which was followed to harmonize the nationally available forest inventory data can be found
in the study conducted by Sola, Costello et.al (2016).
Table 9: National and sub-national forest inventories conducted between 1997 and 2014 (Sola, Costello et al. 2016).
Year Title BFI zones covered Number of plots
1997 Forest Resources inventory reports for sundarban, coastal and hill forests
sundarban, coastal and hill
4786
2001 Forest Inventory of the Sal Forests of Bangladesh
sal 3693
2007 National Forest and Tree Resources Assessment 2005 -2007
Bangladesh, all the zones
251
2009 Sundarban Carbon inventory sundarban 150
2010 Forest Carbon Inventory at six Protected Areas (PAs) in Bangladesh
Protected areas in the hill and sal zone
300
2014 Forest Carbon Inventory at eight Protected Areas (PAs) in Bangladesh
Protected areas in the hill Zone
213
These inventories are grouped together to present a more complete assessment of Bangladesh’s biomass
per land class and reduce the uncertainties by considering more data into the data analysis. Tree height and
wood density when not recorded were estimated with a nationally developed tree height diameter
relationship and international wood density database. The tree height-diameter relationship was developed
using 110,859 trees, representing 70% of all trees for which both diameter and height were measured as part
of the historical forest inventories. The model was developed with a non-linear mixed effect procedure in R.
Three model forms were tested: Ratkowsky, Gompertz and Weibull, and the effect of different land cover
classifications were tested as random effects. The best model form was Weibull (Appendix E), the model
applicable to the whole country gave a bias of 1.2 % and the model with forest type effect 0.9 %, when
applied to the 30% of the tree measurements left for model validation. The uncertainty related to allometric
equations was not included.
The pantropical allometric equation developed by Chave et al. (Chave, Réjou‐Méchain et al. 2014) was used
to estimate tree aboveground biomass:
𝑔𝑏 = 0.0673 ∗ (𝑑𝑏ℎ2 ∗ ℎ ∗ 𝑤𝑑)0.976 (Equation 2)
where
𝑎𝑔𝑏: the tree aboveground biomass in kg
𝑑𝑏ℎ: the tree diameter at breast height in cm
ℎ: the tree total height in m and
𝑤𝑑: the wood density in g/cm³
The above-ground biomass of all trees within a plot were summed to plot level and then averaged by land
class. The outcome of this study has generated weighted values of above-ground biomass stock (w_agb_class)
considering the plot size (Table 10). This reflects that the estimation of historical emissions and removals is
based on the assumption that the carbon stocks of each class remain the same over the reference period.
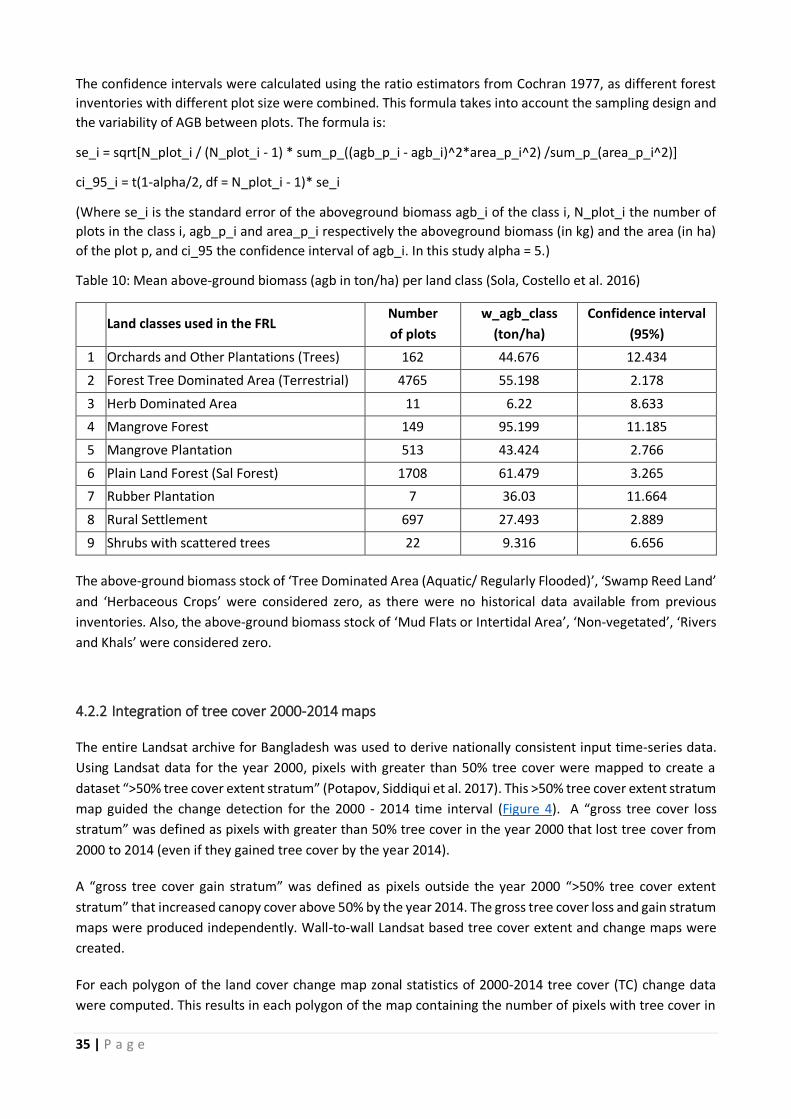
35 | P a g e
The confidence intervals were calculated using the ratio estimators from Cochran 1977, as different forest
inventories with different plot size were combined. This formula takes into account the sampling design and
the variability of AGB between plots. The formula is:
se_i = sqrt[N_plot_i / (N_plot_i - 1) * sum_p_((agb_p_i - agb_i)^2*area_p_i^2) /sum_p_(area_p_i^2)]
ci_95_i = t(1-alpha/2, df = N_plot_i - 1)* se_i
(Where se_i is the standard error of the aboveground biomass agb_i of the class i, N_plot_i the number of
plots in the class i, agb_p_i and area_p_i respectively the aboveground biomass (in kg) and the area (in ha)
of the plot p, and ci_95 the confidence interval of agb_i. In this study alpha = 5.)
Table 10: Mean above-ground biomass (agb in ton/ha) per land class (Sola, Costello et al. 2016)
Land classes used in the FRL
Number
of plots
w_agb_class
(ton/ha)
Confidence interval
(95%)
1 Orchards and Other Plantations (Trees) 162 44.676 12.434
2 Forest Tree Dominated Area (Terrestrial) 4765 55.198 2.178
3 Herb Dominated Area 11 6.22 8.633
4 Mangrove Forest 149 95.199 11.185
5 Mangrove Plantation 513 43.424 2.766
6 Plain Land Forest (Sal Forest) 1708 61.479 3.265
7 Rubber Plantation 7 36.03 11.664
8 Rural Settlement 697 27.493 2.889
9 Shrubs with scattered trees 22 9.316 6.656
The above-ground biomass stock of ‘Tree Dominated Area (Aquatic/ Regularly Flooded)’, ‘Swamp Reed Land’
and ‘Herbaceous Crops’ were considered zero, as there were no historical data available from previous
inventories. Also, the above-ground biomass stock of ‘Mud Flats or Intertidal Area’, ‘Non-vegetated’, ‘Rivers
and Khals’ were considered zero.
4.2.2 Integration of tree cover 2000-2014 maps
The entire Landsat archive for Bangladesh was used to derive nationally consistent input time-series data.
Using Landsat data for the year 2000, pixels with greater than 50% tree cover were mapped to create a
dataset “>50% tree cover extent stratum” (Potapov, Siddiqui et al. 2017). This >50% tree cover extent stratum
map guided the change detection for the 2000 - 2014 time interval (Figure 4). A “gross tree cover loss
stratum” was defined as pixels with greater than 50% tree cover in the year 2000 that lost tree cover from
2000 to 2014 (even if they gained tree cover by the year 2014).
A “gross tree cover gain stratum” was defined as pixels outside the year 2000 “>50% tree cover extent
stratum” that increased canopy cover above 50% by the year 2014. The gross tree cover loss and gain stratum
maps were produced independently. Wall-to-wall Landsat based tree cover extent and change maps were
created.
For each polygon of the land cover change map zonal statistics of 2000-2014 tree cover (TC) change data
were computed. This results in each polygon of the map containing the number of pixels with tree cover in
36 | P a g e
2000, the number of pixels with gains and the number of pixels with tree cover loss for each year between
2001 and 2014. The tree cover change was calculated for each polygon as the number of pixels with trees
divided by the total number of pixels. The tree cover of 2015 was calculated by subtracting the total annual
tree cover losses (2001-2014) from the tree cover of 2000 and adding the total tree cover gains obtained
during the period 2001-2014.
𝑇𝐶2015 𝑖 = 𝑇𝐶2000 𝑖 − 𝑇𝐶𝑙𝑜𝑠𝑠2001−2014+ 𝑇𝐶𝑔𝑎𝑖𝑛 2001−2014
(Equation 3)
Where
𝑇𝐶2015 𝑖 : percentage (%) of tree cover of polygon i, in 2015
𝑇𝐶2000 𝑖 : percentage (%) of tree cover of polygon i, in 2000
𝑇𝐶𝑙𝑜𝑠𝑠2001−2014: total annual percentage (%) of tree cover loss of polygon i from 2001 to 2014
𝑇𝐶𝑔𝑎𝑖𝑛2001−2014: total percentage (%) of tree cover gain of polygon i from 2001 to 2014
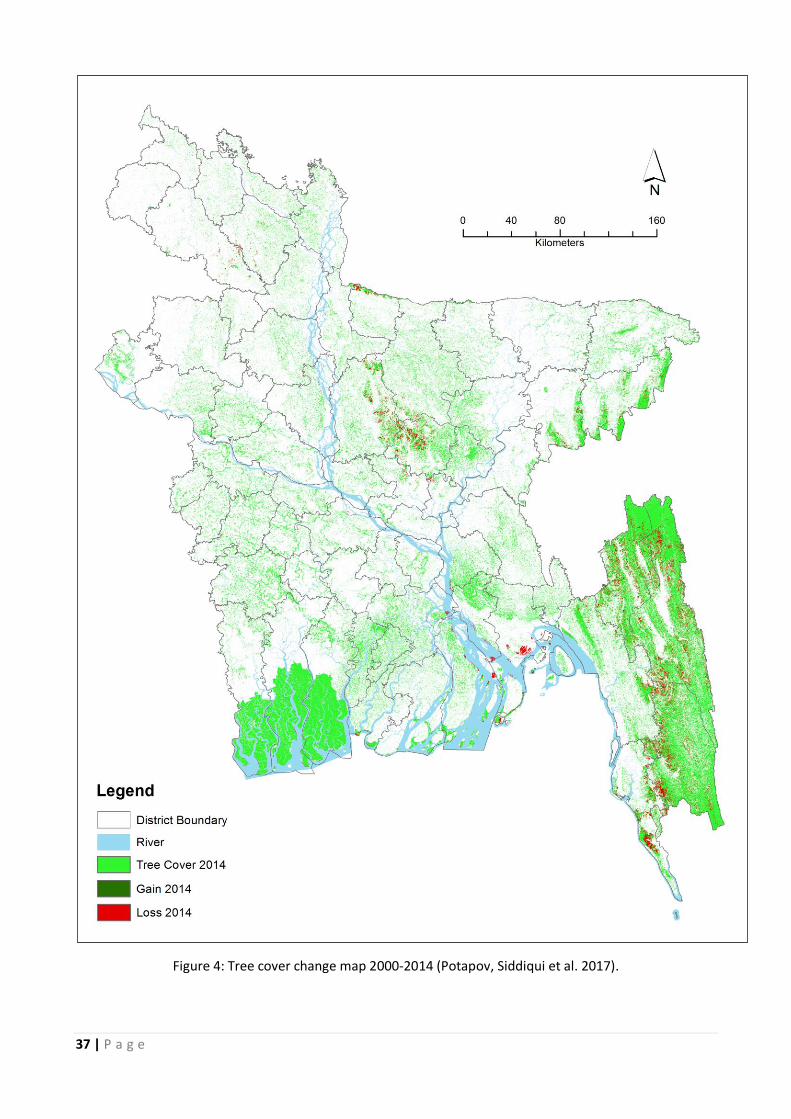
37 | P a g e
Figure 4: Tree cover change map 2000-2014 (Potapov, Siddiqui et al. 2017).

38 | P a g e
Each polygon of the integrated land cover change map and tree cover change contains the following
information:
- area in hectares (ha)
- land class in 2000
- land class in 2015
- BFI zone in which the polygon is located
- percentage (%) of tree cover in 2000
- percentage (%) of tree cover in 2015.
4.2.3 Average percentage tree cover and average biomass per percent tree cover
With the information at the polygon on land class and tree cover percentage, the average percentage (%) of
tree cover (avg_ptc) per land class was calculated as weighted average percentage (%) of tree cover
(w_avg_ptc) of each polygon and their area, as follows:
𝑎𝑣𝑔_𝑝𝑡𝑐 =∑ (𝑎𝑟𝑒𝑎2000𝑖
× 𝑝𝑡𝑐2000𝑖)+ ∑ (𝑎𝑟𝑒𝑎2015𝑖
×𝑝𝑡𝑐2015𝑖) 𝑚
𝑖 𝑛𝑖
(∑ 𝑎𝑟𝑒𝑎2000𝑖𝑛𝑖 ) + (∑ 𝑎𝑟𝑒𝑎2015𝑖
𝑚𝑖 )
(Equation 4)
Where,
𝑤_𝑎𝑣𝑔_𝑝𝑡𝑐: weighted average percentage (%) of tree cover per land class
𝑎𝑟𝑒𝑎_2000𝑖 : area (ha) of polygon i in 2000
𝑝𝑡𝑐_2000𝑖 percentage (%) of tree cover of polygon i in 2000
𝑎𝑟𝑒𝑎_2015𝑖 : area (ha)of polygon i in 2015
𝑝𝑡𝑐_2015𝑖 percentage (%) of tree cover of polygon i in 2015
𝑛: number of polygons of a land class in 2000
𝑚: number of polygons of a land class in 2015
Table 11 shows the weighted average percentage (%) of tree cover per land class used in the FRL.
The average above-ground biomass (t/ha) per percentage (%) of tree cover (agb_per_ptc) was calculated for
each land class i
𝑎𝑔𝑏_𝑝𝑡𝑐𝑖 =𝑤_𝑎𝑔𝑏_𝑐𝑙𝑎𝑠𝑠 𝑖
𝑤_𝑎𝑣𝑔_𝑝𝑡𝑐𝑖 (Equation 5)
𝑎𝑔𝑏_𝑝𝑡𝑐𝑖: above-ground biomass (t/ha) per percentage (%) of tree cover for a land class i
𝑤_𝑎𝑔𝑏_𝑐𝑙𝑎𝑠𝑠 𝑖: weighted above-ground biomass (t/ha) for a land cover class i
𝑤_𝑎𝑣𝑔_𝑝𝑡𝑐𝑖: weighted average percentage (%) of tree cover for a land cover class i
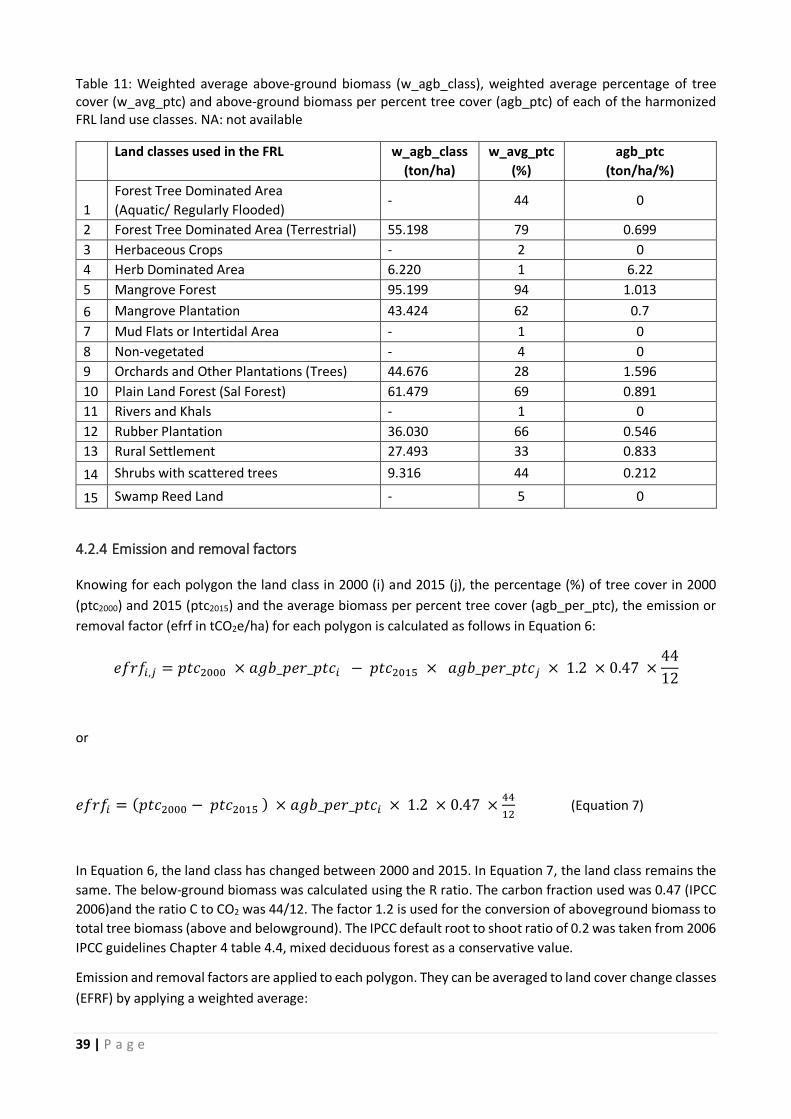
39 | P a g e
Table 11: Weighted average above-ground biomass (w_agb_class), weighted average percentage of tree cover (w_avg_ptc) and above-ground biomass per percent tree cover (agb_ptc) of each of the harmonized FRL land use classes. NA: not available
Land classes used in the FRL w_agb_class
(ton/ha)
w_avg_ptc
(%)
agb_ptc
(ton/ha/%)
1
Forest Tree Dominated Area
(Aquatic/ Regularly Flooded) - 44 0
2 Forest Tree Dominated Area (Terrestrial) 55.198 79 0.699
3 Herbaceous Crops - 2 0
4 Herb Dominated Area 6.220 1 6.22
5 Mangrove Forest 95.199 94 1.013
6 Mangrove Plantation 43.424 62 0.7
7 Mud Flats or Intertidal Area - 1 0
8 Non-vegetated - 4 0
9 Orchards and Other Plantations (Trees) 44.676 28 1.596
10 Plain Land Forest (Sal Forest) 61.479 69 0.891
11 Rivers and Khals - 1 0
12 Rubber Plantation 36.030 66 0.546
13 Rural Settlement 27.493 33 0.833
14 Shrubs with scattered trees 9.316 44 0.212
15 Swamp Reed Land - 5 0
4.2.4 Emission and removal factors
Knowing for each polygon the land class in 2000 (i) and 2015 (j), the percentage (%) of tree cover in 2000
(ptc2000) and 2015 (ptc2015) and the average biomass per percent tree cover (agb_per_ptc), the emission or
removal factor (efrf in tCO2e/ha) for each polygon is calculated as follows in Equation 6:
𝑒𝑓𝑟𝑓𝑖,𝑗 = 𝑝𝑡𝑐2000 × 𝑎𝑔𝑏_𝑝𝑒𝑟_𝑝𝑡𝑐𝑖 − 𝑝𝑡𝑐2015 × 𝑎𝑔𝑏_𝑝𝑒𝑟_𝑝𝑡𝑐𝑗 × 1.2 × 0.47 ×44
12
or
𝑒𝑓𝑟𝑓𝑖 = (𝑝𝑡𝑐2000 − 𝑝𝑡𝑐2015 ) × 𝑎𝑔𝑏_𝑝𝑒𝑟_𝑝𝑡𝑐𝑖 × 1.2 × 0.47 ×44
12 (Equation 7)
In Equation 6, the land class has changed between 2000 and 2015. In Equation 7, the land class remains the
same. The below-ground biomass was calculated using the R ratio. The carbon fraction used was 0.47 (IPCC
2006)and the ratio C to CO2 was 44/12. The factor 1.2 is used for the conversion of aboveground biomass to
total tree biomass (above and belowground). The IPCC default root to shoot ratio of 0.2 was taken from 2006
IPCC guidelines Chapter 4 table 4.4, mixed deciduous forest as a conservative value.
Emission and removal factors are applied to each polygon. They can be averaged to land cover change classes
(EFRF) by applying a weighted average:
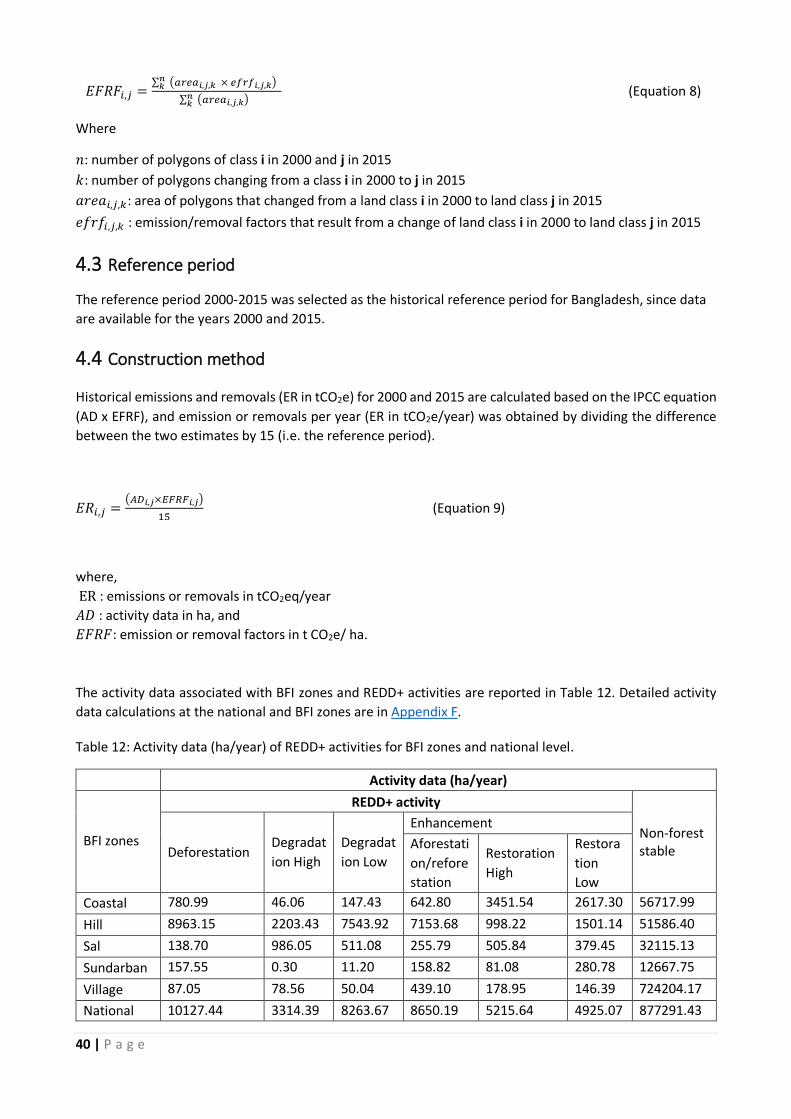
40 | P a g e
𝐸𝐹𝑅𝐹𝑖,𝑗 =∑ (𝑎𝑟𝑒𝑎𝑖,𝑗,𝑘 × 𝑒𝑓𝑟𝑓𝑖,𝑗,𝑘) 𝑛
𝑘
∑ (𝑎𝑟𝑒𝑎𝑖,𝑗,𝑘) 𝑛𝑘
(Equation 8)
Where
𝑛: number of polygons of class i in 2000 and j in 2015
𝑘: number of polygons changing from a class i in 2000 to j in 2015
𝑎𝑟𝑒𝑎𝑖,𝑗,𝑘: area of polygons that changed from a land class i in 2000 to land class j in 2015
𝑒𝑓𝑟𝑓𝑖,𝑗,𝑘 : emission/removal factors that result from a change of land class i in 2000 to land class j in 2015
4.3 Reference period
The reference period 2000-2015 was selected as the historical reference period for Bangladesh, since data
are available for the years 2000 and 2015.
4.4 Construction method
Historical emissions and removals (ER in tCO2e) for 2000 and 2015 are calculated based on the IPCC equation
(AD x EFRF), and emission or removals per year (ER in tCO2e/year) was obtained by dividing the difference
between the two estimates by 15 (i.e. the reference period).
𝐸𝑅𝑖,𝑗 =(𝐴𝐷𝑖,𝑗×𝐸𝐹𝑅𝐹𝑖,𝑗)
15 (Equation 9)
where,
ER : emissions or removals in tCO2eq/year
𝐴𝐷 : activity data in ha, and
𝐸𝐹𝑅𝐹: emission or removal factors in t CO2e/ ha.
The activity data associated with BFI zones and REDD+ activities are reported in Table 12. Detailed activity
data calculations at the national and BFI zones are in Appendix F.
Table 12: Activity data (ha/year) of REDD+ activities for BFI zones and national level.
Activity data (ha/year)
BFI zones
REDD+ activity
Non-forest stable Deforestation
Degradat
ion High
Degradat
ion Low
Enhancement
Aforestati
on/refore
station
Restoration
High
Restora
tion
Low
Coastal 780.99 46.06 147.43 642.80 3451.54 2617.30 56717.99
Hill 8963.15 2203.43 7543.92 7153.68 998.22 1501.14 51586.40
Sal 138.70 986.05 511.08 255.79 505.84 379.45 32115.13
Sundarban 157.55 0.30 11.20 158.82 81.08 280.78 12667.75
Village 87.05 78.56 50.04 439.10 178.95 146.39 724204.17
National 10127.44 3314.39 8263.67 8650.19 5215.64 4925.07 877291.43

41 | P a g e
The emission and removal factors (tCO2eq/ha) that were used to calculate the associated emissions and removals at the national and BFI zones are reported in Table 13.
Table 13: Emission and removal factors (tCO2eq/ha) for REDD+ activities for the BFI zone and national level.
BFI zones
Emission and removal factors (tCO2eq/ha)
REDD+ activity
Non-forest stable
Deforestation
Degradation high
Degradation low
Enhancement
Afforestation/
Reforestation
Restoration high
Restoration low
Coastal 51.44 37.43 17.97 -60.42 -60.08 -15.43 -1.33
Hill 83.77 61.78 16.00 -47.67 -62.85 -15.96 0.60
Sal 95.79 87.23 26.24 -39.57 -56.72 -18.37 0.74
Sundarban 75.29 66.67 16.43 -30.50 -165.92 -18.53 -0.22
Village 42.47 92.72 19.50 -38.31 -67.79 -15.04 -0.62
National 80.95 69.75 16.69 -47.59 -62.20 -15.98 -0.54
Total emissions and removals (t CO2e/year) associated with the REDD+ activities at the national and BFI zones are given in Table 14 below. The numbers within the parentheses are the confidence intervals (%).
Table 14: Emissions and removals (t CO2e/year) from REDD+ activities at the zone and national level.
BFI
zones
Emissions and removals (tCO2e/year)
REDD+ activity Non-
forest
stable*
Deforestation Degradation
High
Degradation
Low
Enhancement
Afforestat
ion/Refor
estation
Restoration
High
Restorat
ion Low
Coastal 40,173
(16)
1,724
(44)
2,650
(57)
-38,841
(45)
-207,371
(83)
- 40,378
(38)
-75,216
(7)
Hill 750,878 (28)
136,134 (43)
120,726 (57)
-340,993 (29)
-62,742 (72)
-23,953 (32)
31,118 (6)
Sal 13,286
(20)
86,012
(28)
13,412
(36)
-10,121
(25)
-28,693
(52)
-6,969
(23)
23,658
(46)
Sundarba
n
11,862
(35)
20
(45)
184
(58)
-4,844
(69)
-13,453
(84)
-5,202
(38)
-2,749
(57)
Village 3,697
(19)
7,284
(38)
976
(33)
-16,821
(30)
-12,131
(58)
-2,201
(24)
-449,336
(1)
National 819,854
(26)
231,175
(35)
137,942
(51)
-411,623
(26)
-324,390
(60)
-78,705
(24)
-476,084
(2)
*Emissions/Removals from non-forest stable* (trees outside the forest) were not accounted for FRL
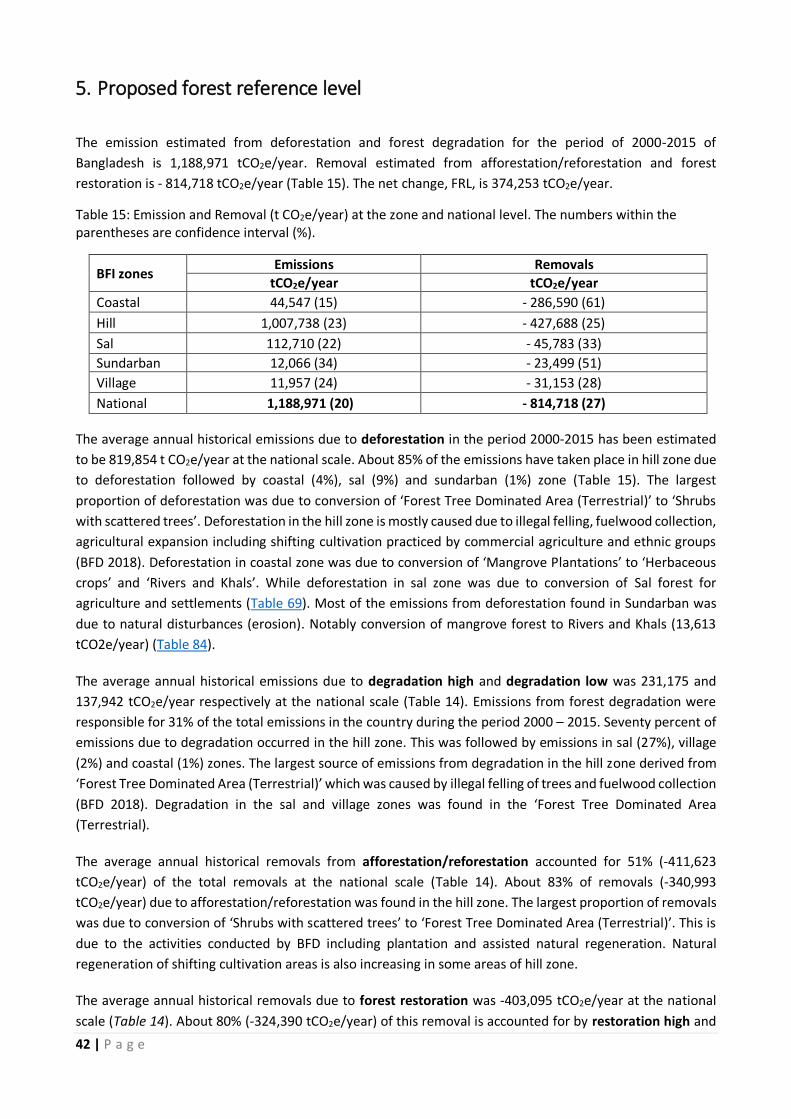
42 | P a g e
5. Proposed forest reference level
The emission estimated from deforestation and forest degradation for the period of 2000-2015 of
Bangladesh is 1,188,971 tCO2e/year. Removal estimated from afforestation/reforestation and forest
restoration is - 814,718 tCO2e/year (Table 15). The net change, FRL, is 374,253 tCO2e/year.
Table 15: Emission and Removal (t CO2e/year) at the zone and national level. The numbers within the parentheses are confidence interval (%).
BFI zones Emissions Removals
tCO2e/year tCO2e/year
Coastal 44,547 (15) - 286,590 (61)
Hill 1,007,738 (23) - 427,688 (25)
Sal 112,710 (22) - 45,783 (33)
Sundarban 12,066 (34) - 23,499 (51)
Village 11,957 (24) - 31,153 (28)
National 1,188,971 (20) - 814,718 (27)
The average annual historical emissions due to deforestation in the period 2000-2015 has been estimated
to be 819,854 t CO2e/year at the national scale. About 85% of the emissions have taken place in hill zone due
to deforestation followed by coastal (4%), sal (9%) and sundarban (1%) zone (Table 15). The largest
proportion of deforestation was due to conversion of ‘Forest Tree Dominated Area (Terrestrial)’ to ‘Shrubs
with scattered trees’. Deforestation in the hill zone is mostly caused due to illegal felling, fuelwood collection,
agricultural expansion including shifting cultivation practiced by commercial agriculture and ethnic groups
(BFD 2018). Deforestation in coastal zone was due to conversion of ‘Mangrove Plantations’ to ‘Herbaceous
crops’ and ‘Rivers and Khals’. While deforestation in sal zone was due to conversion of Sal forest for
agriculture and settlements (Table 69). Most of the emissions from deforestation found in Sundarban was
due to natural disturbances (erosion). Notably conversion of mangrove forest to Rivers and Khals (13,613
tCO2e/year) (Table 84).
The average annual historical emissions due to degradation high and degradation low was 231,175 and
137,942 tCO2e/year respectively at the national scale (Table 14). Emissions from forest degradation were
responsible for 31% of the total emissions in the country during the period 2000 – 2015. Seventy percent of
emissions due to degradation occurred in the hill zone. This was followed by emissions in sal (27%), village
(2%) and coastal (1%) zones. The largest source of emissions from degradation in the hill zone derived from
‘Forest Tree Dominated Area (Terrestrial)’ which was caused by illegal felling of trees and fuelwood collection
(BFD 2018). Degradation in the sal and village zones was found in the ‘Forest Tree Dominated Area
(Terrestrial).
The average annual historical removals from afforestation/reforestation accounted for 51% (-411,623
tCO2e/year) of the total removals at the national scale (Table 14). About 83% of removals (-340,993
tCO2e/year) due to afforestation/reforestation was found in the hill zone. The largest proportion of removals
was due to conversion of ‘Shrubs with scattered trees’ to ‘Forest Tree Dominated Area (Terrestrial)’. This is
due to the activities conducted by BFD including plantation and assisted natural regeneration. Natural
regeneration of shifting cultivation areas is also increasing in some areas of hill zone.
The average annual historical removals due to forest restoration was -403,095 tCO2e/year at the national
scale (Table 14). About 80% (-324,390 tCO2e/year) of this removal is accounted for by restoration high and

43 | P a g e
20 % (-78,705 tCO2e/year) by restoration low. About 61% of removals (-247,749 tCO2e/year) due to forest
restoration was found in the coastal zone. The largest amount of removals in the coastal zone occurred due
to increased protection by BFD and assisted natural regeneration.
The average annual historical removals from non-forest stable (trees outside forest) was -476,048
tCO2e/year at the national scale for the reference period 2000 - 2015. About 94% (-449,336 tCO2e/year) of
this removal is accounted for by removals from trees outside forest areas from the village zone. Therefore,
in Bangladesh trees outside forest play a key role in carbon sequestration. However, in hill and sal zones,
trees outside forests experiencing emissions (Table 14) due to increased demand for fuelwood and timber
(BFD 2018).
6. Uncertainty Analysis
6.1 Uncertainty analysis of Activity Data
6.1.1 Sampling design
For the sampling design, a probability sampling protocol i.e., stratified random sampling was implemented.
The activity classes determined from the map based on the integrated land cover change and tree cover were
used to construct strata. The following equations (Cochran 1977) were used to calculate an adequate overall
sample size (n) for stratified random sampling. The AD converted to raster (6X6m) and only used for sampling
design. Overall sample size was found to be 952 and was distributed among the different strata considering
75 points as minimum sample size per strata is expected user accuracy of stratum i.
The dimension of spatial assessment unit for reference data collection is decided based on the underlying
base maps (i.e., 30m based 2000 and 6m based 2015 land cover maps). Average size of the polygons is
influenced by the large polygons, the polygons representing no change from 2000 and 2015 (e.g., river
remaining river, forest remaining forest, etc.).
For the collection of reference data 30m by 30m homogeneous spatial assessment unit is used.
Homogeneous unit is considered as one which is assigned fully to only one class. Sample units are then
randomly allocated using SEPAL platform and visually classified by GIS and land cover experts. Plot layout
included 3 by 3 sample points within the sample unit (Figure 6) to assess tree cover changes. A simple
spreadsheet was prepared to take notes on the land cover and tree cover information to identify the
corresponding class is expected user accuracy of stratum i.
Table 16 shows the results and
Figure 5 shows the distribution of accuracy assessment points on top of activity classes. As indicated in Table
14 the standard error of the estimated overall accuracy 𝑆(�̂�) and expected user accuracy EUA are user given.
𝑆(�̂�) was considered 0.01. Stable and rare classes (i.e., change classes) are expected to have high and low
user accuracy, respectively (FAO 2016 ). Considering this, expected user accuracies for stable and change
classes were assigned as 0.9 and 0.7, respectively.
𝑛 =(∑ 𝑊𝑖𝑆𝑖)2
[𝑆(�̂�)]2+(1
𝑁) ∑ 𝑊𝑖𝑆𝑖
2 (Equation 10)
𝑆𝑖 = √𝐸𝑈𝐴𝑖 ∗ (1 − 𝐸𝑈𝐴𝑖) (Equation 11)
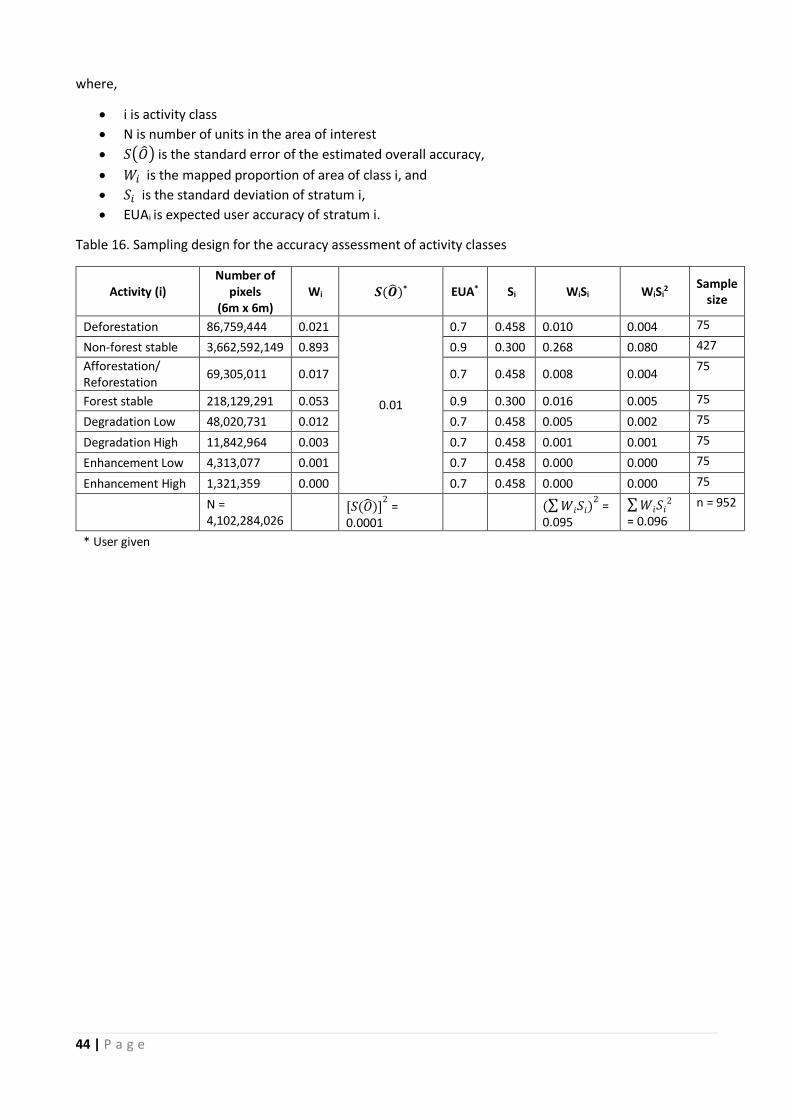
44 | P a g e
where,
• i is activity class
• N is number of units in the area of interest
• 𝑆(�̂�) is the standard error of the estimated overall accuracy,
• 𝑊𝑖 is the mapped proportion of area of class i, and
• 𝑆𝑖 is the standard deviation of stratum i,
• EUAi is expected user accuracy of stratum i.
Table 16. Sampling design for the accuracy assessment of activity classes
Activity (i) Number of
pixels (6m x 6m)
Wi 𝑺(�̂�)* EUA* Si WiSi WiSi2
Sample size
Deforestation 86,759,444 0.021
0.01
0.7 0.458 0.010 0.004 75
Non-forest stable 3,662,592,149 0.893 0.9 0.300 0.268 0.080 427
Afforestation/ Reforestation
69,305,011 0.017 0.7 0.458 0.008 0.004 75
Forest stable 218,129,291 0.053 0.9 0.300 0.016 0.005 75
Degradation Low 48,020,731 0.012 0.7 0.458 0.005 0.002 75
Degradation High 11,842,964 0.003 0.7 0.458 0.001 0.001 75
Enhancement Low 4,313,077 0.001 0.7 0.458 0.000 0.000 75
Enhancement High 1,321,359 0.000 0.7 0.458 0.000 0.000 75
N = 4,102,284,026
[𝑆(�̂�)]2 =
0.0001 (∑ 𝑊𝑖𝑆𝑖)
2 =
0.095
∑ 𝑊𝑖𝑆𝑖2
= 0.096
n = 952
* User given

45 | P a g e
Figure 5: Distribution of accuracy assessment location over activity classes.
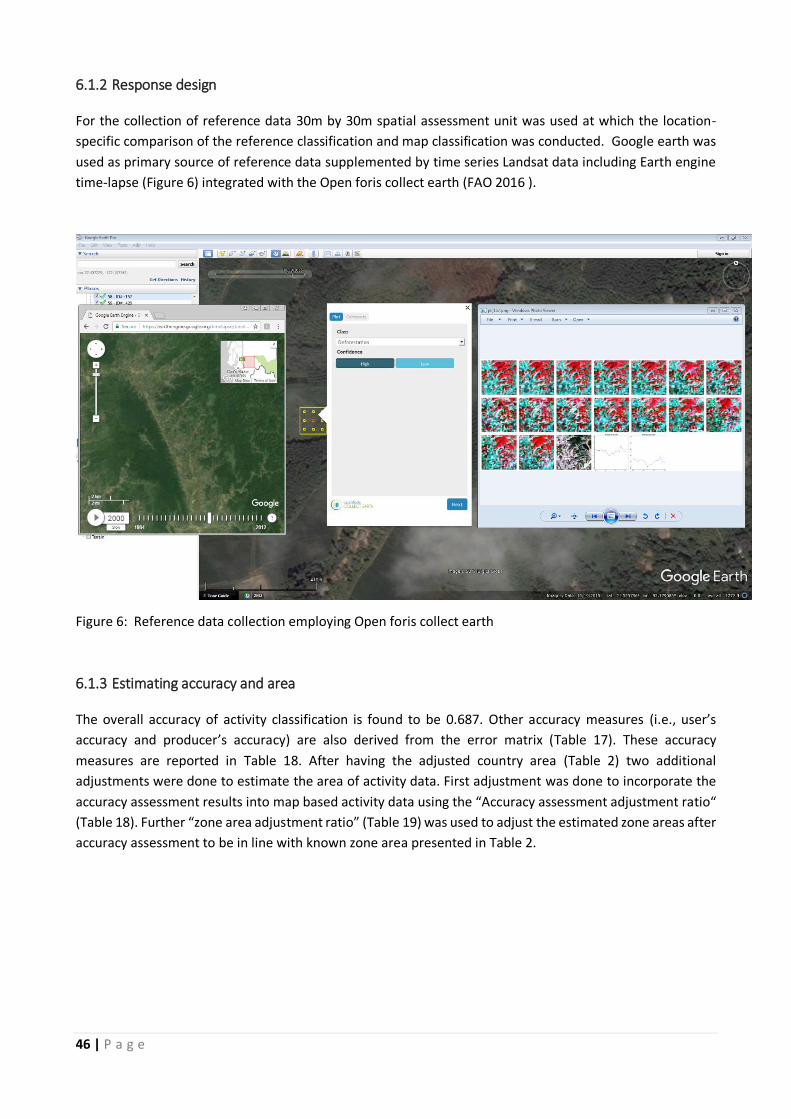
46 | P a g e
6.1.2 Response design
For the collection of reference data 30m by 30m spatial assessment unit was used at which the location-
specific comparison of the reference classification and map classification was conducted. Google earth was
used as primary source of reference data supplemented by time series Landsat data including Earth engine
time-lapse (Figure 6) integrated with the Open foris collect earth (FAO 2016 ).
Figure 6: Reference data collection employing Open foris collect earth
6.1.3 Estimating accuracy and area
The overall accuracy of activity classification is found to be 0.687. Other accuracy measures (i.e., user’s
accuracy and producer’s accuracy) are also derived from the error matrix (Table 17). These accuracy
measures are reported in Table 18. After having the adjusted country area (Table 2) two additional
adjustments were done to estimate the area of activity data. First adjustment was done to incorporate the
accuracy assessment results into map based activity data using the “Accuracy assessment adjustment ratio“
(Table 18). Further “zone area adjustment ratio” (Table 19) was used to adjust the estimated zone areas after
accuracy assessment to be in line with known zone area presented in Table 2.
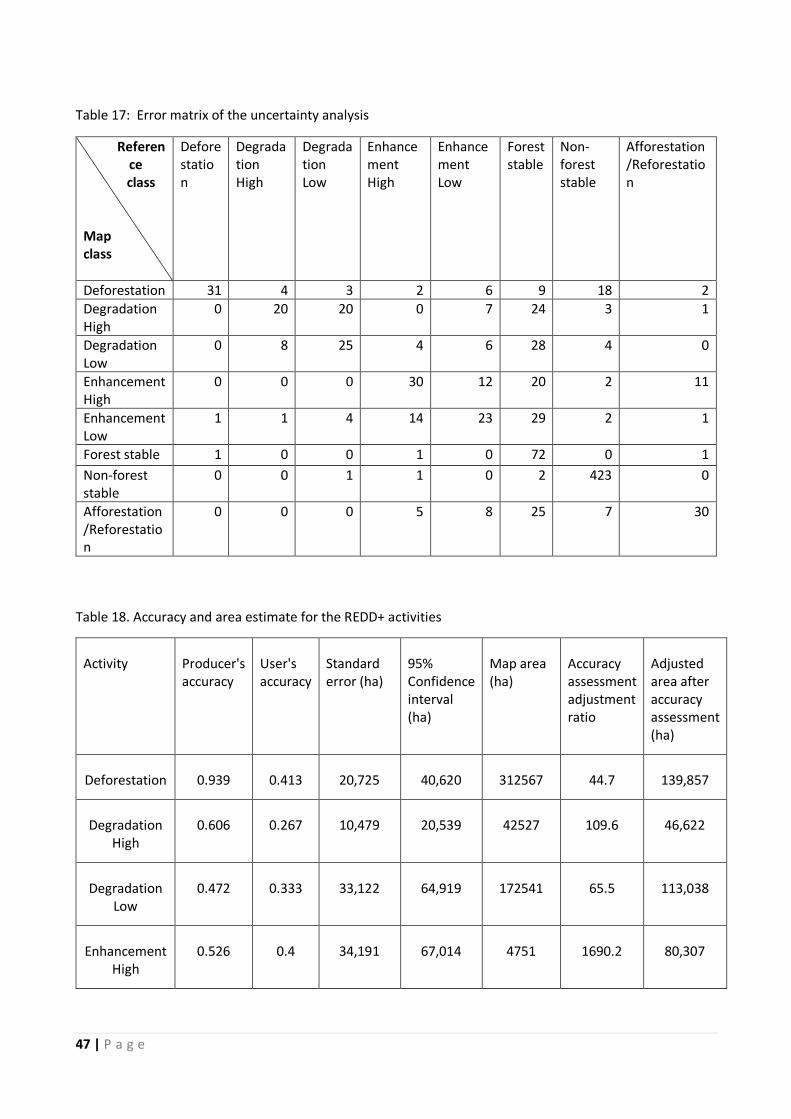
47 | P a g e
Table 17: Error matrix of the uncertainty analysis
Reference class
Map class
Deforestation
Degradation High
Degradation Low
Enhancement High
Enhancement Low
Forest stable
Non-forest stable
Afforestation/Reforestation
Deforestation 31 4 3 2 6 9 18 2
Degradation High
0 20 20 0 7 24 3 1
Degradation Low
0 8 25 4 6 28 4 0
Enhancement High
0 0 0 30 12 20 2 11
Enhancement Low
1 1 4 14 23 29 2 1
Forest stable 1 0 0 1 0 72 0 1
Non-forest stable
0 0 1 1 0 2 423 0
Afforestation/Reforestation
0 0 0 5 8 25 7 30
Table 18. Accuracy and area estimate for the REDD+ activities
Activity Producer's accuracy
User's accuracy
Standard error (ha)
95% Confidence interval (ha)
Map area (ha)
Accuracy assessment adjustment ratio
Adjusted area after accuracy assessment (ha)
Deforestation 0.939 0.413 20,725 40,620 312567 44.7 139,857
Degradation High
0.606 0.267 10,479 20,539 42527 109.6 46,622
Degradation Low
0.472 0.333 33,122 64,919 172541 65.5 113,038
Enhancement High
0.526 0.4 34,191 67,014 4751 1690.2 80,307

48 | P a g e
Activity Producer's accuracy
User's accuracy
Standard error (ha)
95% Confidence interval (ha)
Map area (ha)
Accuracy assessment adjustment ratio
Adjusted area after accuracy assessment (ha)
Enhancement Low
0.371 0.307 14,493 28,406 15500 483.6 74,955
Forest stable 0.344 0.96 51,439 100,821 784193 130.2 1,020,652
Non-forest stable
0.922 0.991 64,147 125,728 13174944 99.9 13,161,316
Afforestation/ Reforestation
0.652 0.4 18,619 36,493 249977 48.1 120,252
Table 19: Zone area adjustment after accuracy assessment
BFI
zones
BFI zone area
(ha)
zones area after
accuracy assessment
(ha)
zone area
adjustment ratio
Coastal 991051 1053546 0.940681
Hill 1716157 1547084 1.109284
Sal 534433 538738 0.992009
Sundarban 631386 748189.6 0.843884
Village 10883974 10869442 1.001337
6.2 Uncertainty analysis of Emission Factors
The uncertainty of the emission and removal factors derives from the confidence interval of the aboveground
biomass estimates provided in Table 10. In each polygon of the spatial database a local emission and removal
factor is given based on the aboveground biomass in 2000 and 2015. Confidence intervals are propagated
using the formulas from the IPCC 2006 Guidelines chapter 3 on Uncertainty,
Utotal; =√𝑈12 + 𝑈22 + ⋯ + 𝑈𝑛2 (Equation 12)
UTotal: The percentage uncertainty in the product of quantities (half the 95 percent confidence interval
divided by the total and expressed as a percentage)
Ui: the percentage uncertainties associated with each of the quantities

49 | P a g e
Utotal = √(𝑈1∗𝑥1)2+(𝑈2∗𝑥2)2 +⋯+(𝑈𝑛∗𝑥𝑛)2
|𝑥1+𝑥2+⋯+𝑥𝑛| (Equation 13)
Utotal: the percentage uncertainty in the sum of quantities (half the 95 percent confidence interval divided
by the total and expressed as a percentage). This term uncertainty is based upon the 95percent confidence
interval
X1 and U1: the uncertainty quantities and the percentage uncertainties associated with them respectively
Therefore:
- the confidence interval of polygon-based emission and removal factors was calculated from the
confidence interval of each land cover AGB using the formula 3.2
- the confidence interval of the emission and removal factors aggregated by land cover change emissions
was calculated from the confidence interval of the emission and removal factors of each polygon in each
land cover change based on formula 3.2
- the confidence interval of the emissions and removals was calculated based on the confidence intervals of
the area and emission and removal factors based on the formula 3.1.
- the confidence interval of the FRL were calculated from the CI of all the activities related with the formula
3.2.
7. National circumstances, future potentials and challenges
Bangladesh has experienced rapid economic growth over the last few decades (GED 2015). According to the
World Bank (2017), the country’s gross domestic product (GDP) grew by 7.1% in 2016. It was the sixth year
in a row that GDP growth was greater than 6%. Most analysts expect this run to continue in the foreseeable
future (World Bank 2017). Bangladesh’s rapid economic growth has brought rapid development particularly
in the infrastructure sector. For example, the GoB with the financial support from the Asian Development
Bank (ADB) has recently started to implement the Chittagong-Cox's Bazar railway project. The development
trend is likely to continue in the future with sustained economic growth which may bring negative impacts
on LULUCF sector. A significant part of the infrastructure projects are expected to go through areas, for
example, in Chattogram, Cox's Bazar districts that are currently forested (MoR 2016). Thus, these projects
may cause deforestation and forest degradation in these areas. However, at this moment, it is difficult to say
what extent of deforestation and forest degradation will be due to this project.
Apart from the developmental impacts as explained above, it is likely that population pressure will continue
to impart negative impacts on forest and tree resources in the country. With 163 million people in 2016
(WorldBank 2017), Bangladesh is the 8th largest country in the world in terms of population. Moreover, it is
one of the world’s most densely populated countries with a population density of more than 1000 people
per sq. km in 2016 (WorldBank 2017). The population growth is likely to continue in the future, meaning the
population pressure on forests, land and other natural resources will intensify. Thus the level of scarcity of
land is also likely to increase, which will intensify the land-use competition. In particular, more forest land is
likely to be converted to agriculture, settlements, and industrial and urban areas to meet growing demand
for food, housing, materials and so on induced by the increasing population.
50 | P a g e
In fact, how the population pressure can rapidly deplete tree and forest resources is demonstrated by the
latest Rohingya refugee crisis that Bangladesh is facing since August 2017. According to reports by various
organizations, about a million Rohingya people have fled to Bangladesh. For making shelters for these people,
over 1200 ha (GoB estimate) of forests have been cleared in Coxes Bazar district. More forests are being
cleared as the Rohingya people themselves collect fuelwood, in thousands of tonnes every day, for cooking
from wooded land in area nearby their shelters.
In addition to the above, a significant amount of forested land is allocated by GoB for conversion to other
land use purposes. According to BFD records, over 45,000 ha of coastal forest land is handed over to the
Ministry of Land in 2014 mainly for conversion to agriculture. This kind of conversion increases pressure on
remaining forests and thus enhances the risks of degradation and deforestation. In addition, forest land
tenure conflicts in the CHT, and encroachment of forest land and boundary conflicts across the country
enhance these risks.
While deforestation and forest degradation are common in some parts of the country, there is also the
possibility of gain in tree and forest cover in other parts through plantations. Notably, coastal
afforestation/reforestation, i.e. forest plantation in the coastal areas, offshore islands and newly accreted
land, and social forestry are a priority of GoB1 (MoEFCC 2009, MoEFCC 2015). The country has been investing
significant amount of money from GoB’s own budget and through financial support from development
partners under different projects and programs to increase forest cover area. In Particular, Coastal
afforestation/reforestation efforts significantly increase forest area each year. Likewise, significant area of
fallow and marginal land (e.g. road sides and canal banks) as well as homestead and degraded land
throughout the country is brought under plantations through the social forestry, and other projects and
programs2. These afforestation/reforestation initiatives have been significant in the past and will continue to
improve tree and forest cover in the country. Nevertheless, one has to remember that Bangladesh regularly
experiences natural disasters like tropical cyclone, tidal surge, flooding, heavy torrential rain causing
landslides in hilly areas, salinity intrusion, river bank erosion and reduced fresh water flow from upstream
(MoEFCC 2009). These all have negative effects on productivity of forests and trees, and thus can limit or
even diminish the positive impacts of afforestation and reforestation initiatives. Climate change is likely to
exacerbate the occurrence and thus intensity of the negative impacts of natural disasters on forest and tree
resources in Bangladesh in the future.
8. Transparent, accurate, complete, and consistent information
One of the key decisions related to FRL (Decision 4/CP.15, paragraph 7) states that FRL should be established
transparently, considering historical data, and adjust for National circumstances. Additionally, there is a
clearly specified guideline stating that “the submissions should contain transparent, complete, consistent
and accurate information”3. These criteria in the context of Bangladesh’s FRL are discussed below:
Transparency
The data used for the construction of FRL are published on the Bangladesh Forest Information System (BFIS).
BFIS is the national information system of BFD, under the Ministry of Environment, Forest and Climate
1 In fact, Bangladesh is a pioneer country for coastal afforestation. 2 The Climate Resilient Participatory Afforestation and Reforestation Project (CRPARP), completed in December 2016,
is one of the most recent examples of such projects. Under this project, 17500 ha land in both coastal and hilly areas of
Bangladesh was afforested and reforested. The project was jointly funded by the World Bank and GoB. 3 UNFCCC, Annex to Decision 12/CP.17

51 | P a g e
change, for planning, implementing and monitoring forest management and conservation. The national land
cover maps of 2000 and 2015 are published on the BFIS Geoportal. The country-specific emission factors are
available on the forest emission factor database of BFIS and the tree cover data will be published on the BFIS
Geoportal. The FRL data can be shared upon request with users based on the data sharing policy of BFD.
Accuracy
Accuracy assessment has been conducted for the activity data and emission factors used for the construction
of FRL. The confidence intervals of above-ground biomass stocks are shown in Table 10. The accuracy
assessment of activity data is described in section 6.1.3. Effort has been taken to ensure that the data and
information is as accurate as possible by involving the academia offering forestry education in Bangladesh.
Completeness
Complete means the provision of information that allows for the reconstruction of FRL. The proposed FRL is
based on national-level data that were disaggregated into the five zones of Bangladesh. Emissions and
removals were provided at a zone and national level. In addition, all the information and data that was used
for the development of FRL is provided in this report to allow reconstruction.
Consistency
The FRL has been prepared with the aim to maintain consistency with the LULUCF sector in the second
(MoEFCC 2012) and third national communication (TNC). Both FRL and GHG inventory for the TNC considered
CO2 as the major gas and above-ground biomass as the major carbon pool. The FAO forest definition was
used by the GHG inventory for the third national communications (ready for submission to UNFCCC) and the
FRL used the same definition with slight modification. However, there are also some differences between
the two reports. These differences are described below and in Table 20.
The forest definition that was used in the FRL does not include land that is predominantly under rural
settlement, agricultural or urban land use. On the other hand, in the GHG inventory for the TNC, trees in
‘village’ land category with tree cover 30-70% or greater than 70% were considered as forest trees.
FRL is based on improved data recently developed and robust methodologies. The activity data of FRL are
based on Landsat and SPOT-based maps of 2000 and 2015 respectively, while the GHG inventory for TNC is
not based on geospatial data rather than on data published on various reports from various sources. In the
FRL, improved emission factors were used considering data obtained from a national and sub-national forest
inventories conducted by BFD (Tier 2). However, in the GHG inventory of second and third national
communications default emission factors were used (Tier 1). In the FRL, emissions and removals were
calculated from forest converted to other land, forestland remaining forestland and other land converted to
forest while in the GHG inventory for TNC, CO2 emissions were calculated from fuelwood removal, conversion
of forest to other land use and soil carbon stock changes.
Therefore, data sources, reporting period, methods used for FRL differ from the latest GHG inventory
published in the TNC. However, an update of the GHG inventory will be published with Bangladesh’s first
Biennial Update report (BUR) and fourth national communication and that this will be consistent with the
FRL in terms of forest definition, emission factors, activity data and carbon pools.

52 | P a g e
Table 20: Differences between GHG inventory for third national communication and FRL for REDD+.
LULUCF sector for TNC FRL for REDD+
IPCC
Guidelines
Mostly on the revised 1996 Guidelines Only 2006 Guidelines
Time Period
GHG emissions and removals were considered for the period 2006 – 2012.
GHG emissions and removals were calculated at the national scale for the reference period 2000 - 2015
Forest
definition
• Forest was defined as “land spanning more than 0.5 ha with more than 10% tree cover having trees attaining more than 5 m in height “(NFA 2005 – 2007)
• it does not include land that is under ‘Built-up area’, ‘Village’, ‘Cultivated land’ and ‘Inland water’.
• Trees in the ‘Village’ category with tree cover 30-70%, greater than 70% were considered as forest trees.
• The NFA 2005-2007 definition was slightly modified to include goran species of Sundarban.
• Forest was defined as “Land spanning more than 0.5 hectares with trees higher than 5 meters (exception for Goran species Ceriops decandra with height of 2 meters) and a canopy cover of more than 10 percent (%), or trees able to reach these thresholds in situ”.
Land
representation
Land representation includes one forest category for forest land along with the other classes. They are as follows:
1: forest land 2: cultivated land 3: village land 4: built-up area 5: inland water
The land representation in FRL includes 6 forest land classes along with other classes. Forest categories are as below:
1: Forest Tree Dominated Area (Terrestrial) 2: Mangrove Forest 3: Mangrove Plantation 4: Plain Land Forest (Sal Forest) 5: Rubber Plantation 6: Forest Tree Dominated Area (Aquatic/ Regularly Flooded
Activity data
The report is not based on geospatial data rather than on data published on various reports from various sources (secondary data).
FRL report used geospatial data. They are
• National land cover maps 2000 (Landsat-based)
• National land cover map 2015 (SPOT-based)
• Tree cover change map 2000-2015
Emission
factors
The report used the IPCC default values for the calculation of above ground biomass and carbon.
Previous forest inventory data harmonized and were used to calculate the above ground biomass and carbon of the land cover classes (Tier 2).
Carbon pools
• Pools included are: above ground biomass and soil carbon pool.
• Soil data of agro ecological zones are collected from 2 sources by SRDI and used for soil emission reporting.
• CO2 emissions from soil carbon from all types of land-use is 3247 Giga grams CO2.
• Pools included in FRL are: above-and below-ground biomass.
• Due to lack of forest soil data, Soil pool is not considered by the FRL report. The soil pool will be included in future submissions considering the updated soil data obtained from the forest areas under Bangladesh Forest Inventory (2016-2019).
53 | P a g e
LULUCF sector for TNC FRL for REDD+
Gases Carbon dioxide (CO2) considered for reporting.
Carbon dioxide (CO2) considered for reporting.
Activities • CO2 emissions were calculated for the following activities:
o fuel wood removal o conversion of forest land to
other land o soil carbon stock changes
• GHG emissions and removals were calculated for the following REDD+ activities:
o Deforestation: forest converted to other land
o Forest degradation: forest land remaining forest
o Afforestation/reforestation: Other land converted to forest
o Forest restoration: forest land remaining forest
‘Forestland’ under the control of BFD
Areas of forest land differ because the TNC report used somewhat old figures.
Forestland areas are calculated recently, and the values reported in FRL have been updated.
9. Future improvement opportunities
Potential improvements in future FRL submissions will may include:
• Two national land cover maps are being developed for the years 2005 and 2010 but not ready at the time
of the submission. They might be added to a modified submission to understand better the forest change
trends over the 15-year period 2000-2015.
• Country-specific emission factors for soil, deadwood and litter are being collected from the ongoing
Bangladesh Forest Inventory and will be included in the future improvements of FRL.
• Forest boundary delineation to support better estimation of the activity data for each zone is ongoing
activity of BFD. Currently, BFD is involved in scaling up the boundary delineation with the support from
several projects.
• ‘Sustainable Forest Management’ and ‘Conservation’ practice should be streamlined with set guidelines
and certification to consider as ‘REDD+ activity’ for future FRL framing.
• Adoption of procedure/methods for considering non-CO2 emissions from forest fires is being considered
by the BFD.
• To institutionalize the REDD+ activities, a REDD+ unit in BFD has been proposed in the updated
organogram which will be equipped with trained personnel and technology supports for regular FRL
computation, result generation and archiving of data during REDD+ piloting and results-based payment
phase.
• Regular trainings would be carried out of BFD officials with the technical support of experts to build
capability for activity data analysis and reporting for any period within and beyond the FRL reference,
and result period.
• Suitable capacity building program will be carried out on forest monitoring and assessment, which will
include remote sensing & GIS analysis and ground-based forest inventories.
• An update of the GHG inventory will be prepared with Bangladesh’s first Biennial Update report (BUR)
and that this will be more consistent with the FRL in terms of forest definition, emission factors, activity
data, carbon pools etc. BFD will work closely with the Department of Environment to ensure consistency
for the preparation of the upcoming BUR.
54 | P a g e
10. References
1. BBS, 2017. "Bangladesh Statistics 2017". Bangladesh Bureau of Statistics (BBS), Statistics and Informatics Division (SID), Ministry of Planning. Dhaka, Bangladesh.
2. BBS, 2015, "Bangladesh Population and Housing Census 2011", Bangladesh Bureau of Statistics (BBS), Statistics and Informatics Division (SID), Ministry of Planning. Dhaka, Bangladesh.
3. BFD, 2007. "National forest and tree resources assessment 2005-2007 Bangladesh". Bangladesh Forest Department (BFD), Food and Agriculture Organization of the United Nations. Dhaka, Bangladesh.
4. BFD, 2016. "Bangladesh Forestry Master Plan 2017-2036". Bangladesh Forest Department (BFD). Dhaka, Bangladesh.
5. BFD, 2016. "Protocol for Land Features Description In Bangladesh". Dhaka, Bangladesh. 6. BFD, 2016. "Zoning for Tree and Forest Assessment in Bangladesh". Bangladesh Forest Department,
Ministry of Environment, Forest and Climate Change, Government of the People's Republic of Bangladesh. Dhaka, Bangladesh.
7. BFD, 2017. "Forest land data based on government gazette notification Development Planning Unit". Dhaka, Bangladesh.
8. BFD, 2018. "Drivers of deforestation and forest degradation in Bangladesh: Draft report". UN-REDD Bangladesh National Program, Bangladesh Forest Department (BFD), Ministry of Environment, Forest and Climate Change. Dhaka, Bangladesh.
9. Brown, M. G., E. R. Humphreys, T. R. Moore, N. T. Roulet and P. M. Lafleur, 2014. "Evidence for a nonmonotonic relationship between ecosystem‐scale peatland methane emissions and water table depth". Journal of Geophysical Research: Biogeosciences. 119(5): 826-835.
10. Chave, J., M. Réjou‐Méchain, A. Búrquez, E. Chidumayo, M. S. Colgan, W. B. Delitti, A. Duque, T. Eid, P. M. Fearnside and R. C. Goodman, 2014. "Improved allometric models to estimate the aboveground biomass of tropical trees". Global change biology. 20(10): 3177-3190.
11. Cochran, W. G., 1977. Sampling Techniques. New York, John Willey & Sons 12. FAO, 2015. "Bangladesh - Global Forest Resources Assessment 2015 – Country Report". Rome, Italy. 13. FAO, 2015. "Global forest resource assessment, Country report Bangladesh, ". Bangladesh Forest
Department, Food and Agriculture Organization of the United Nations. Dhaka, Bangladesh 14. FAO, 2016 "Map Accuracy Assessment and Area Estimation: A Practical Guide". Food and
Agriculture Organization of the United Nations. Rome. 15. FAO and UNDP, 1988. "Land resources appraisal of Bangladesh for agricultural development". Food
and Agriculture Organization of the United Nations, United Nations Development Programme. Rome, Italy. http://www.fao.org/docrep/field/009/s7223e/s7223e.pdf.
16. Franceschini, G., R. Jalal, M. S. Islam, Z. Iqbal, T. Aziz, A. Begum and M. Henry, 2016. "Production chain for land cover mapping in Bangladesh.". Bangladesh Forest Department, Food and Agriculture Organization of the United Nations. Dhaka, Bangladesh.
17. GED, 2013. "National Sustainable Development Strategy 2010-21 (NSDS)". General Economics Division (GED),Planning Commission, Government of the People’s Republic of Bangladesh. Dhaka, Bangladesh.
18. GED, 2015. "7th Five Year Plan (2016-2020) ". General Economics Division (GED),Planning Commission, Government of the People’s Republic of Bangladesh. Dhaka, Bangladesh.
19. GoB, 2017. "National Land Cover Map of Bangladesh 2015". Bangladesh Forest Department, Ministry of Environment, Forest and Climate Change, Government of the People's Republic of Bangladesh. Dhaka, Bangladesh.
20. GoB, 2017. "National Land Cover Map of Bangladesh 2000". Bangladesh Forest Department, Ministry of Environment, Forest and Climate Change, Government of the People's Republic of Bangladesh. Dhaka, Bangladesh.
21. GoB, 2017. " Land Representation System of Bangladesh". Bangladesh Forest Department,Ministry of Environment, Forest and Climate Change, Government of the People's Republic of Bangladesh. Dhaka, Bangladesh.
55 | P a g e
22. Hadi, A., T. Shabnam and R. Jalal, 2016. "Proceedings of the National Consultation Conference on Land Cover/Use Classification in Bangladesh ". Dhaka, Bangladesh.
23. Hijmans, R. J., S. E. Cameron, J. L. Parra, P. G. Jones and A. Jarvis, 2005. "Very high resolution interpolated climate surfaces for global land areas". International Journal of Climatology. 25(15): 1965-1978. https://10.1002/joc.1276.
24. IPCC, 2006. Agriculture, Forestry and Other Land Use (Volume 4): In 2006 IPCC Guidelines for National Greenhouse Gas Inventories, Intergovernmental Panel on Climate Change (IPCC)
25. Islam, M. S., Z. Iqbal, G. Franceschini, R. Jalal, T. Aziz, A. Begum, S. B. Shewli, M. F. Shaunak, M. N. Jahan, S. Haque, M. Rahman, A. Hadi, M. A. T. Pramanik, M. Akhter, L. Costello, T. Udita, K. Z. Tasnim and M. Henry, 2016. "Legend for National Land Cover Map". Bangladesh Forest Department, Food and Agriculture Organization of the United Nations. Dhaka, Bangladesh.
26. Islam, S., 2004. "Stratified Two-Stage Sampling (Self-Weighted) for assessment of village forest resources". Journal of Tropical Forest Science. 9-16.
27. Jarvis, A., H. I. Reuter, A. Nelson and E. Guevara, 2008. "Hole-filled SRTM for the globe Version 4, available from the CGIAR-CSI SRTM 30m Database (http://srtm.csi.cgiar.org)".
28. Latif, M. A., R. M. Chowdhury and M. Netzer, 2015. "Forest Carbon Inventory 2014 at Eight Protected Areas in Bangladesh". CREL Project Bangladesh Forest Department and Winrock International,. Dhaka, Bangladesh.
29. Masud, M. M., M. Moniruzzaman and M. M. Rashid, 2011. "Management and conservation of organic peat soils for sustainable crop production in Bangladesh". Bulletin of the Institute of Tropical Agriculture, Kyushu University. 34(1): 93-101.
30. MoEFCC, 2009. "Bangladesh Climate Change Strategy and Action Plan (BCCSAP), 2009". Ministry of Environment, Forest and Climate Change (MoEFCC), Government of the People’s Republic of Bangladesh. Dhaka, Bangladesh
31. MoEFCC, 2012. "Second National Communication of Bangladesh to the United Nations Framework Convention on Climate Change". Ministry of Environment, Forest and Climate Change (MoEFCC), Government of the People’s Republic of Bangladesh. Dhaka, Bangladesh.
32. MoEFCC, 2015. "Bangladesh’s Intended Nationally Determined Contributions". Ministry of Environment, Forest and Climate Change (MoEFCC), Government of the People’s Republic of Bangladesh. Dhaka,Bangladesh
33. MoEFCC, 2016. "Volume: Energy and Minerals in Bangladesh National Conservation Strategy (NCS) (2016-2031)". Ministry of Environment, Forest and Climate Change (MoEFCC), Government of the People’s Republic of Bangladesh. Dhaka, Bangladesh.
34. Mohammad, N., 2013. "Empirical findings on the forest law and policy in Bangladesh". Agriculture, Forestry and Fisheries. 2(2): 49-66.
35. MoLJPA, 1927. "The Forest Act 1927". Ministry of Law Justice and Parliamentary Affairs (MoLJPA). 36. MoR, 2016. "Environmental impact assessment - BAN: SASEC Chittagong – Cox’s Bazar Railway
Project, Phase I. Assessement report prepared by the Ministry of Railways, GoB for the Asian Development Bank.".
37. Potapov, P., B. Siddiqui, Z. Iqbal, T. Aziz, B. Zzaman, A. Islam, A. Pickens, Y. Talero, A. Tyukavina and S. Turubanova, 2017. "Comprehensive monitoring of Bangladesh tree cover inside and outside of forests, 2000–2014". Environmental Research Letters. 12(10): 104015.
38. Rahman, M. M., M. N. I. Khan, A. F. Hoque and I. Ahmed, 2015. "Carbon stock in the Sundarban mangrove forest: spatial variations in vegetation types and salinity zones". Wetlands Ecology and Management. 23(2): 269-283.
39. Rashid, A. M., D. Craig, M. I. Jeffery and N. A. Khan, 2013. "Forest protected area governance in Bangladesh: a focus on the legal and policy framework". Chinese Journal of Population Resources and Environment. 11(4): 345-351.
40. Sola, G., L. Costello, Z. Ikbal, M. Akhter, R. H. Mukul, M. Akther, B. N. Siddiqui, M. Hossain, A. Poultouchidou, K. Johnson and M. Henry, 2016. "Harmonization of sub-national forest inventories to improve national biomass estimates: a methodological approach in Bangladesh. Manuscript submitted for publication".
56 | P a g e
41. Tasnim, K. Z., G. Franceschini and R. Jalal, 2017. "Proceedings of the workshop on the accuracy assessment and quality checking of land cover map of Bangladesh 2015". Bangladesh Forest Department, Food and Agriculture Organization of the United Nations. Dhaka, Bangladesh.
42. UNFCCC, 2011. "16th session period of the Conference of the Parties Report, Cancun (Nov. 29th to Dec. 10th, 2010). FCCC/CP/2010/7/Add.1". https://unfccc.int/resource/docs/2010/cop16/eng/07a01.pdf.
43. UNFCCC, 2014. "19th session period of the Conference of the Parties Report, Warsaw (Nov 11th toNov. 22nd, 2012) FCCC/CP/2013/10/Add. 1". http://unfccc.int/resource/docs/2013/cop19/eng/10a01.pdf.
44. van Lierop, P., E. Lindquist, S. Sathyapala and G. Franceschini, 2015. "Global forest area disturbance from fire, insect pests, diseases and severe weather events". Forest Ecology and Management. 352: 78-88.
45. WorldBank, 2017. "World Bank open data". World Bank http://data.worldbank.org/
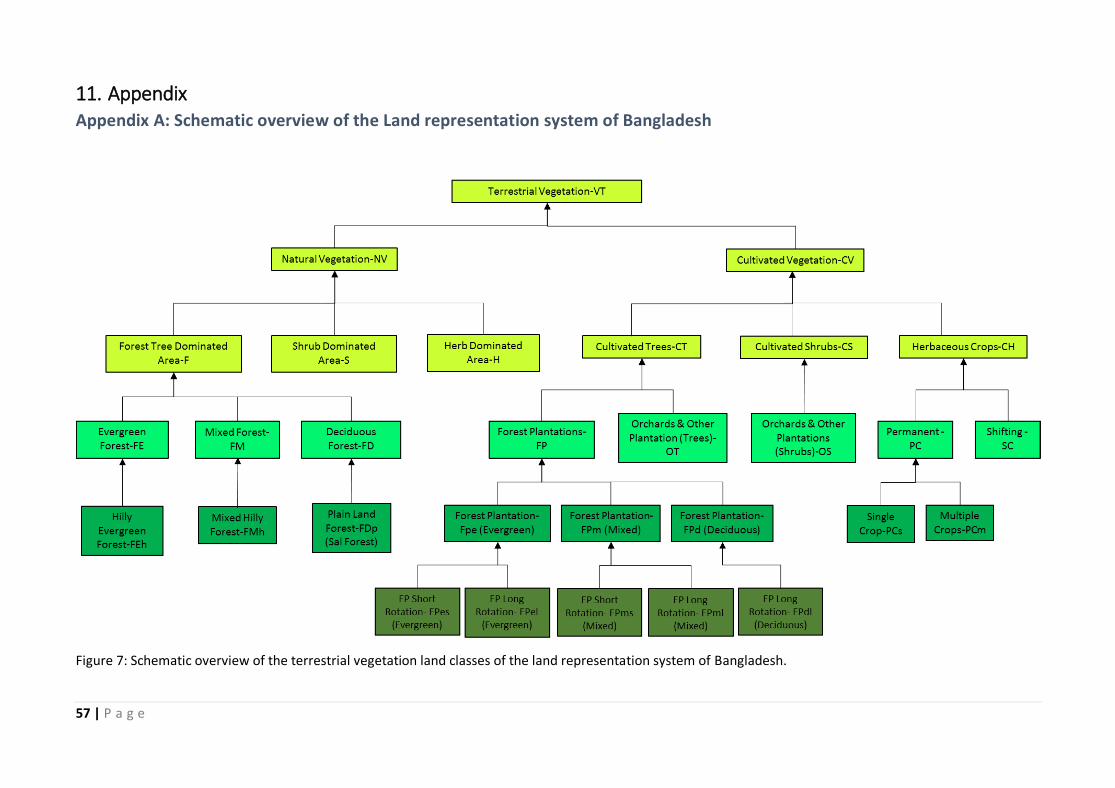
57 | P a g e
11. Appendix Appendix A: Schematic overview of the Land representation system of Bangladesh
Figure 7: Schematic overview of the terrestrial vegetation land classes of the land representation system of Bangladesh.

58 | P a g e
Figure 8: Schematic overview of the aquatic or regularly flooded vegetation land classes of the land representation system of Bangladesh.
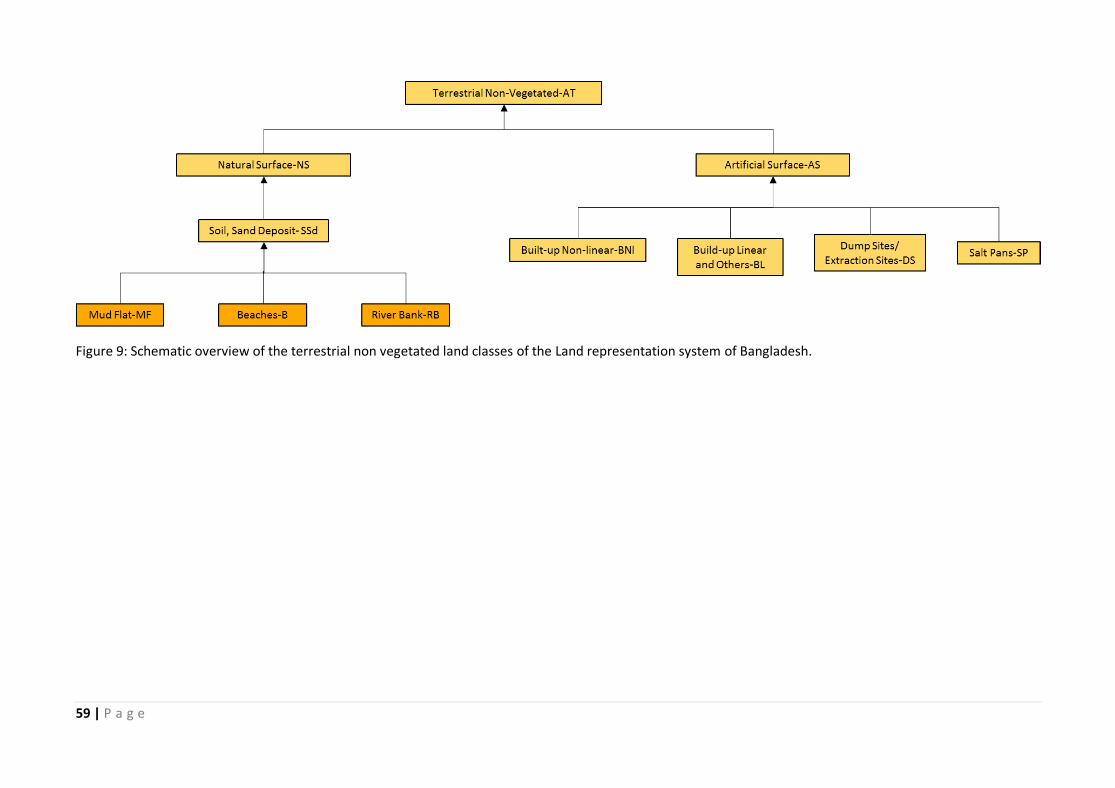
59 | P a g e
Figure 9: Schematic overview of the terrestrial non vegetated land classes of the Land representation system of Bangladesh.
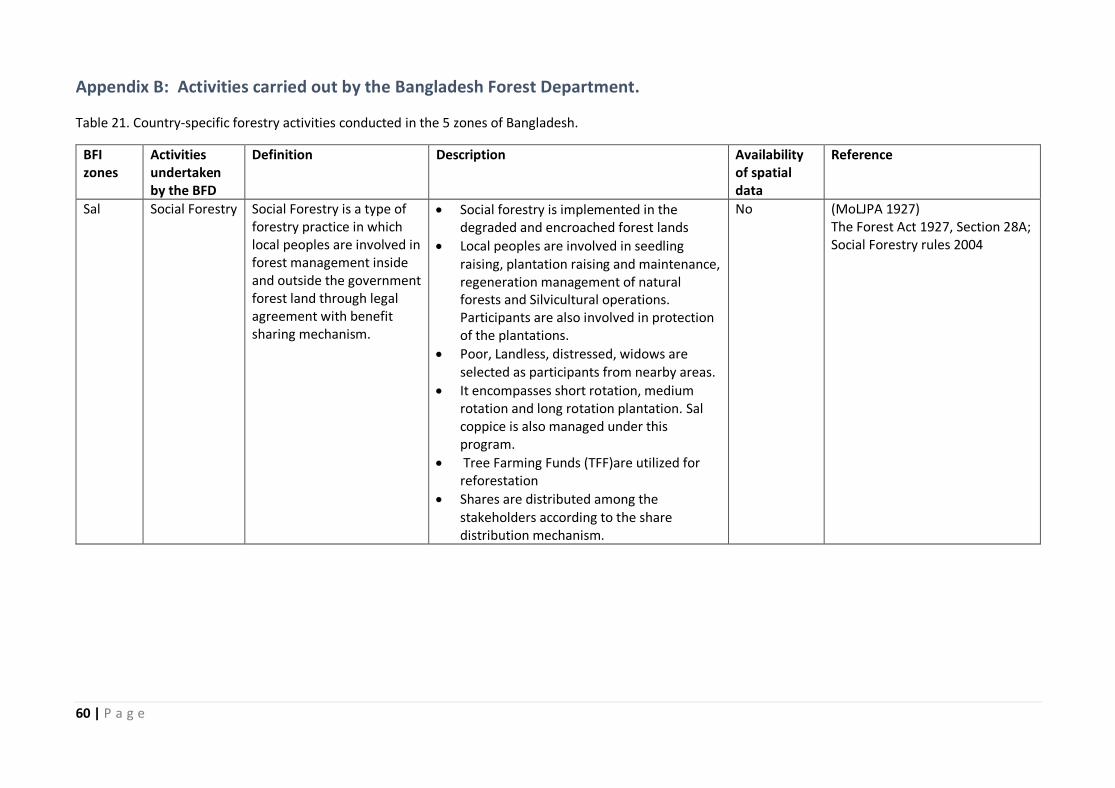
60 | P a g e
Appendix B: Activities carried out by the Bangladesh Forest Department.
Table 21. Country-specific forestry activities conducted in the 5 zones of Bangladesh.
BFI zones
Activities undertaken by the BFD
Definition Description Availability of spatial data
Reference
Sal Social Forestry Social Forestry is a type of forestry practice in which local peoples are involved in forest management inside and outside the government forest land through legal agreement with benefit sharing mechanism.
• Social forestry is implemented in the degraded and encroached forest lands
• Local peoples are involved in seedling raising, plantation raising and maintenance, regeneration management of natural forests and Silvicultural operations. Participants are also involved in protection of the plantations.
• Poor, Landless, distressed, widows are selected as participants from nearby areas.
• It encompasses short rotation, medium rotation and long rotation plantation. Sal coppice is also managed under this program.
• Tree Farming Funds (TFF)are utilized for reforestation
• Shares are distributed among the stakeholders according to the share distribution mechanism.
No (MoLJPA 1927) The Forest Act 1927, Section 28A; Social Forestry rules 2004
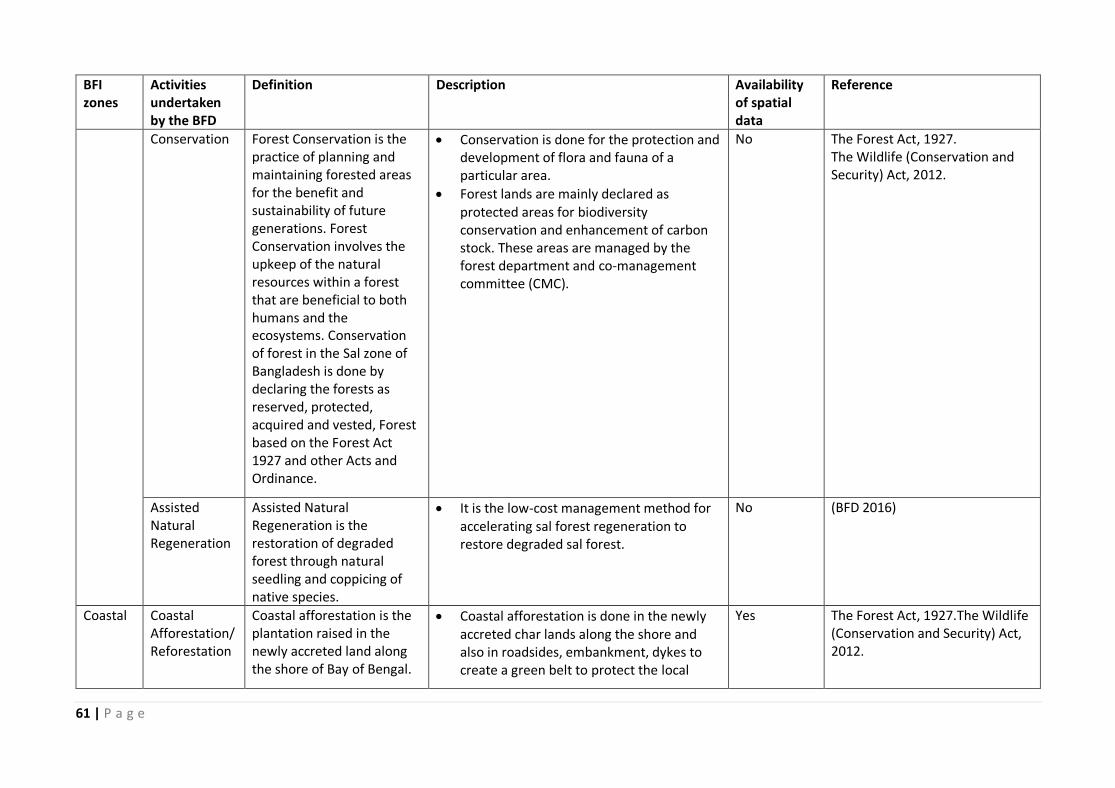
61 | P a g e
BFI zones
Activities undertaken by the BFD
Definition Description Availability of spatial data
Reference
Conservation Forest Conservation is the practice of planning and maintaining forested areas for the benefit and sustainability of future generations. Forest Conservation involves the upkeep of the natural resources within a forest that are beneficial to both humans and the ecosystems. Conservation of forest in the Sal zone of Bangladesh is done by declaring the forests as reserved, protected, acquired and vested, Forest based on the Forest Act 1927 and other Acts and Ordinance.
• Conservation is done for the protection and development of flora and fauna of a particular area.
• Forest lands are mainly declared as protected areas for biodiversity conservation and enhancement of carbon stock. These areas are managed by the forest department and co-management committee (CMC).
No The Forest Act, 1927. The Wildlife (Conservation and Security) Act, 2012.
Assisted Natural Regeneration
Assisted Natural Regeneration is the restoration of degraded forest through natural seedling and coppicing of native species.
• It is the low-cost management method for accelerating sal forest regeneration to restore degraded sal forest.
No (BFD 2016)
Coastal Coastal Afforestation/Reforestation
Coastal afforestation is the plantation raised in the newly accreted land along the shore of Bay of Bengal.
• Coastal afforestation is done in the newly accreted char lands along the shore and also in roadsides, embankment, dykes to create a green belt to protect the local
Yes The Forest Act, 1927.The Wildlife (Conservation and Security) Act, 2012.
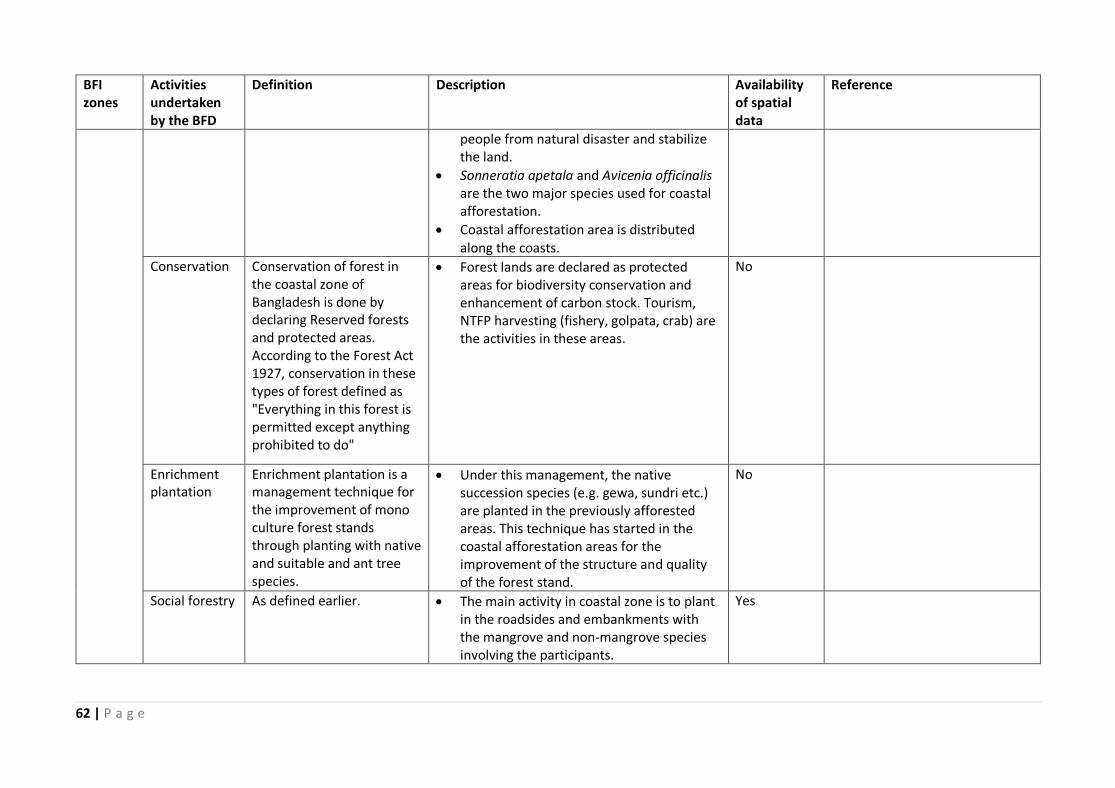
62 | P a g e
BFI zones
Activities undertaken by the BFD
Definition Description Availability of spatial data
Reference
people from natural disaster and stabilize the land.
• Sonneratia apetala and Avicenia officinalis are the two major species used for coastal afforestation.
• Coastal afforestation area is distributed along the coasts.
Conservation Conservation of forest in the coastal zone of Bangladesh is done by declaring Reserved forests and protected areas. According to the Forest Act 1927, conservation in these types of forest defined as "Everything in this forest is permitted except anything prohibited to do"
• Forest lands are declared as protected areas for biodiversity conservation and enhancement of carbon stock. Tourism, NTFP harvesting (fishery, golpata, crab) are the activities in these areas.
No
Enrichment plantation
Enrichment plantation is a management technique for the improvement of mono culture forest stands through planting with native and suitable and ant tree species.
• Under this management, the native succession species (e.g. gewa, sundri etc.) are planted in the previously afforested areas. This technique has started in the coastal afforestation areas for the improvement of the structure and quality of the forest stand.
No
Social forestry As defined earlier. • The main activity in coastal zone is to plant in the roadsides and embankments with the mangrove and non-mangrove species involving the participants.
Yes
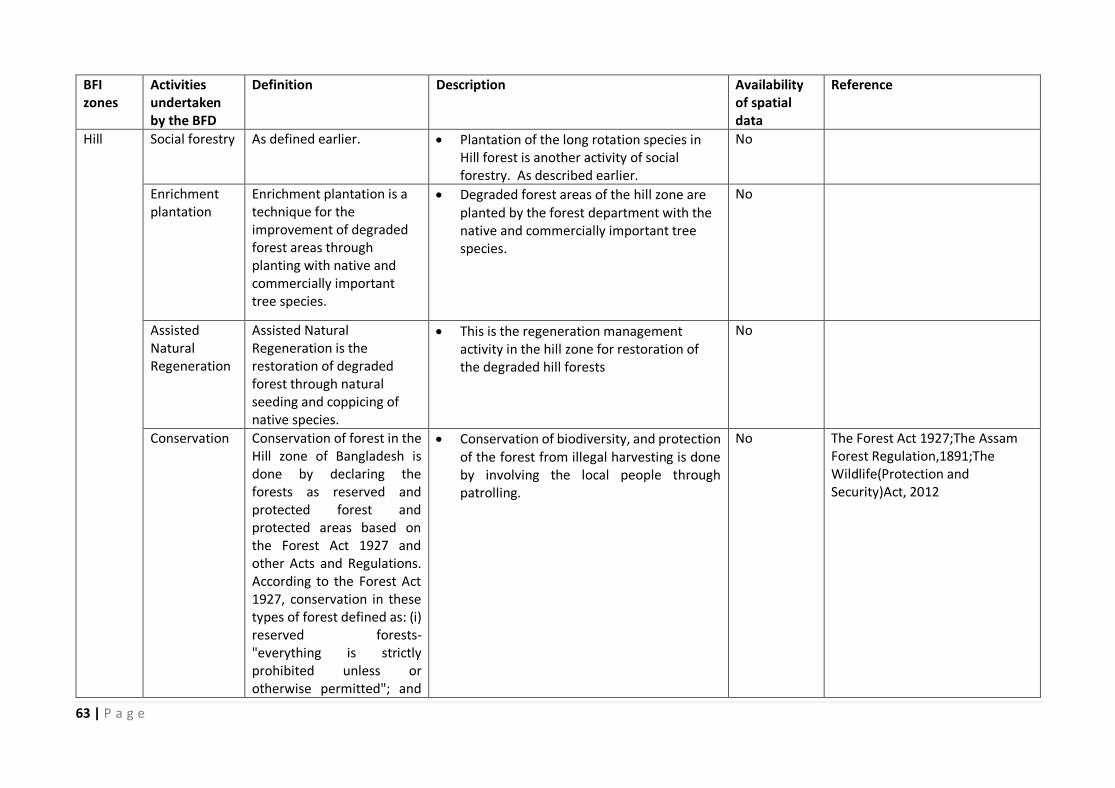
63 | P a g e
BFI zones
Activities undertaken by the BFD
Definition Description Availability of spatial data
Reference
Hill Social forestry As defined earlier. • Plantation of the long rotation species in Hill forest is another activity of social forestry. As described earlier.
No
Enrichment plantation
Enrichment plantation is a technique for the improvement of degraded forest areas through planting with native and commercially important tree species.
• Degraded forest areas of the hill zone are planted by the forest department with the native and commercially important tree species.
No
Assisted Natural Regeneration
Assisted Natural Regeneration is the restoration of degraded forest through natural seeding and coppicing of native species.
• This is the regeneration management activity in the hill zone for restoration of the degraded hill forests
No
Conservation Conservation of forest in the Hill zone of Bangladesh is done by declaring the forests as reserved and protected forest and protected areas based on the Forest Act 1927 and other Acts and Regulations. According to the Forest Act 1927, conservation in these types of forest defined as: (i) reserved forests- "everything is strictly prohibited unless or otherwise permitted"; and
• Conservation of biodiversity, and protection of the forest from illegal harvesting is done by involving the local people through patrolling.
No The Forest Act 1927;The Assam Forest Regulation,1891;The Wildlife(Protection and Security)Act, 2012

64 | P a g e
BFI zones
Activities undertaken by the BFD
Definition Description Availability of spatial data
Reference
(ii) protected forests-"Everything in this forest is permitted except anything prohibited to do."
Watershed management
This is a management practice to protect the watershed area by conserving the forest and without hampering the water flow
• In some places of the hill zone, part of the reserved forest (e.g. Kassalong reserve) is conserved for watershed management.
• Water flows are not allowed to hamper in the watershed areas.
No
Development of NTFP plantation
This is defined as encouraging plantations of bamboo, cane, murta, medicinal plants usually found in the wild through subsidies and technical support, and later on promotion of handicrafts made from bamboo, Murta etc.
• This activity involves planting bamboo, murta, cane and other medicinal plants with the other plantations.
No
Livelihood support to forest dependent communities
This is defined as assessing the forest dependent communities livelihood needs through participatory appraisal, and involving other stakeholders to link identified needs and
• Livelihood support training provided to the forest depended communities like value added handcrafts production from forest products like cane, bamboo murta etc.
No (BFD 2016)
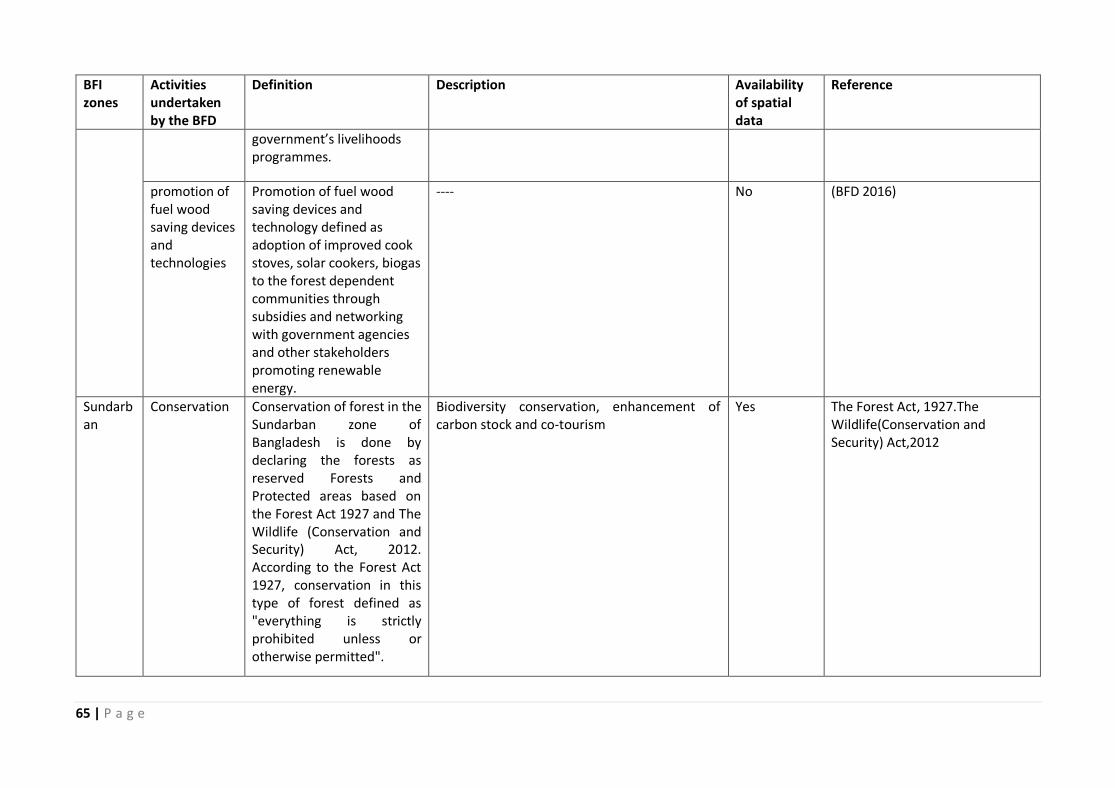
65 | P a g e
BFI zones
Activities undertaken by the BFD
Definition Description Availability of spatial data
Reference
government’s livelihoods programmes.
promotion of fuel wood saving devices and technologies
Promotion of fuel wood saving devices and technology defined as adoption of improved cook stoves, solar cookers, biogas to the forest dependent communities through subsidies and networking with government agencies and other stakeholders promoting renewable energy.
---- No (BFD 2016)
Sundarban
Conservation Conservation of forest in the Sundarban zone of Bangladesh is done by declaring the forests as reserved Forests and Protected areas based on the Forest Act 1927 and The Wildlife (Conservation and Security) Act, 2012. According to the Forest Act 1927, conservation in this type of forest defined as "everything is strictly prohibited unless or otherwise permitted".
Biodiversity conservation, enhancement of carbon stock and co-tourism
Yes The Forest Act, 1927.The Wildlife(Conservation and Security) Act,2012
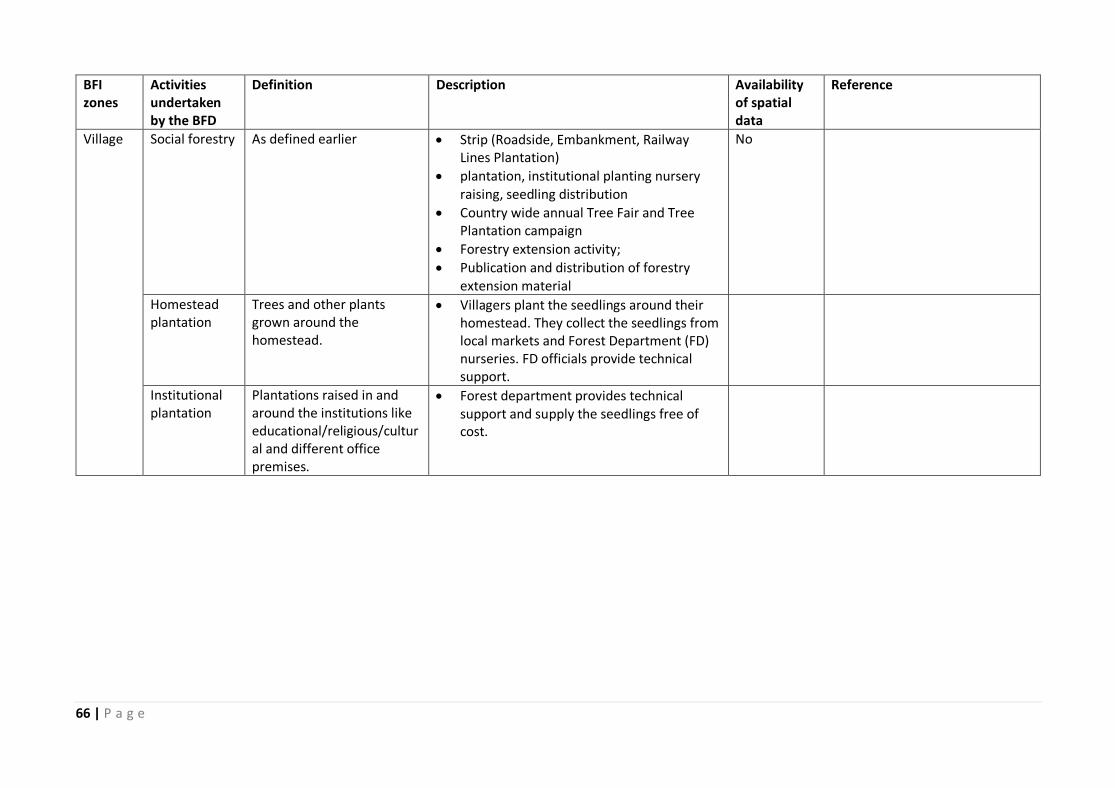
66 | P a g e
BFI zones
Activities undertaken by the BFD
Definition Description Availability of spatial data
Reference
Village Social forestry As defined earlier • Strip (Roadside, Embankment, Railway Lines Plantation)
• plantation, institutional planting nursery raising, seedling distribution
• Country wide annual Tree Fair and Tree Plantation campaign
• Forestry extension activity;
• Publication and distribution of forestry extension material
No
Homestead plantation
Trees and other plants grown around the homestead.
• Villagers plant the seedlings around their homestead. They collect the seedlings from local markets and Forest Department (FD) nurseries. FD officials provide technical support.
Institutional plantation
Plantations raised in and around the institutions like educational/religious/cultural and different office premises.
• Forest department provides technical support and supply the seedlings free of cost.
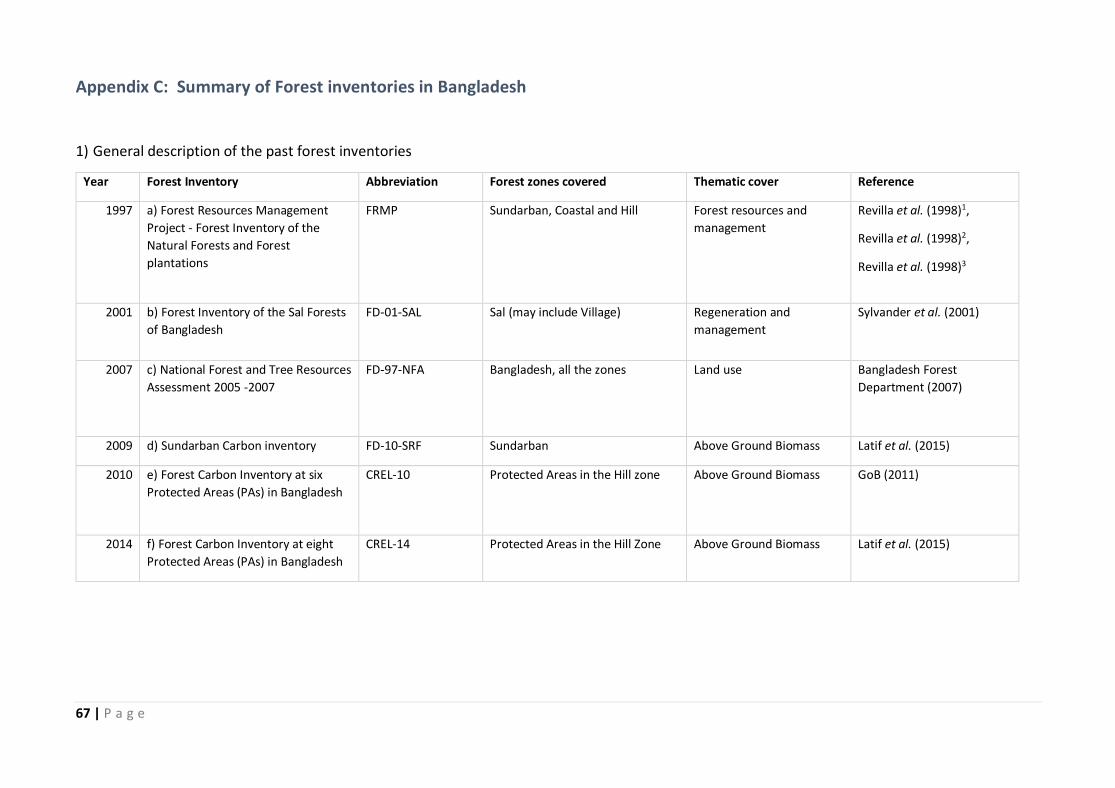
67 | P a g e
Appendix C: Summary of Forest inventories in Bangladesh
1) General description of the past forest inventories
Year Forest Inventory Abbreviation Forest zones covered Thematic cover Reference
1997 a) Forest Resources Management
Project - Forest Inventory of the
Natural Forests and Forest
plantations
FRMP Sundarban, Coastal and Hill Forest resources and
management
Revilla et al. (1998)1,
Revilla et al. (1998)2,
Revilla et al. (1998)3
2001 b) Forest Inventory of the Sal Forests
of Bangladesh
FD-01-SAL Sal (may include Village) Regeneration and
management
Sylvander et al. (2001)
2007 c) National Forest and Tree Resources
Assessment 2005 -2007
FD-97-NFA Bangladesh, all the zones Land use Bangladesh Forest
Department (2007)
2009 d) Sundarban Carbon inventory FD-10-SRF Sundarban Above Ground Biomass Latif et al. (2015)
2010 e) Forest Carbon Inventory at six
Protected Areas (PAs) in Bangladesh
CREL-10 Protected Areas in the Hill zone Above Ground Biomass GoB (2011)
2014 f) Forest Carbon Inventory at eight
Protected Areas (PAs) in Bangladesh
CREL-14 Protected Areas in the Hill Zone Above Ground Biomass Latif et al. (2015)

68 | P a g e
2) Forest inventory designs
Projects No. plots
final
No. trees
final
Plot Shape Nested
subplot
Min
dbh
(cm)
Max
dbh
(cm)
Level 1
Condition
Level 1 plot
size
Level 2
condition
Level 2 plot
size
Level 3
condition
Level 3
plot size
Tree
height
measured
FRMP 4786 276339 circle yes 0.9 120 DBH > 15
cm
11m radius (5
times)
DBH > 10
cm
5m radius (5
times)
- - All
FD-01-SAL 3693 23809 circle no 9 75 DBH > 10
cm
5.64/7.98m
radius (6
times)
- - - - Sample
FD-07-NFA 251 38993 Rectangle/
circular
(nested)
yes 3 231 DBH > 10
cm
250m x 20m
(4 times)
3.99 radius
(3 times)
- - All
FD-10-SRF 150 22034 circle yes 0.1 170 DBH > 10
cm
10m radius (5
times)
DBH > 2.5
cm
3m radius (5
times)
- - Sample
CREL-10 300 6398 circle yes 10 122 DBH > 10
cm
17.84m radius
(3 times)
DBH > 20
cm
10m radius
(3 times)
DBH > 5
cm
4m radius
(3 times)
Sample
CREL-14 213 1741 circle yes 50 68.5 DBH > 50
cm
17.84m radius
(3 times)
DBH > 20
cm
10m radius
(3 times)
DBH > 5
cm
4m radius
(3 times)
Sample
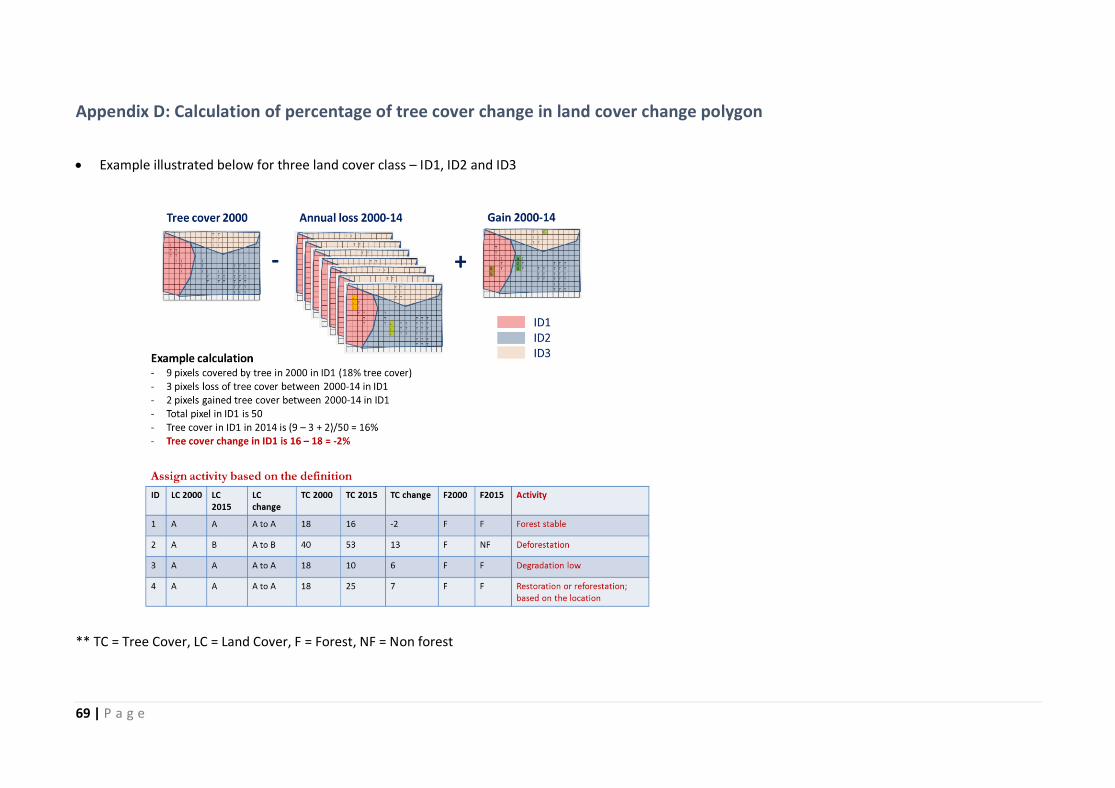
69 | P a g e
Appendix D: Calculation of percentage of tree cover change in land cover change polygon
• Example illustrated below for three land cover class – ID1, ID2 and ID3
** TC = Tree Cover, LC = Land Cover, F = Forest, NF = Non forest

70 | P a g e
Appendix E: Information on the tree height diameter developed for estimating tree heights in Bangladesh:
1) Model parameters for the model selected (Weibull): H = 1.3 + a*(1 - exp(-b*DBH^c)), with DBH in cm and H in m.
Parameters characteristics a b c
Nationwide
o Parameters 25.1025 0.0485 0.9787
Parameters per Forest zone
o Coastal 15.4977 0.04129 1.2194
o Hill 19.5867 0.04129 1.0997
o Sal 80.3322 0.04129 0.4295
o Sundarban 14.2167 0.04129 1.1670
o Village 84.0944 0.04129 0.2910

71 | P a g e
Appendix F: Detailed land use changes matrices, emissions and removal factors and emission and removals per zone and at national level
Table 22: Adjusted areas (in hectares) of deforestation, reforestation and stable non-forest at the National level.
Area adj (ha) 2015
1 2 3 4 5 6 7 8 9 10 11 12 13 14 15
2000
1
264 21 3,554 0 114 690 1,022
129,962
2
114 1 162 48 2,140 0
3
1 31 5,153 912 842 3,199 1,672
0
4
86 55 1,006
4 1 53
85
5
3
142
8 1 63
361
6
2 0
141
7 111
33 1
89,825 1 2,017 11 49 207 611
8 26 702 1,808
0 53 19 25,931 10,948 4,003 1,042 9,104 796 4
9 1,100 26 383 14 167 86 83,435 7,921 6,877,141 7,610 340,335 154,809 94,472 51 1,210
10 15 489 2,402
10 594 6,853 10,691 3,991 28,060 352
11 547 59 94 3 2
1,158 10,571 152,373 1,081 434,374 80,305 13,361 50 1,467
12 33 1,162 4,503 0 0 1 208 19,298 83,830 46,042 41,247 885,686 5,634 32 174
13 164 1 10 0 1
1,449 96 10,295 507 62,428 16,664 2,997,112
548
14
0 3 1,052
10 257 4 12,989
15 109,252
0 0 6,506
4,059 60 4,309 3 812 1,519 7,115
499,085
1: Forest Tree Dominated Area (Terrestrial), 2: Mangrove Forest, 3: Mangrove Plantation, 4: Plain Land Forest (Sal Forest), 5: Rubber Plantation, 6: Forest Tree Dominated Area (Aquatic/ Regularly Flooded, 7: Orchards and Other Plantations (Trees), 8: Herb Dominated Area, 9: Herbaceous Crops, 10: Mud Flats or Intertidal Area, 11: Non vegetated, 12: Rivers and Khals, 13: Rural Settlement,
14: Swamp Reed Land, 15: Shrubs with scattered trees
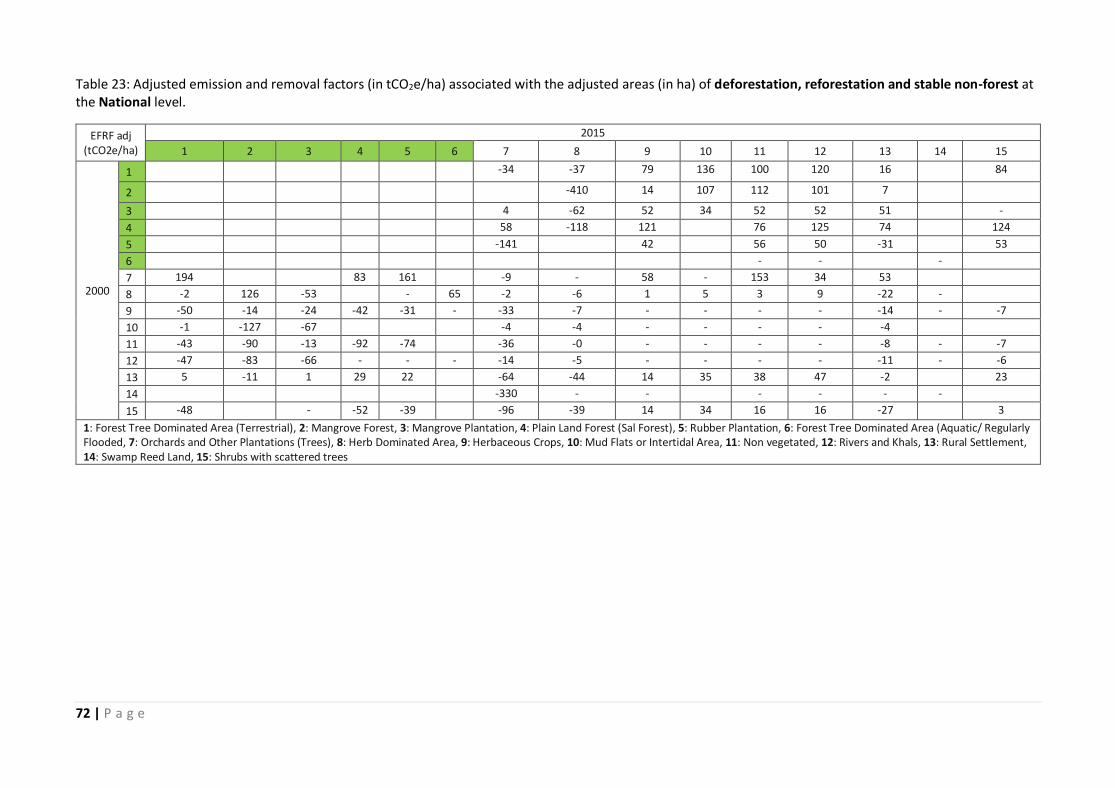
72 | P a g e
Table 23: Adjusted emission and removal factors (in tCO2e/ha) associated with the adjusted areas (in ha) of deforestation, reforestation and stable non-forest at the National level.
EFRF adj (tCO2e/ha)
2015
1 2 3 4 5 6 7 8 9 10 11 12 13 14 15
2000
1
-34 -37 79 136 100 120 16
84
2
-410 14 107 112 101 7
3
4 -62 52 34 52 52 51
-
4
58 -118 121
76 125 74
124
5
-141
42
56 50 -31
53
6
- -
-
7 194
83 161
-9 - 58 - 153 34 53
8 -2 126 -53
- 65 -2 -6 1 5 3 9 -22 -
9 -50 -14 -24 -42 -31 - -33 -7 - - - - -14 - -7
10 -1 -127 -67
-4 -4 - - - - -4
11 -43 -90 -13 -92 -74
-36 -0 - - - - -8 - -7
12 -47 -83 -66 - - - -14 -5 - - - - -11 - -6
13 5 -11 1 29 22
-64 -44 14 35 38 47 -2
23
14
-330 - -
- - - -
15 -48
- -52 -39
-96 -39 14 34 16 16 -27
3
1: Forest Tree Dominated Area (Terrestrial), 2: Mangrove Forest, 3: Mangrove Plantation, 4: Plain Land Forest (Sal Forest), 5: Rubber Plantation, 6: Forest Tree Dominated Area (Aquatic/ Regularly Flooded, 7: Orchards and Other Plantations (Trees), 8: Herb Dominated Area, 9: Herbaceous Crops, 10: Mud Flats or Intertidal Area, 11: Non vegetated, 12: Rivers and Khals, 13: Rural Settlement, 14: Swamp Reed Land, 15: Shrubs with scattered trees
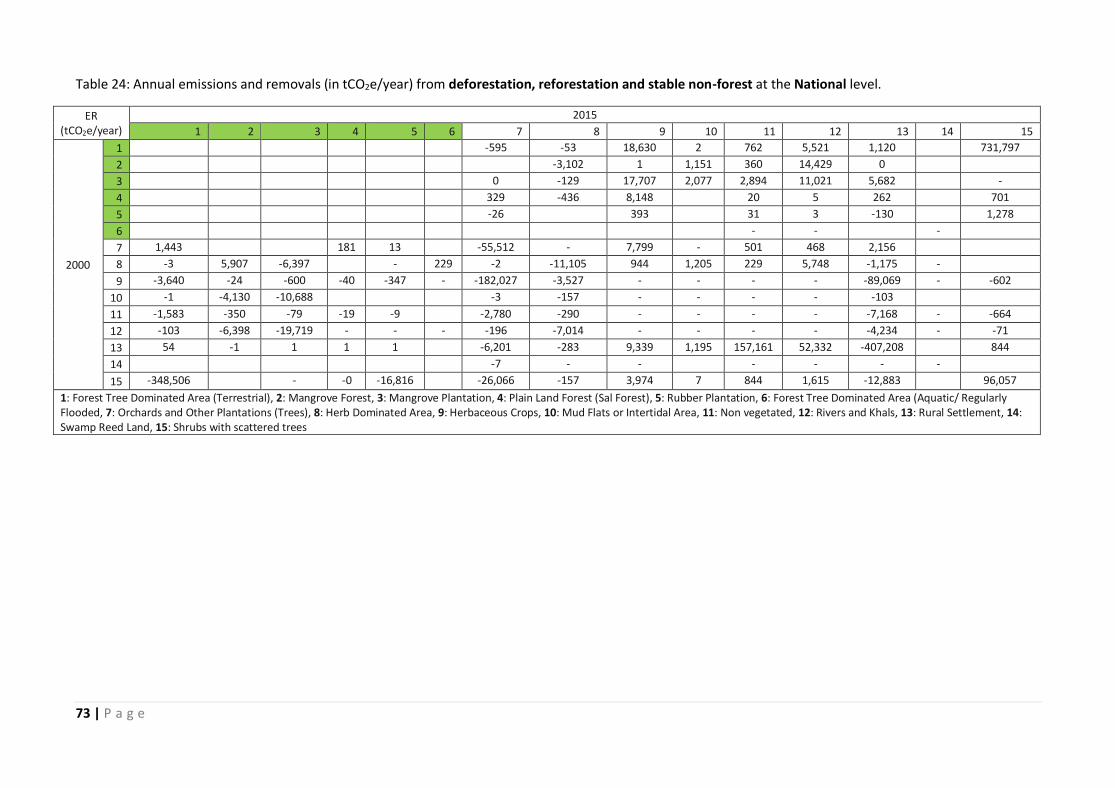
73 | P a g e
Table 24: Annual emissions and removals (in tCO2e/year) from deforestation, reforestation and stable non-forest at the National level.
ER (tCO2e/year)
2015
1 2 3 4 5 6 7 8 9 10 11 12 13 14 15
2000
1
-595 -53 18,630 2 762 5,521 1,120
731,797
2
-3,102 1 1,151 360 14,429 0
3
0 -129 17,707 2,077 2,894 11,021 5,682
-
4
329 -436 8,148
20 5 262
701
5
-26
393
31 3 -130
1,278
6
- -
-
7 1,443
181 13
-55,512 - 7,799 - 501 468 2,156
8 -3 5,907 -6,397
- 229 -2 -11,105 944 1,205 229 5,748 -1,175 -
9 -3,640 -24 -600 -40 -347 - -182,027 -3,527 - - - - -89,069 - -602
10 -1 -4,130 -10,688
-3 -157 - - - - -103
11 -1,583 -350 -79 -19 -9
-2,780 -290 - - - - -7,168 - -664
12 -103 -6,398 -19,719 - - - -196 -7,014 - - - - -4,234 - -71
13 54 -1 1 1 1
-6,201 -283 9,339 1,195 157,161 52,332 -407,208
844
14
-7 - -
- - - -
15 -348,506
- -0 -16,816
-26,066 -157 3,974 7 844 1,615 -12,883
96,057
1: Forest Tree Dominated Area (Terrestrial), 2: Mangrove Forest, 3: Mangrove Plantation, 4: Plain Land Forest (Sal Forest), 5: Rubber Plantation, 6: Forest Tree Dominated Area (Aquatic/ Regularly Flooded, 7: Orchards and Other Plantations (Trees), 8: Herb Dominated Area, 9: Herbaceous Crops, 10: Mud Flats or Intertidal Area, 11: Non vegetated, 12: Rivers and Khals, 13: Rural Settlement, 14: Swamp Reed Land, 15: Shrubs with scattered trees
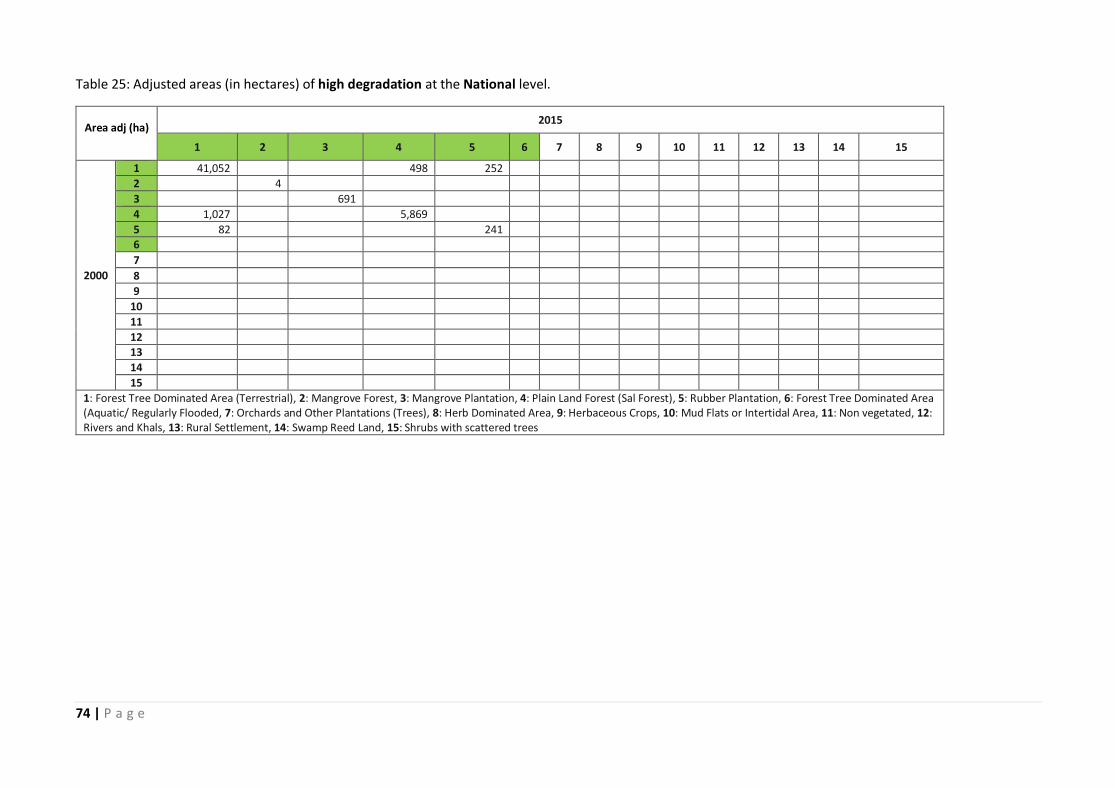
74 | P a g e
Table 25: Adjusted areas (in hectares) of high degradation at the National level.
Area adj (ha) 2015
1 2 3 4 5 6 7 8 9 10 11 12 13 14 15
2000
1 41,052 498 252
2 4
3 691
4 1,027 5,869
5 82 241 6
7
8
9
10
11
12 13
14
15
1: Forest Tree Dominated Area (Terrestrial), 2: Mangrove Forest, 3: Mangrove Plantation, 4: Plain Land Forest (Sal Forest), 5: Rubber Plantation, 6: Forest Tree Dominated Area (Aquatic/ Regularly Flooded, 7: Orchards and Other Plantations (Trees), 8: Herb Dominated Area, 9: Herbaceous Crops, 10: Mud Flats or Intertidal Area, 11: Non vegetated, 12: Rivers and Khals, 13: Rural Settlement, 14: Swamp Reed Land, 15: Shrubs with scattered trees

75 | P a g e
Table 26: Adjusted emission factors (in tCO2e/ha) associated with the adjusted areas (in ha) of high degradation at the National level.
EFRF (tCO2e/ha)
2015
1 2 3 4 5 6 7 8 9 10 11 12 13 14 15
2000
1 65 85 94
2 66
3 37 4 130 98
5 48 45
6
7
8
9
10 11
12
13
14
15
1: Forest Tree Dominated Area (Terrestrial), 2: Mangrove Forest, 3: Mangrove Plantation, 4: Plain Land Forest (Sal Forest), 5: Rubber Plantation, 6: Forest Tree Dominated Area (Aquatic/ Regularly Flooded, 7: Orchards and Other Plantations (Trees), 8: Herb Dominated Area, 9: Herbaceous Crops, 10: Mud Flats or Intertidal Area, 11: Non vegetated, 12: Rivers and Khals, 13: Rural Settlement, 14: Swamp Reed Land, 15: Shrubs with scattered trees
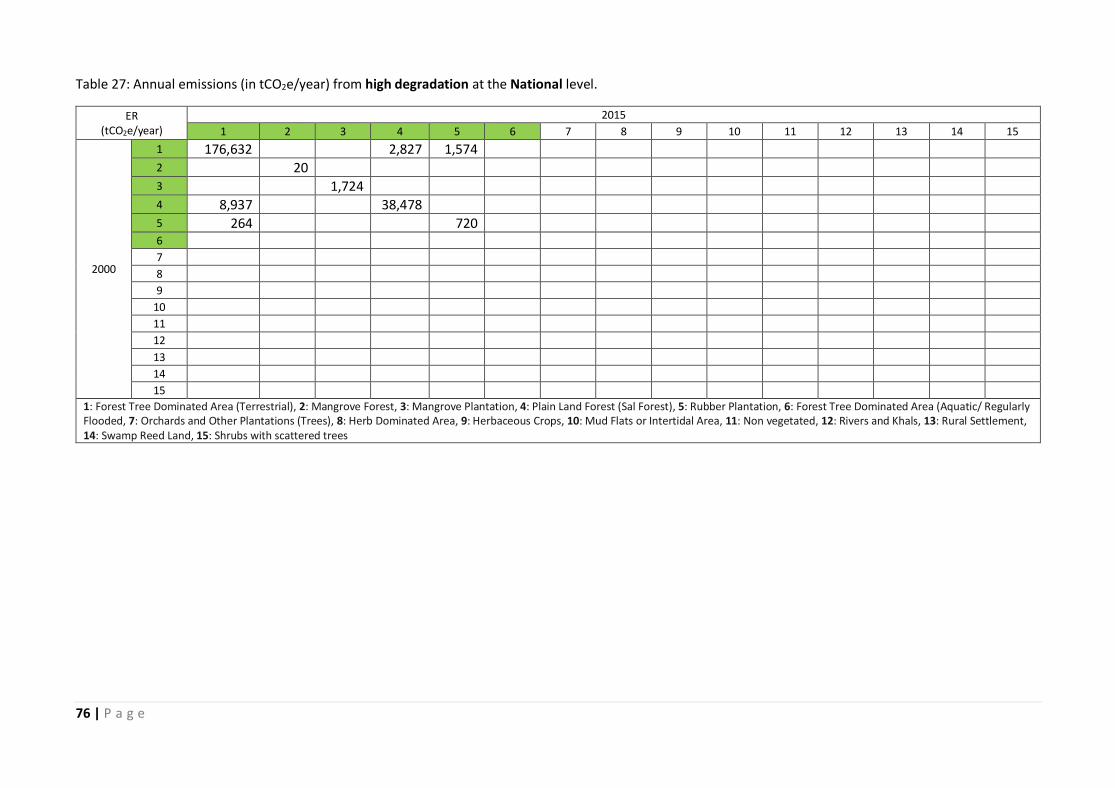
76 | P a g e
Table 27: Annual emissions (in tCO2e/year) from high degradation at the National level.
ER (tCO2e/year)
2015
1 2 3 4 5 6 7 8 9 10 11 12 13 14 15
2000
1 176,632 2,827 1,574
2 20
3 1,724
4 8,937 38,478
5 264 720
6
7
8
9
10
11
12
13
14
15
1: Forest Tree Dominated Area (Terrestrial), 2: Mangrove Forest, 3: Mangrove Plantation, 4: Plain Land Forest (Sal Forest), 5: Rubber Plantation, 6: Forest Tree Dominated Area (Aquatic/ Regularly Flooded, 7: Orchards and Other Plantations (Trees), 8: Herb Dominated Area, 9: Herbaceous Crops, 10: Mud Flats or Intertidal Area, 11: Non vegetated, 12: Rivers and Khals, 13: Rural Settlement, 14: Swamp Reed Land, 15: Shrubs with scattered trees

77 | P a g e
Table 28: Adjusted areas (in hectares) of low degradation at the National level.
Area adj (ha)
2015
1 2 3 4 5 6 7 8 9 10 11
12 13 14 15
2000
1 115,210 94 14
2 168
3 2,320
4 213 3,839 15
5 96 1,987
6
7
8
9
10
11
12
13
14
15
1: Forest Tree Dominated Area (Terrestrial), 2: Mangrove Forest, 3: Mangrove Plantation, 4: Plain Land Forest (Sal Forest), 5: Rubber Plantation, 6: Forest Tree Dominated Area (Aquatic/ Regularly Flooded, 7: Orchards and Other Plantations (Trees), 8: Herb Dominated Area, 9: Herbaceous Crops, 10: Mud Flats or Intertidal Area, 11: Non vegetated, 12: Rivers and Khals, 13: Rural Settlement, 14: Swamp Reed Land, 15: Shrubs with scattered trees
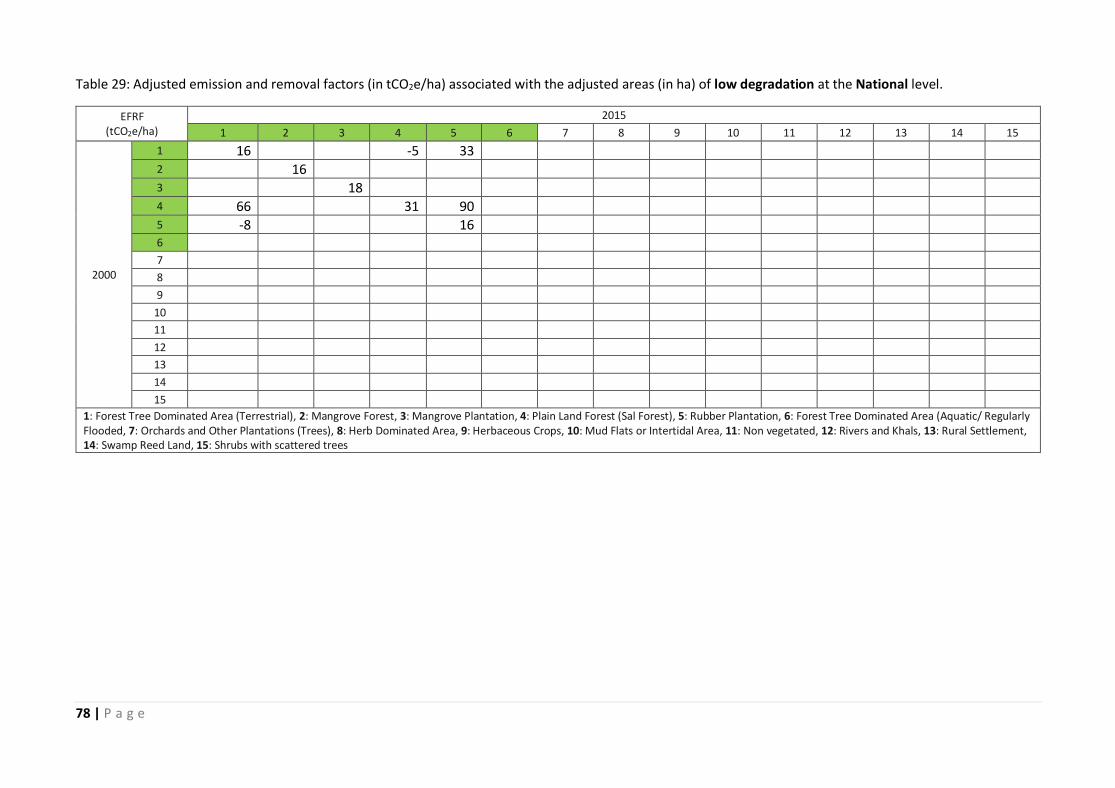
78 | P a g e
Table 29: Adjusted emission and removal factors (in tCO2e/ha) associated with the adjusted areas (in ha) of low degradation at the National level.
EFRF (tCO2e/ha)
2015
1 2 3 4 5 6 7 8 9 10 11 12 13 14 15
2000
1 16
-5 33
2
16
3
18
4 66
31 90
5 -8
16
6
7
8
9
10
11
12
13
14
15
1: Forest Tree Dominated Area (Terrestrial), 2: Mangrove Forest, 3: Mangrove Plantation, 4: Plain Land Forest (Sal Forest), 5: Rubber Plantation, 6: Forest Tree Dominated Area (Aquatic/ Regularly Flooded, 7: Orchards and Other Plantations (Trees), 8: Herb Dominated Area, 9: Herbaceous Crops, 10: Mud Flats or Intertidal Area, 11: Non vegetated, 12: Rivers and Khals, 13: Rural Settlement, 14: Swamp Reed Land, 15: Shrubs with scattered trees

79 | P a g e
Table 30: Annual emissions and removals (in tCO2e/year) from low degradation at the National level.
ER (tCO2e/year)
2015
1 2 3 4 5 6 7 8 9 10 11 12 13 14 15
2000
1 124,127 -31 31
2 184
3 2,763
4 935 7,831 91
5 -50 2,062
6
7
8
9
10
11
12
13
14
15
1: Forest Tree Dominated Area (Terrestrial), 2: Mangrove Forest, 3: Mangrove Plantation, 4: Plain Land Forest (Sal Forest), 5: Rubber Plantation, 6: Forest Tree Dominated Area (Aquatic/ Regularly Flooded, 7: Orchards and Other Plantations (Trees), 8: Herb Dominated Area, 9: Herbaceous Crops, 10: Mud Flats or Intertidal Area, 11: Non vegetated, 12: Rivers and Khals, 13: Rural Settlement, 14: Swamp Reed Land, 15: Shrubs with scattered trees
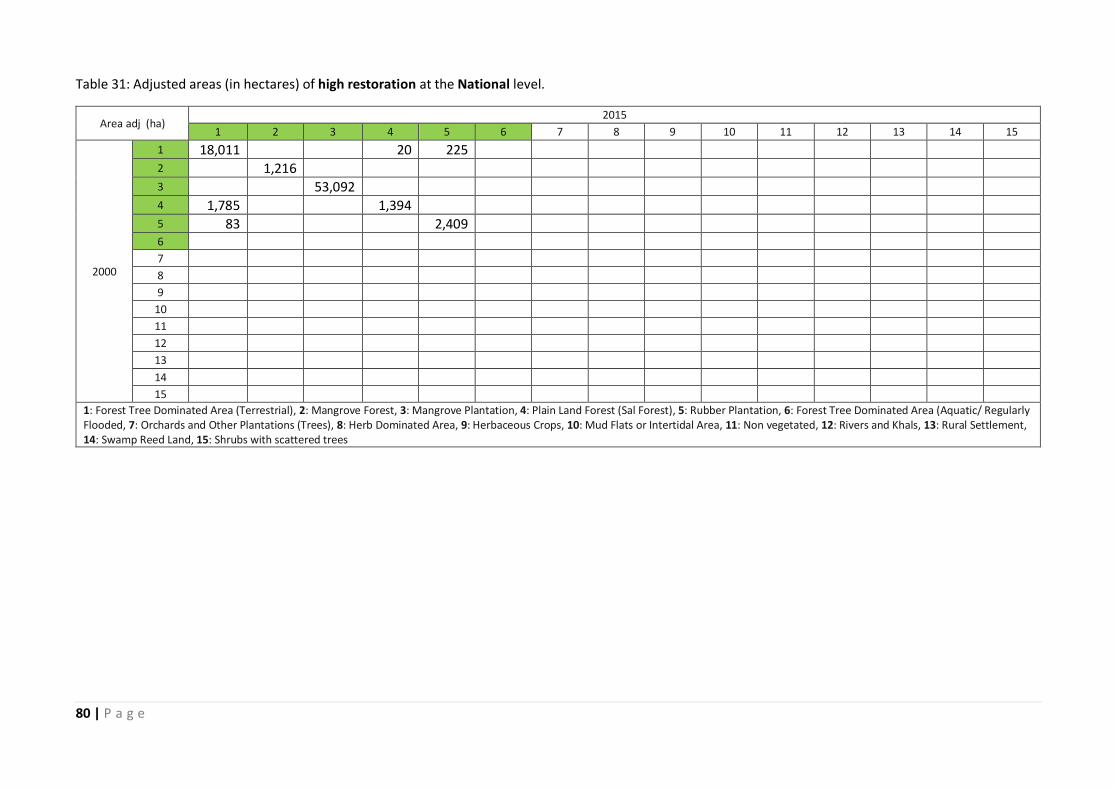
80 | P a g e
Table 31: Adjusted areas (in hectares) of high restoration at the National level.
Area adj (ha) 2015
1 2 3 4 5 6 7 8 9 10 11 12 13 14 15
2000
1 18,011
20 225
2
1,216
3
53,092
4 1,785
1,394
5 83
2,409
6
7
8
9
10
11
12
13
14
15
1: Forest Tree Dominated Area (Terrestrial), 2: Mangrove Forest, 3: Mangrove Plantation, 4: Plain Land Forest (Sal Forest), 5: Rubber Plantation, 6: Forest Tree Dominated Area (Aquatic/ Regularly Flooded, 7: Orchards and Other Plantations (Trees), 8: Herb Dominated Area, 9: Herbaceous Crops, 10: Mud Flats or Intertidal Area, 11: Non vegetated, 12: Rivers and Khals, 13: Rural Settlement, 14: Swamp Reed Land, 15: Shrubs with scattered trees
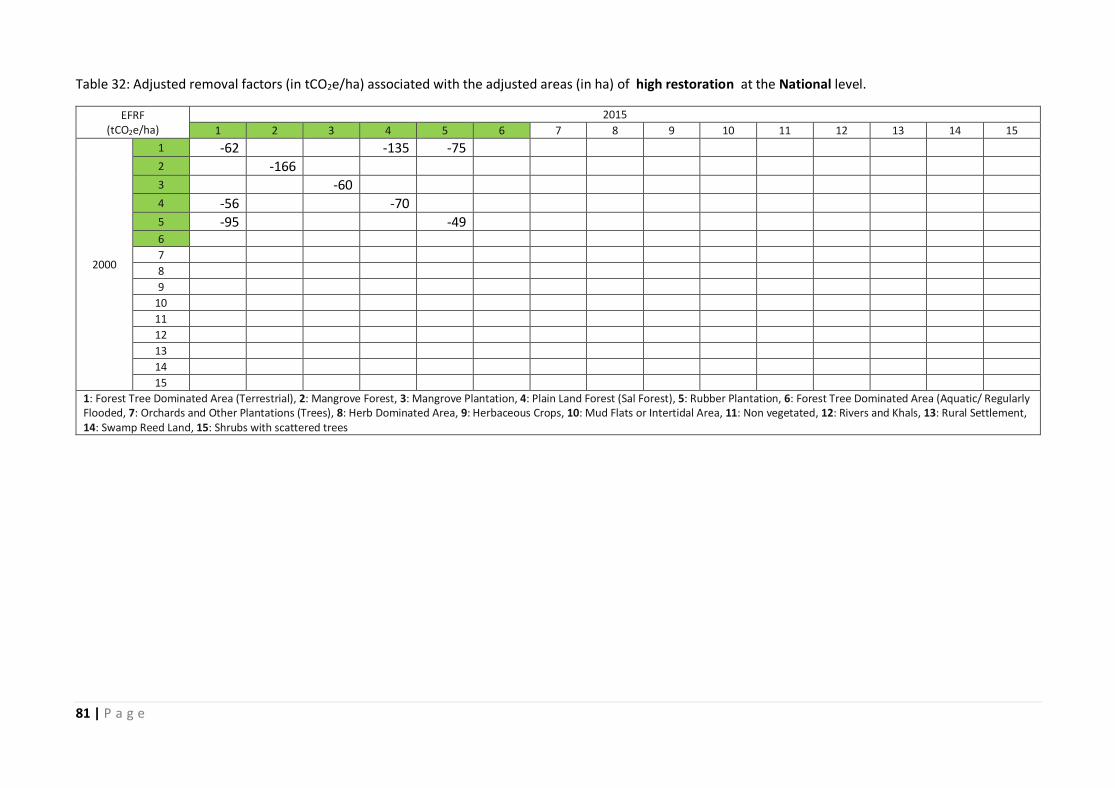
81 | P a g e
Table 32: Adjusted removal factors (in tCO2e/ha) associated with the adjusted areas (in ha) of high restoration at the National level.
EFRF (tCO2e/ha)
2015
1 2 3 4 5 6 7 8 9 10 11 12 13 14 15
2000
1 -62
-135 -75
2
-166
3
-60
4 -56
-70
5 -95
-49
6
7
8
9
10
11
12
13
14
15
1: Forest Tree Dominated Area (Terrestrial), 2: Mangrove Forest, 3: Mangrove Plantation, 4: Plain Land Forest (Sal Forest), 5: Rubber Plantation, 6: Forest Tree Dominated Area (Aquatic/ Regularly Flooded, 7: Orchards and Other Plantations (Trees), 8: Herb Dominated Area, 9: Herbaceous Crops, 10: Mud Flats or Intertidal Area, 11: Non vegetated, 12: Rivers and Khals, 13: Rural Settlement, 14: Swamp Reed Land, 15: Shrubs with scattered trees

82 | P a g e
Table 33: Annual removals (in tCO2e/year) from high restoration at the National level.
ER ( tCO2e/year)
2015
1 2 3 4 5 6 7 8 9 10 11 12 13 14 15
2000
1 -74,952 -178 -1,133
2 -13,453
3 -213,096
4 -6,639 -6,532
5 -525 -7,881
6
7
8
9
10
11
12
13
14
15
1: Forest Tree Dominated Area (Terrestrial), 2: Mangrove Forest, 3: Mangrove Plantation, 4: Plain Land Forest (Sal Forest), 5: Rubber Plantation, 6: Forest Tree Dominated Area (Aquatic/ Regularly Flooded, 7: Orchards and Other Plantations (Trees), 8: Herb Dominated Area, 9: Herbaceous Crops, 10: Mud Flats or Intertidal Area, 11: Non vegetated, 12: Rivers and Khals, 13: Rural Settlement, 14: Swamp Reed Land, 15: Shrubs with scattered trees

83 | P a g e
Table 34: Adjusted areas (in hectares) of low restoration at the National level.
Area adj (ha) 2015
1 2 3 4 5 6 7 8 9 10 11 12 13 14 15
2000
1 22,696
2 63
2
4,212
3
39,414
4 360
2,584 54
5 307
4,186
6
7
8
9
10 11
12
13
14
15
1: Forest Tree Dominated Area (Terrestrial), 2: Mangrove Forest, 3: Mangrove Plantation, 4: Plain Land Forest (Sal Forest), 5: Rubber Plantation, 6: Forest Tree Dominated Area (Aquatic/ Regularly Flooded, 7: Orchards and Other Plantations (Trees), 8: Herb Dominated Area, 9: Herbaceous Crops, 10: Mud Flats or Intertidal Area, 11: Non vegetated, 12: Rivers and Khals, 13: Rural Settlement, 14: Swamp Reed Land, 15: Shrubs with scattered trees

84 | P a g e
Table 35: Adjusted emission and removal factors (in tCO2e/ha) associated with the adjusted areas (in ha) of low restoration at the National level.
EFRF (tCO2e/ha)
2015
1 2 3 4 5 6 7 8 9 10 11 12 13 14 15
2000
1 -16
-39 -16
2
-19
3
-15
4 9
-29 -1
5 -35
-13
6
7
8
9
10
11
12
13
14
15
1: Forest Tree Dominated Area (Terrestrial), 2: Mangrove Forest, 3: Mangrove Plantation, 4: Plain Land Forest (Sal Forest), 5: Rubber Plantation, 6: Forest Tree Dominated Area (Aquatic/ Regularly Flooded, 7: Orchards and Other Plantations (Trees), 8: Herb Dominated Area, 9: Herbaceous Crops, 10: Mud Flats or Intertidal Area, 11: Non vegetated, 12: Rivers and Khals, 13: Rural Settlement, 14: Swamp Reed Land, 15: Shrubs with scattered trees

85 | P a g e
Table 36: Annual emissions and removals (in tCO2e/year) from low restoration at the National level.
ER (tCO2e/year)
2015
1 2 3 4 5 6 7 8 9 10 11 12 13 14 15
2000
1 -23,785
-5 -65
2
-5,202
3
-40,504
4 209
-4,937 -4
5 -710
-3,702
6
7
8
9
10
11
12
13
14
15
1: Forest Tree Dominated Area (Terrestrial), 2: Mangrove Forest, 3: Mangrove Plantation, 4: Plain Land Forest (Sal Forest), 5: Rubber Plantation, 6: Forest Tree Dominated Area (Aquatic/ Regularly Flooded, 7: Orchards and Other Plantations (Trees), 8: Herb Dominated Area, 9: Herbaceous Crops, 10: Mud Flats or Intertidal Area, 11: Non vegetated, 12: Rivers and Khals, 13: Rural Settlement, 14: Swamp Reed Land, 15: Shrubs with scattered trees
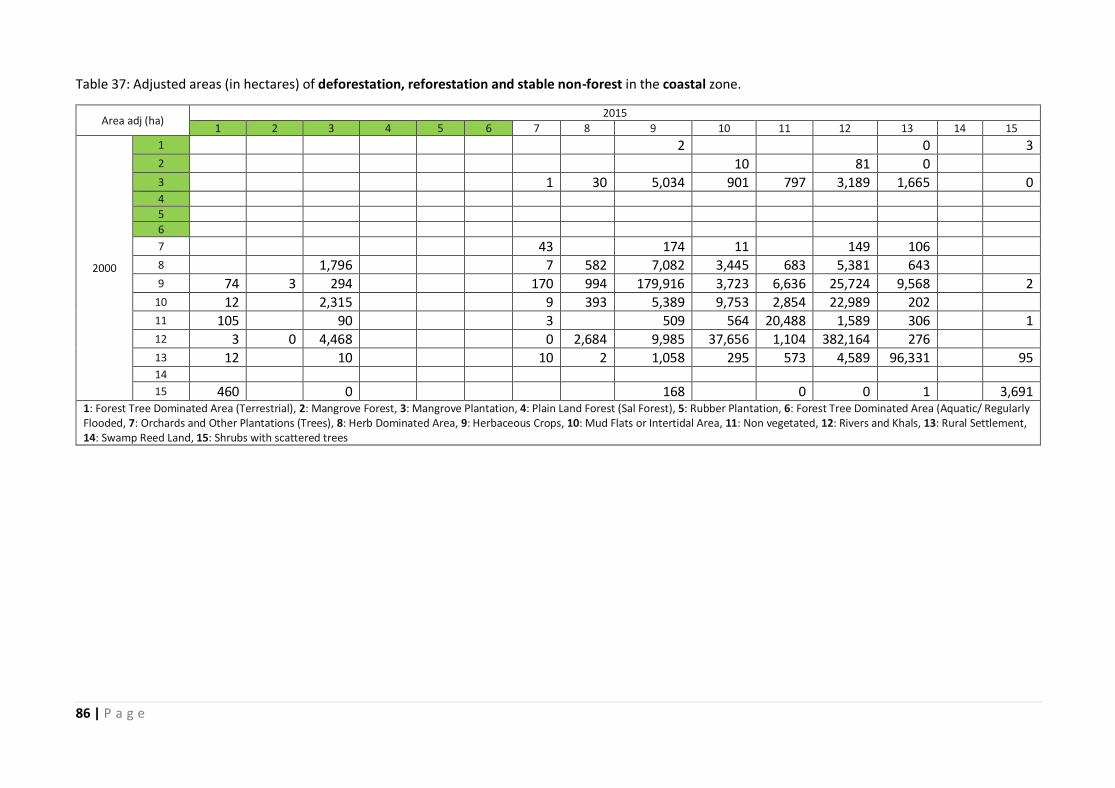
86 | P a g e
Table 37: Adjusted areas (in hectares) of deforestation, reforestation and stable non-forest in the coastal zone.
Area adj (ha) 2015
1 2 3 4 5 6 7 8 9 10 11 12 13 14 15
2000
1
2 0 3 2
10 81 0
3
1 30 5,034 901 797 3,189 1,665 0 4
5
6
7 43 174 11 149 106
8 1,796 7 582 7,082 3,445 683 5,381 643
9 74 3 294 170 994 179,916 3,723 6,636 25,724 9,568 2 10 12 2,315 9 393 5,389 9,753 2,854 22,989 202
11 105 90 3
509 564 20,488 1,589 306 1 12 3 0 4,468 0 2,684 9,985 37,656 1,104 382,164 276
13 12 10 10 2 1,058 295 573 4,589 96,331 95 14 15 460 0 168 0 0 1 3,691
1: Forest Tree Dominated Area (Terrestrial), 2: Mangrove Forest, 3: Mangrove Plantation, 4: Plain Land Forest (Sal Forest), 5: Rubber Plantation, 6: Forest Tree Dominated Area (Aquatic/ Regularly Flooded, 7: Orchards and Other Plantations (Trees), 8: Herb Dominated Area, 9: Herbaceous Crops, 10: Mud Flats or Intertidal Area, 11: Non vegetated, 12: Rivers and Khals, 13: Rural Settlement, 14: Swamp Reed Land, 15: Shrubs with scattered trees
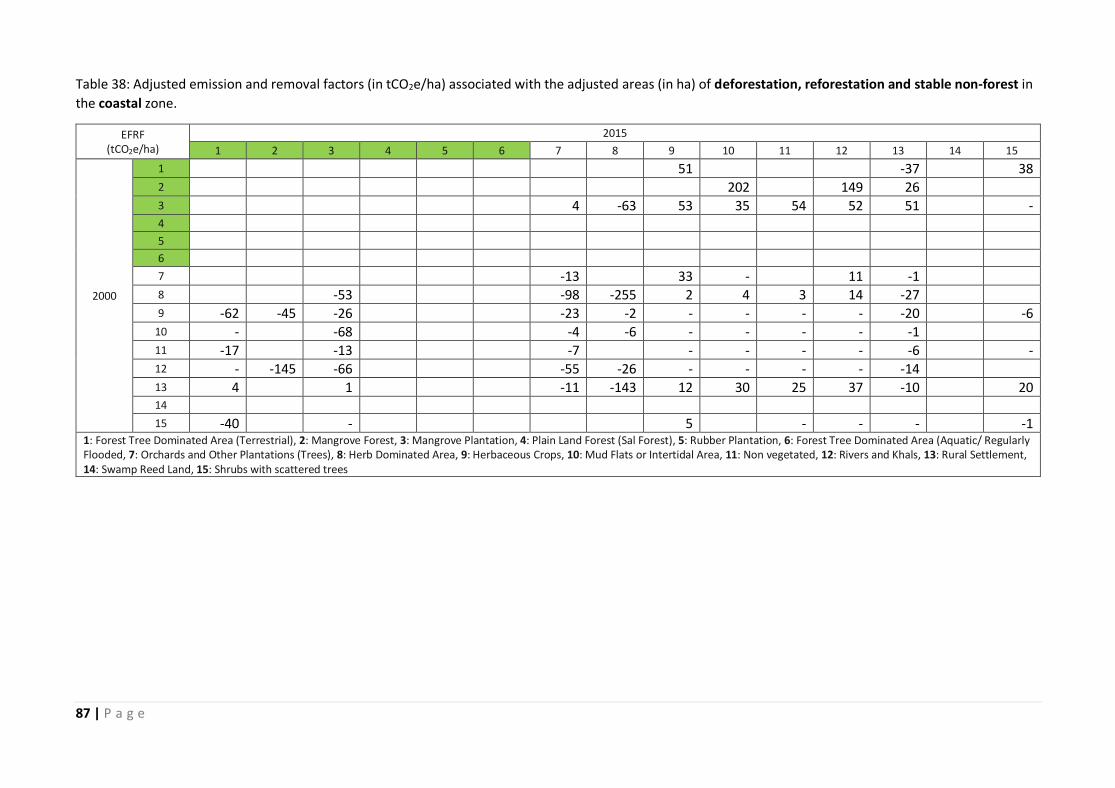
87 | P a g e
Table 38: Adjusted emission and removal factors (in tCO2e/ha) associated with the adjusted areas (in ha) of deforestation, reforestation and stable non-forest in
the coastal zone.
EFRF (tCO2e/ha)
2015
1 2 3 4 5 6 7 8 9 10 11 12 13 14 15
2000
1
51
-37
38 2
202
149 26
3
4 -63 53 35 54 52 51
- 4
5
6
7
-13
33 -
11 -1
8
-53
-98 -255 2 4 3 14 -27
9 -62 -45 -26
-23 -2 - - - - -20
-6 10 -
-68
-4 -6 - - - - -1
11 -17
-13
-7
- - - - -6
- 12 - -145 -66
-55 -26 - - - - -14
13 4
1
-11 -143 12 30 25 37 -10
20 14
15 -40
-
5
- - -
-1 1: Forest Tree Dominated Area (Terrestrial), 2: Mangrove Forest, 3: Mangrove Plantation, 4: Plain Land Forest (Sal Forest), 5: Rubber Plantation, 6: Forest Tree Dominated Area (Aquatic/ Regularly Flooded, 7: Orchards and Other Plantations (Trees), 8: Herb Dominated Area, 9: Herbaceous Crops, 10: Mud Flats or Intertidal Area, 11: Non vegetated, 12: Rivers and Khals, 13: Rural Settlement, 14: Swamp Reed Land, 15: Shrubs with scattered trees
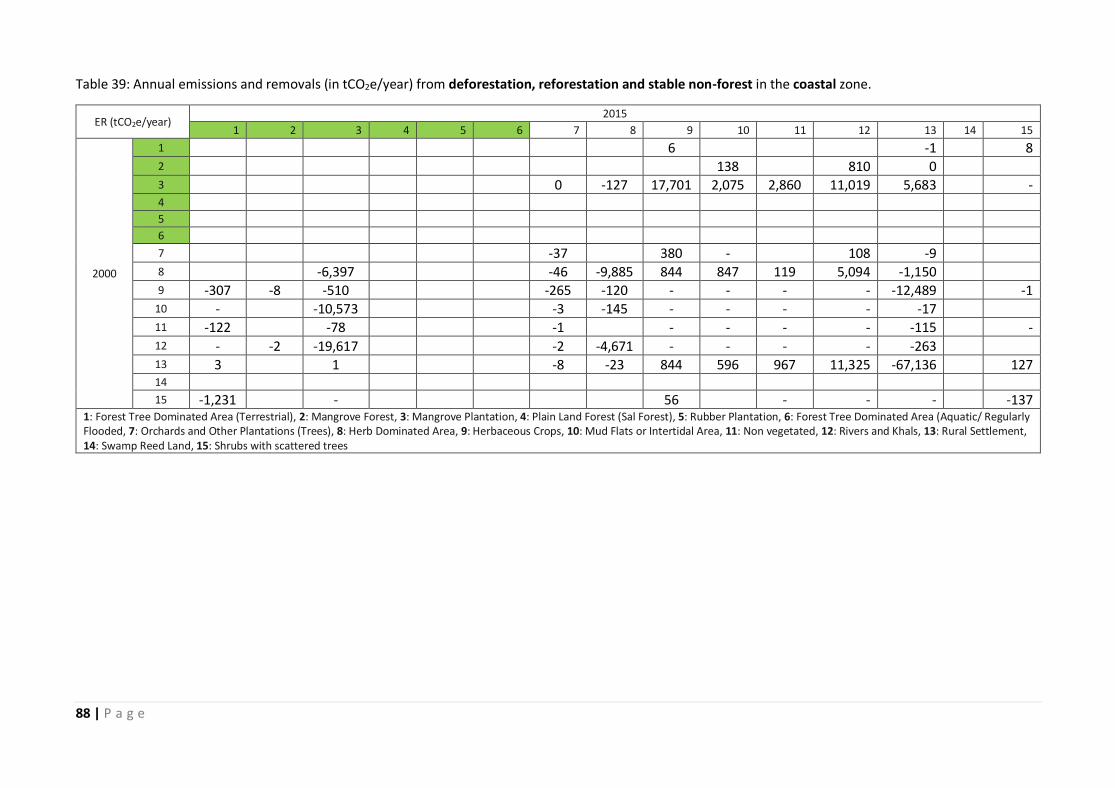
88 | P a g e
Table 39: Annual emissions and removals (in tCO2e/year) from deforestation, reforestation and stable non-forest in the coastal zone.
ER (tCO2e/year) 2015
1 2 3 4 5 6 7 8 9 10 11 12 13 14 15
2000
1
6
-1 8 2
138
810 0
3
0 -127 17,701 2,075 2,860 11,019 5,683 - 4
5
6
7
-37
380 -
108 -9
8
-6,397
-46 -9,885 844 847 119 5,094 -1,150
9 -307 -8 -510
-265 -120 - - - - -12,489 -1 10 -
-10,573
-3 -145 - - - - -17
11 -122
-78
-1
- - - - -115 - 12 - -2 -19,617
-2 -4,671 - - - - -263
13 3
1
-8 -23 844 596 967 11,325 -67,136 127 14
15 -1,231
-
56
- - - -137 1: Forest Tree Dominated Area (Terrestrial), 2: Mangrove Forest, 3: Mangrove Plantation, 4: Plain Land Forest (Sal Forest), 5: Rubber Plantation, 6: Forest Tree Dominated Area (Aquatic/ Regularly Flooded, 7: Orchards and Other Plantations (Trees), 8: Herb Dominated Area, 9: Herbaceous Crops, 10: Mud Flats or Intertidal Area, 11: Non vegetated, 12: Rivers and Khals, 13: Rural Settlement, 14: Swamp Reed Land, 15: Shrubs with scattered trees

89 | P a g e
Table 40: Adjusted areas (in hectares) of high degradation in the coastal zone.
Area adj (ha) 2015
1 2 3 4 5 6 7 8 9 10 11 12 13 14 15
2000
1
2
3 691
4 5
6
7
8
9
10
11
12 13
14
15
1: Forest Tree Dominated Area (Terrestrial), 2: Mangrove Forest, 3: Mangrove Plantation, 4: Plain Land Forest (Sal Forest), 5: Rubber Plantation, 6: Forest Tree Dominated Area (Aquatic/ Regularly Flooded, 7: Orchards and Other Plantations (Trees), 8: Herb Dominated Area, 9: Herbaceous Crops, 10: Mud Flats or Intertidal Area, 11: Non vegetated, 12: Rivers and Khals, 13: Rural Settlement, 14: Swamp Reed Land, 15: Shrubs with scattered trees

90 | P a g e
Table 41: Adjusted emission factors (in tCO2e/ha) associated with the adjusted areas (in ha) of high degradation in the coastal zone.
EFRF (tCO2e/ha) 2015
1 2 3 4 5 6 7 8 9 10 11 12 13 14 15
2000
1
2
3 37
4
5
6
7
8
9
10
11
12
13
14
15
1: Forest Tree Dominated Area (Terrestrial), 2: Mangrove Forest, 3: Mangrove Plantation, 4: Plain Land Forest (Sal Forest), 5: Rubber Plantation, 6: Forest Tree Dominated Area (Aquatic/ Regularly Flooded, 7: Orchards and Other Plantations (Trees), 8: Herb Dominated Area, 9: Herbaceous Crops, 10: Mud Flats or Intertidal Area, 11: Non vegetated, 12: Rivers and Khals, 13: Rural Settlement, 14: Swamp Reed Land, 15: Shrubs with scattered trees

91 | P a g e
Table 42: Annual emissions (in tCO2e/year) from high degradation in the coastal zone.
ER (tCO2e/year)
2015
1 2 3 4 5 6 7 8 9 10 11 12 13 14 15
2000
1
2
3 1724
4
5
6
7
8
9
10
11
12
13
14
15
1: Forest Tree Dominated Area (Terrestrial), 2: Mangrove Forest, 3: Mangrove Plantation, 4: Plain Land Forest (Sal Forest), 5: Rubber Plantation, 6: Forest Tree Dominated Area (Aquatic/ Regularly Flooded, 7: Orchards and Other Plantations (Trees), 8: Herb Dominated Area, 9: Herbaceous Crops, 10: Mud Flats or Intertidal Area, 11: Non vegetated, 12: Rivers and Khals, 13: Rural Settlement, 14: Swamp Reed Land, 15: Shrubs with scattered trees

92 | P a g e
Table 43: Adjusted areas (in hectares) of low degradation in the coastal zone.
Area adj (ha) 2015
1 2 3 4 5 6 7 8 9 10 11 12 13 14 15
2000
1 9
2
3 2203
4
5
6
7
8
9
10
11
12
13
14
15
1: Forest Tree Dominated Area (Terrestrial), 2: Mangrove Forest, 3: Mangrove Plantation, 4: Plain Land Forest (Sal Forest), 5: Rubber Plantation, 6: Forest Tree Dominated Area (Aquatic/ Regularly Flooded, 7: Orchards and Other Plantations (Trees), 8: Herb Dominated Area, 9: Herbaceous Crops, 10: Mud Flats or Intertidal Area, 11: Non vegetated, 12: Rivers and Khals, 13: Rural Settlement, 14: Swamp Reed Land, 15: Shrubs with scattered trees

93 | P a g e
Table 44: Adjusted emission factors (in tCO2e/ha) associated with the adjusted areas (in ha) of low degradation in the coastal zone.
EFRF (tCO2e/ha) 2015
1 2 3 4 5 6 7 8 9 10 11 12 13 14 15
2000
1 22
2
3 18
4
5
6
7
8
9
10
11
12
13
14
15
1: Forest Tree Dominated Area (Terrestrial), 2: Mangrove Forest, 3: Mangrove Plantation, 4: Plain Land Forest (Sal Forest), 5: Rubber Plantation, 6: Forest Tree Dominated Area (Aquatic/ Regularly Flooded, 7: Orchards and Other Plantations (Trees), 8: Herb Dominated Area, 9: Herbaceous Crops, 10: Mud Flats or Intertidal Area, 11: Non vegetated, 12: Rivers and Khals, 13: Rural Settlement, 14: Swamp Reed Land, 15: Shrubs with scattered trees

94 | P a g e
Table 45: Annual emissions (in tCO2e/year) from low degradation in the coastal zone.
ER (tCO2e/year) 2015
1 2 3 4 5 6 7 8 9 10 11 12 13 14 15
2000
1 14
2
3 2637
4
5
6
7
8
9
10
11
12
13
14
15
1: Forest Tree Dominated Area (Terrestrial), 2: Mangrove Forest, 3: Mangrove Plantation, 4: Plain Land Forest (Sal Forest), 5: Rubber Plantation, 6: Forest Tree Dominated Area (Aquatic/ Regularly Flooded, 7: Orchards and Other Plantations (Trees), 8: Herb Dominated Area, 9: Herbaceous Crops, 10: Mud Flats or Intertidal Area, 11: Non vegetated, 12: Rivers and Khals, 13: Rural Settlement, 14: Swamp Reed Land, 15: Shrubs with scattered trees

95 | P a g e
Table 46: Adjusted areas (in hectares) of high restoration in the coastal zone.
Area adj (ha) 2015
1 2 3 4 5 6 7 8 9 10 11 12 13 14 15
2000
1 0
2
3
51,773
4
5
6
7
8
9
10
11
12
13
14
15
1: Forest Tree Dominated Area (Terrestrial), 2: Mangrove Forest, 3: Mangrove Plantation, 4: Plain Land Forest (Sal Forest), 5: Rubber Plantation, 6: Forest Tree Dominated Area (Aquatic/ Regularly Flooded, 7: Orchards and Other Plantations (Trees), 8: Herb Dominated Area, 9: Herbaceous Crops, 10: Mud Flats or Intertidal Area, 11: Non vegetated, 12: Rivers and Khals, 13: Rural Settlement, 14: Swamp Reed Land, 15: Shrubs with scattered trees
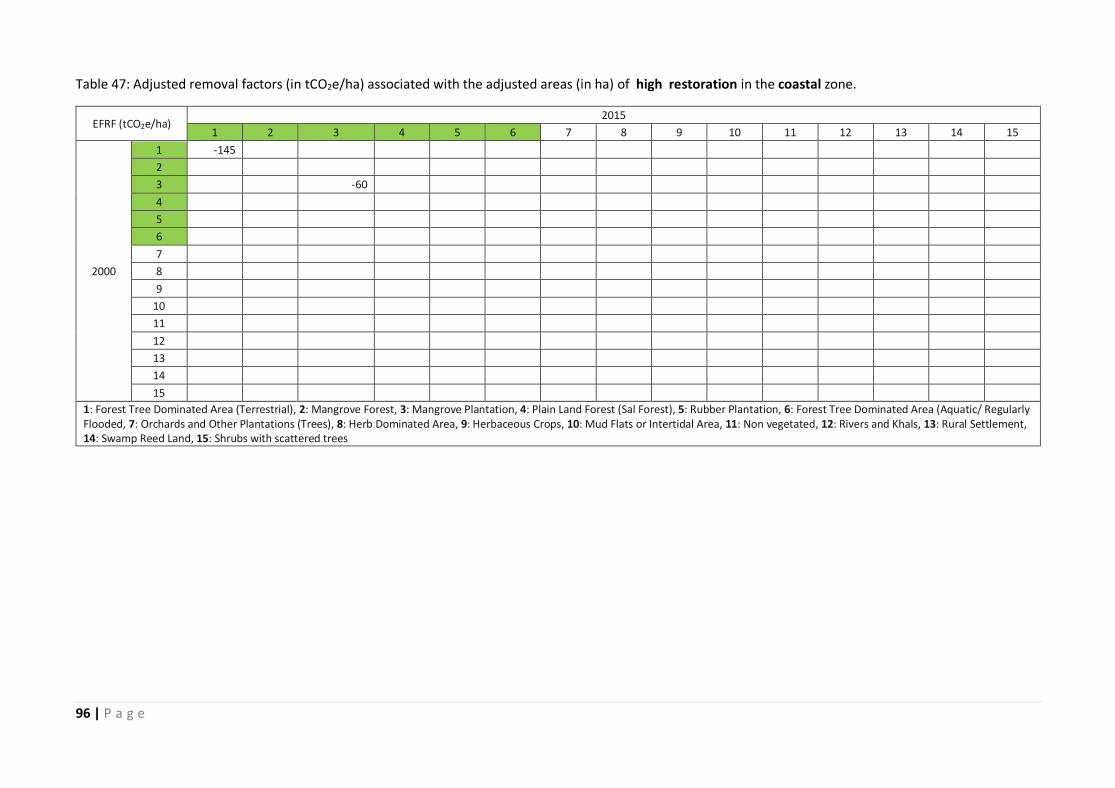
96 | P a g e
Table 47: Adjusted removal factors (in tCO2e/ha) associated with the adjusted areas (in ha) of high restoration in the coastal zone.
EFRF (tCO2e/ha) 2015
1 2 3 4 5 6 7 8 9 10 11 12 13 14 15
2000
1 -145
2
3 -60
4
5
6
7
8
9
10
11
12
13
14
15
1: Forest Tree Dominated Area (Terrestrial), 2: Mangrove Forest, 3: Mangrove Plantation, 4: Plain Land Forest (Sal Forest), 5: Rubber Plantation, 6: Forest Tree Dominated Area (Aquatic/ Regularly Flooded, 7: Orchards and Other Plantations (Trees), 8: Herb Dominated Area, 9: Herbaceous Crops, 10: Mud Flats or Intertidal Area, 11: Non vegetated, 12: Rivers and Khals, 13: Rural Settlement, 14: Swamp Reed Land, 15: Shrubs with scattered trees

97 | P a g e
Table 48: Annual removals (in tCO2e/year) from high restoration in the coastal zone.
ER (tCO2e/year) 2015
1 2 3 4 5 6 7 8 9 10 11 12 13 14 15
2000
1 -4
2
3 -207,367
4
5
6
7
8
9
10
11
12
13
14
15
1: Forest Tree Dominated Area (Terrestrial), 2: Mangrove Forest, 3: Mangrove Plantation, 4: Plain Land Forest (Sal Forest), 5: Rubber Plantation, 6: Forest Tree Dominated Area (Aquatic/ Regularly Flooded, 7: Orchards and Other Plantations (Trees), 8: Herb Dominated Area, 9: Herbaceous Crops, 10: Mud Flats or Intertidal Area, 11: Non vegetated, 12: Rivers and Khals, 13: Rural Settlement, 14: Swamp Reed Land, 15: Shrubs with scattered trees

98 | P a g e
Table 49: Adjusted areas (in hectares) of low restoration in the coastal zone.
Area adj (ha) 2015
1 2 3 4 5 6 7 8 9 10 11 12 13 14 15
2000
1 91
2
3 39,174
4
5
6
7
8
9
10
11
12
13
14
15
1: Forest Tree Dominated Area (Terrestrial), 2: Mangrove Forest, 3: Mangrove Plantation, 4: Plain Land Forest (Sal Forest), 5: Rubber Plantation, 6: Forest Tree Dominated Area (Aquatic/ Regularly Flooded, 7: Orchards and Other Plantations (Trees), 8: Herb Dominated Area, 9: Herbaceous Crops, 10: Mud Flats or Intertidal Area, 11: Non vegetated, 12: Rivers and Khals, 13: Rural Settlement, 14: Swamp Reed Land, 15: Shrubs with scattered trees

99 | P a g e
Table 50: Adjusted removal factors (in tCO2e/ha) associated with the adjusted areas (in ha) of low restoration in the coastal zone.
EFRF (tCO2e/ha) 2015
1 2 3 4 5 6 7 8 9 10 11 12 13 14 15
2000
1 -21
2
3 -15
4
5
6
7
8
9
10
11
12
13
14
15
1: Forest Tree Dominated Area (Terrestrial), 2: Mangrove Forest, 3: Mangrove Plantation, 4: Plain Land Forest (Sal Forest), 5: Rubber Plantation, 6: Forest Tree Dominated Area (Aquatic/ Regularly Flooded, 7: Orchards and Other Plantations (Trees), 8: Herb Dominated Area, 9: Herbaceous Crops, 10: Mud Flats or Intertidal Area, 11: Non vegetated, 12: Rivers and Khals, 13: Rural Settlement, 14: Swamp Reed Land, 15: Shrubs with scattered trees

100 | P a g e
Table 51: Annual removals (in tCO2e/year) from low restoration in the coastal zone.
ER (tCO2e/year) 2015
1 2 3 4 5 6 7 8 9 10 11 12 13 14 15
2000
1 -128
2
3 -40,260
4
5
6
7
8
9
10
11
12
13
14
15
1: Forest Tree Dominated Area (Terrestrial), 2: Mangrove Forest, 3: Mangrove Plantation, 4: Plain Land Forest (Sal Forest), 5: Rubber Plantation, 6: Forest Tree Dominated Area (Aquatic/ Regularly Flooded, 7: Orchards and Other Plantations (Trees), 8: Herb Dominated Area, 9: Herbaceous Crops, 10: Mud Flats or Intertidal Area, 11: Non vegetated, 12: Rivers and Khals, 13: Rural Settlement, 14: Swamp Reed Land, 15: Shrubs with scattered trees
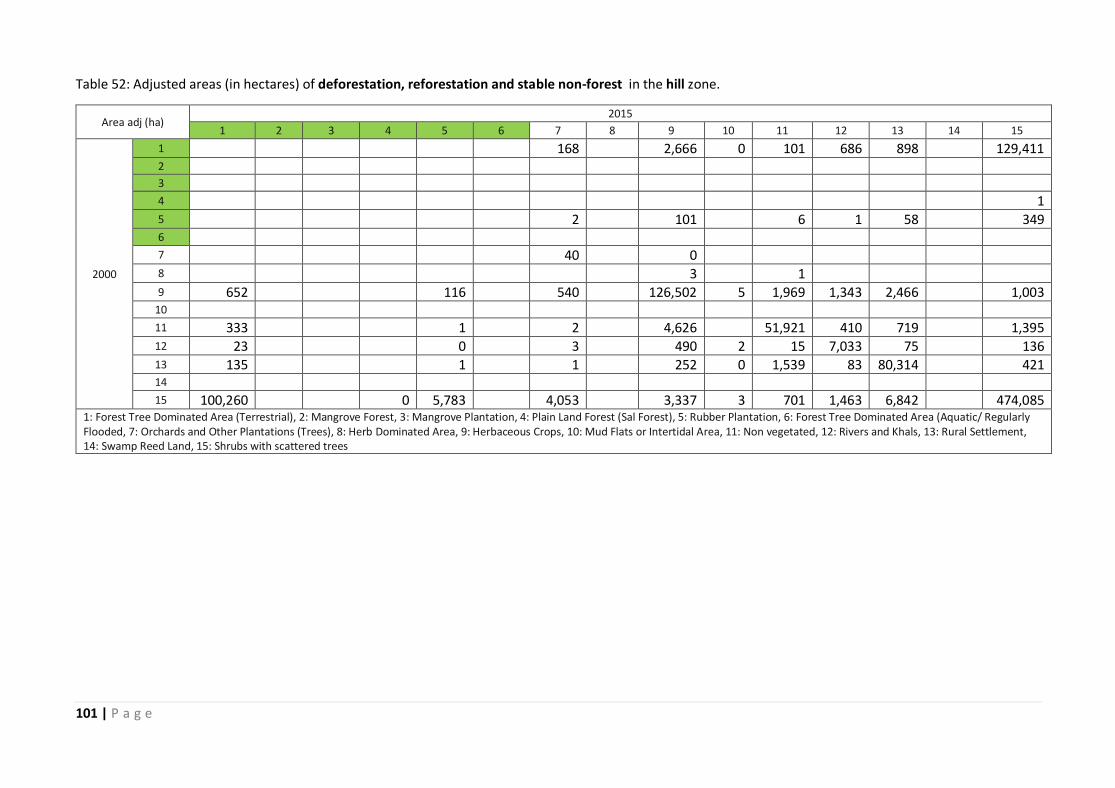
101 | P a g e
Table 52: Adjusted areas (in hectares) of deforestation, reforestation and stable non-forest in the hill zone.
Area adj (ha) 2015
1 2 3 4 5 6 7 8 9 10 11 12 13 14 15
2000
1
168 2,666 0 101 686 898 129,411 2
3
4
1 5
2 101 6 1 58 349 6
7 40 0
8 3 1
9 652 116 540 126,502 5 1,969 1,343 2,466 1,003 10
11 333 1 2 4,626 51,921 410 719 1,395 12 23 0 3 490 2 15 7,033 75 136 13 135 1 1 252 0 1,539 83 80,314 421 14
15 100,260 0 5,783 4,053 3,337 3 701 1,463 6,842 474,085 1: Forest Tree Dominated Area (Terrestrial), 2: Mangrove Forest, 3: Mangrove Plantation, 4: Plain Land Forest (Sal Forest), 5: Rubber Plantation, 6: Forest Tree Dominated Area (Aquatic/ Regularly Flooded, 7: Orchards and Other Plantations (Trees), 8: Herb Dominated Area, 9: Herbaceous Crops, 10: Mud Flats or Intertidal Area, 11: Non vegetated, 12: Rivers and Khals, 13: Rural Settlement, 14: Swamp Reed Land, 15: Shrubs with scattered trees

102 | P a g e
Table 53: Adjusted emission and removal factors (in tCO2e/ha) associated with the adjusted areas (in ha) of deforestation, reforestation and stable non-forest in the hill zone.
EFRF (tCO2e/ha)
2015
1 2 3 4 5 6 7 8 9 10 11 12 13 14 15
2000
1
-51
76 136 102 120 18
85 2
3
4
112 5
-142
49
50 75 -32 54 56 6
7
-26
8
9 -56
-30
-144
-8
-7 10
11 -55
-86
-181
-27
-7 12 -59
-6
-14
-7
13 5
23
-8
21
29 26 -5
24 14
15 -48
-38
-96
16 34 17 16 -27
3 1: Forest Tree Dominated Area (Terrestrial), 2: Mangrove Forest, 3: Mangrove Plantation, 4: Plain Land Forest (Sal Forest), 5: Rubber Plantation, 6: Forest Tree Dominated Area (Aquatic/ Regularly Flooded, 7: Orchards and Other Plantations (Trees), 8: Herb Dominated Area, 9: Herbaceous Crops, 10: Mud Flats or Intertidal Area, 11: Non vegetated, 12: Rivers and Khals, 13: Rural Settlement, 14: Swamp Reed Land, 15: Shrubs with scattered trees
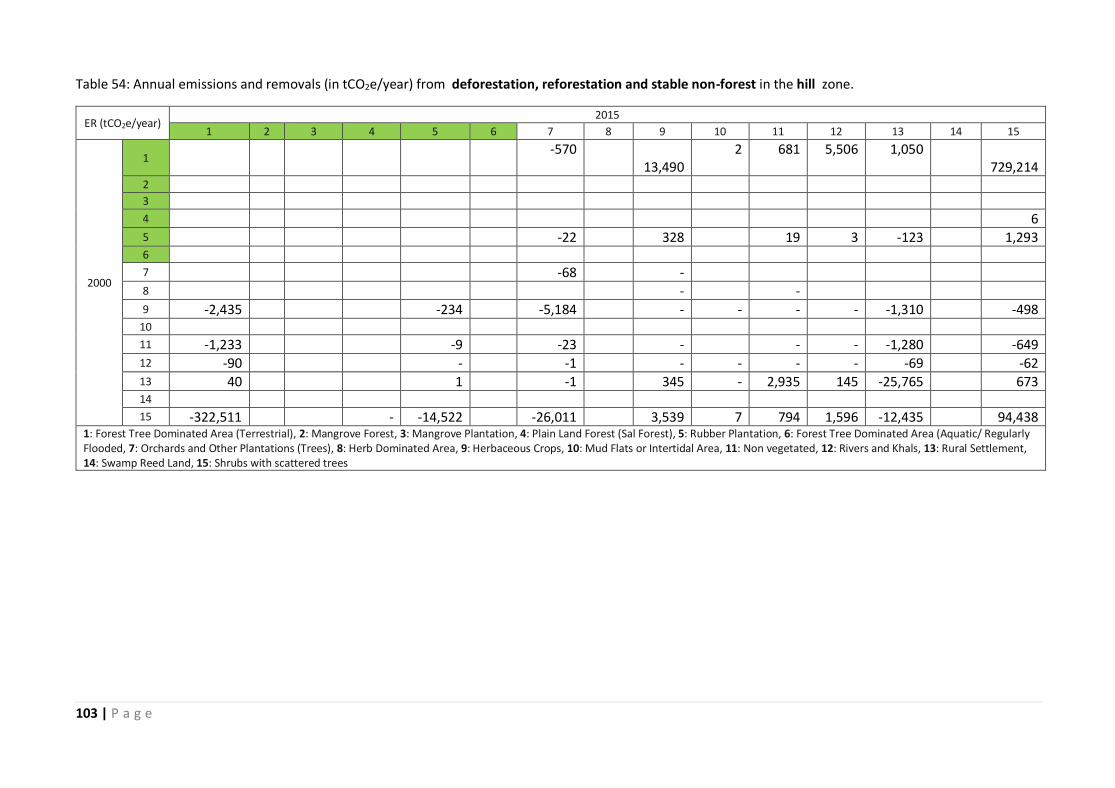
103 | P a g e
Table 54: Annual emissions and removals (in tCO2e/year) from deforestation, reforestation and stable non-forest in the hill zone.
ER (tCO2e/year) 2015
1 2 3 4 5 6 7 8 9 10 11 12 13 14 15
2000
1 -570
13,490 2 681 5,506 1,050
729,214 2 3 4 6 5 -22 328 19 3 -123 1,293 6 7 -68 -
8 - -
9 -2,435 -234 -5,184 - - - - -1,310 -498 10 11 -1,233 -9 -23 - - - -1,280 -649 12 -90 - -1 - - - - -69 -62 13 40 1 -1 345 - 2,935 145 -25,765 673 14 15 -322,511 - -14,522 -26,011 3,539 7 794 1,596 -12,435 94,438
1: Forest Tree Dominated Area (Terrestrial), 2: Mangrove Forest, 3: Mangrove Plantation, 4: Plain Land Forest (Sal Forest), 5: Rubber Plantation, 6: Forest Tree Dominated Area (Aquatic/ Regularly Flooded, 7: Orchards and Other Plantations (Trees), 8: Herb Dominated Area, 9: Herbaceous Crops, 10: Mud Flats or Intertidal Area, 11: Non vegetated, 12: Rivers and Khals, 13: Rural Settlement, 14: Swamp Reed Land, 15: Shrubs with scattered trees

104 | P a g e
Table 55: Adjusted areas (in hectares) of high degradation in the hill zone.
Area adj (ha) 2015
1 2 3 4 5 6 7 8 9 10 11 12 13 14 15
2000
1 32,488 244
2
3
4
5 78 241
6
7
8
9
10
11
12
13
14
15
1: Forest Tree Dominated Area (Terrestrial), 2: Mangrove Forest, 3: Mangrove Plantation, 4: Plain Land Forest (Sal Forest), 5: Rubber Plantation, 6: Forest Tree Dominated Area (Aquatic/ Regularly Flooded, 7: Orchards and Other Plantations (Trees), 8: Herb Dominated Area, 9: Herbaceous Crops, 10: Mud Flats or Intertidal Area, 11: Non vegetated, 12: Rivers and Khals, 13: Rural Settlement, 14: Swamp Reed Land, 15: Shrubs with scattered trees

105 | P a g e
Table 56: Adjusted emission factors (in tCO2e/ha) associated with the adjusted areas (in ha) of high degradation in the hill zone.
EFRF (tCO2e/ha) 2015
1 2 3 4 5 6 7 8 9 10 11 12 13 14 15
2000
1 62
94
2
3
4
5 47
45
6
7
8
9
10
11
12
13
14
15
1: Forest Tree Dominated Area (Terrestrial), 2: Mangrove Forest, 3: Mangrove Plantation, 4: Plain Land Forest (Sal Forest), 5: Rubber Plantation, 6: Forest Tree Dominated Area (Aquatic/ Regularly Flooded, 7: Orchards and Other Plantations (Trees), 8: Herb Dominated Area, 9: Herbaceous Crops, 10: Mud Flats or Intertidal Area, 11: Non vegetated, 12: Rivers and Khals, 13: Rural Settlement, 14: Swamp Reed Land, 15: Shrubs with scattered trees

106 | P a g e
Table 57: Annual emissions (in tCO2e/year) from high degradation in the hill zone.
ER (tCO2e/year) 2015
1 2 3 4 5 6 7 8 9 10 11 12 13 14 15
2000
1 133,636 1,532
2
3
4
5 246 720
6
7
8
9
10
11
12
13
14
15
1: Forest Tree Dominated Area (Terrestrial), 2: Mangrove Forest, 3: Mangrove Plantation, 4: Plain Land Forest (Sal Forest), 5: Rubber Plantation, 6: Forest Tree Dominated Area (Aquatic/ Regularly Flooded, 7: Orchards and Other Plantations (Trees), 8: Herb Dominated Area, 9: Herbaceous Crops, 10: Mud Flats or Intertidal Area, 11: Non vegetated, 12: Rivers and Khals, 13: Rural Settlement, 14: Swamp Reed Land, 15: Shrubs with scattered trees

107 | P a g e
Table 58: Adjusted areas (in hectares) of low degradation in the hill zone.
Area adj (ha) 2015
1 2 3 4 5 6 7 8 9 10 11 12 13 14 15
2000
1 111,940 13
2
3
4 11
5 96 1,099
6
7
8
9
10
11
12
13
14
15
1: Forest Tree Dominated Area (Terrestrial), 2: Mangrove Forest, 3: Mangrove Plantation, 4: Plain Land Forest (Sal Forest), 5: Rubber Plantation, 6: Forest Tree Dominated Area (Aquatic/ Regularly Flooded, 7: Orchards and Other Plantations (Trees), 8: Herb Dominated Area, 9: Herbaceous Crops, 10: Mud Flats or Intertidal Area, 11: Non vegetated, 12: Rivers and Khals, 13: Rural Settlement, 14: Swamp Reed Land, 15: Shrubs with scattered trees
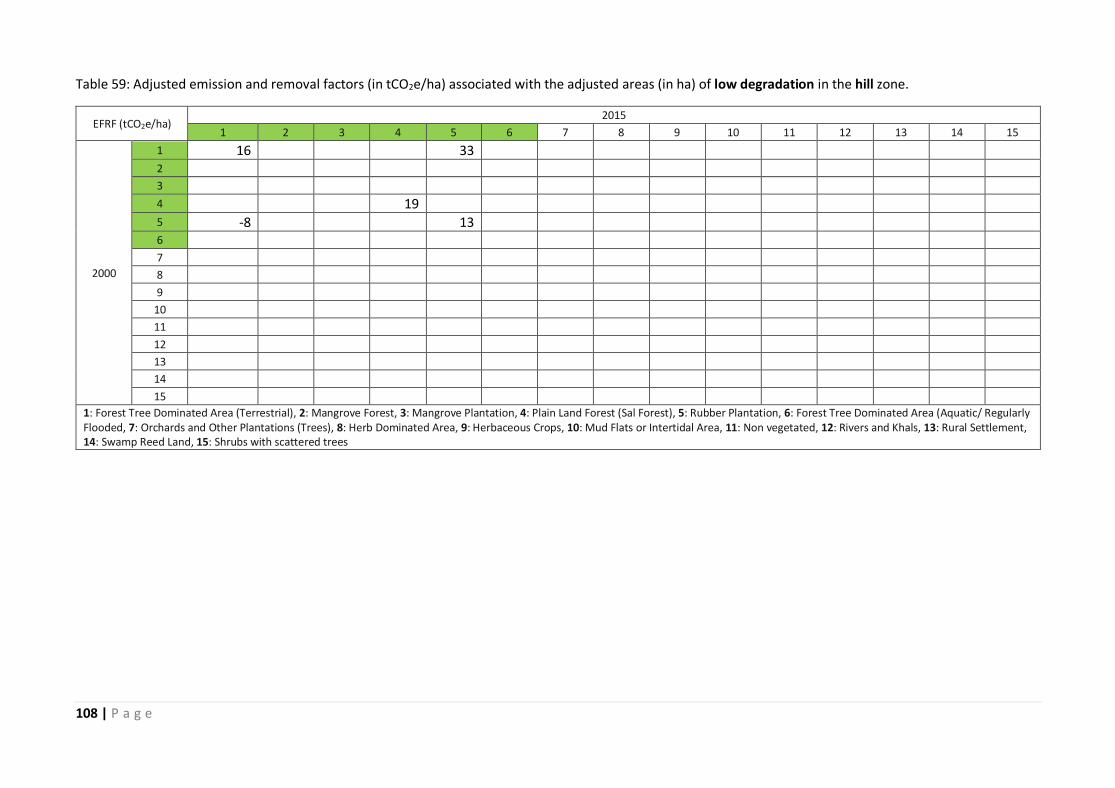
108 | P a g e
Table 59: Adjusted emission and removal factors (in tCO2e/ha) associated with the adjusted areas (in ha) of low degradation in the hill zone.
EFRF (tCO2e/ha) 2015
1 2 3 4 5 6 7 8 9 10 11 12 13 14 15
2000
1 16
33
2
3
4
19
5 -8
13
6
7
8
9
10
11
12
13
14
15
1: Forest Tree Dominated Area (Terrestrial), 2: Mangrove Forest, 3: Mangrove Plantation, 4: Plain Land Forest (Sal Forest), 5: Rubber Plantation, 6: Forest Tree Dominated Area (Aquatic/ Regularly Flooded, 7: Orchards and Other Plantations (Trees), 8: Herb Dominated Area, 9: Herbaceous Crops, 10: Mud Flats or Intertidal Area, 11: Non vegetated, 12: Rivers and Khals, 13: Rural Settlement, 14: Swamp Reed Land, 15: Shrubs with scattered trees
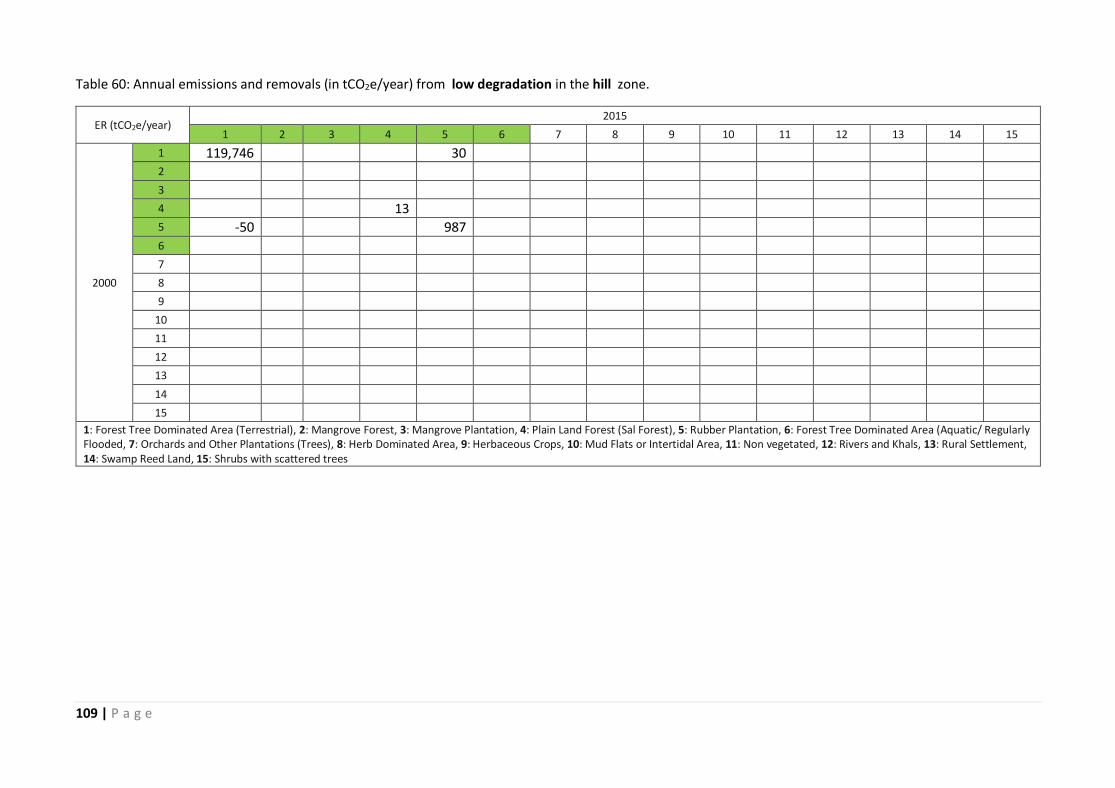
109 | P a g e
Table 60: Annual emissions and removals (in tCO2e/year) from low degradation in the hill zone.
ER (tCO2e/year) 2015
1 2 3 4 5 6 7 8 9 10 11 12 13 14 15
2000
1 119,746 30
2
3
4 13
5 -50 987
6
7
8
9
10
11
12
13
14
15
1: Forest Tree Dominated Area (Terrestrial), 2: Mangrove Forest, 3: Mangrove Plantation, 4: Plain Land Forest (Sal Forest), 5: Rubber Plantation, 6: Forest Tree Dominated Area (Aquatic/ Regularly Flooded, 7: Orchards and Other Plantations (Trees), 8: Herb Dominated Area, 9: Herbaceous Crops, 10: Mud Flats or Intertidal Area, 11: Non vegetated, 12: Rivers and Khals, 13: Rural Settlement, 14: Swamp Reed Land, 15: Shrubs with scattered trees

110 | P a g e
Table 61: Adjusted areas (in hectares) of high restoration in the hill zone.
Area adj (ha) 2015
1 2 3 4 5 6 7 8 9 10 11 12 13 14 15
2000
1 12,369 192
2
3
4
5 70 2,343
6
7
8
9
10
11
12
13
14
15
1: Forest Tree Dominated Area (Terrestrial), 2: Mangrove Forest, 3: Mangrove Plantation, 4: Plain Land Forest (Sal Forest), 5: Rubber Plantation, 6: Forest Tree Dominated Area (Aquatic/ Regularly Flooded, 7: Orchards and Other Plantations (Trees), 8: Herb Dominated Area, 9: Herbaceous Crops, 10: Mud Flats or Intertidal Area, 11: Non vegetated, 12: Rivers and Khals, 13: Rural Settlement, 14: Swamp Reed Land, 15: Shrubs with scattered trees

111 | P a g e
Table 62: Adjusted removal factors (in tCO2e/ha) associated with the adjusted areas (in ha) of high restoration in the hill zone.
EFRF (tCO2e/ha) 2015
1 2 3 4 5 6 7 8 9 10 11 12 13 14 15
2000
1 -65
-84
2
3
4
5 -99
-49
6
7
8
9
10
11
12
13
14
15
1: Forest Tree Dominated Area (Terrestrial), 2: Mangrove Forest, 3: Mangrove Plantation, 4: Plain Land Forest (Sal Forest), 5: Rubber Plantation, 6: Forest Tree Dominated Area (Aquatic/ Regularly Flooded, 7: Orchards and Other Plantations (Trees), 8: Herb Dominated Area, 9: Herbaceous Crops, 10: Mud Flats or Intertidal Area, 11: Non vegetated, 12: Rivers and Khals, 13: Rural Settlement, 14: Swamp Reed Land, 15: Shrubs with scattered trees

112 | P a g e
Table 63: Annual removals (in tCO2e/year) from high restoration in the hill zone.
ER (tCO2e/year) 2015
1 2 3 4 5 6 7 8 9 10 11 12 13 14 15
2000
1 -53,492 -1,077
2
3
4
5 -460 -7,713
6
7
8
9
10
11
12
13
14
15
1: Forest Tree Dominated Area (Terrestrial), 2: Mangrove Forest, 3: Mangrove Plantation, 4: Plain Land Forest (Sal Forest), 5: Rubber Plantation, 6: Forest Tree Dominated Area (Aquatic/ Regularly Flooded, 7: Orchards and Other Plantations (Trees), 8: Herb Dominated Area, 9: Herbaceous Crops, 10: Mud Flats or Intertidal Area, 11: Non vegetated, 12: Rivers and Khals, 13: Rural Settlement, 14: Swamp Reed Land, 15: Shrubs with scattered trees

113 | P a g e
Table 64: Adjusted areas (in hectares) of low restoration in the hill zone.
Area adj (ha) 2015
1 2 3 4 5 6 7 8 9 10 11 12 13 14 15
2000
1 18,827 10
2
3
4 25 573
5 307 2,775
6
7
8
9
10
11
12
13
14
15
1: Forest Tree Dominated Area (Terrestrial), 2: Mangrove Forest, 3: Mangrove Plantation, 4: Plain Land Forest (Sal Forest), 5: Rubber Plantation, 6: Forest Tree Dominated Area (Aquatic/ Regularly Flooded, 7: Orchards and Other Plantations (Trees), 8: Herb Dominated Area, 9: Herbaceous Crops, 10: Mud Flats or Intertidal Area, 11: Non vegetated, 12: Rivers and Khals, 13: Rural Settlement, 14: Swamp Reed Land, 15: Shrubs with scattered trees

114 | P a g e
Table 65: Adjusted emission and removal factors (in tCO2e/ha) associated with the adjusted areas (in ha) of low restoration in the hill zone.
EFRF (tCO2e/ha) 2015
1 2 3 4 5 6 7 8 9 10 11 12 13 14 15
2000
1 -16
-17
2
3
4 16
-39
5 -35
-11
6
7
8
9
10
11
12
13
14
15
1: Forest Tree Dominated Area (Terrestrial), 2: Mangrove Forest, 3: Mangrove Plantation, 4: Plain Land Forest (Sal Forest), 5: Rubber Plantation, 6: Forest Tree Dominated Area (Aquatic/ Regularly Flooded, 7: Orchards and Other Plantations (Trees), 8: Herb Dominated Area, 9: Herbaceous Crops, 10: Mud Flats or Intertidal Area, 11: Non vegetated, 12: Rivers and Khals, 13: Rural Settlement, 14: Swamp Reed Land, 15: Shrubs with scattered trees

115 | P a g e
Table 66: Annual emissions and removals (in tCO2e/year) from low restoration in the hill zone.
ER (tCO2e/year) 2015
1 2 3 4 5 6 7 8 9 10 11 12 13 14 15
2000
1 -19,712 -11
2
3
4 26 -1,484
5 -710 -2,063
6
7
8
9
10
11
12
13
14
15
1: Forest Tree Dominated Area (Terrestrial), 2: Mangrove Forest, 3: Mangrove Plantation, 4: Plain Land Forest (Sal Forest), 5: Rubber Plantation, 6: Forest Tree Dominated Area (Aquatic/ Regularly Flooded, 7: Orchards and Other Plantations (Trees), 8: Herb Dominated Area, 9: Herbaceous Crops, 10: Mud Flats or Intertidal Area, 11: Non vegetated, 12: Rivers and Khals, 13: Rural Settlement, 14: Swamp Reed Land, 15: Shrubs with scattered trees

116 | P a g e
Table 67: Adjusted areas (in hectares) of deforestation, reforestation and stable non-forest in the sal zone.
Area adj (ha) 2015
1 2 3 4 5 6 7 8 9 10 11 12 13 14 15
2000
1
82 20 579 7 0 78 57 2
3
4
81 55 969 3 0 52 74 5
0
22 0 0 6
7 1 1 0 26,035 0 1,019 2 0 437
8 0
4 1,074 0 0
9 27 11 6 2,531 136 213,755 15,455 1,687 3,310 5 10
11 1 3 4 0 1,321 42,593 162 209 0 12 0
3
62 98 4,641 39 0
13 4 0 0 48 1 272 10,668 136 153,412
14
15 3,210 0 572 1 0 11 0 0 55 2,541 1: Forest Tree Dominated Area (Terrestrial), 2: Mangrove Forest, 3: Mangrove Plantation, 4: Plain Land Forest (Sal Forest), 5: Rubber Plantation, 6: Forest Tree Dominated Area (Aquatic/ Regularly Flooded, 7: Orchards and Other Plantations (Trees), 8: Herb Dominated Area, 9: Herbaceous Crops, 10: Mud Flats or Intertidal Area, 11: Non vegetated, 12: Rivers and Khals, 13: Rural Settlement, 14: Swamp Reed Land, 15: Shrubs with scattered trees

117 | P a g e
Table 68: Adjusted emission and removal factors (in tCO2e/ha) associated with the adjusted areas (in ha) of deforestation, reforestation and stable non-forest in the sal zone.
EFRF (tCO2e/ha) 2015
1 2 3 4 5 6 7 8 9 10 11 12 13 14 15
2000
1
-16 -11 106
105 21 14
115 2
3
4
59 -118 123
66 142 75
126 5
-132
37
-28
66 6
7 160
51 217
2 - 77
128 - 67
8 -
181 11 -
-
9 -33
-48 -26
-87 -274 -
- - -41
-7 10
11 -76
-94
-109 - -
- - -23
- 12 -
-42
-
- - -6
- 13 31
41 -
-99 -44 65
35 29 1
14
15 -38
-53 -51
-20 - 10
- - -50
13 1: Forest Tree Dominated Area (Terrestrial), 2: Mangrove Forest, 3: Mangrove Plantation, 4: Plain Land Forest (Sal Forest), 5: Rubber Plantation, 6: Forest Tree Dominated Area (Aquatic/ Regularly Flooded, 7: Orchards and Other Plantations (Trees), 8: Herb Dominated Area, 9: Herbaceous Crops, 10: Mud Flats or Intertidal Area, 11: Non vegetated, 12: Rivers and Khals, 13: Rural Settlement, 14: Swamp Reed Land, 15: Shrubs with scattered trees

118 | P a g e
Table 69: Annual emissions and removals (in tCO2e/year) from deforestation, reforestation and stable non-forest in the sal zone.
ER (tCO2e/year) 2015
1 2 3 4 5 6 7 8 9 10 11 12 13 14 15
2000
1 -86 -15 4,078 47 0 72 434 2 3
4 316 -436 7,926 14 3 261 622 5 -4 52 -1 2 6
7 11 3 1 3,088 - 5,205 15 - 1,961
8 - 50 762 - -
9 -60 -34 -10 -14,699 -2,490 - - - -9,017 -2 10
11 -5 -19 -32 - - - - -324 - 12 - -9 - - - -14 - 13 8 1 - -317 -2 1,181 24,883 263 11,066
14
15 -8,057 -0 -1,960 -1 - 7 - - -183 2,269 1: Forest Tree Dominated Area (Terrestrial), 2: Mangrove Forest, 3: Mangrove Plantation, 4: Plain Land Forest (Sal Forest), 5: Rubber Plantation, 6: Forest Tree Dominated Area (Aquatic/ Regularly Flooded, 7: Orchards and Other Plantations (Trees), 8: Herb Dominated Area, 9: Herbaceous Crops, 10: Mud Flats or Intertidal Area, 11: Non vegetated, 12: Rivers and Khals, 13: Rural Settlement, 14: Swamp Reed Land, 15: Shrubs with scattered trees
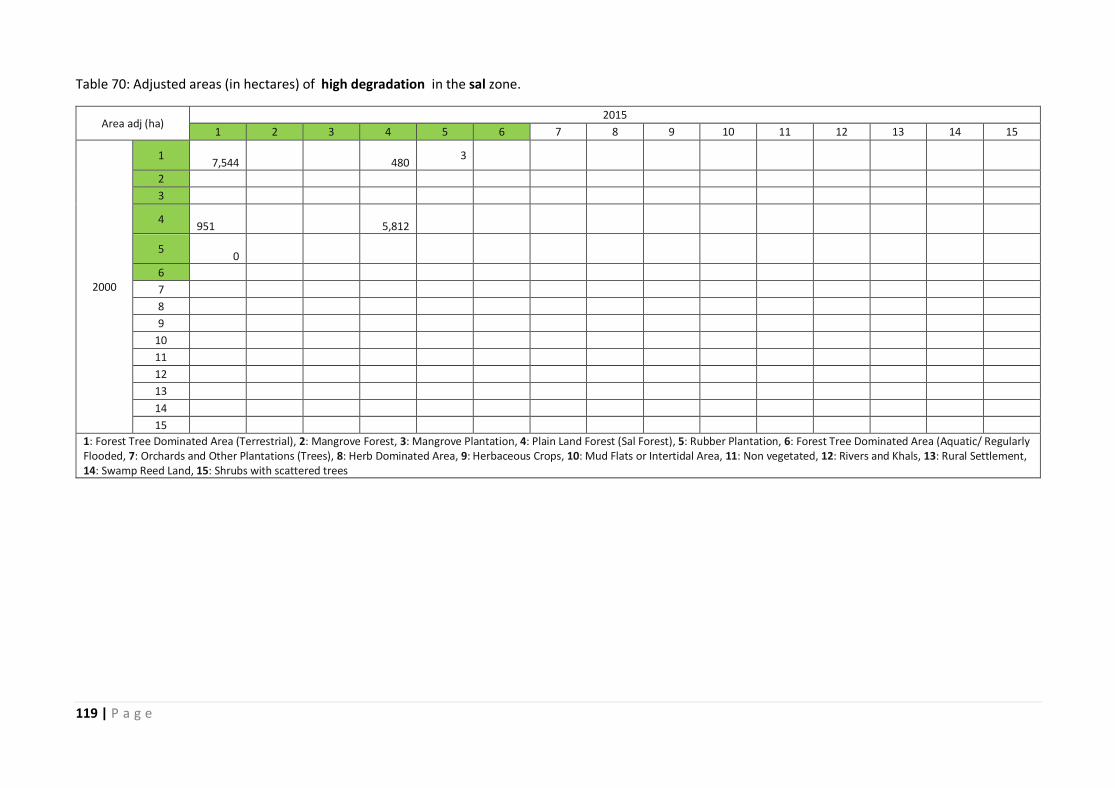
119 | P a g e
Table 70: Adjusted areas (in hectares) of high degradation in the sal zone.
Area adj (ha) 2015
1 2 3 4 5 6 7 8 9 10 11 12 13 14 15
2000
1
7,544
480
3
2
3
4 951
5,812
5
0
6
7
8
9
10
11
12
13
14
15
1: Forest Tree Dominated Area (Terrestrial), 2: Mangrove Forest, 3: Mangrove Plantation, 4: Plain Land Forest (Sal Forest), 5: Rubber Plantation, 6: Forest Tree Dominated Area (Aquatic/ Regularly Flooded, 7: Orchards and Other Plantations (Trees), 8: Herb Dominated Area, 9: Herbaceous Crops, 10: Mud Flats or Intertidal Area, 11: Non vegetated, 12: Rivers and Khals, 13: Rural Settlement, 14: Swamp Reed Land, 15: Shrubs with scattered trees

120 | P a g e
Table 71: Adjusted emission factors (in tCO2e/ha) associated with the adjusted areas (in ha) of high degradation in the sal zone.
EFRF (tCO2e/ha) 2015
1 2 3 4 5 6 7 8 9 10 11 12 13 14 15
2000
1 73
85 87
2
3
4 130
99
5 113
6
7
8
9
10
11
12
13
14
15
1: Forest Tree Dominated Area (Terrestrial), 2: Mangrove Forest, 3: Mangrove Plantation, 4: Plain Land Forest (Sal Forest), 5: Rubber Plantation, 6: Forest Tree Dominated Area (Aquatic/ Regularly Flooded, 7: Orchards and Other Plantations (Trees), 8: Herb Dominated Area, 9: Herbaceous Crops, 10: Mud Flats or Intertidal Area, 11: Non vegetated, 12: Rivers and Khals, 13: Rural Settlement, 14: Swamp Reed Land, 15: Shrubs with scattered trees

121 | P a g e
Table 72: Annual emissions (in tCO2e/year) from high degradation in the sal zone.
ER (tCO2e/year) 2015
1 2 3 4 5 6 7 8 9 10 11 12 13 14 15
2000
1 36,803
2,736 15
2
3
4 8,267
38,188
5 3
6
7
8
9
10
11
12
13
14
15
1: Forest Tree Dominated Area (Terrestrial), 2: Mangrove Forest, 3: Mangrove Plantation, 4: Plain Land Forest (Sal Forest), 5: Rubber Plantation, 6: Forest Tree Dominated Area (Aquatic/ Regularly Flooded, 7: Orchards and Other Plantations (Trees), 8: Herb Dominated Area, 9: Herbaceous Crops, 10: Mud Flats or Intertidal Area, 11: Non vegetated, 12: Rivers and Khals, 13: Rural Settlement, 14: Swamp Reed Land, 15: Shrubs with scattered trees

122 | P a g e
Table 73: Adjusted areas (in hectares) of low degradation in the sal zone.
Area adj (ha) 2015
1 2 3 4 5 6 7 8 9 10 11 12 13 14 15
2000
1 2,861
83 1
2
3
4 184
3,642 15
5
881
6
7
8
9
10
11
12
13
14
15
1: Forest Tree Dominated Area (Terrestrial), 2: Mangrove Forest, 3: Mangrove Plantation, 4: Plain Land Forest (Sal Forest), 5: Rubber Plantation, 6: Forest Tree Dominated Area (Aquatic/ Regularly Flooded, 7: Orchards and Other Plantations (Trees), 8: Herb Dominated Area, 9: Herbaceous Crops, 10: Mud Flats or Intertidal Area, 11: Non vegetated, 12: Rivers and Khals, 13: Rural Settlement, 14: Swamp Reed Land, 15: Shrubs with scattered trees

123 | P a g e
Table 74: Adjusted emission factors (in tCO2e/ha) associated with the adjusted areas (in ha) of low degradation in the sal zone.
EFRF (tCO2e/ha) 2015
1 2 3 4 5 6 7 8 9 10 11 12 13 14 15
2000
1 21 -7 20
2
3
4 71 31 90
5 18
6
7
8
9
10
11
12
13
14
15
1: Forest Tree Dominated Area (Terrestrial), 2: Mangrove Forest, 3: Mangrove Plantation, 4: Plain Land Forest (Sal Forest), 5: Rubber Plantation, 6: Forest Tree Dominated Area (Aquatic/ Regularly Flooded, 7: Orchards and Other Plantations (Trees), 8: Herb Dominated Area, 9: Herbaceous Crops, 10: Mud Flats or Intertidal Area, 11: Non vegetated, 12: Rivers and Khals, 13: Rural Settlement, 14: Swamp Reed Land, 15: Shrubs with scattered trees

124 | P a g e
Table 75: Annual emissions (in tCO2e/year) from low degradation in the sal zone.
ER (tCO2e/year) 2015
1 2 3 4 5 6 7 8 9 10 11 12 13 14 15
2000
1 3,937 -41 1
2
3
4 864 7,493 91
5 1,068
6
7
8
9
10
11
12
13
14
15
1: Forest Tree Dominated Area (Terrestrial), 2: Mangrove Forest, 3: Mangrove Plantation, 4: Plain Land Forest (Sal Forest), 5: Rubber Plantation, 6: Forest Tree Dominated Area (Aquatic/ Regularly Flooded, 7: Orchards and Other Plantations (Trees), 8: Herb Dominated Area, 9: Herbaceous Crops, 10: Mud Flats or Intertidal Area, 11: Non vegetated, 12: Rivers and Khals, 13: Rural Settlement, 14: Swamp Reed Land, 15: Shrubs with scattered trees

125 | P a g e
Table 76: Adjusted areas (in hectares) of high restoration in the sal zone.
Area adj (ha) 2015
1 2 3 4 5 6 7 8 9 10 11 12 13 14 15
2000
1 4,360
5 1
2
3
4 1,758
1,394
5 5
66
6
7
8
9
10
11
12
13
14
15
1: Forest Tree Dominated Area (Terrestrial), 2: Mangrove Forest, 3: Mangrove Plantation, 4: Plain Land Forest (Sal Forest), 5: Rubber Plantation, 6: Forest Tree Dominated Area (Aquatic/ Regularly Flooded, 7: Orchards and Other Plantations (Trees), 8: Herb Dominated Area, 9: Herbaceous Crops, 10: Mud Flats or Intertidal Area, 11: Non vegetated, 12: Rivers and Khals, 13: Rural Settlement, 14: Swamp Reed Land, 15: Shrubs with scattered trees

126 | P a g e
Table 77: Adjusted removal factors (in tCO2e/ha) associated with the adjusted areas (in ha) of high restoration in the sal zone.
EFRF (tCO2e/ha) 2015
1 2 3 4 5 6 7 8 9 10 11 12 13 14 15
2000
1 -53
-199 -56
2
3
4 -56
-70
5 -67
-38
6
7
8
9
10
11
12
13
14
15
1: Forest Tree Dominated Area (Terrestrial), 2: Mangrove Forest, 3: Mangrove Plantation, 4: Plain Land Forest (Sal Forest), 5: Rubber Plantation, 6: Forest Tree Dominated Area (Aquatic/ Regularly Flooded, 7: Orchards and Other Plantations (Trees), 8: Herb Dominated Area, 9: Herbaceous Crops, 10: Mud Flats or Intertidal Area, 11: Non vegetated, 12: Rivers and Khals, 13: Rural Settlement, 14: Swamp Reed Land, 15: Shrubs with scattered trees

127 | P a g e
Table 78: Annual removals (in tCO2e/year) from high restoration in the sal zone.
ER (tCO2e/year) 2015
1 2 3 4 5 6 7 8 9 10 11 12 13 14 15
2000
1 -15,340
-60 -3
2
3
4 -6,566
-6,532
5 -24
-169
6
7
8
9
10
11
12
13
14
15
1: Forest Tree Dominated Area (Terrestrial), 2: Mangrove Forest, 3: Mangrove Plantation, 4: Plain Land Forest (Sal Forest), 5: Rubber Plantation, 6: Forest Tree Dominated Area (Aquatic/ Regularly Flooded, 7: Orchards and Other Plantations (Trees), 8: Herb Dominated Area, 9: Herbaceous Crops, 10: Mud Flats or Intertidal Area, 11: Non vegetated, 12: Rivers and Khals, 13: Rural Settlement, 14: Swamp Reed Land, 15: Shrubs with scattered trees

128 | P a g e
Table 79: Adjusted areas (in hectares) of low restoration in the sal zone.
Area adj (ha) 2015
1 2 3 4 5 6 7 8 9 10 11 12 13 14 15
2000
1 2,423
2 3
2
3
4 259
1,578 54
5
1,374
6
7
8
9
10
11
12
13
14
15
1: Forest Tree Dominated Area (Terrestrial), 2: Mangrove Forest, 3: Mangrove Plantation, 4: Plain Land Forest (Sal Forest), 5: Rubber Plantation, 6: Forest Tree Dominated Area (Aquatic/ Regularly Flooded, 7: Orchards and Other Plantations (Trees), 8: Herb Dominated Area, 9: Herbaceous Crops, 10: Mud Flats or Intertidal Area, 11: Non vegetated, 12: Rivers and Khals, 13: Rural Settlement, 14: Swamp Reed Land, 15: Shrubs with scattered trees

129 | P a g e
Table 80: Adjusted removal factors (in tCO2e/ha) associated with the adjusted areas (in ha) of low restoration in the sal zone.
EFRF (tCO2e/ha) 2015
1 2 3 4 5 6 7 8 9 10 11 12 13 14 15
2000
1 -17
-39 -19
2
3
4 8
-26 -1
5
-18
6
7
8
9
10
11
12
13
14
15
1: Forest Tree Dominated Area (Terrestrial), 2: Mangrove Forest, 3: Mangrove Plantation, 4: Plain Land Forest (Sal Forest), 5: Rubber Plantation, 6: Forest Tree Dominated Area (Aquatic/ Regularly Flooded, 7: Orchards and Other Plantations (Trees), 8: Herb Dominated Area, 9: Herbaceous Crops, 10: Mud Flats or Intertidal Area, 11: Non vegetated, 12: Rivers and Khals, 13: Rural Settlement, 14: Swamp Reed Land, 15: Shrubs with scattered trees

130 | P a g e
Table 81: Annual emissions and removals (in tCO2e/year) from low restoration in the sal zone.
ER (tCO2e/year) 2015
1 2 3 4 5 6 7 8 9 10 11 12 13 14 15
2000
1 -2,748
-5 -3
2
3
4 133
-2,739 -4
5
-1,603
6
7
8
9
10
11
12
13
14
15
1: Forest Tree Dominated Area (Terrestrial), 2: Mangrove Forest, 3: Mangrove Plantation, 4: Plain Land Forest (Sal Forest), 5: Rubber Plantation, 6: Forest Tree Dominated Area (Aquatic/ Regularly Flooded, 7: Orchards and Other Plantations (Trees), 8: Herb Dominated Area, 9: Herbaceous Crops, 10: Mud Flats or Intertidal Area, 11: Non vegetated, 12: Rivers and Khals, 13: Rural Settlement, 14: Swamp Reed Land, 15: Shrubs with scattered trees

131 | P a g e
Table 82: Adjusted areas (in hectares) of deforestation, reforestation and stable non-forest in the sundarban zone.
Area adj (ha) 2015
1 2 3 4 5 6 7 8 9 10 11 12 13 14 15
2000
1
2
113 0 146 47 2,056
3
1
4
5
6
7
8 702 396 168 27 494
9 3 0
0 0
10 484
26
305 87 3,731
11 58
33
103 180 646
12 1,136
0 138 0 567 201 182,911
13
14
15
1: Forest Tree Dominated Area (Terrestrial), 2: Mangrove Forest, 3: Mangrove Plantation, 4: Plain Land Forest (Sal Forest), 5: Rubber Plantation, 6: Forest Tree Dominated Area (Aquatic/ Regularly Flooded, 7: Orchards and Other Plantations (Trees), 8: Herb Dominated Area, 9: Herbaceous Crops, 10: Mud Flats or Intertidal Area, 11: Non vegetated, 12: Rivers and Khals, 13: Rural Settlement, 14: Swamp Reed Land, 15: Shrubs with scattered trees

132 | P a g e
Table 83: Adjusted emission and removal factors (in tCO2e/ha) associated with the adjusted areas (in ha) of deforestation, reforestation and stable non-forest in
the sundarban zone.
EFRF (tCO2e/ha) 2015
1 2 3 4 5 6 7 8 9 10 11 12 13 14 15
2000
1
2
-411 - 102 114 99
3
-
4
5
6
7
8
126
-58
29 52 12
9
-7
-46
- -
10
-127
-
- - -
11
-91
- -62
- - -
12
-83
- -205 - - - -
13
14
15
1: Forest Tree Dominated Area (Terrestrial), 2: Mangrove Forest, 3: Mangrove Plantation, 4: Plain Land Forest (Sal Forest), 5: Rubber Plantation, 6: Forest Tree Dominated Area (Aquatic/ Regularly Flooded, 7: Orchards and Other Plantations (Trees), 8: Herb Dominated Area, 9: Herbaceous Crops, 10: Mud Flats or Intertidal Area, 11: Non vegetated, 12: Rivers and Khals, 13: Rural Settlement, 14: Swamp Reed Land, 15: Shrubs with scattered trees
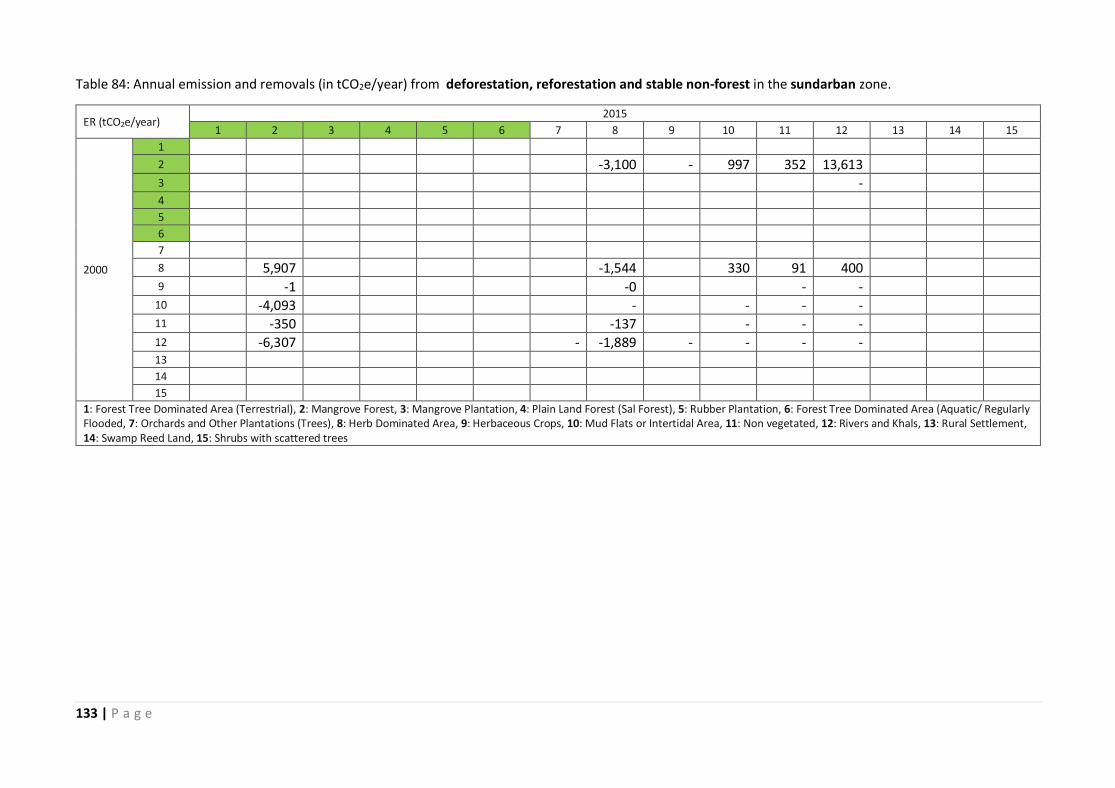
133 | P a g e
Table 84: Annual emission and removals (in tCO2e/year) from deforestation, reforestation and stable non-forest in the sundarban zone.
ER (tCO2e/year) 2015
1 2 3 4 5 6 7 8 9 10 11 12 13 14 15
2000
1 2 -3,100 - 997 352 13,613
3 -
4 5 6 7 8 5,907 -1,544 330 91 400
9 -1 -0 - -
10 -4,093 - - - -
11 -350 -137 - - -
12 -6,307 - -1,889 - - - -
13 14 15
1: Forest Tree Dominated Area (Terrestrial), 2: Mangrove Forest, 3: Mangrove Plantation, 4: Plain Land Forest (Sal Forest), 5: Rubber Plantation, 6: Forest Tree Dominated Area (Aquatic/ Regularly Flooded, 7: Orchards and Other Plantations (Trees), 8: Herb Dominated Area, 9: Herbaceous Crops, 10: Mud Flats or Intertidal Area, 11: Non vegetated, 12: Rivers and Khals, 13: Rural Settlement, 14: Swamp Reed Land, 15: Shrubs with scattered trees

134 | P a g e
Table 85: Adjusted areas (in hectares) of high degradation in the sundarban zone.
Area adj (ha) 2015
1 2 3 4 5 6 7 8 9 10 11 12 13 14 15
2000
1
2 4
3
4
5
6
7
8
9
10
11
12
13
14
15
1: Forest Tree Dominated Area (Terrestrial), 2: Mangrove Forest, 3: Mangrove Plantation, 4: Plain Land Forest (Sal Forest), 5: Rubber Plantation, 6: Forest Tree Dominated Area (Aquatic/ Regularly Flooded, 7: Orchards and Other Plantations (Trees), 8: Herb Dominated Area, 9: Herbaceous Crops, 10: Mud Flats or Intertidal Area, 11: Non vegetated, 12: Rivers and Khals, 13: Rural Settlement, 14: Swamp Reed Land, 15: Shrubs with scattered trees

135 | P a g e
Table 86: Adjusted emission factors (in tCO2e/ha) associated with the adjusted areas (in ha) of high degradation in the sundarban zone.
EFRF (tCO2e/ha) 2015
1 2 3 4 5 6 7 8 9 10 11 12 13 14 15
2000
1
2 66
3
4
5
6
7
8
9
10
11
12
13
14
15
1: Forest Tree Dominated Area (Terrestrial), 2: Mangrove Forest, 3: Mangrove Plantation, 4: Plain Land Forest (Sal Forest), 5: Rubber Plantation, 6: Forest Tree Dominated Area (Aquatic/ Regularly Flooded, 7: Orchards and Other Plantations (Trees), 8: Herb Dominated Area, 9: Herbaceous Crops, 10: Mud Flats or Intertidal Area, 11: Non vegetated, 12: Rivers and Khals, 13: Rural Settlement, 14: Swamp Reed Land, 15: Shrubs with scattered trees
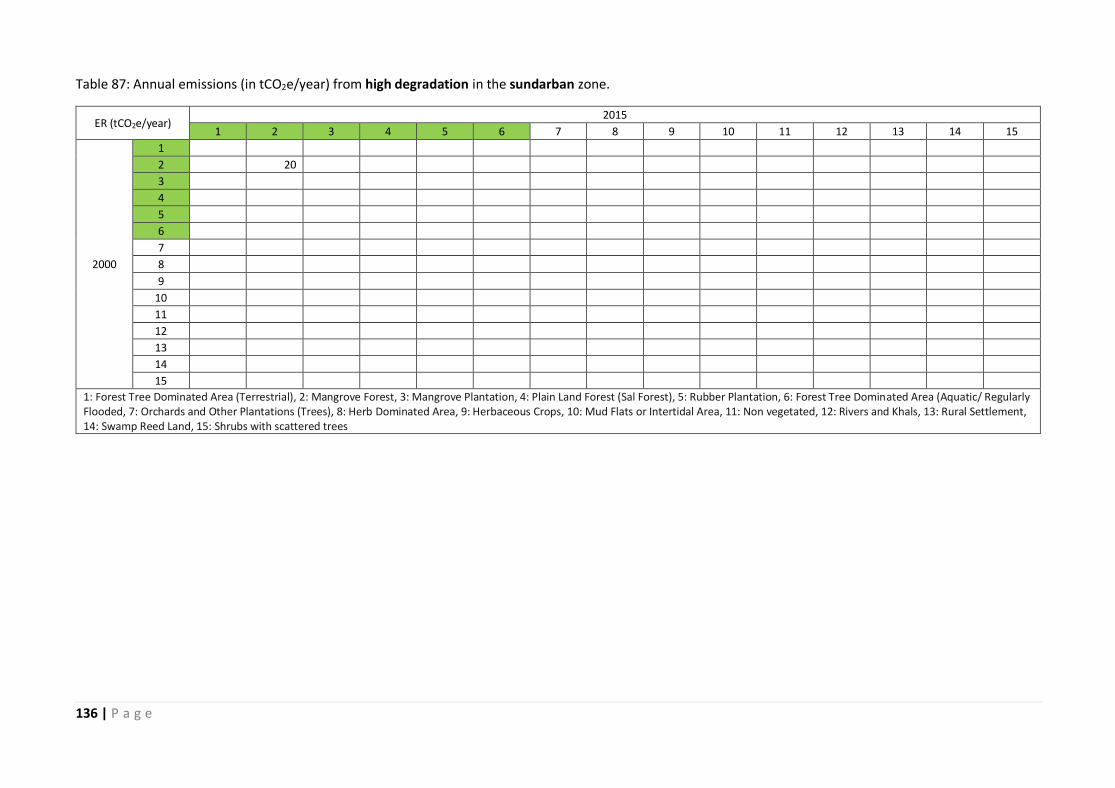
136 | P a g e
Table 87: Annual emissions (in tCO2e/year) from high degradation in the sundarban zone.
ER (tCO2e/year) 2015
1 2 3 4 5 6 7 8 9 10 11 12 13 14 15
2000
1
2 20
3
4
5
6
7
8
9
10
11
12
13
14
15
1: Forest Tree Dominated Area (Terrestrial), 2: Mangrove Forest, 3: Mangrove Plantation, 4: Plain Land Forest (Sal Forest), 5: Rubber Plantation, 6: Forest Tree Dominated Area (Aquatic/ Regularly Flooded, 7: Orchards and Other Plantations (Trees), 8: Herb Dominated Area, 9: Herbaceous Crops, 10: Mud Flats or Intertidal Area, 11: Non vegetated, 12: Rivers and Khals, 13: Rural Settlement, 14: Swamp Reed Land, 15: Shrubs with scattered trees

137 | P a g e
Table 88: Adjusted areas (in hectares) of low degradation in the sundarban zone.
Area adj (ha) 2015
1 2 3 4 5 6 7 8 9 10 11 12 13 14 15
2000
1
2 168
3
4
5
6
7
8
9
10
11
12
13
14
15
1: Forest Tree Dominated Area (Terrestrial), 2: Mangrove Forest, 3: Mangrove Plantation, 4: Plain Land Forest (Sal Forest), 5: Rubber Plantation, 6: Forest Tree Dominated Area (Aquatic/ Regularly Flooded, 7: Orchards and Other Plantations (Trees), 8: Herb Dominated Area, 9: Herbaceous Crops, 10: Mud Flats or Intertidal Area, 11: Non vegetated, 12: Rivers and Khals, 13: Rural Settlement, 14: Swamp Reed Land, 15: Shrubs with scattered trees

138 | P a g e
Table 89: Adjusted emission factors (in tCO2e/ha) associated with the adjusted areas (in ha) of low degradation in the sundarban zone.
EFRF (tCO2e/ha) 2015
1 2 3 4 5 6 7 8 9 10 11 12 13 14 15
2000
1
2 16
3
4
5
6
7
8
9
10
11
12
13
14
15
1: Forest Tree Dominated Area (Terrestrial), 2: Mangrove Forest, 3: Mangrove Plantation, 4: Plain Land Forest (Sal Forest), 5: Rubber Plantation, 6: Forest Tree Dominated Area (Aquatic/ Regularly Flooded, 7: Orchards and Other Plantations (Trees), 8: Herb Dominated Area, 9: Herbaceous Crops, 10: Mud Flats or Intertidal Area, 11: Non vegetated, 12: Rivers and Khals, 13: Rural Settlement, 14: Swamp Reed Land, 15: Shrubs with scattered trees

139 | P a g e
Table 90: Annual emissions (in tCO2e/year) from low degradation in the sundarban zone.
ER (tCO2e/year) 2015
1 2 3 4 5 6 7 8 9 10 11 12 13 14 15
2000
1
2 184
3 -
4
5
6
7
8
9
10
11
12
13
14
15
1: Forest Tree Dominated Area (Terrestrial), 2: Mangrove Forest, 3: Mangrove Plantation, 4: Plain Land Forest (Sal Forest), 5: Rubber Plantation, 6: Forest Tree Dominated Area (Aquatic/ Regularly Flooded, 7: Orchards and Other Plantations (Trees), 8: Herb Dominated Area, 9: Herbaceous Crops, 10: Mud Flats or Intertidal Area, 11: Non vegetated, 12: Rivers and Khals, 13: Rural Settlement, 14: Swamp Reed Land, 15: Shrubs with scattered trees

140 | P a g e
Table 91: Adjusted areas (in hectares) of high restoration in the sundarban zone.
Area adj (ha) 2015
1 2 3 4 5 6 7 8 9 10 11 12 13 14 15
2000
1
2 1,216
3
4
5
6
7
8
9
10
11
12
13
14
15
1: Forest Tree Dominated Area (Terrestrial), 2: Mangrove Forest, 3: Mangrove Plantation, 4: Plain Land Forest (Sal Forest), 5: Rubber Plantation, 6: Forest Tree Dominated Area (Aquatic/ Regularly Flooded, 7: Orchards and Other Plantations (Trees), 8: Herb Dominated Area, 9: Herbaceous Crops, 10: Mud Flats or Intertidal Area, 11: Non vegetated, 12: Rivers and Khals, 13: Rural Settlement, 14: Swamp Reed Land, 15: Shrubs with scattered trees

141 | P a g e
Table 92: Adjusted removal factors (in tCO2e/ha) associated with the adjusted areas (in ha) of high restoration in the sundarban zone.
EFRF (tCO2e/ha) 2015
1 2 3 4 5 6 7 8 9 10 11 12 13 14 15
2000
1
2 -166
3
4
5
6
7
8
9
10
11
12
13
14
15
1: Forest Tree Dominated Area (Terrestrial), 2: Mangrove Forest, 3: Mangrove Plantation, 4: Plain Land Forest (Sal Forest), 5: Rubber Plantation, 6: Forest Tree Dominated Area (Aquatic/ Regularly Flooded, 7: Orchards and Other Plantations (Trees), 8: Herb Dominated Area, 9: Herbaceous Crops, 10: Mud Flats or Intertidal Area, 11: Non vegetated, 12: Rivers and Khals, 13: Rural Settlement, 14: Swamp Reed Land, 15: Shrubs with scattered trees

142 | P a g e
Table 93: Annual removals (in tCO2e/year) from high restoration in the sundarban zone.
ER (tCO2e/year) 2015
1 2 3 4 5 6 7 8 9 10 11 12 13 14 15
2000
1
2 -13,453
3
4
5
6
7
8
9
10
11
12
13
14
15
1: Forest Tree Dominated Area (Terrestrial), 2: Mangrove Forest, 3: Mangrove Plantation, 4: Plain Land Forest (Sal Forest), 5: Rubber Plantation, 6: Forest Tree Dominated Area (Aquatic/ Regularly Flooded, 7: Orchards and Other Plantations (Trees), 8: Herb Dominated Area, 9: Herbaceous Crops, 10: Mud Flats or Intertidal Area, 11: Non vegetated, 12: Rivers and Khals, 13: Rural Settlement, 14: Swamp Reed Land, 15: Shrubs with scattered trees

143 | P a g e
Table 94: Adjusted areas (in hectares) of low restoration in the sundarban zone.
Area adj (ha) 2015
1 2 3 4 5 6 7 8 9 10 11 12 13 14 15
2000
1
2 4,212
3
4
5
6
7
8
9
10
11
12
13
14
15
1: Forest Tree Dominated Area (Terrestrial), 2: Mangrove Forest, 3: Mangrove Plantation, 4: Plain Land Forest (Sal Forest), 5: Rubber Plantation, 6: Forest Tree Dominated Area (Aquatic/ Regularly Flooded, 7: Orchards and Other Plantations (Trees), 8: Herb Dominated Area, 9: Herbaceous Crops, 10: Mud Flats or Intertidal Area, 11: Non vegetated, 12: Rivers and Khals, 13: Rural Settlement, 14: Swamp Reed Land, 15: Shrubs with scattered trees

144 | P a g e
Table 95: Adjusted removal factors (in tCO2e/ha) associated with the adjusted areas (in ha) of low restoration in the sundarban zone.
EFRF (tCO2e/ha) 2015
1 2 3 4 5 6 7 8 9 10 11 12 13 14 15
2000
1
2 -19
3
4
5
6
7
8
9
10
11
12
13
14
15
1: Forest Tree Dominated Area (Terrestrial), 2: Mangrove Forest, 3: Mangrove Plantation, 4: Plain Land Forest (Sal Forest), 5: Rubber Plantation, 6: Forest Tree Dominated Area (Aquatic/ Regularly Flooded, 7: Orchards and Other Plantations (Trees), 8: Herb Dominated Area, 9: Herbaceous Crops, 10: Mud Flats or Intertidal Area, 11: Non vegetated, 12: Rivers and Khals, 13: Rural Settlement, 14: Swamp Reed Land, 15: Shrubs with scattered trees

145 | P a g e
Table 96: Annual removals (in tCO2e/year) from low restoration in the sundarban zone.
ER (tCO2e/year) 2015
1 2 3 4 5 6 7 8 9 10 11 12 13 14 15
2000
1
2 -5,202
3
4
5
6
7
8
9
10
11
12
13
14
15
1: Forest Tree Dominated Area (Terrestrial), 2: Mangrove Forest, 3: Mangrove Plantation, 4: Plain Land Forest (Sal Forest), 5: Rubber Plantation, 6: Forest Tree Dominated Area (Aquatic/ Regularly Flooded, 7: Orchards and Other Plantations (Trees), 8: Herb Dominated Area, 9: Herbaceous Crops, 10: Mud Flats or Intertidal Area, 11: Non vegetated, 12: Rivers and Khals, 13: Rural Settlement, 14: Swamp Reed Land, 15: Shrubs with scattered trees
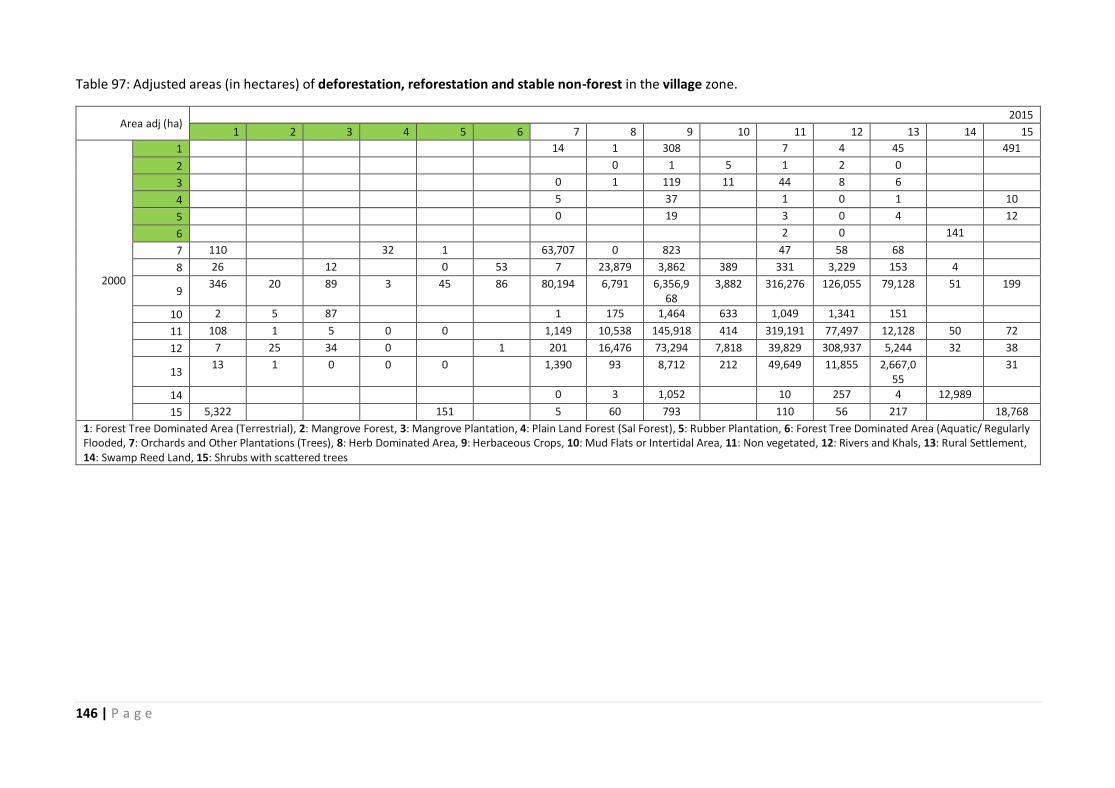
146 | P a g e
Table 97: Adjusted areas (in hectares) of deforestation, reforestation and stable non-forest in the village zone.
Area adj (ha) 2015
1 2 3 4 5 6 7 8 9 10 11 12 13 14 15
2000
1
14 1 308
7 4 45
491
2
0 1 5 1 2 0
3
0 1 119 11 44 8 6
4
5
37
1 0 1
10
5
0
19
3 0 4
12
6
2 0
141
7 110
32 1
63,707 0 823
47 58 68
8 26
12
0 53 7 23,879 3,862 389 331 3,229 153 4
9 346 20 89 3 45 86 80,194 6,791 6,356,9
68 3,882 316,276 126,055 79,128 51 199
10 2 5 87
1 175 1,464 633 1,049 1,341 151
11 108 1 5 0 0
1,149 10,538 145,918 414 319,191 77,497 12,128 50 72
12 7 25 34 0
1 201 16,476 73,294 7,818 39,829 308,937 5,244 32 38
13 13 1 0 0 0
1,390 93 8,712 212 49,649 11,855 2,667,0
55
31
14
0 3 1,052
10 257 4 12,989
15 5,322
151
5 60 793
110 56 217
18,768
1: Forest Tree Dominated Area (Terrestrial), 2: Mangrove Forest, 3: Mangrove Plantation, 4: Plain Land Forest (Sal Forest), 5: Rubber Plantation, 6: Forest Tree Dominated Area (Aquatic/ Regularly Flooded, 7: Orchards and Other Plantations (Trees), 8: Herb Dominated Area, 9: Herbaceous Crops, 10: Mud Flats or Intertidal Area, 11: Non vegetated, 12: Rivers and Khals, 13: Rural Settlement, 14: Swamp Reed Land, 15: Shrubs with scattered trees
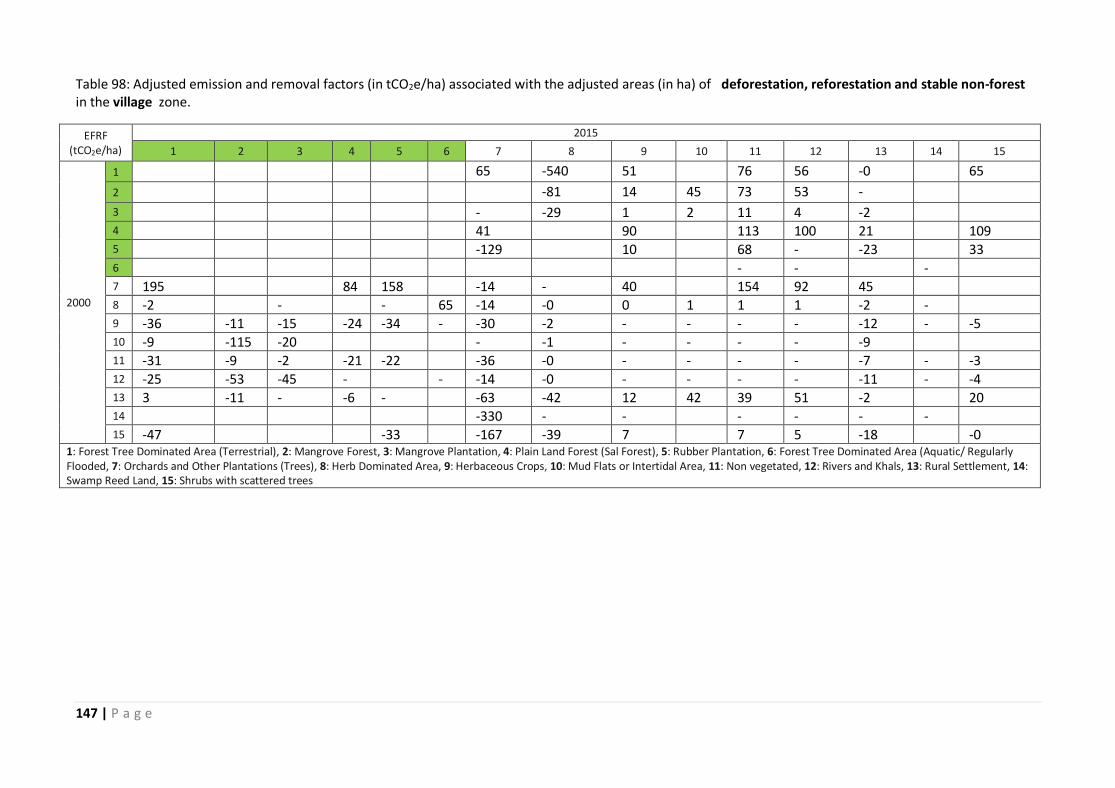
147 | P a g e
Table 98: Adjusted emission and removal factors (in tCO2e/ha) associated with the adjusted areas (in ha) of deforestation, reforestation and stable non-forest in the village zone.
EFRF (tCO2e/ha)
2015
1 2 3 4 5 6 7 8 9 10 11 12 13 14 15
2000
1
65 -540 51
76 56 -0
65
2
-81 14 45 73 53 -
3
- -29 1 2 11 4 -2
4
41
90
113 100 21
109 5
-129
10
68 - -23
33
6
- -
-
7 195
84 158
-14 - 40
154 92 45
8 -2
-
- 65 -14 -0 0 1 1 1 -2 -
9 -36 -11 -15 -24 -34 - -30 -2 - - - - -12 - -5 10 -9 -115 -20
- -1 - - - - -9
11 -31 -9 -2 -21 -22
-36 -0 - - - - -7 - -3 12 -25 -53 -45 -
- -14 -0 - - - - -11 - -4
13 3 -11 - -6 -
-63 -42 12 42 39 51 -2
20 14
-330 - -
- - - -
15 -47
-33
-167 -39 7
7 5 -18
-0 1: Forest Tree Dominated Area (Terrestrial), 2: Mangrove Forest, 3: Mangrove Plantation, 4: Plain Land Forest (Sal Forest), 5: Rubber Plantation, 6: Forest Tree Dominated Area (Aquatic/ Regularly Flooded, 7: Orchards and Other Plantations (Trees), 8: Herb Dominated Area, 9: Herbaceous Crops, 10: Mud Flats or Intertidal Area, 11: Non vegetated, 12: Rivers and Khals, 13: Rural Settlement, 14: Swamp Reed Land, 15: Shrubs with scattered trees
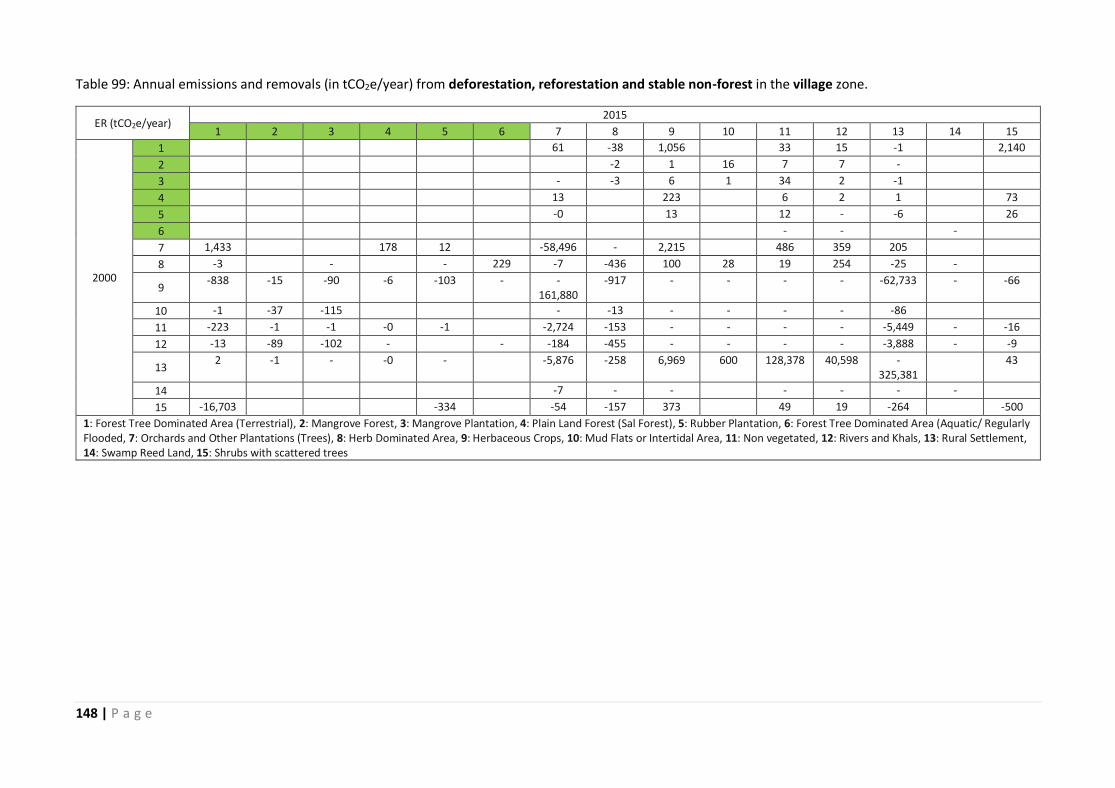
148 | P a g e
Table 99: Annual emissions and removals (in tCO2e/year) from deforestation, reforestation and stable non-forest in the village zone.
ER (tCO2e/year) 2015
1 2 3 4 5 6 7 8 9 10 11 12 13 14 15
2000
1
61 -38 1,056
33 15 -1
2,140
2
-2 1 16 7 7 -
3
- -3 6 1 34 2 -1
4
13
223
6 2 1
73
5
-0
13
12 - -6
26
6
- -
-
7 1,433
178 12
-58,496 - 2,215
486 359 205
8 -3
-
- 229 -7 -436 100 28 19 254 -25 -
9 -838 -15 -90 -6 -103 - -
161,880 -917 - - - - -62,733 - -66
10 -1 -37 -115
- -13 - - - - -86
11 -223 -1 -1 -0 -1
-2,724 -153 - - - - -5,449 - -16
12 -13 -89 -102 -
- -184 -455 - - - - -3,888 - -9
13 2 -1 - -0 -
-5,876 -258 6,969 600 128,378 40,598 -
325,381
43
14
-7 - -
- - - -
15 -16,703
-334
-54 -157 373
49 19 -264
-500
1: Forest Tree Dominated Area (Terrestrial), 2: Mangrove Forest, 3: Mangrove Plantation, 4: Plain Land Forest (Sal Forest), 5: Rubber Plantation, 6: Forest Tree Dominated Area (Aquatic/ Regularly Flooded, 7: Orchards and Other Plantations (Trees), 8: Herb Dominated Area, 9: Herbaceous Crops, 10: Mud Flats or Intertidal Area, 11: Non vegetated, 12: Rivers and Khals, 13: Rural Settlement, 14: Swamp Reed Land, 15: Shrubs with scattered trees
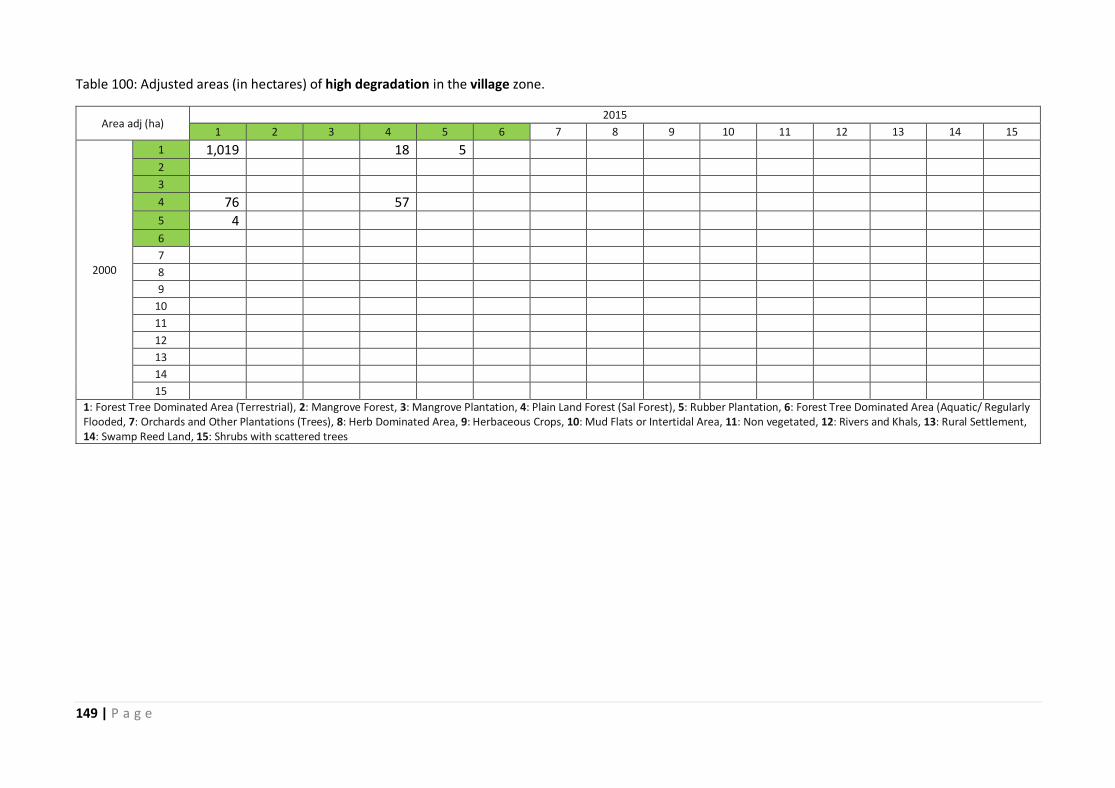
149 | P a g e
Table 100: Adjusted areas (in hectares) of high degradation in the village zone.
Area adj (ha) 2015
1 2 3 4 5 6 7 8 9 10 11 12 13 14 15
2000
1 1,019 18 5
2
3
4 76 57
5 4
6
7
8
9
10
11
12
13
14
15
1: Forest Tree Dominated Area (Terrestrial), 2: Mangrove Forest, 3: Mangrove Plantation, 4: Plain Land Forest (Sal Forest), 5: Rubber Plantation, 6: Forest Tree Dominated Area (Aquatic/ Regularly Flooded, 7: Orchards and Other Plantations (Trees), 8: Herb Dominated Area, 9: Herbaceous Crops, 10: Mud Flats or Intertidal Area, 11: Non vegetated, 12: Rivers and Khals, 13: Rural Settlement, 14: Swamp Reed Land, 15: Shrubs with scattered trees
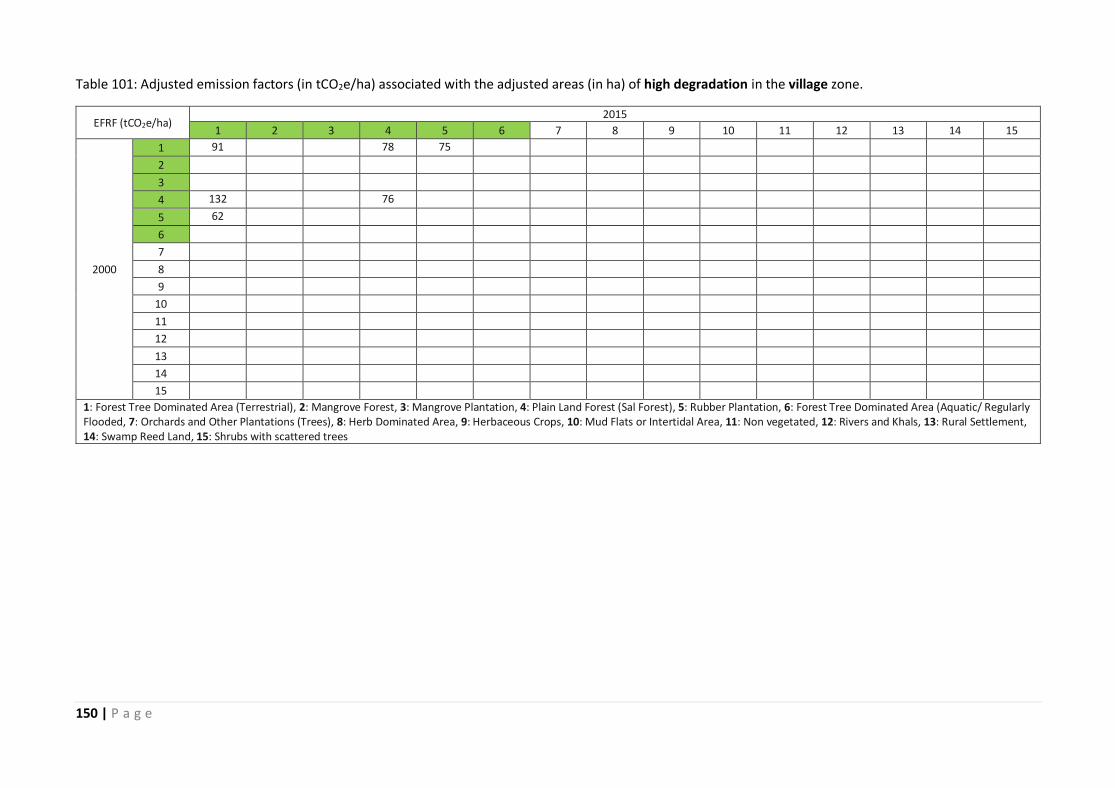
150 | P a g e
Table 101: Adjusted emission factors (in tCO2e/ha) associated with the adjusted areas (in ha) of high degradation in the village zone.
EFRF (tCO2e/ha) 2015
1 2 3 4 5 6 7 8 9 10 11 12 13 14 15
2000
1 91
78 75
2
3
4 132
76
5 62
6
7
8
9
10
11
12
13
14
15
1: Forest Tree Dominated Area (Terrestrial), 2: Mangrove Forest, 3: Mangrove Plantation, 4: Plain Land Forest (Sal Forest), 5: Rubber Plantation, 6: Forest Tree Dominated Area (Aquatic/ Regularly Flooded, 7: Orchards and Other Plantations (Trees), 8: Herb Dominated Area, 9: Herbaceous Crops, 10: Mud Flats or Intertidal Area, 11: Non vegetated, 12: Rivers and Khals, 13: Rural Settlement, 14: Swamp Reed Land, 15: Shrubs with scattered trees

151 | P a g e
Table 102: Annual emissions (in tCO2e/year) from high degradation in the village zone.
ER (tCO2e/year) 2015
1 2 3 4 5 6 7 8 9 10 11 12 13 14 15
2000
1 6,192
91 27
2
3
4 669
290
5 15
6
7
8
9
10
11
12
13
14
15
1: Forest Tree Dominated Area (Terrestrial), 2: Mangrove Forest, 3: Mangrove Plantation, 4: Plain Land Forest (Sal Forest), 5: Rubber Plantation, 6: Forest Tree Dominated Area (Aquatic/ Regularly Flooded, 7: Orchards and Other Plantations (Trees), 8: Herb Dominated Area, 9: Herbaceous Crops, 10: Mud Flats or Intertidal Area, 11: Non vegetated, 12: Rivers and Khals, 13: Rural Settlement, 14: Swamp Reed Land, 15: Shrubs with scattered trees

152 | P a g e
Table 103: Adjusted areas (in hectares) of low degradation in the village zone.
Area adj (ha) 2015
1 2 3 4 5 6 7 8 9 10 11 12 13 14 15
2000
1 401
11
2
3
118
4 29
186
5
7
6
7
8
9
10
11
12
13
14
15
1: Forest Tree Dominated Area (Terrestrial), 2: Mangrove Forest, 3: Mangrove Plantation, 4: Plain Land Forest (Sal Forest), 5: Rubber Plantation, 6: Forest Tree Dominated Area (Aquatic/ Regularly Flooded, 7: Orchards and Other Plantations (Trees), 8: Herb Dominated Area, 9: Herbaceous Crops, 10: Mud Flats or Intertidal Area, 11: Non vegetated, 12: Rivers and Khals, 13: Rural Settlement, 14: Swamp Reed Land, 15: Shrubs with scattered trees
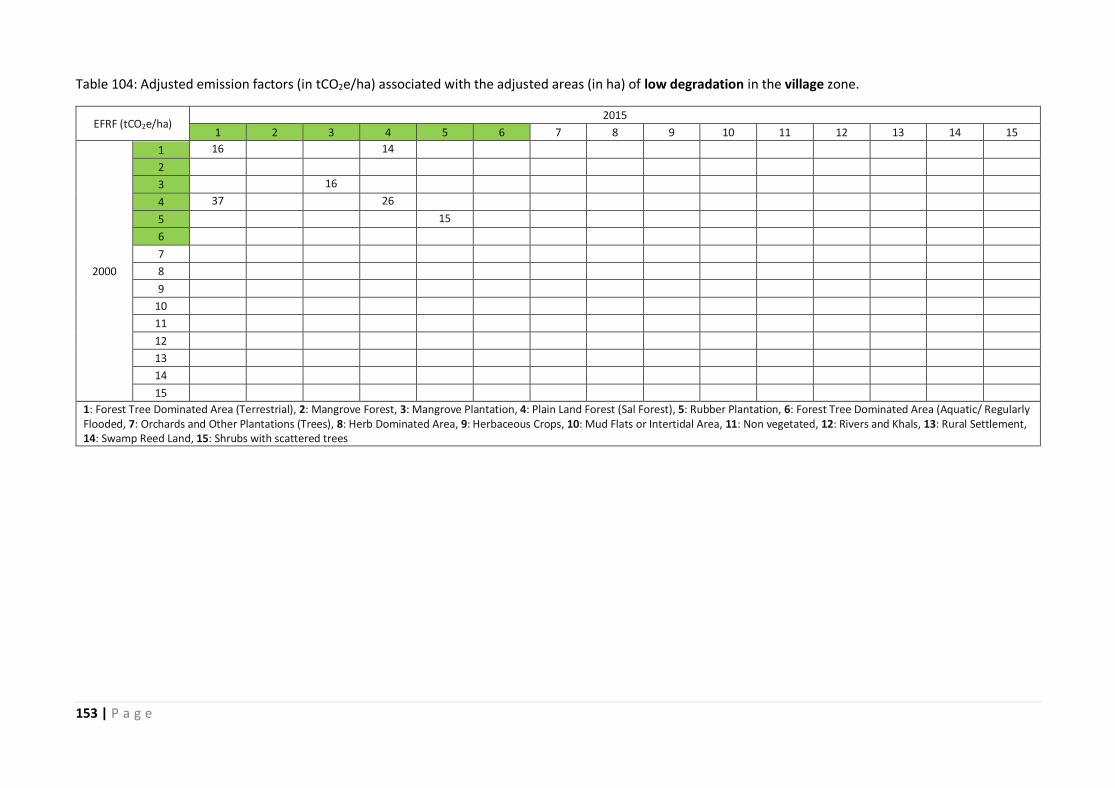
153 | P a g e
Table 104: Adjusted emission factors (in tCO2e/ha) associated with the adjusted areas (in ha) of low degradation in the village zone.
EFRF (tCO2e/ha) 2015
1 2 3 4 5 6 7 8 9 10 11 12 13 14 15
2000
1 16
14
2
3
16
4 37
26
5
15
6
7
8
9
10
11
12
13
14
15
1: Forest Tree Dominated Area (Terrestrial), 2: Mangrove Forest, 3: Mangrove Plantation, 4: Plain Land Forest (Sal Forest), 5: Rubber Plantation, 6: Forest Tree Dominated Area (Aquatic/ Regularly Flooded, 7: Orchards and Other Plantations (Trees), 8: Herb Dominated Area, 9: Herbaceous Crops, 10: Mud Flats or Intertidal Area, 11: Non vegetated, 12: Rivers and Khals, 13: Rural Settlement, 14: Swamp Reed Land, 15: Shrubs with scattered trees

154 | P a g e
Table 105: Annual emissions (in tCO2e/year) from low degradation in the village zone.
ER (tCO2e/year) 2015
1 2 3 4 5 6 7 8 9 10 11 12 13 14 15
2000
1 437
10
2
3
126
4 71
325
5
7
6
7
8
9
10
11
12
13
14
15
1: Forest Tree Dominated Area (Terrestrial), 2: Mangrove Forest, 3: Mangrove Plantation, 4: Plain Land Forest (Sal Forest), 5: Rubber Plantation, 6: Forest Tree Dominated Area (Aquatic/ Regularly Flooded, 7: Orchards and Other Plantations (Trees), 8: Herb Dominated Area, 9: Herbaceous Crops, 10: Mud Flats or Intertidal Area, 11: Non vegetated, 12: Rivers and Khals, 13: Rural Settlement, 14: Swamp Reed Land, 15: Shrubs with scattered trees

155 | P a g e
Table 106: Adjusted areas (in hectares) of high restoration in the village zone.
Area adj (ha) 2015
1 2 3 4 5 6 7 8 9 10 11 12 13 14 15
2000
1 1,282
15 33
2
3
1,319
4 27
5 8
6
7
8
9
10
11
12
13
14
15
1: Forest Tree Dominated Area (Terrestrial), 2: Mangrove Forest, 3: Mangrove Plantation, 4: Plain Land Forest (Sal Forest), 5: Rubber Plantation, 6: Forest Tree Dominated Area (Aquatic/ Regularly Flooded, 7: Orchards and Other Plantations (Trees), 8: Herb Dominated Area, 9: Herbaceous Crops, 10: Mud Flats or Intertidal Area, 11: Non vegetated, 12: Rivers and Khals, 13: Rural Settlement, 14: Swamp Reed Land, 15: Shrubs with scattered trees

156 | P a g e
Table 107: Adjusted removal factors (in tCO2e/ha) associated with the adjusted areas (in ha) of high restoration in the village zone.
EFRF (tCO2e/ha) 2015
1 2 3 4 5 6 7 8 9 10 11 12 13 14 15
2000
1 -72
-116 -24
2
3
-65
4 -41
5 -78
6
7
8
9
10
11
12
13
14
15
1: Forest Tree Dominated Area (Terrestrial), 2: Mangrove Forest, 3: Mangrove Plantation, 4: Plain Land Forest (Sal Forest), 5: Rubber Plantation, 6: Forest Tree Dominated Area (Aquatic/ Regularly Flooded, 7: Orchards and Other Plantations (Trees), 8: Herb Dominated Area, 9: Herbaceous Crops, 10: Mud Flats or Intertidal Area, 11: Non vegetated, 12: Rivers and Khals, 13: Rural Settlement, 14: Swamp Reed Land, 15: Shrubs with scattered trees

157 | P a g e
Table 108: Annual removals (in tCO2e/year) from high restoration in the village zone.
ER (tCO2e/year) 2015
1 2 3 4 5 6 7 8 9 10 11 12 13 14 15
2000
1 -6,116
-118 -53
2
3
-5,729
4 -74
5 -41
6
7
8
9
10
11
12
13
14
15
1: Forest Tree Dominated Area (Terrestrial), 2: Mangrove Forest, 3: Mangrove Plantation, 4: Plain Land Forest (Sal Forest), 5: Rubber Plantation, 6: Forest Tree Dominated Area (Aquatic/ Regularly Flooded, 7: Orchards and Other Plantations (Trees), 8: Herb Dominated Area, 9: Herbaceous Crops, 10: Mud Flats or Intertidal Area, 11: Non vegetated, 12: Rivers and Khals, 13: Rural Settlement, 14: Swamp Reed Land, 15: Shrubs with scattered trees

158 | P a g e
Table 109: Adjusted areas (in hectares) of low restoration in the village zone.
Area adj (ha) 2015
1 2 3 4 5 6 7 8 9 10 11 12 13 14 15
2000
1 1,360
50
2
3
240
4 76
432
5
37
6
7
8
9
10
11
12
13
14
15
1: Forest Tree Dominated Area (Terrestrial), 2: Mangrove Forest, 3: Mangrove Plantation, 4: Plain Land Forest (Sal Forest), 5: Rubber Plantation, 6: Forest Tree Dominated Area (Aquatic/ Regularly Flooded, 7: Orchards and Other Plantations (Trees), 8: Herb Dominated Area, 9: Herbaceous Crops, 10: Mud Flats or Intertidal Area, 11: Non vegetated, 12: Rivers and Khals, 13: Rural Settlement, 14: Swamp Reed Land, 15: Shrubs with scattered trees

159 | P a g e
Table 110: Adjusted emission and removal factors (in tCO2e/ha) associated with the adjusted areas (in ha) of low restoration in the village zone.
EFRF (tCO2e/ha) 2015
1 2 3 4 5 6 7 8 9 10 11 12 13 14 15
2000
1 -13
-15
2
3
-15
4 10
-25
5
-14
6
7
8
9
10
11
12
13
14
15
1: Forest Tree Dominated Area (Terrestrial), 2: Mangrove Forest, 3: Mangrove Plantation, 4: Plain Land Forest (Sal Forest), 5: Rubber Plantation, 6: Forest Tree Dominated Area (Aquatic/ Regularly Flooded, 7: Orchards and Other Plantations (Trees), 8: Herb Dominated Area, 9: Herbaceous Crops, 10: Mud Flats or Intertidal Area, 11: Non vegetated, 12: Rivers and Khals, 13: Rural Settlement, 14: Swamp Reed Land, 15: Shrubs with scattered trees

160 | P a g e
Table 111: Annual emissions and removals (in tCO2e/year) from low restoration in the village zone.
ER (tCO2e/year) 2015
1 2 3 4 5 6 7 8 9 10 11 12 13 14 15
2000
1 -1,206
-51
2
3
-243
4 50
-715
5
-36
6
7
8
9
10
11
12
13
14
15
1: Forest Tree Dominated Area (Terrestrial), 2: Mangrove Forest, 3: Mangrove Plantation, 4: Plain Land Forest (Sal Forest), 5: Rubber Plantation, 6: Forest Tree Dominated Area (Aquatic/ Regularly Flooded, 7: Orchards and Other Plantations (Trees), 8: Herb Dominated Area, 9: Herbaceous Crops, 10: Mud Flats or Intertidal Area, 11: Non vegetated, 12: Rivers and Khals, 13: Rural Settlement, 14: Swamp Reed Land, 15: Shrubs with scattered trees

161 | P a g e