THE STUDY FOR WATER POLLUTION REDUCTION ON THE …
62
JAPAN INTERNATIONAL COOPERATION AGENCY (JICA) STATE WATER DIRECTORATE CROATIAN WATERS THE REPUBLIC OF CROATIA THE STUDY FOR WATER POLLUTION REDUCTION ON THE SAVA RIVER BASIN IN THE REPUBLIC OF CROATIA FINAL REPORT Vol. 1 : EXECUTIVE SUMMARY AUGUST 2001 CTI ENGINEERING INTERNATIONAL CO., LTD. IN ASSOCIATION WITH NIHON SUIDO CONSULTANTS CO., LTD. No. SSS J R 01 – 111
Transcript of THE STUDY FOR WATER POLLUTION REDUCTION ON THE …

JAPAN INTERNATIONAL COOPERATION AGENCY (JICA)
STATE WATER DIRECTORATE CROATIAN WATERS
THE REPUBLIC OF CROATIA
THE STUDY FOR WATER POLLUTION REDUCTION
ON THE SAVA RIVER BASIN IN THE REPUBLIC OF CROATIA
FINAL REPORT
Vol. 1 : EXECUTIVE SUMMARY
AUGUST 2001
CTI ENGINEERING INTERNATIONAL CO., LTD.
IN ASSOCIATION WITH
NIHON SUIDO CONSULTANTS CO., LTD.
No.
SSS
J R
01 – 111

JAPAN INTERNATIONAL COOPERATION AGENCY (JICA)
STATE WATER DIRECTORATE CROATIAN WATERS
THE REPUBLIC OF CROATIA
THE STUDY FOR WATER POLLUTION REDUCTION
ON THE SAVA RIVER BASIN IN THE REPUBLIC OF CROATIA
FINAL REPORT
Vol. 1 : EXECUTIVE SUMMARY
AUGUST 2001
CTI ENGINEERING INTERNATIONAL CO., LTD.
IN ASSOCIATION WITH
NIHON SUIDO CONSULTANTS CO., LTD.

EXCHANGE RATE
The currency exchange rates used in this Study are:
US Dollar (US$) 1.00 = Japanese Yen (¥) 116
= Croatian Kuna (Kn.) 8.3
As of February 2001

PREFACE
In response to a request from the Government of the Republic of Croatia, the Government of Japan decided to conduct the Study for Water Pollution Reduction on the Sava River Basin and entrusted the study to the Japan International Cooperation Agency (JICA).
JICA selected and dispatched a study team headed by Mr. Naohito Murata of CTI
Engineering International Co., Ltd., and consisting of members from CTI Engineering International Co., Ltd. and Nihon Suido Consultants Co., Ltd., to the Republic of Croatia three times between October 2000 to July 2001. In addition, JICA set up an advisory committee headed by Mr. Shigeharu Iinoue, Senior Researcher, Urban Development Corporation, between September 2000 and August 2001, which examined the study from specialist and technical points of view.
The team held discussions with the officials concerned of the Government of the Republic
of Croatia and conducted field surveys at the study area. Upon returning to Japan, the team conducted further studies and prepared this final report.
I hope that this report will contribute to the promotion of the project and to the
enhancement of friendly relationship between our two countries. Finally, I wish to express my sincere appreciation to the officials concerned of the
Government of the Republic of Croatia for their close cooperation extended to the team.
August, 2001
Kunihiko Saito
President Japan International Cooperation Agency

August, 2001 Mr. Kunihiko Saito President Japan International Cooperation Agency Tokyo, Japan Sir:
LETTER OF TRANSMITTAL We are pleased to submit herewith the Final Report on the Study for Water Pollution Reduction on the Sava River Basin in the Republic of Croatia. The study was conducted by CTI Engineering International Co., Ltd. in association with Nihon Suido Consultants Co., Ltd., under contracts with JICA during the period from September 2000 to August 2001. In conducting the study, particular attention was paid to the formulation of a master plan, complying with the required conditions for the country to join the European Union in the future. A feasibility study was also conducted on the urgent sewerage development projects of the priority five (5) towns. We wish to take this opportunity to express our sincere gratitude to the Government of Japan, particularly, JICA, the Ministry of Foreign Affairs, the Ministry of Land, Infrastructure and Transport, and other offices concerned. We also wish to express our deep appreciation to the State Water Directorate and the Croatian Waters, the Ministry of Environment, and other authorities concerned of the Government of Croatia for their close cooperation and assistance extended to the JICA study team during the study. Finally, we hope that this report will contribute to the further promotion of the project. Very truly yours,
Naohito Murata Leader, JICA Study Team CTI Engineering International Co., Ltd. Encl. : a/s

Lonja
Lonja
Casma Casma
Trebez
Trebez
CROATIA
ITA
LY
GR
EE
CE
TU
RK
EY
SLO
VA
KIA
CH
EC
H
PO
LA
ND
UK
RA
INE
BE
LA
RU
S
GE
RM
AN
Y
BO
SN
IA-
HE
RZ
EG
OV
INA
SLO
VE
NIA
HU
NG
AR
YA
US
TR
IA
RO
MA
NIA
BU
LG
AR
IA
YU
GO
SLA
VIA
ALB
AN
IAMA
CE
DO
NIA
Riv
er
Cit
y/T
ow
n
Ro
ad
Co
un
try
Bo
un
da
ry
Leg
end
ST
UD
Y A
RE
A M
AP

COMPOSITION OF REPORT
Vol. 1 EXECUTIVE SUMMARY
Vol. 2 MAIN REPORT
Vol. 3 SUPPORTING REPORT (APPENDIX A TO K)
APPENDIX A Socio-economy
APPENDIX B Water Quality and Pollution Mechanism
APPENDIX C Industrial Wastewater Treatment
APPENDIX D Sewerage Development (Master Plan Study)
APPENDIX E Sewerage Development (Feasibility Study)
APPENDIX F Water Quality Monitoring and GIS Data Base
APPENDIX G Institutional Aspects
APPENDIX H Economic and Financial Analysis
APPENDIX I Environmental Aspects
APPENDIX J Sewer Maintenance
APPENDIX K Planning Manual for Small Scale Sewage Treatment System
Vol. 4 DATA BOOK

A-1
ABSTRACT
PART I MASTER PLAN STUDY
1. INTRODUCTION
The Study Area in the basin of the Sava River, a tributary of the Donau, covers the whole administrative area (11,794 km2) of Zagreb City, the capital of Croatia, and the three (3) surrounding counties of Zagrebacka, Sisacko-Moslavacka and Karlovacka. Approximately 1,590,000 people live in the Study Area at present. For location of the Study Area, see the Study Area Map.
The Sava River within the territory of Croatia is much polluted due to the untreated domestic, commercial, public and industrial wastewaters of Zagreb City and the neighboring towns/municipalities. The Government of Croatia undertakes water pollution control of the river by constructing and operating wastewater treatment plants in Zagreb City and these towns/municipalities.
In response to the request of the Government of Croatia, the Japan International Cooperation Agency decided to conduct �The Study for Water Pollution Reduction on the Sava River Basin in the Republic of Croatia� from September 2000 to August 2001. The Study has the following objectives:
(1) To formulate a master plan for water environmental management of the Sava River Basin including pollution loading reduction up to the target year 2015;
(2) To conduct the feasibility study on the wastewater treatment of the selected five (5) towns neighboring Zagreb City (Dugo Selo, Vrbovec, Sisak, Kutina and Karlovac); and
(3) To pursue technology transfer on planning methods and skills to counterpart personnel in the course of the Study.
2. INDUSTRIAL WASTEWATER TREATMENT
In this Study, to meet the government regulations, the optimum treatment processes and discharge systems (to sewerage system or directly to river) for the 51 large industries identified as significant pollution sources are proposed. The industries in Zagreb City are excluded since they will be treated under the ongoing Zagreb Sewerage Project. Wastewater of the other small industries is dealt as part of municipal wastewater.
The treated wastewater quantity and pollution load effluent from the industries and their recipients in the future (2015) are shown in the table below compared with the existing ones (1999). Since many large industries will change recipient from river to public sewerage, the industrial pollution load into the sewerage systems will increase and the pollution load into the rivers will decrease. As a result, the total pollution load effluent from the industries will remain at almost the present level even in 2015.

A-2
Number of Industry Wastewater Quantity (m3/d) BOD Load (kg/d) Recipient 1999 2015 1999 2015 1999 2015
Sewerage 26 37 9,132 31,560 1,896 4,797 River 25 14 36,339 43,330 3,240 769 Total 51 51 45,471 74,890 5,135 5,565
The total construction cost for the improvement of industrial wastewater treatment systems is roughly estimated to be Kn. 128 million at 2001 prices.
3. SEWERAGE DEVELOPMENT
3.1 Objective Urban Centers for Sewerage Master Plan Study
Twenty-four (24) urban centers in 22 sewerage systems were selected for the master plan study on sewerage development, based on the policy of the National Water Protection Plan. The selected urban centers are given below. For the locations, see Outline of the Proposed Project.
3.2 Proposed Sewerage Development Plan
The proposed sewerage system will serve almost all the population of Zagreb City (95% of the future total population). In the other 23 towns/municipalities, it will cover 19,186 ha (174% of the existing urban area) and serve the total population 381,800 people (122% of the future urban population or 70% of the future total town/municipality population).
All the sewerage systems are provided with necessary treatment plants to treat the wastewater to the permissible limits of the regulations. However, the treatment of nutrients is limited to T-P only and that of T-N is deferred to the later stage after 2015.
The main features of the proposed sewerage development are summarized below.
Service Area (ha)
Served Population
Design Wastewater (m3/d) (2015) Urban
Center 1999 2015 1999 2015 Municipal Industry Total
BOD Load (kg/d)
Zagreb 25,600 25,600 800,000 935,000 274,860 167,510 442,370 90,000 Others 10,549 19,186 210,500 381,800 149,726 32,643 182,369 34,376
Total 36,149 44,786 1,010,500 1,316,800 424,586 200,153 624,739 124,376 (2,073,000 PE)
The total construction cost of the 22 sewerage development projects is estimated to be Kn. 2,739 million, broken down into Kn. 1,365 million for the Zagreb Sewerage Development Project and Kn. 1,374 million for the other 21 sewerage development projects. The total construction cost of the 21 sewerage development projects is further broken down into Kn. 531 million for collectors and Kn. 843 million for treatment plants.
Zagreb, Sesvete East, Dugo Selo, Sveti Ivan Zelina, Vrbovec, Ivanić Grad�Klo�tar Ivanić, Samobor, Zapre�ić, Velika Gorica, Jastrebarsko, Sisak, Petrinja, Glina, Topusko, Popovača, Kutina, Lipovljani, Novska, Karlovac�Duga Resa, Ogulin, Pla�ki, Slunj

A-3
4. EVALUATION OF RIVER WATER QUALITY IMPROVEMENT
The river water quality under existing, future without project, and future with project situations was simulated for the river flow rate of 95% probability according to the government standard. The results of simulation of river water quality at the principal river locations are shown below.
(Unit: BOD, mg/l) Future
River Location Existing Without Project (2015)
With Project (2015)
Standard (Category)
Sava Main Oborovo 8.8 11.6 4.6 ≤8.0 (III) Utok Kupe Nizvodno 5.6 7.4 3.1 ≤4.0 (II) Kupa Recica 4.3 6.2 3.1 ≤4.0 (II) Brest 3.5 4.7 2.6 ≤4.0 (II) Lonja K. Lonja Strug (Crnec River) 27.1 49.1 7.2 ≤8.0 (III) Struzec (Lonjsko Polje) 8.5 14.6 3.4 ≤4.0 (II) Kutina Kutina 70.0 70.0 16.0 ≤4.0 (II)
The proposed master plan will improve the river water quality to a large extent. The improved river water quality will satisfy the national standards in the Sava Main, Kupa and Lonja rivers. However, improvement of the Kutina River is limited due to the small dilution effect of natural river flow.

A-4
PART II FEASIBILITY STUDY
1. INTRODUCTION
Five (5) sewerage development projects; namely, Dugo Selo, Vrbovec, Sisak, Kutina and Karlovac-Duga Resa, were selected for the feasibility study from among the 22 projects proposed in the master plan. The target year of F/S projects is set at the year 2007, since these projects are the first stage projects of the master plan.
2. PLANNING BASIS
(1) The proposed sewerage system aims to serve almost all the population living within the existing service area in 2007, in principle. No significant extension of the service area is proposed.
(2) Necessary transport collectors, main sewers and secondary/tertiary sewers are proposed to attain the objective services. The collector/sewer size is designed to meet the design wastewater flow of the master plan.
(3) The treatment plant is proposed as the first stage of the master plan. The capacity is designed to treat the wastewater flow in 2007 and the process is applied to meet the requirement of river water quality improvement in 2007.
3. WASTEWATER TREATMENT LEVEL
The water quality of the Sava Main River in 2007 is expected to greatly improve due to the ongoing Zagreb Project. The water quality of the Kupa River will not exceed the standard quality to a serious level even in the case of without-project. Hence, the treatment level of primary sedimentation is applicable for the Sisak and Karlovac-Duga Resa F/S projects.
The Lonja and Kutina rivers are much polluted even at present. Biological treatment is definitely necessary for the Dugo Selo, Vrbovec and Kutina sewerage improvement projects to mitigate the water pollution of the respective rivers to the possible extent.
Hence, the Dugo Selo, Vrbovec and Kutina projects will treat the wastewater to BOD 25 mg/l; whereas, the Sisak and Karlovac-Duga Resa projects will treat the influent BOD by 40%. However, the treatment of T-P will be deferred to the second stage in all the projects in due consideration of priority sequence.
4. PROPOSED SEWERAGE DEVELOPMENT
4.1 Design Bases for Sewerage System and Treatment Plant
The design bases of the sewerage systems and treatment plants for the five (5) projects are summarized below.

A-5
Item Dugo Selo Vrbovec Sisak Kutina Karlovac- Duga Resa
Service Area (ha) 516 422 944 734 1,142 Served Population 10,300 5,900 45,400 19,600 43,800 Served Large Industry (No.) - 2 3 1 10 Wastewater Quantity (m3/d) 3,605 4,539 16,973 7,678 23,285
Municipal Wastewater (m3/d) 3,605 1,770 15,890 6,860 15,430 Industrial Wastewater (m3/d) - 2,769 1,083 818 7,855
Influent BOD Concentration (mg/l) 211 198 211 190 193 Pollution Load (PE) 12,700 14,600 59,900 24,500 74,800 Effluent BOD Concentration (mg/l) 25 25 127 25 116
4.2 Proposed Sewer
The main features of the proposed collectors for the five (5) projects are summarized below.
Transport /Main Collector Secondary/Tertiary Sewer Total Urban Center ∅ (mm) L (m) ∅ (mm) L (m) ∅ (mm) L (m)
Dugo Selo 800-1,200 5,490 400 2,100 400-1,200 7,590 Vrbovec 350-400 1,880 100 750 100-400 2,630 Sisak 450-1,000 6,340 - - 450-1,000 6,340 Kutina 400 180 100-200 9,000 100-400 9,180 Karlovac-Duga Resa 300-1,700 11,670 400 1,000 300-1,700 12,670 Total 25,560 12,850 38,410
4.3 Proposed Treatment Plant
The main features of the proposed treatment plants of the five (5) projects are summarized below.
Main Features Dugo Selo Vrbovec Sisak Kutina Karlovac- Duga Resa
Treatment Process Activated Sludge
Activated Sludge
Primary Sedimentation
Activated Sludge
Primary Sedimentation
Preliminary Treatment (unit) 1 1 1 1 1 Primary Sedimentation Tank (unit) 3 3 6 3 5 Aeration Tank (unit) 3 3 - 3 - Secondary Sedimentation Tank (unit) 2 2 - 2 - Belt Press Filter (unit) 2 2 2 2 2
4.4 Construction and Annual O&M Costs
The construction and annual O&M costs of each of the five (5) projects are estimated as follows at 2001 prices.
Item Dugo Selo Vrbovec Sisak Kutina Karlovac-
Duga Resa Total
Construction Cost (million Kn) 50.94 39.51 68.95 41.16 129.76 330.31 Collector 15.34 3.56 20.88 8.95 61.43 110.15 Treatment Plant 35.60 35.95 48.08 32.21 68.33 220.16
Annual O&M Cost (million Kn) 1.59 1.53 1.98 2.52 2.33 9.95

A-6
5. ENVIRONMENTAL IMPACT ASSESSMENT
The environmental impacts of the proposed projects were assessed on the following items: (i) land acquisition, (ii) noise during construction/operation, (iii) foundation geology of treatment plant, (iv) flora/fauna, (v) dust/odor, (vi) water pollution/water use, and (vii) sludge disposal/groundwater. No significant adverse effects were predicted for all the projects.
6. FINANCIAL ANALYSIS
6.1 Implementation Schedule
The proposed projects are assumed to start in 2003 with completion in 2007. The proposed implementation schedules of the five (5) projects are shown below.
Item Construction Works Dugo Selo, Vrbovec, Kutina
Sisak, Karlovac-Duga Resa
Detailed Design and Land Acquisition
2003 2003
Stage I Construction Collector, Primary Treatment, Sludge Treatment, etc. 2004 - Mid 2005 2004 - 2006
Monitoring Mid 2005 - Mid 2006 - Stage II Construction Biological Treatment Mid 2006 - 2007 -
6.2 Financial Evaluation
6.2.1 General
Each municipal service company should perform a sound sewerage business by collecting sewerage charges set within the users� affordability. For this purpose, a considerable amount of financial assistance from the Central Government (including Croatian Waters) is considered necessary for the construction of the proposed projects. The possible financial sources of construction cost are the Central Government (Grant and Water Management Fund Loan) and external loan (ODA).
The required sewerage charge and financial assistance from the Central Government were estimated by analyzing the financial statement of each municipal service company. To ensure financial feasibility of the municipal service companies,
(1) Annual net income should be mostly positive through the entire period of 25 years;
(2) Loan liability of the company should be zero in 25 years; and
(3) Necessary cash should be reserved before the replacement of mechanical/electrical equipment.
6.2.2 Proposed Sewerage Charge and Financial Assistance
The required sewerage charge for each municipal service company to perform a sound sewerage business was estimated under the following assumptions.
(1) The proposed projects mainly benefit the populations downstream and enhance the environment nationwide, so that they are of national importance. Therefore, the financial assistance of the Central Government is set higher than has been usually extended.

A-7
(2) Sixty percent (60%) of the construction cost is provided by the Central Government as Grant. The remaining 40% is financed by an external ODA loan through the Central Government. The loan conditions are assumed as: 2.0% interest and 25-year repayment with a 7-year grace period.
(3) The loan repayment, and the O&M and depreciation costs of the sewerage systems are to be covered by sewerage charges.
(4) At present, two (2) kinds of sewerage charges are individually set for each town. One is for domestic user and the other is for other users (institution and small/large industries). The domestic unit sewerage charge will increase in proportion to the growth of per capita GDP. However, the existing ratio between the two (2) unit sewerage charges will be maintained.
(5) In the Karlovac-Duga Resa sewerage system, the replacement cost of damaged sewers in Karlovac Town is considered apart from the proposed sewerage development cost. The replacement cost is to be covered by both grant from the Local Government and sewerage charges.
The proposed sewerage charges of the five (5) municipal service companies in 2001 are shown below at 2001 prices, along with the existing ones and the internal rate of return (FIRR) of the proposed projects.
Item Dugo Selo Vrbovec Sisak Kutina Karlovac-
Duga Resa Existing Unit Sewerage Charge (Kn/m3)
Domestic User 0.36 0.59 1.34 4.12 1.45 (0.54)* Other Users 0.74 0.81 4.00 4.12 2.67 (0.54)*
Proposed Unit Sewerage Charge (Kn/m3) Domestic User 2.55 2.25 1.41 4.12 1.86 Other Users 5.24 3.09 4.21 4.12 2.87
Domestic Charge Rate to Household Income (%) Existing 0.12 0.20 0.45 1.37 0.48 (0.18)* Proposed 0.85 0.75 0.47 1.37 0.62
FIRR of Proposed Project (%) 6.58 5.98 5.48 Large 5.91 * Values not in parentheses are charges of Karlovac, while values in parentheses are those of Duga Resa
In order to set the sewerage charges within the user�s affordability, 60% of the construction cost need to be provided by the Central Government as a Grant and the remaining 40% shall be financed by an external loan through the Central Government as assumed above.
However, it should be noted that the above external loan does not mean the actual amount of loan to be obtained by the Central Government but only the loan amount to be repaid from sewerage charges. In case the financial resources of the Central Government are limited, it may need to obtain more external loan to be able to extend the necessary grant (60% of construction cost) to the municipal service companies.
7. RECOMMENDATIONS
(1) The proposed five (5) sewerage development projects consisting of Dugo Selo, Vrbovec, Sisak, Kutina and Karlovac-Duga Resa are technically feasible and financially viable. The early implementation of these projects is necessary to cope with the existing water pollution in the Sava River Basin.
(2) For this purpose, the Central Government/State Water Directorate/Croatian Waters and the local governments concerned should immediately proceed with the necessary legal procedures and financial arrangements.

A-8
(3) Water pollution of the Lonja River is the worst in the entire Sava River Basin. Early implementation of the Sesvete East and Ivanić Grad-Klo�tar Ivanić sewerage development projects is also awaited to attain a satisfactory water pollution control of the Lonja River.
(4) Since the available data on river water quantity and quality in the Lonja River are limited, necessary monitoring of the river water quantity and quality should be commenced immediately.

Legend
23
1
4
10
5
11 7
6
6
8
12
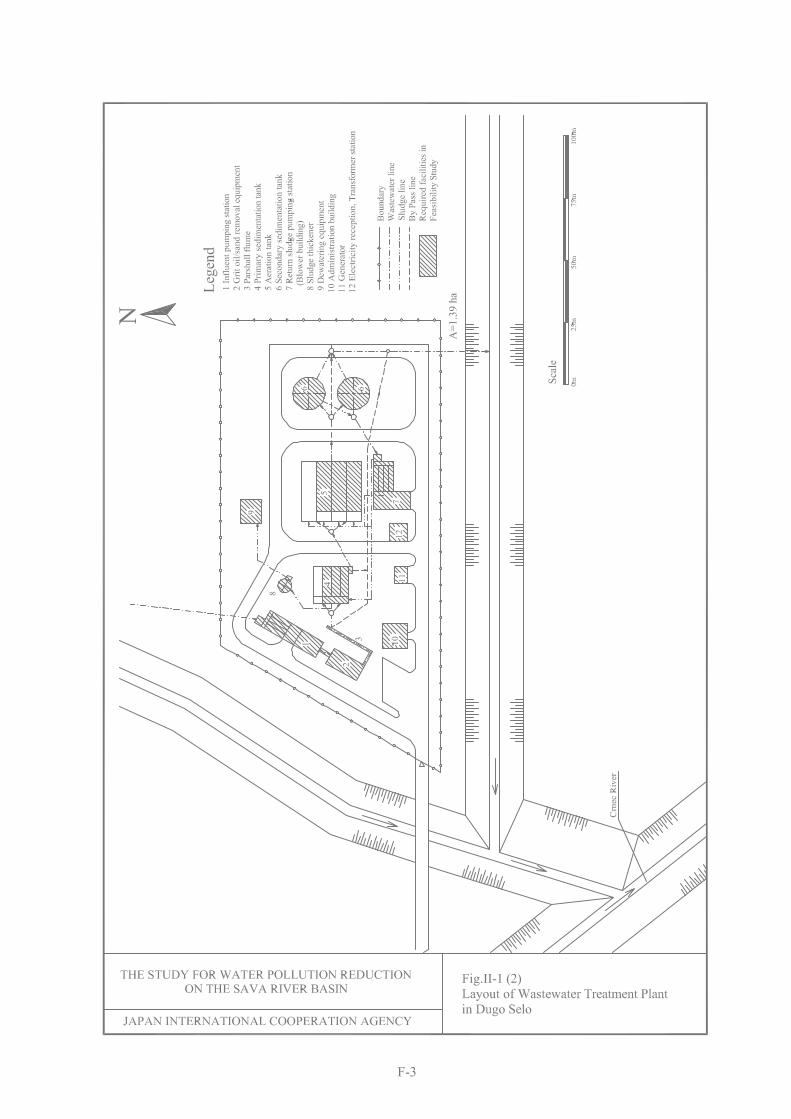
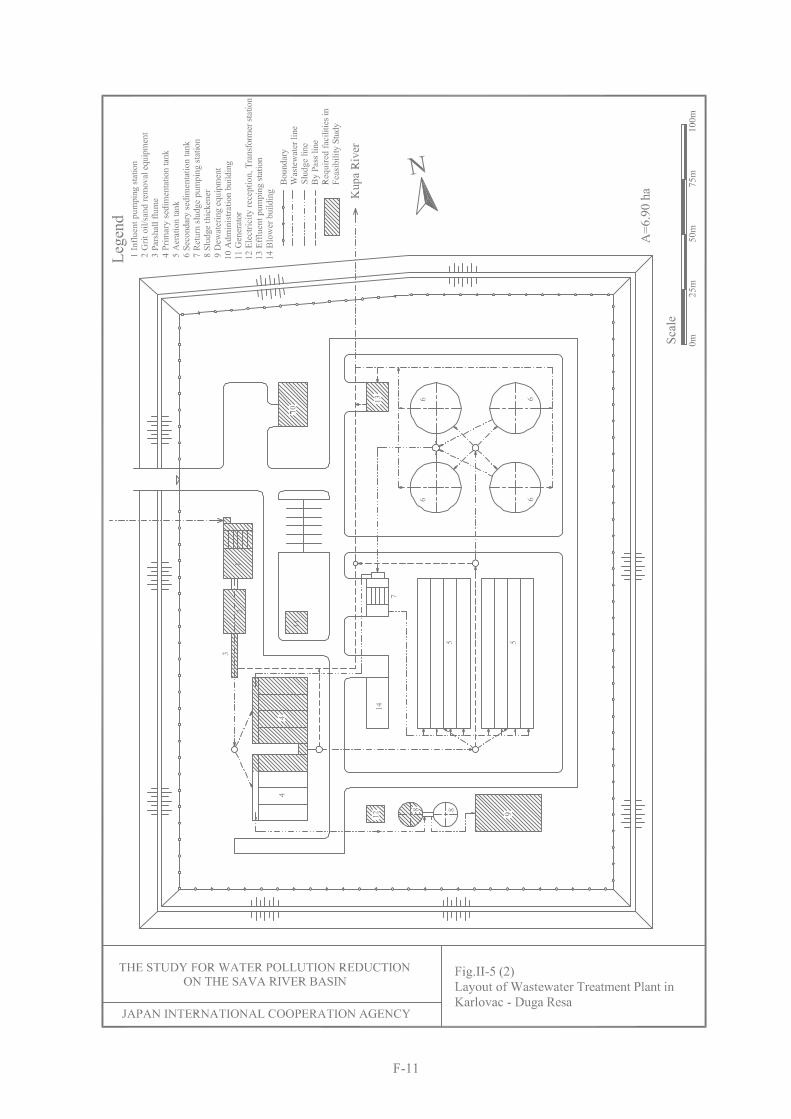
1 Influent pumping station 2 Grit oil/sand removal equipment 3 Parshall flume 4 Primary sedimentation tank 5 Aeration tank 6 Secondary sedimentation tank 7 Return sludge pumping station (Blower building) 8 Sludge thickener 9 Dewatering equipment10 Administration building11 Generator12 Electricity reception, Transformer station
BoundaryWastewater lineSludge lineBy Pass line
9
PrimarySedimentation
Tank
SecondarySedimentation
Tank
Influent Effluent
AerationTank
SludgeThichener
MechanicalDewatering
SludgeDisposal
PrimarySedimentation
Tank
SecondarySedimentation
Tank
Influent Effluent
AnerobicTank
SludgeThichener
MechanicalDewatering
SludgeDisposal
OxicTank
Return Sludge
Return Sludge
DryingBed
Rotor
Ditch
Return Sludge
Oxidation Ditch (OD)
Influent EffluentFinalSedimentation
Tank
SludgeThichener
SludgeDisposal
Aerated Lagoon (AL)
Influent Effluent
Aerator
Activated Sludge (AS)
Anaerobic Oxic Activated Sludge (AO)
Proposed Projects Outline of Project Components Construction Cost and Beneficiaries
1 Industry Development of wastewater treatment system of 51 large industries
• 128 million Kuna Master Plan *
2 Sewerage Development of wastewater treatment plants and collectors of 21 Sewerage Systems for 23 urban centers
• •
1,374 million Kuna Served population: 381,800
1 Dugo-Selo A wastewater treatment plant with Activated Sludge process and collectors
• •
50.94 million Kuna Served population: 10,300
2 Vrbovec A wastewater treatment plant with Activated Sludge process and collectors
• •
39.51 million Kuna Served population: 5,900
3 Sisak A wastewater treatment plant with primary sedimentation and collectors
• •
68.95 million Kuna Served population: 45,400
4 Kutina A wastewater treatment plant with Activated Sludge process and collectors
• •
41.16 million Kuna Served population: 19,600
Feasibility Study
5 Karlovac-Duga Resa
A wastewater treatment plant with primary sedimentation and collectors
• •
129.76 million Kuna Served population: 43,800
* Descriptions in this table are for the urban centers other than Zagreb.
Clarifier
OUTLINE OF THE PROPOSED PROJECT
Pollution Load Runoff and River Water Quality
Typical Layout of Wastewater Treatment Plant (F/S Project)
Flow Sheet of Wastewater Treatment Process
Study Area
Proposed Projects
① ② ⑤ ⑥④③
① Sava River at Oborovo② Sava River at Utok Kupe Nizvodno
⑤ Lonja River at K.Lonja Strug⑥ Lonja River at Struzec
③ Kupa River at Recica④ Kupa River at Brest
Water QualityEvaluation Point
Treatment ProcessMP TreatmentProcess
1 Zagrb AS2 Sesvete East AO3 Dugo Selo AO4 Vrbovec AO5 Sisak AO6 Kutina AO7 Karlovac and AO
Duga Resa8 Sv.Ivan Zelina OD9 Ivanic Grad and AO
Klostar Ivanic10 Samobor AO11 Zapresic AO12 Velika Gorica AS13 Jastrebarsko OD14 Petrinja AO15 Glina OD16 Topusko AL17 Popovaca OD18 Lipovljani OD19 Novska OD20 Ogulin AO21 Plaski OD22 Slunj OD
FS Project TreatmentProcess
1 Dugo Selo AS2 Vrbovec AS3 Sisak PS*4 Kutina AS5 Karlovac and PS*
Duga Resa*Primary Sedimentation

i
THE STUDY FOR WATER POLLUTION REDUCTION ON THE SAVA RIVER BASIN
IN THE REPUBLIC OF CROATIA
FINAL REPORT
VOL. 1: EXECUTIVE SUMMARY
Table of Contents
PREFACE LETTER OF TRANSMITTAL Study Area Map Composition of Report Abstract Table of Contents List of Tables List of Figures Abbreviations and Acronyms
PART I MASTER PLAN STUDY
1. INTRODUCTION.............................................................................................. 1
2. STUDY AREA.................................................................................................... 1 2.1 Natural Conditions..................................................................................... 1 2.2 Socio-economy .......................................................................................... 2 2.3 River Water Use and Water Classification ................................................ 2
3. INDUSTRIAL WASTEWATER TREATMENT ........................................... 3 3.1 Objectives and Scopes of the Study........................................................... 3 3.2 Selection of the Objective Large Industries for the Study......................... 3 3.3 Planning Basis ........................................................................................... 4 3.4 Proposed Industrial Wastewater Treatment ............................................... 5
4. SEWERAGE DEVELOPMENT ...................................................................... 6 4.1 Objective Urban Centers for Sewerage Master Plan Study ....................... 6 4.2 Existing Sewerage System......................................................................... 6 4.3 Planning Basis ........................................................................................... 6
4.3.1 Permissible Quality of Treatment Plant Effluent .......................... 6
4.3.2 Wastewater Flow .......................................................................... 6
4.3.3 Wastewater Treatment .................................................................. 7 4.4 Proposed Sewerage Development Plan ..................................................... 9 4.5 Cost Estimate ............................................................................................. 10
5. EVALUATION OF RIVER WATER QUALITY IMPROVEMENT .......... 10 5.1 Objective Location for Water Quality Simulation..................................... 10 5.2 Simulation Methodology ........................................................................... 11

ii
5.3 Simulation of River Water Quality ............................................................ 12 5.3.1 Pollution Load Runoff to Main River Without Project................. 12
5.3.2 Simulated River Water Quality..................................................... 12
6. RECOMMENDATIONS FOR FINANCING POLICY................................. 12
PART II FEASIBILITY STUDY
1. INTRODUCTION.............................................................................................. 14
2. PLANNING BASIS............................................................................................ 14 2.1 Design Wastewater Flow........................................................................... 14 2.2 Wastewater Treatment Level ..................................................................... 15 2.3 Structural Design Principle........................................................................ 17
3. PROPOSED SEWERAGE DEVELOPMENT................................................ 17 3.1 Design Criteria for Sewerage System and Treatment Plant....................... 17 3.2 Proposed Sewer.......................................................................................... 18 3.3 Proposed Treatment Plant.......................................................................... 18
4. PROJECT COST ............................................................................................... 19 4.1 Construction Cost ...................................................................................... 19 4.2 Operation and Maintenance Cost............................................................... 20
5. ENVIRONMENTAL IMPACT ASSESSMENT............................................. 20
6. FINANCIAL ANALYSIS.................................................................................. 21 6.1 Introduction................................................................................................ 21 6.2 Implementation Schedule .......................................................................... 21 6.3 Disbursement Schedule of Construction and O&M Costs......................... 22 6.4 Revenue of Sewerage Charge .................................................................... 22 6.5 Financial Evaluation .................................................................................. 23
6.5.1 General.......................................................................................... 23
6.5.2 Existing Financing System............................................................ 24
6.5.3 Calculation of Required Sewerage Charge ................................... 24
6.5.4 Proposed Sewerage Charge and Financial Assistance .................. 26
7. RECOMMENDATIONS................................................................................... 26

iii
Part I - List of Tables
Table I-1 Proposed Wastewater Treatment of Large Pollutant Industries..... T-1 Table I-2 Proposed Sewerage Development Plan.......................................... T-2
Part I - List of Figures
Fig. I-1 River Systems and Objective Urban Centers in the Study Area .... F-1
Part II - List of Figures
Fig. II-1 (1) Sewerage Development System in Dugo Selo............................... F-2 Fig. II-1 (2) Layout of Wastewater Treatment Plant in Dugo Selo.................... F-3 Fig. II-2 (1) Sewerage Development System in Vrbovec .................................. F-4 Fig. II-2 (2) Layout of Wastewater Treatment Plant in Vrbovec....................... F-5 Fig. II-3 (1) Sewerage Development System in Sisak ....................................... F-6 Fig. II-3 (2) Layout of Wastewater Treatment Plant in Sisak............................ F-7 Fig. II-4 (1) Sewerage Development System in Kutina..................................... F-8 Fig. II-4 (2) Layout of Wastewater Treatment Plant in Kutina.......................... F-9 Fig. II-5 (1) Sewerage Development System in Karlovac-Duga Resa .............. F-10 Fig. II-5 (2) Layout of Wastewater Treatment Plant in Karlovac-Duga Resa ... F-11

iv
ABBREVIATIONS AND ACRONYMS
AGENCIES/ORGANIZATIONS EU European Union JICA Japan International Cooperation Agency
OTHER ACRONYMS/ABBREVIATIONS A2O Anaerobic-Anoxic-Oxic Activated Sludge AA Aeroaccelerator AL Aerated Lagoon AO Anaerobic-Oxic Activated Sludge AS Activated Sludge BOD Biochemical Oxygen Demand CAST Cyclic Activated Sludge Technology CODCr Chemical Oxygen Demand (Chromium) CODMn Chemical Oxygen Demand (Manganese) DO Dissolved Oxygen FIRR Financial Internal Rate of Return F/S, FS Feasibility Study GDP Gross Domestic Product M/P, MP Master Plan N Nitrogen No. Number O&M, O/M Operation and Maintenance OD Oxidation Ditch ODA Official Development Assistance P Phosphorus PE Person Equivalent PS Primary Settlement TF Trickling Filter T-N Total Nitrogen T-P Total Phosphorous TSS Total Suspended Solids VAT Value Added Tax = PDV
MEASUREMENTS/SYMBOLS ha Hectare km Kilometer km2 Square kilometer L Length m3 Cubic Meter mg Milligram mg/l Milligram per Liter mm Millimeter % Percent °C Degree Centigrade ∅ Diameter Kn, HRK Croatian Kuna ¥, JP¥ Japanese Yen DM German Mark, Deutsche Mark US$ United States Dollar

1
PART I MASTER PLAN STUDY
1. INTRODUCTION
The Sava River runs a 945 km distance draining a total area of 95,551 km2 in the countries of Slovenia, Croatia, Bosnia-Herzegovina and Yugoslavia before it joins the Donau as a tributary. The river length and drainage area within the territory of Croatia are 518 km and 25,100 km2, respectively.
The population of the Sava River Basin in Croatia is 2,340,000, including the 1,590,000 inhabitants of Zagreb City, the capital of Croatia, and the three (3) surrounding counties of Zagrebacka, Sisacko-Moslavacka and Karlovacka. The Study Area covers the whole administrative area (11,794 km2) of Zagreb City and the above three (3) counties.
The water of Sava River is much polluted due to the untreated domestic, commercial, public and industrial wastewaters of Zagreb City and the neighboring towns/municipalities and cities. The Government of Croatia undertakes water pollution control of the river by constructing wastewater treatment plants in the urban center of Zagreb City and these towns/municipalities.
In response to the request of the Government of Croatia, the Japan International Cooperation Agency conducted �The Study for Water Pollution Reduction on the Sava River Basin in the Republic of Croatia� from September 2000 to August 2001. The objectives of the Study are:
(1) To formulate a master plan for water environmental management of the Sava River Basin including pollution load reduction up to the target year 2015;
(2) To conduct a feasibility study on the wastewater treatment of the selected five (5) towns in the suburban area of Zagreb City (Dugo Selo, Vrbovec, Sisak, Kutina and Karlovac); and
(3) To pursue technology transfer on planning methods and skills to counterpart personnel in the course of the Study.
2. STUDY AREA
2.1 Natural Conditions
(1) Climate and Hydrology
The climate of the Study Area is affected by both the Continental and Mediterranean climates. The monthly average temperature at Zagreb City varies from 1.6°C in December to 22.3°C in July, with a yearly average of 12.2°C. The average monthly rainfall at Zagreb City ranges from 33 mm in February to 125 mm in August, with the yearly average of 921 mm.
However, the water of the Sava River lowers in summer (July-September) and rises in spring (March-April) independently of the rainfall distribution in the Study Area.
(2) River Basin and River System
The Study Area, covering approximately 11,800 km2, is drained by the river system consisting of the Sava Main, Kupa and Lonja rivers, as well as their tributaries. The river system and drainage basins are shown in Fig. I-1.

2
The latest land use map of the Study Area was prepared by using the satellite digital data taken in August 2000. The existing land use distribution is summarized below.
Land Use Category Area (km2) (%)
1. Forest 5,430 46.1 2. Shrub/Grass Land 4,640 39.3 3. Pasture/Agricultural Land 1,154 9.8 4. Built up Area 286 2.4 5. Water Body/Bare Land 283 2.4
Total 11,794 100.0
The nature park �Lonjsko Polje� is located in the downstream reaches of the Lonja River (a flood plain of the Sava River). The park, covering 56,000 ha, is designated as a valuable reserved area of the country. It is characterized as having one of the largest white stork concentrations in Europe.
2.2 Socio-economy
(1) Population
The existing (1999) and future (2015) populations of the Study Area are estimated based on the latest studies of the departments concerned of the local and central governments, as follows:
1999 2015 Ratio Administrative Unit Total (1) Urban Rural Total (2) Urban Rural (2)/(1)
Zagreb City 935,000 935,000 - 998,000 998,000 - 1.07 Zagreb County 313,812 123,713 190,099 352,000 140,710 211,290 1.12 Sisak-Moslavina County 194,320 97,604 96,716 227,138 113,679 113,459 1.17 Karlovac County 148,892 81,122 67,770 148,892 82,682 66,210 1.00 Total 1,592,024 1,237,439 354,585 1,726,030 1,335,071 390,959 1.08
(2) Economic Growth of the Country
The growth rate of GDP is assumed based on the latest studies of the Ministry of Finance and the Zagreb Economy Institute as follows: 3.6% for 2000-2005, 5.5% for 2006-2010 and 4.5% for 2011-2015. These growth rates are based on the presumption that the country will join the European Union (EU) by 2010.
No data is available for the future growth rate of the manufacturing industry. However, the Ministry of Finance estimated the current growth rate of manufacturing industry as 2.7% based on the data during January to September 2000. Hence, it is assumed in this Study that the future growth rate is the same as that of GDP.
2.3 River Water Use and Water Classification
(1) Existing River Water Use
Water use in the Study Area mostly depends on the groundwater. The consumptive river water use is limited to the municipal and industrial purposes at seven (7) locations. No irrigation water is taken from the river. There are 49 species of fish in the River Basin. However, the number of fish species in the Sava Main, Lonja and Crnec rivers are definitely less than the number in the other tributaries due to water pollution. The Kupa and Korana rivers are the most abundant in fish species.

3
(2) Water Classification and Standard Water Quality
The watercourses are classified into five (5) categories; namely, Category I to V. The standard river water quality for each category is designated in the Decree as below.
Parameter/Category I II III IV V
DO (mg/l) >7 7 - 6 6 - 4 4 - 3 <3 BOD (mg/l) <2 2 - 4 4 - 8 8 - 15 >15 COD-Mn (mg/l) <4 4 - 8 8 - 15 15 - 30 >30 T-P <0.1 0.10 - 0.25 0.25 - 0.60 0.60 - 1.50 >1.5 T-N <1 1 - 3 3 - 10 10 - 20 >20
The major rivers in the Study Area are categorized as follows.
River Existing Water Use Category Sava Main (Upper Reaches) Recreation, Scenic View, Aquatic Life II Sava Main (Middle Reaches) Recreation, Scenic View, Aquatic Life III Sava Main (Lower Reaches) Industrial, Recreation, Scenic View, Aquatic Life II Kupa (Upper Reaches) Recreation, Scenic View, Aquatic Life I Kupa (Middle Reaches) Municipal, Recreation, Scenic View, Aquatic Life II Kupa (Lower Reaches) Municipal, Industrial, Recreation, Scenic View, Aquatic Life II Lonja (Entire Reaches) Recreation, Scenic View, Aquatic Life II
3. INDUSTRIAL WASTEWATER TREATMENT
3.1 Objectives and Scope of the Study
The major objectives and scope of the industrial wastewater treatment study are:
(1) To establish the existing discharge system of the industrial wastewater.
(2) To estimate the existing and future wastewater quantity and quality and to evaluate the pollution load to the sewerage systems and rivers.
(3) To propose the optimum discharge system, i.e., whether to discharge into the sewerage system with necessary pre-treatment or directly into river with necessary treatment.
(4) To propose the necessary improvements to the existing treatment systems. Required construction cost is roughly estimated to provide necessary basic data for the preparation of financial policies on the promotion of industrial wastewater treatment.
3.2 Selection of the Objective Large Industries for the Study
Out of a number of industries in the Study Area, 51 large industries discharging more than 100 m3/d were selected for the study on wastewater treatment. The wastewaters of small industries were dealt as part of the municipal wastewater. The industries in Zagreb City (except the Sesvete East Area) were excluded in the Study because they are already included under the ongoing Zagreb Sewerage Project.
Further, 18 large pollutant industries from among the 51 large industries were selected for detailed study. These 18 large pollutant industries share most of the industrial wastewater quantity (approx. 80%) and pollution load (approx. 90% in BOD) in the Study Area. The 18 large pollutant industries are given in Table I-1.

4
3.3 Planning Basis
(1) Permissible Limits of Industrial Effluent
The permissible limits of major parameters of industrial wastewater discharged into natural receiving waters and public sewerage systems are specified in the Decree, as shown below.
Parameter/Category II III IV V Sewerage
TSS 35 35 - 60 60 - 150 150 - BOD (mg/l) 25 25 40 80 250 COD-Cr (mg/l) 125 125 200 400 700 T-P 1 2 4 8 10 T-N 21 31 42 42 - Oil and Grease ((mg/l) 25 30 40 50 100
(2) Projection of Future Industrial Wastewater Quantity
The future wastewater quantity of the 51 objective large industries in the year 2015 was estimated based on the following assumptions:
(a) Industrial production will increase in proportion to the growth of GDP.
(b) However, unit wastewater quantity per production will decrease in the future due to the technological improvement of production processes. The reduction rate is assumed for each industry in due consideration of: (i) existing level of water use quantity, (ii) existing ratio of cooling water use to total use, and (iii) age of existing production equipment.
(3) Selection of Wastewater Recipient
The industrial wastewater is discharged into public sewerage in principle, except the cases given below, to execute the pollution control of industrial wastewater at the minimum cost. On the other hand, the public sewerage can allocate the necessary cost for industry and as a result, the integral treatment of municipal and industrial wastewater will attain the target at the minimum cost. The exceptions are:
(a) The industry is already provided with a high-tech treatment system and can easily discharge wastewater into the river with a small improvement as required.
(b) The wastewater is not much polluted in quality and industry can easily discharge it into the river with a small improvement as required.
(c) The wastewater quality is not proper for the treatment of public sewage.
(d) The industry is located far from the sewerage system, requiring a large additional cost.
The wastewater recipient (public sewerage or natural watercourse) of the objective 51 large industries was determined individually in consideration of the above criteria.
(4) Wastewater Treatment Process
The optimum treatment process varies, depending on the wastewater quality and kind of recipient of the effluent. However, the following four (4) typical treatment processes are applied in this master plan study. The adequate process is to be selected by each industry according to its required treatment conditions.

5
Treatment Process Applicable Industry
Conventional Activated Sludge Industry which treats BOD and COD with a normal concentration for discharge into public sewerage or natural water
Two Stage Activated Sludge Industry which treats BOD and COD with a high concentration for discharge into natural water
Chemical Coagulation Industry which treats TSS, heavy metals, color and insoluble BOD/COD for discharge into public sewerage or natural water
Conventional Activated Sludge + Chemical Coagulation
Industry which treats BOD, COD, TSS, heavy metals, color and oil for discharge into natural water
3.4 Proposed Industrial Wastewater Treatment
(1) Treated Wastewater Quantity and Pollution Load
The treated wastewater quantity and pollution load effluent (BOD) from the industries and their recipients in the future (2015) are summarized below, compared with the existing ones (1999). The 18 large pollutant industries will share 81% in quantity and 87% in BOD load in 2015. The wastewater quantity, pollution load and recipient of the 18 large pollutant industries are individually shown in Table I-1.
Many large pollutant industries will change their recipients from river to public sewerage. Hence, the industrial pollution load into the sewerage system will increase, while the pollution load into the rivers will decrease. As a result, the total pollution load of effluent from the industries will remain at almost the present level even in 2015.
Number of Industries
Wastewater Quantity (m3/d)
BOD Load (kg/d) Industry Recipient
1999 2015 1999 2015 1999 2015 Sewerage 4 14 3,855 22,496 1,494 4,175 River 14 4 33,143 38,390 3,041 644 Large Pollutant Industries (18) Sub-total 18 18 36,998 60,886 4,534 4,818 Sewerage 22 23 5,277 9,064 402 622 River 11 10 3,196 4,940 199 125 Other Large Industries (33) Sub-total 33 33 8,473 14,004 601 747 Sewerage 26 37 9,132 31,560 1,896 4,797 River 25 14 36,339 43,330 3,240 769 Total Large Industries (51) Total 51 51 45,471 74,890 5,135 5,565
(2) Cost Estimate
The total construction cost for the improvement of treatment systems is roughly estimated to be Kn. 128 million at 2001 prices. It is broken down into Kn. 90 million for the 18 large pollutant industries and Kn. 38 million for the 33 other large industries. The construction cost of each of the 18 large pollutant industries is also shown in Table I-1.
The above construction costs include direct construction cost, engineering and administration costs, VAT, Customs Duties and contingency. In this estimate, the currency exchange rate at the end of February 2001 is employed as follows: US$1.00 = Kn. 8.3 = JP¥ 116.

6
4. SEWERAGE DEVELOPMENT
4.1 Objective Urban Centers for Sewerage Master Plan Study
Twenty-four (24) urban centers comprising 22 sewerage systems were selected for the master plan study on sewerage development based on the National Water Protection Plan. The selected urban centers meet either of the following criteria:
(1) Urban center is expected to discharge wastewater of over 2,000 PE in 2015.
(2) Urban center is located in an area where drinking water sources may be affected.
The selected urban centers are given below. For the location of selected urban centers, see Fig. I-1
4.2 Existing Sewerage System
The 22 existing sewerage systems cover a total area of 36,149 ha, serving a total population of 1,010,500 inhabitants, which are mostly served by the Zagreb City sewerage system. The service area and served population in 21 of the sewerage systems (excluding Zagreb City) are 10,549 ha (96% of the existing urban area: 11,006 ha) and 210,500 inhabitants (74% of the existing urban population: 284,700 or 42% of total town/municipal population: 499,500), respectively.
However, only three (3) sewerage systems are provided with treatment plants, treating the wastewater of approximately 60,000 inhabitants. Even Zagreb City has only recently started the construction of a treatment plant. The existing treatment plants are Velika Gorica (biological treatment), Kutina (preliminary treatment) and Ivanić Grad (preliminary treatment).
4.3 Planning Basis
4.3.1 Permissible Quality of Treatment Plant Effluent
The permissible limits of effluent (TSS, BOD, COD-Cr, T-N, T-P) discharged from the sewage treatment plant into the receiving water vary according to the size of the treatment plant and the category of the receiving water, as follows.
Category Plant Size TSS (mg/l)
BOD (mg/l)
COD-Cr (mg/l)
T-P (mg/l)
T-N (mg/l)
Watercourse II <10,000 PE 60 40 150 - - 10,000 PE - 100,000 PE 35 25 125 2 15 >100,000 PE 35 25 125 1 10 Watercourse III <10,000 PE 120 � 150 - - - - >10,000 PE 35 25 125 - -
4.3.2 Wastewater Flow
The wastewaters in sewerage systems include domestic, institutional and industrial wastewater, and groundwater infiltration. As mentioned before, the wastewaters of 51 large industries in the
Zagreb, Sesvete East, Dugo Selo, Sveti Ivan Zelina, Vrbovec, Ivanić Grad - Klo�tar Ivanić, Samobor, Zapre�ić, Velika Gorica, Jastrebarsko, Sisak, Petrinja, Glina, Topusko, Popovača, Kutina, Lipovljani, Novska, Karlovac - Duga Resa, Ogulin, Pla�ki, Slunj

7
Study Area are estimated individually; whereas, wastewaters of the other smaller industries are dealt as part of the municipal wastewater, as well as domestic and institutional wastewater.
(1) Design Unit Municipal Wastewater Quantity
The existing average unit municipal wastewater quantity (domestic, institutional and small industries: l/capita/day) is estimated from the water consumption data. It varies depending on the population size of town. In this Study, it is classified into two (2) categories: less than 10,000 people and larger than 10,000 people, based on the existing water consumption data in the Study Area. The return rate of consumed water to the sewerage is assumed at 80%.
The groundwater infiltration is also an important factor for the determination of design sewage quantity. The groundwater infiltration ratio to the municipal wastewater quantity (domestic, institutional and small industries) is estimated to be 30%, based on the actual inflow to the Kutina Treatment Plant in the driest period.
On the other hand, the municipal wastewater varies throughout the year. Hence, the treatment plant is designed to meet the daily maximum wastewater. The ratio of daily maximum to daily average is estimated to be 1.30 based on the actual variation data in the Study Area.
The unit municipal wastewater quantity will increase according to the improvement of living standards in the future. The design unit municipal wastewater quantity for the master plan study (target year: 2015) is summarized below.
Population Size <10,000 (l/capita/day)
≧10,000 (l/capita/day)
Domestic 190 190 Institutional/Small Industry 30 70 Groundwater Infiltration 70 70 Daily Average
Total 290 330 Domestic 240 240 Institutional/Small Industry 30 90 Groundwater Infiltration 70 70 Daily Maximum
Total 340 400
(2) Design Unit Pollution Load of Municipal Wastewater
The design unit pollution load of domestic wastewater is set at BOD: 60 g/capita/day by employing the widely used one in Croatia. The design unit BOD load of institutional and small industrial wastewater is determined by assuming the BOD concentration of 200 mg/l.
(3) Design Total Sewerage Wastewater
The wastewater quantity and quality in the large industries are estimated individually. The total wastewater quantity and pollution loads into public sewerage are estimated by adding those of large industries to the municipal ones.
4.3.3 Wastewater Treatment
(1) Treatment of Nutrients (P, N)
According to the government regulations, the treatment plant with a size of more than 10,000 PE shall treat both T-P and T-N when the effluent is to be discharged into a Category II river. The normal biological treatment process (Activated Sludge: AS) can

8
coincidentally treat nutrients to some extent; however, some advanced treatment processes must be introduced to meet the regulation level. Usually, Anaerobic-Oxic Activated Sludge (AO) is applied for the treatment of T-P and Anaerobic-Anoxic-Oxic Activated Sludge (A2O) is applied for the treatment of both T-P and T-N. The required costs of the three (3) processes are compared in index as follows.
Treatment Process AS AO A2O Required Land Space 100 111 199 Construction Cost 100 108 172 O&M Cost 100 104 218
As shown in the above table, the treatment of T-N requires a large cost. Hence, the treatment of T-N is deferred as a future target after 2015. The proposed master plan will treat only T-P by the Anaerobic-Oxic Activated Sludge (AO).
(2) Selection of Optimum Treatment Process
(a) Applicable Processes
The permissible limits of effluent quality vary according to the plant size for a Category II river, as shown below together with the applicable processes.
Permissible Limit (mg/l) Plant Size BOD T-P Applicable Treatment Process
<10,000 PE 40 -
Activated Sludge (AS) Oxidation Ditch (OD) Aerated Lagoon (AL) Trickling Filter (TF) Aeroaccelerator (AA)
>10,000 PE 25 2 Anaerobic Oxic Process (AO) Activated Sludge Coagulation (AS + CO) Cyclic Activated Sludge Technology (CAST)
(b) Optimum Process for Plant Size <10,000 PE
The construction cost, O&M cost and required land space are compared in index below. In this figure, the required land space includes a drying bed space.
TF and AA are comparatively economical. However, their treatment efficiency is 80% at most and they are not reliable enough. The treatment efficiency of TF and
1 .0 0
0 .6 7
0 .8 4
0 .6 60 .6 2
0 .4 0
1 .0 0
0 .7 7
1 .0 20 .9 7
0 .5 7
0 .7 1
1 .0 8
1 .6 8
3 .2 0
0 .8 50 .8 6
1 .0 8
0 .0
0 .2
0 .4
0 .6
0 .8
1 .0
1 .2
A S O D C A A L T F A A
Con
struc
tion
and
O/M
Cos
t
0 .0
0 .5
1 .0
1 .5
2 .0
2 .5
3 .0
3 .5
Lan
d Sp
ace
C o n s t ru c t io n C o s t O /M C o s t L a n d S p a c e (D ryin g B e d )

9
AL lowers in the winter season, and AL requires a large land space. AS requires a large cost although it can save in required land space.
OD is widely used in small towns or villages due to its simple operation. Hence, OD is proposed in this Study.
(c) Optimum Process for Plant Size >10,000 PE
The construction cost, O&M cost and required land space are compared in index below. In this figure, the required land space includes a mechanical dewatering space.
CAST is the most economical. In this case, however, the operation rule must be changed according to the fluctuation of influent and an automatic control system must be installed for a satisfactory operation. Hence, this system is not recommended. AS + CO requires a high O&M cost and to make matters worse, it will increase sludge volume. Hence, AO is applied in this Study.
(3) Sludge Treatment System
Drying bed is applied for small plants (<10,000 PE) from economical aspects. However, mechanical dewatering system is proposed for large plants (>10,000 PE) to minimize the adverse effects on the surrounding environments.
4.4 Proposed Sewerage Development Plan
(1) Future Service Area and Treatment Plant Site
The future service area is delineated in accordance with the detailed discussions with each local government (town/municipality) along with Croatian Waters. The service area covers not only the existing urban center but also the surrounding rural areas to the possible extent. The location of treatment plant is determined following the existing physical plan of each local government as far as it is not technically difficult.
(2) Sewerage Development Plan
In principle, the central urban areas are served by the combined system, while the surrounding areas are by the separate system.
1.391.28
1.00
1.53
2.31
1.00
1.00
1.291.33
0.0
0.5
1.0
1.5
2.0
2.5
AO AS+CO CAST
Con
stru
ctio
n an
d O
/M C
ost
0.0
0.2
0.4
0.6
0.8
1.0
1.2
1.4
Req
uire
d La
nd S
pace Construction Cost
O/M Cost
Land Space (Mechancial Dewatering)

10
The proposed sewerage system will serve almost all the population of Zagreb City (95% of the future total population). In the 23 towns/municipalities other than Zagreb City, it will cover 19,186 ha (174% of the existing urban area: 11,006 ha) and serve a total population of 381,800 inhabitants (122% of the future urban population: 313,300 or 70% of the future total town/municipality population: 549,000).
The main features of the proposed sewerage development are summarized below. Those of each sewerage development plan are shown in Table I-2.
Service Area (ha) Served Population Design Wastewater (m3/d) (2015)
BOD Load Urban
Center 1999 2015 1999 2015 Municipal Industrial Total (kg/d)
Zagreb 25,600 25,600 800,000 935,000 274,860 167,510 442,370 90,000 (1,500,000 PE)
Others 10,549 19,186 210,500 381,800 149,726 32,643 182,369 34,376 (573,000 PE)
Total 36,149 44,786 1,010,500 1,316,800 424,586 200,153 624,739 124,376 (2,073,000 PE)
4.5 Cost Estimate
The total construction cost for the 22 sewerage development projects is estimated to be Kn. 2,739 million, broken down into Kn. 1,365 million for the Zagreb sewerage development project and Kn. 1,374 million for the other 21 sewerage development projects. The total construction cost of Kn. 1,374 million for the 21 sewerage development projects is further broken down into Kn. 531 million for collector and Kn. 843 million for treatment plant as shown below. The construction cost of each sewerage development project is also shown in Table I-2.
Item Cost (million Kn) Direct Construction Cost 853.5
Collector 337.7 Transport/Main Collector 153.4 Secondary/Tertiary Sewer 184.3
Treatment Plant 515.8 Land Acquisition Cost 3.6 Indirect Construction Cost* 345.9 Contingency 170.7 Total 1,373.8 * Include engineering, administration, Customs Duties and VAT. Ex. Rate: US$1.00 = Kn 8.3 = JP¥ 116 at February 2001 prices
5. EVALUATION OF RIVER WATER QUALITY IMPROVEMENT
5.1 Objective Location for Water Quality Simulation
The existing and future river water quality was simulated at the following locations of the Sava Main River, Kupa River, Lonja River and Kutina River for both cases of without and with project situations. For the objective locations of the simulation, see Fig. I-1.

11
River Location of Simulation
Sava Main River Oborovo (downstream of Zagreb); Utok Kupe Nizvodno (downstream of Sisak) Kupa River Recica (downstream of Karlovac); Brest (immediately upstream of Petrinja) Lonja River K. Lonja Strug (before confluence with Cesma River); Struzec (after confluence with Cesma
River) Kutina River Kutina (downstream of treatment plant)
5.2 Simulation Methodology
(1) General
The point pollution load includes municipal wastewater and industrial wastewater; whereas, non-point pollution load includes the wastewater from households (not served by sewerage), livestock and lands. Moreover, point pollution loads run off 100% into the rivers, while non-point pollution loads lose a large portion before entering the rivers, especially in dry period. Both point and non-point loads decrease while they flow down the rivers (tributary and main river) due to self-purification effects.
The pollution load generation in the Study Area is estimated for 20 subdivided basins aggregated into six (6) major sub-basins.
(2) Runoff Coefficient
Non-point load runoff is largely affected by rainfall. The runoff coefficients of non-point loads vary depending on the river flow rate and basin topography/geology. The runoff coefficients of non-point loads are estimated, based on the observed river water quantity and quality data. Runoff coefficients of the Krapina and Kupa river basins are graphically shown below.
(3) Self-purification Rate
The self-purification rates of rivers vary depending on the river flow velocity. The rate is estimated based on the analysis of the pollution load reduction between Zagreb and Sisak. The self-purification rates of the tributaries in the left and right bank basins of the Sava Main River are assumed at 0.5% per km and 2% per km, respectively. However, the self-purification rates of the main rivers (Sava Main, Kupa and Lonja rivers) are calculated in more detail by using the Streeter-Phelps Formula.
River Flow Rate - Runoff Coefficient Curve(Kupa River at Brest)
0.00
0.20
0.40
0.60
0 50 100 150 200
River Flow Rate (m3/s)
RunoffCoefficient
BOD : Runoff Coefficient
River Flow Rate - Runoff Coefficient Curve(Krapina River at Utok Kupe Nizvodno)
0.00
0.05
0.10
0.15
0 2 4 6 8
River Flow Rate (m3/s)
RunoffCoefficient
BOD : Runoff Coefficient

12
5.3 Simulation of River Water Quality
5.3.1 Pollution Load Runoff to Main River Without Project
The future pollution load runoff of the six (6) major sub-basins to the main rivers (Sava Main, Lower Kupa and Lonja) without project are summarized below compared with the existing ones.
(Unit: BOD, kg/d)
Source Upper Sava
Middle Sava
Lower Sava
Upper Kupa
Lower Kupa Lonja Total
Existing (1999) Municipal 50,594 0 1,734 2,208 3,878 2,862 61,308 (70%) Industrial 10,942 0 159 1,639 906 1,540 15,196 (17%) Non-point 848 22 963 3,199 4,550 1,066 10,649 (12%) Total 62,384 22 2,857 7,046 9,334 5,468 87,153 (100%)
Without (2015) Municipal 78,141 0 3,396 8,637 6,705 7,768 104,648 (77%) Industrial 16,535 0 216 8 507 485 23,752 (13%) Non-point 848 22 963 3,199 4,550 1,066 10,649 (8%) Total 95,524 22 4,575 11,845 11,762 9,319 133,047 (100%)
5.3.2 Simulated River Water Quality
The river water quality of the existing, future without project, and future with project were simulated for the river flow rate of 95% probability according to the government standard. The simulated river water quality at the principal locations is shown below.
(Unit: BOD, mg/l)
River Location Existing Future Without Project (2015)
Future With Project (2015)
Standard (Category)
Sava Main Oborovo 8.8 (8.6) 11.6 4.6 ≤8.0 (III) Utok Kupe Nizvodno 5.6 (5.7) 7.4 3.1 ≤4.0 (II) Kupa Recica 4.3 (4.3) 6.2 3.1 ≤4.0 (II) Brest 3.5 (3.5) 4.7 2.6 ≤4.0 (II) Lonja K. Lonja Strug (Crnec River) 27.1 49.1 7.2 ≤8.0 (III) Struzec (Lonjsko Polje) 8.5 14.6 3.4 ≤4.0 (II) Kutina Kutina 70.0 70.0 16.0 ≤4.0 (II) Note: Values in parentheses are the observed quality.
The proposed master plan will improve the river water quality to a large extent. The improved river water quality will satisfy the national standards in the Sava Main, Kupa and Lonja rivers. For the Kutina River, the improvement to BOD 16 mg/l is the maximum due to the limitation of natural river flow.
6. RECOMMENDATIONS FOR FINANCING POLICY
(1) Greater Government Contribution
The proposed master plan project will require a large amount of investment cost: (i) Kn. 530 million for collectors, and (ii) Kn. 840 million for treatment plants (excluding Zagreb City).
Recent financing mechanisms for municipal company sewerage projects have been: equity (20%), water management fund (40%), and local funding (40%).

13
Since the Water Management Fund is an interest free loan, the municipal service companies have to shoulder 80% of the investment cost. Furthermore, although the sewerage network is of benefit to the local population, wastewater treatment plants benefit the populations downstream and enhance the environment nationwide; therefore, they are of national importance.
It is therefore recommended that consideration be given to a higher level of government subsidy than has been granted in the recent past.
(2) Utilization of the Water Management Fund
The Water Management Financing Act practically limits the financial source for water pollution control to the payments collected through the water protection charge.
Besides, water supply systems are more developed than sewerage systems. Hence, more funds will be required in the sewerage sector in the immediate future.
It is suggested that the water use charge and the water protection charge be combined and made available for water supply and/or sewerage projects. This will make it possible to have a larger source of funds on a priority basis for the particular needs of the sewerage sector.
(3) Financial Arrangements for Sewerage Development
It is important to the success of the project in the Sava River Basin that a policy is developed to enhance the financial capability of the municipal service companies. Of major importance are the collection efficiency of these companies, and the level of tariff for sewerage services.
Source of funds for Croatian Waters is the water protection charge, which could be increased by improved collection efficiency. In addition, the level of the water pollution charge should not be lower than the cost of wastewater treatment in accordance with the Water Management Financing Act. This charge should be determined annually and enforced within the limitations of affordability.
Source of funds for the municipal service companies is the tariff, which should be set to cover the cost of operation, maintenance and development. Realistic tariffs should be set, within the limitations of affordability. The sources of funds to the companies could be increased by improved collection efficiencies.
In addition, loan agreements between Croatian Waters and the municipal companies should include provisions for the attainment of collection efficiency targets, for the setting of tariff levels necessary to meet financial obligations, and others.
(4) Financial Assistance for Industrial Wastewater Treatment
A substantial sum is billed annually by Croatian Waters to industries that pollute. The amount contributed by industry to the water protection charge is allocated for the protection of water resources in general and not specifically returned to industry for investment in prevention of pollution.
Approximately Kn. 130 million (excluding Zagreb) will be required to upgrade the pre-treatment facilities of large industries in the Study Area. It is therefore recommended that soft loans be made available to these industries, through the Water Management Fund, to upgrade their pre-treatment facilities.

14
PART II FEASIBILITY STUDY
1. INTRODUCTION
Among the 22 projects proposed in the master plan, five (5) sewerage development projects were selected as priority ones for the feasibility study through detailed discussions with the State Water Directorate and the Croatian Waters. These five (5) projects are: (i) the Dugo Selo Sewerage Development Project, (ii) the Vrbovec Sewerage Development Project, (iii) the Sisak Sewerage Development Project, (iv) the Kutina Sewerage Development Project, and (v) the Karlovac-Duga Resa Sewerage Development Project.
The proposed projects will treat a large quantity of industrial wastewater. Since setting a farther target year may cause a significant error in the estimation of industrial wastewater flow because the future economic growth of the country is still uncertain, the target year of the F/S projects, which are the first stage of the master plan, is set at the year 2007.
2. PLANNING BASIS
2.1 Design Wastewater Flow
(1) Design Unit Municipal Wastewater Quantity
The design unit municipal wastewater quantity for the F/S projects is summarized below.
Population Size <10,000 (l/capita/day)
≥10,000 (l/capita/day)
Daily Average Domestic 160 160 Institutional/Small Industry 20 60 Groundwater Infiltration 60 60 Total 240 280 Daily Maximum Domestic 210 210 Institutional/Small Industry 30 80 Groundwater Infiltration 60 60 Total 300 350
(2) Design Unit Pollution Load of Municipal Wastewater
In the same way as the master plan study, the design unit pollution load of domestic wastewater is set at BOD: 60 g/capita/day and the design unit BOD pollution load of institutional and small industrial wastewater is set by assuming the BOD concentration at 200 mg/l.
(3) Design Total Sewerage Wastewater
In the same way as the master plan study, the wastewater quantity and quality of large industry is estimated individually. The total wastewater quantity and pollution loads into public sewerage are estimated by adding those of large industries to the municipal ones.

15
2.2 Wastewater Treatment Level
(1) General
The proposed master plan of all the five (5) sewage treatment plants will treat the wastewater to the level: BOD = 25 mg/l, COD-Cr = 125 mg/l, TSS = 35 mg/l and T-P = 2 mg/l by Anaerobic-Oxic Activated Sludge (AO) treatment system. The AO system consists of: (i) preliminary treatment; (ii) primary sedimentation; (iii) anaerobic process; (iv) aeration process; and (v) secondary sedimentation.
This feasibility study proposes the first stage treatment process of the master plan in due consideration of: (i) required improvement of river water quality; and (ii) required treatment cost.
(2) River Water Quality Simulation
For the above-mentioned purposes, the river water quality at the principal stations in the year 2007 was simulated for the cases of without and with project situations. The simulation was made for the river flow rate of 95% probability according to the government standard.
The point and non-point pollution load runoffs of the six (6) major sub-basins to the main rivers without project in 2007 are estimated as follows in terms of BOD, compared with the existing ones.
(Unit: BOD, kg/d)
Source Upper Sava Middle Sava
Lower Sava
Upper Kupa
Lower Kupa Lonja Total
Existing (1999) Municipal 50,594 0 1,734 2,208 3,878 2,862 61,308 (70%) Industrial 10,942 0 159 1,639 906 1,540 15,196 (17%) Non-point 848 22 963 3,199 4,550 1,066 10,649 (12%) Total 62,384 22 2,857 7,046 9,334 5,468 87,153 (100%)
Without (2007) Municipal 53,829 0 2,703 5,516 5,371 4,361 71,780 (66%) Industrial 23,947 0 160 115 538 1,656 26,411 (24%) Non-point 848 22 963 3,199 4,550 1,066 10,649 (10%) Total 78,621 22 3,826 8,829 10,459 7,084 108,840 (100%)
The river water quality with F/S projects was simulated under the following basic assumptions:
(a) In the above F/S towns, the industries that directly discharge into the rivers will also treat the wastewater in compliance with the government regulations. However, all the industries in the other towns/municipalities are assumed to maintain their existing conditions of wastewater treatment.
(b) The ongoing Zagreb sewerage project will treat the wastewater to the permissible limits of effluent (BOD = 25 mg/l, COD-Cr = 125 mg/l, TSS = 35 mg/l).
(3) Simulated Water Quality of Sava Main and Kupa River
The water quality of the Sava Main and Kupa rivers in 2007 without project was simulated and the results are shown in the table below compared with the existing ones.

16
(Unit: BOD mg/l)
Existing Without With F/S River Location (1999) (2007) (2007) Remarks
Sava Main Oborovo 8.8 (8.6) 10.2 4.8* After Zagreb Utok Kupe Nizvodno 5.6 (5.7) 6.5 3.1* After Sisak Kupa Recica 4.3 (4.3) 5.0 4.0 After Karlovac Brest 3.5 (3.5) 3.9 3.5 Before Petrinja Note: Values in parentheses are the observed quality; * including effects of Zagreb Project
The water quality of the Sava Main River in 2007 is expected to greatly improve due to the ongoing Zagreb Project. Besides, the water quality of the Kupa River will not exceed the standard quality to a serious level even in the case of without project as shown in the above table. Hence, the treatment level of primary sedimentation is considered applicable for the Sisak and Karlovac-Duga Resa F/S projects.
The river water quality in 2007 with primary sedimentation (treatment efficiency: 40%) of the Sisak and Karlovac-Duga Resa F/S projects was simulated and the results are shown in the above table as well.
(4) Simulated Water Quality of Lonja River
The water quality of the Lonja River with Dugo Selo and Vrbovec F/S projects in 2007 was simulated for the principal river locations: Crnec River at K. Lonja Strug and Lonja River (Lonjsko Polje) at Struzec. In this simulation, two (2) alternatives of treatment level: (i) primary sedimentation (treatment efficiency: 40%) and (ii) biological treatment (effluent BOD: 25 mg/l) were also compared. The results are summarized below.
(Unit: BOD mg/l)
Treatment Level K. Lonja Strug Struzec Existing (1999) 27.1 8.5 Without Project (2007) 36.3 11.1 Primary Sedimentation (2007) 33.5 10.6 Biological Process (2007) 31.0 10.1
As shown in the above table, the improvement effects are small. Additional projects may be necessary to attain a significant water quality improvement of the Lonja River.
On the other hand, the implementation of the Sesvete East project has already been approved and the Ivanić Grad-Klo�tar Ivanić project will be implemented in the near future. The river water quality of the Lonja River will improve as shown below in relation to the above two (2) projects. The improved river water quality would satisfy the Category III standards for the Crnec River and nearly meets the Category II standards for the Lonjsko Polje.
(Unit: BOD mg/l)
Treatment Level K. Lonja Strug Struzec Existing (1999) 27.1 8.5 Without Project (2007) 36.3 11.1 Primary Sedimentation (2007) 19.4 7.9 Biological Process (2007) 7.6 5.2 Standard (category) ≤8.0 (III) ≤4.0 (II)

17
(5) Simulated Water Quality of Kutina River
The natural flow of the Kutina River is negligible in dry season. All the river water is recharged by the wastewater of the sewerage and factories. Besides, the Petrokemija factory discharges a large quantity of wastewater into the Kutina River with a low BOD concentration, but a high T-N content.
The river water quality with the Kutina F/S project is estimated as follows, compared with the case without project.
(Unit: BOD, mg/l)
Treatment 1999 2007 Without 70 70 Primary Sedimentation - 50 Biological Treatment - 16
(6) Proposed Wastewater Treatment Level
The Dugo Selo, Vrbovec and Kutina F/S projects will treat the wastewater to BOD 25 mg/l; while, the Sisak and Karlovac-Duga Resa F/S projects will treat the influent BOD by 40%. However, the treatment of T-P will be deferred to the second stage in all the projects in due consideration of priority sequence.
2.3 Structural Design Principle
(1) In principle, the proposed sewerage system aims to serve almost all the population within the existing service area in 2007. No significant extension of the service area is proposed.
(2) Necessary transport collectors, main sewers and secondary/tertiary sewers to attain the above objectives are proposed. The collector/sewer size is designed to meet the design wastewater flow of the master plan.
(3) The treatment plant is proposed since it is the first stage of the master plan. The capacity is designed to treat the wastewater flow in 2007 and the process is applied to meet the requirement of river water quality improvement in 2007.
3. PROPOSED SEWERAGE DEVELOPMENT
3.1 Design Criteria for Sewerage System and Treatment Plant
The design criteria of the sewerage systems and treatment plants of the five (5) F/S projects are summarized below. The proposed sewerage service areas are shown in Fig. II-1 (1) to Fig. II-5 (1).

18
Item Dugo Selo Vrbovec Sisak Kutina Karlovac- Duga Resa
Service Area (ha) 516 422 944 734 1,142 Served Population 10,300 5,900 45,400 19,600 43,800 Served Large Industry (No.) - 2 3 1 10 Daily Maximum Wastewater Quantity (m3/d) 3,605 4,539 16,973 7,678 23,285
Municipal Wastewater (m3/d) 3,605 1,770 15,890 6,860 15,430 Industrial Wastewater (m3/d) - 2,769 1,083 818 7,855
Influent BOD Concentration (mg/l) 211 198 211 190 193 Pollution Load (PE) 12,700 14,600 59,900 24,500 74,800 Effluent BOD Concentration (mg/l) 25 25 127 25 116
3.2 Proposed Sewer
The main features of the proposed collectors in the five (5) F/S projects are summarized below. Location of the proposed collectors is shown in Fig. II-1 (1) to Fig. II-5 (1).
Urban Center Transport Collector Main Sewer Secondary/Tertiary Total ∅ (mm) L (m) ∅ (mm) L (m) ∅ (mm) L (m) ∅ (mm) L (m)
Dugo Selo 800-1,200 5,490 - - 400 2,100 400-1,200 7,590 Vrbovec 350-400 1,880 - - 100 750 100-400 2,630 Sisak 450-1,000 6,340 - - - - 450-1,000 6,340 Kutina - - 400 180 100-200 9,000 100-400 9,180 Karlovac - Duga Resa 300-1,700 11,670 - - 400 1,000 300-1,700 12,670
Total 25,380 180 12,850 38,410
3.3 Proposed Treatment Plant
The mechanical dewatering system is proposed for the sludge treatment of all the five (5) F/S projects. The following treatment processes are proposed:
(1) Biological Treatment (AS) is proposed for the Dugo Selo, Vrbovec and Kutina F/S projects as the first stage. AS is part of the AO process. The remaining part of the AO process will be deferred to the second stage to remove T-P.
(2) Primary Sedimentation is proposed for the Sisak and Karlovac-Duga Resa F/S projects as the first stage.
The main features of the proposed treatment plants in the five (5) F/S projects are summarized in the following table. Layouts of the proposed treatment plants are shown in Fig. II-1 (2) to Fig. II-5 (2).

19
Main Features Dugo Selo Vrbovec Sisak Kutina Karlovac- Duga Resa
Treatment Process Activated Sludge
Activated Sludge
Primary Sedimentation
Activated Sludge
Primary Sedimentation
Preliminary Treatment (unit) 1 1 1 1 1 Primary Sedimentation Tank
Unit 3 3 6 3 5 Width (m) 3.0 3.0 4.0 4.0 6.5 Length (m) 12.0 14.0 18.0 18.0 19.0 Depth (m) 3.0 3.0 3.0 3.0 3.0
Aeration Tank Unit 3 3 - 3 - Width (m) 5.0 5.0 - 5.0 - Length (m) 20.0 22.0 - 35.0 - Depth (m) 5.0 5.0 - 5.0 -
Secondary Sedimentation Tank Unit 2 2 - 2 - Diameter (m) 12.0 13.0 - 17.0 - Depth (m) 3.5 3.5 - 3.5 -
Belt Press Filter Unit 2 2 2 2 2 Width (m) 1.5 1.5 2.0 1.5 2.0
Note: Preliminary Treatment includes inlet pump, screen, oil/sand trap.
4. PROJECT COST
4.1 Construction Cost
The construction cost of collectors and treatment plants is estimated with the following cost components. In this estimate, the following exchange rates at the end of February 2001 is employed: US$1.00 = Kn. 8.3 = JP¥ 116.
Item Remarks (1) Direct Construction Cost (2) Land Acquisition Cost (3) Indirect Construction Cost
(a) Engineering Cost 10% × (1) (b) Administration Cost 3% × (1) (c) Customs Duties 10% of Mechanical/Electrical Works (d) VAT 22% × {(1) + (a)}
(4) Contingency 10% × (1)
The construction cost of each of the five (5) F/S projects is as estimated below at 2001 prices.
(Unit: million Kn)
Item Dugo Selo Vrbovec Sisak Kutina Karlovac- Duga Resa Total
Direct Construction Cost 33.51 25.69 45.52 27.12 85.39 217.22 Collector 10.42 2.42 14.18 6.08 41.73 74.83
Transport/Main Collector 8.77 2.10 14.18 0.18 40.86 66.09 Secondary/Tertiary Sewer 1.65 0.32 - 5.91 0.87 8.74
Treatment Plant 23.08 23.27 31.33 21.04 43.66 142.38 Land Acquisition Cost 0.19 0.20 - - 1.45 1.84 Indirect Construction Cost 13.90 11.05 18.89 11.33 34.38 89.53 Contingency 3.35 2.57 4.55 2.71 8.54 21.72 Total 50.94 39.51 68.95 41.16 129.76 330.31

20
4.2 Operation and Maintenance Cost
The annual operation and maintenance (O&M) costs of the five (5) F/S projects (excluding O&M costs for the existing sewerage systems) are as estimated below at 2001prices.
(Unit: 103 Kn)
Facilities Item Dugo Selo Vrbovec Sisak Kutina Karlovac- Duga Resa Total
Collector Maintenance 79 19 46 107 317 568 WWTP 1,508 1,508 1,937 2,417 2,013 9,383 Electric Charge 350 350 499 666 526 2,391 Personnel Expense 499 499 499 499 499 2,495 Mechanical Maintenance 168 168 240 320 252 1,148 Laboratory 154 154 220 293 231 1,052 Others 336 336 479 639 505 2,295 Total 1,588 1,527 1,983 2,524 2,330 9,952 Note: WWTP means wastewater treatment plant.
5. ENVIRONMENTAL IMPACT ASSESSMENT
The environmental impacts of the proposed projects were assessed as to the following items: (i) land acquisition, (ii) noise during construction/operation, (iii) foundation geology of treatment plant, (iv) flora/fauna, (v) dust/odor, (vi) water pollution/water use, and (vii) sludge disposal/groundwater. The assessment results are summarized below.
Item Dugo Selo Vrbovec Sisak Kutina Karlovac- Duga Resa
Land Acquisition Ο Ο Ο Ο Ο Noise Ο Ο ∆ Ο Ο Geology Ο Ο Ο Ο Ο Flora/Fauna Ο Ο Ο Ο Ο Dust/Odor ∆ ∆ ∆ ∆ ∆ Water Pollution/Water Use Ο Ο Ο Ο Ο Sludge Disposal/Groundwater ∆ ∆ ∆ ∆ ∆ Note: Ο: none or negligible ∆: slight impact but acceptable
(1) Noise may be caused by the installation of the transport collectors in the Sisak project. However, the impact is slight, temporary and acceptable in the daytime.
(2) The operation of construction equipment and earth works may produce dust. Although the impacts are temporary, some control measures (such as covering) should be taken. However, the operation of the sewage treatment plant will cause no significant odor since the generated sludge is treated by the mechanical dewatering system and the treatment plants are located more than 250 to 300 m away from the nearest residences.
(3) Heavy metals were either not detected or negligible in the wastewater effluent of the large industries in the F/S towns. Hence, the quality of sludge generated from the projects is considered normal. On the other hand, the concentration of heavy metals in the sludge of the existing biological treatment plants in the country is lower than the permissible limits of the Croatian Government for sludge disposal.
Accordingly, the dewatered sludge of projects can be disposed on the solid waste disposal sites of the respective towns. The groundwater around the existing solid waste disposal sites in the F/S towns has only been slightly polluted by organic matter. Further, the F/S towns have plans to install a leachate treatment system in the near future. Hence, the sludge disposal on the existing solid waste disposal sites will cause no significant impacts on the surrounding environments.

21
6. FINANCIAL ANALYSIS
6.1 Introduction
The sewerage systems of Dugo Selo, Vrbovec, Sisak, Kutina, Karlovac and Duga Resa are independently operated and maintained by their respective municipal service companies at present. However, the sewerage systems of Karlovac and Duga Resa will be jointly operated and maintained by their service companies in the future.
The financial feasibility of the proposed five (5) sewerage development projects was confirmed through evaluation of the financial statement of each municipal company. Further, it was checked through the calculation of financial internal rate of return (FIRR). The financial analysis was made for both the existing and the proposed integrated sewerage system.
The financial feasibility of the projects much depends on the future growth of GDP. It is because the affordable sewerage charges and the personnel expenses for operation/maintenance will increase in proportion to the growth of per capita GDP and further, the industrial wastewater quantity will also increase according to the growth of GDP.
The industrial activities in the Study Area have not recovered yet and the future economic growth of the country is still uncertain. Hence, in this financial analysis, a lower growth of GDP (half of the assumed growth for the engineering studies) is applied to ensure the reliability of financial evaluation; namely, 1.8% for 2001-2005, 2.75% for 2006-2010 and 2.25% for 2011-2015.
6.2 Implementation Schedule
The proposed projects are assumed to start in 2003 with completion in 2007. The treatment plants of Dugo Selo, Vrbovec and Kutina will be constructed in two (2) stages: Stage I for primary treatment system and Stage II for biological treatment system. The influent/effluent wastewater to/from the primary sedimentation tank will be monitored for one (1) year before the commencement of Stage II works. On the other hand, the treatment plant of Sisak and Karlovac-Duga Resa will be constructed simultaneously since the wastewater is to be treated only by the primary sedimentation process.
The proposed implementation schedule of the five (5) F/S projects is given below.
Item Construction Works Dugo Selo, Vrbovec, Kutina
Sisak, Karlovac- Duga Resa
Detailed Design and Land Acquisition 2003 2003
Stage I Construction Collector, Primary Treatment, Sludge Treatment, etc. 2004 - Mid 2005 2004 - 2006
Monitoring --- Mid 2005 - Mid 2006 - Stage II Construction Biological Treatment Mid 2006 - 2007 -

22
6.3 Disbursement Schedule of Construction and O&M Costs
The disbursement schedules of construction costs are summarized below.
(Unit: 10 3 Kn, 2001 Price) Project 2003 2004 2005 2006 2007 Total
Dugo Selo 1,058 26,414 13,643 3,566 6,261 50,941 Vrbovec 867 18,616 9,642 3,683 6,698 39,506 Sisak 1,479 8,027 29,724 29,724 - 68,954 Kutina 705 18,753 9,729 4,225 7,744 41,157 Karlovac-Duga Resa 4,228 21,867 51,830 51,830 - 129,755
Total 8,337 93,677 114,567 93,028 20,703 330,312
The disbursement schedules of the total O&M cost of existing and proposed sewerage systems are summarized below.
(Unit: 103 Kn, 2001 Price) Year 2003 2004 2005 2006 2007 2008 2010 2015 -
Dugo Selo 120 122 696 1,280 1,291 2,387 2,428 2,520 Vrbovec 768 776 1,326 1,889 1,911 3,019 3,082 3,222 Sisak 7,308 7,388 7,469 7,596 10,307 10,458 10,771 11,470 Kutina 2,252 2,276 3,167 4,082 4,133 5,826 5,950 6,226 Karlovac-Duga Resa 8,091 8,180 8,270 8,410 12,077 12,248 12,606 13,403
6.4 Revenue of Sewerage Charge
(1) Existing Unit Sewerage Charge
At present, two (2) kinds of unit charges are set in each town: one is for domestic users and another is for the other users (institutional and small/large industries). The sewerage charges are imposed on the users based on their water consumption. The unit sewerage charges including VAT (22%) of the six (6) towns in 2001 are as estimated below on the basis of wastewater quantity by assuming the sewerage return rate at 80%.
(Unit: Kn/m3, 2001 Price)
Town Domestic User Other Users Dugo Selo 0.36 0.74 Vrbovec 0.59 0.81 Sisak 1.34 4.00 Kutina 4.12 4.12 Karlovac 1.45 2.67 Duga Resa 0.54 0.54 Average 1.40 2.15
(2) Affordable Unit Domestic Sewerage Charge
The average household income in the six (6) towns is estimated at 3,600 Kn/month. According to the questionnaire survey, the inhabitants� willingness to pay domestic sewerage charges ranges from 18.0 Kn/household/month to 34.0 Kn/household/month, or 24.5 Kn/household/month on the average.
On the other hand, the average domestic wastewater quantity of households is estimated to be 12.0 m3/household/month when the family size is assumed at 3 persons.
From the above data and discussions, the rates of existing and affordable domestic sewerage charges to household income are calculated as follows.

23
Household Domestic Charge
(Kn/household/month) Domestic Charge Rate to Household Income (%) Town
Existing Willingness to Pay Existing Willingness to Pay Dugo Selo 4.32 28.0 0.12 0.78 Vrbovec 7.08 20.0 0.20 0.56 Sisak 16.08 18.0 0.45 0.50 Kutina 49.44 34.0 1.37 0.94 Karlovac 17.40 20.0 0.48 0.56 Duga Resa 6.48 27.0 0.18 0.75 Average 16.80 24.5 0.47 0.68 Note: Estimated at 2001 prices
As shown in the above table, the affordable ratio of domestic sewerage charge to household income is in the range of 0.5% and 0.9%, or 0.7% on the average.
(3) Wastewater Quantity
The sewerage wastewater quantity is classified into domestic wastewater and other wastewater (institutional, small industries and large industries) corresponding to the classification of sewerage charge collection. The wastewater quantity is assumed to increase at a certain rate until 2007 and thereafter, become constant.
The projects are the first stage of the master plan and the treatment of excess wastewater generated after 2007 is regarded as the second stage project. The annual wastewater quantity of the five (5) sewerage systems is as estimated below. In this estimation, the connection rate is assumed at 90% for domestic users and 100% for other users.
(Unit: 103 m3/year)
Year 2003 2004 2005 2006 2007 - Dugo Selo 742 798 853 908 974
Domestic 520 558 596 634 682 Others 221 239 257 274 292
Vrbovec 348 376 835 1,298 1,333 Domestic 304 327 350 373 396 Others 45 49 485 925 937
Sisak 3,662 3,915 4,168 4,421 4,674 Domestic 2,360 2,532 2,703 2,875 3,046 Others 1,301 1,383 1,465 1,546 1,628
Kutina 1,663 1,783 1,903 2,022 2,143 Domestic 996 1,075 1,154 1,233 1,313 Others 667 708 749 789 830
Karlovac-Duga Resa 4,260 4,559 4,859 5,745 6,637 Domestic 2,126 2,325 2,524 2,723 2,922 Others 2,133 2,234 2,335 3,023 3,715
(4) Revenue of Sewerage Charge
The annual revenue of sewerage charge is estimated as the product of the annual wastewater quantity and the proposed sewerage charge. In this estimation, the existing collection rate of sewerage charge is assumed to gradually improve to 90% by 2007.
6.5 Financial Evaluation
6.5.1 General
Each municipal service company should be able to perform a sound sewerage business by collecting sewerage charges set within the users� affordability. For this purpose, a certain

24
amount of financial assistance from the Central Government (including Croatian Waters) is considered necessary for the construction of the proposed projects. The possible financial sources of construction cost are the Central Government (Grant and Water Management Fund Loan) and the external ODA loan to be extended through the Central Government.
In this financial evaluation, the required sewerage charge and financial assistance from the Central Government are estimated by analyzing the financial status of each municipal service company. The financial limitation of the Central Government is not considered.
6.5.2 Existing Financing System
The financing system usually applied for sewerage projects in Croatia is as follows:
(1) Twenty percent (20%) of the construction cost is provided by the Central Government as Grant.
(2) Forty percent (40%) of the construction cost is financed from the proceeds of an interest free loan with 50-year repayment from the Water Management Fund through Croatian Waters.
(3) The remaining 40% of the construction cost is financed with funds from the Local Government/municipal service company.
(4) The O/M and depreciation costs are fully covered by sewerage charges, in principle.
6.5.3 Calculation of Required Sewerage Charge
(1) General
In the determination of the required sewerage charges, financial statements consisting of income and cash flow statements of the municipal service companies were prepared on the assumption that they satisfy the following conditions under the assumed financial assistance of the Central Government and the external loan.
(a) Annual net income should be almost positive throughout the entire period of 25 years (2003�2027).
(b) External loan liability should be zero in 25 years.
(c) Necessary cash should be reserved before the replacement of mechanical and electrical equipment.
(2) Preparation of Alternatives
The required sewerage charges vary depending on the conditions of the financial assistance of the Central Government and the external loan. Hence, the following typical four (4) alternatives were prepared for the financial evaluation.
Financing for Construction Cost Case
Central Government Grant Water Management Fund External Loan Alternative-1 20% 40% (no interest) 40% (interest: 2%) Alternative-2 20% 40% (no interest) 40% (interest: 6%) Alternative-3 40% - 60% (interest: 2%) Alternative-4 60% - 40% (interest: 2%)
In the above alternatives, repayment of the Water Management Fund loan is assumed to be 50 years including a 7-year grace period, and that of the external loan is 25 years also including a 7-year grace period.

25
(3) Calculated Sewerage Charge
The required sewerage charges of the five (5) municipal service companies under the four (4) alternatives were calculated under the following assumptions:
(a) The Water Management Fund loan and the external loan are repaid from sewerage charges. Besides, the O/M and depreciation costs are also covered by sewerage charges.
(b) The unit sewerage charges vary at present and are set by each town individually. The ratio between unit domestic charge and unit other charges also vary town at present and the existing ratio is assumed to be maintained in the future.
(c) The unit sewerage charge will increase in proportion to the growth of per capita GDP.
(d) Profit tax is assumed at 20%.
(e) In Karlovac Town, the replacement of damaged sewers will be implemented during five (5) years (2003-2007), separately from the proposed sewerage development project of Karlovac-Duga Resa. The replacement cost is estimated to be Kn. 58.88 million at the price of 2001. It is assumed that 60% of the cost is to be provided by the Local Government in the sort of grant and 40% is to be covered by sewerage charges.
The calculated sewerage charges in 2001 are shown in the following table at the price of 2001 compared with the existing ones. The values of calculated internal rate of return (FIRR) are also shown in the same table.
Dugo Selo Vrbovec Sisak Kutina Karlovac- Duga Resa
Existing Rate to Household Income (%) 0.12 0.20 0.45 1.37 0.48 (0.18) Domestic Charge (Kn/m3) 0.36 0.59 1.34 4.12 1.45 (0.54) Other Charge (Kn/m3) 0.74 0.81 4.00 4.12 2.67 (0.54) FIRR (%)
Alternative 1 Rate to Household Income (%) 0.95 0.80 0.48 1.37 0.63 Domestic Charge (Kn/m3) 2.85 2.40 1.44 4.12 1.89 Other Charge (Kn/m3) 5.86 3.29 4.30 4.12 2.92 FIRR (%) 4.81 4.69 3.67 24.23 4.87
Alternative 2 Rate to Household Income (%) 1.02 0.85 0.51 1.37 0.66 Domestic Charge (Kn/m3) 3.06 2.55 1.53 4.12 1.98 Other Charge (Kn/m3) 6.29 3.50 4.57 4.12 3.06 FIRR (%) 6.54 6.51 6.75 24.23 6.20
Alternative 3 Rate to Household Income (%) 0.98 0.84 0.50 1.37 0.67 Domestic Charge (Kn/m3) 2.94 2.52 1.50 4.12 2.01 Other Charge (Kn/m3) 6.04 3.46 4.48 4.12 3.11 FIRR (%) 5.54 5.70 5.35 40.67 5.55
Alternative 4 Rate to Household Income (%) 0.85 0.75 0.47 1.37 0.62 Domestic Charge (Kn/m3) 2.55 2.25 1.41 4.12 1.86 Other Charge (Kn/m3) 5.24 3.09 4.21 4.12 2.87 FIRR (%) 6.58 5.98 5.48 Large 5.91
Note: Values are estimated at 2001 prices. Values not in parentheses are the existing charges in Karlovac, while those in parentheses are for Duga Resa.

26
6.5.4 Proposed Sewerage Charge and Financial Assistance
According to the questionnaire survey, the inhabitants� willingness to pay domestic sewerage charges is in the range of 0.5% to 0.9% of household income, or 0.7% on the average. Hence, the proposed domestic sewerage charge should not exceed 0.9% of household income.
Further, the proposed projects mainly benefit the population downstream, enhance the environment nationwide and are therefore of national importance. Hence, the financial assistance of the Central Government for each of the five (5) projects should be set higher than has been usually extended.
From the above considerations, the sewerage charges in Alternative 4 are proposed; namely, sixty percent (60%) of the construction cost shall be provided by the Central Government as a Grant and the remaining forty percent (40%) is to be financed with funds from an external loan through the Central Government. The external loan conditions are to be 2.0% interest and 25-year repayment including a 7-year grace period.
It should be noted that the above external loan (40% of construction cost) does not mean the actual amount of loan to be obtained by the Central Government but only the loan amount to be repaid from sewerage charges. In case the financial resources of the Central Government are limited, it may need to obtain more external loan to be able to extend the necessary grant (60% of construction cost) to the municipal service companies.
The proposed sewerage charges will increase according to the assumed growth of GDP in the future, as shown below.
(Unit: Kn/m3, 2001 Price) Existing Proposed Project (2001) 2001 2003 2005 2010 2015 -
Dugo Selo Domestic 0.36 2.55 2.64 2.74 3.14 3.51 Others 0.74 5.24 5.43 5.63 6.45 7.20
Vrbovec Domestic 0.59 2.25 2.33 2.42 2.77 3.09 Others 0.81 3.09 3.20 3.32 3.80 4.25
Sisak Domestic 1.34 1.41 1.46 1.51 1.73 1.94 Others 4.00 4.21 4.36 4.52 5.18 5.79
Kutina Domestic 4.12 4.12 4.27 4.42 5.07 5.66 Others 4.12 4.12 4.27 4.42 5.07 5.66
Karlovac-Duga Resa Domestic 1.45 (0.54) * 1.86 1.93 2.00 2.29 2.56 Others 2.67 (0.54) * 2.87 2.98 3.09 3.54 3.95
*: Values not in parentheses are existing charges in Karlovac, while those in parentheses are for Duga Resa
7. RECOMMENDATIONS
(1) The proposed five (5) sewerage development projects; namely, Dugo Selo, Vrbovec, Sisak, Kutina and Karlovac-Duga Resa are technically feasible and financially viable. Early implementation of the projects is necessary to cope with the existing water pollution in the Sava River Basin.

27
(2) For this purpose, the Central Government/State Water Directorate/Croatian Waters and the local governments concerned should immediately proceed with the necessary legal procedures and financial arrangements.
(3) Water pollution of the Lonja River is the worst in the entire Sava River Basin. Early implementation of the Sesvete East and the Ivanić Grad-Klo�tar Ivanić sewerage development projects is also awaited to attain a satisfactory water pollution control of the Lonja River.
(4) Since the available data on river water quantity and quality in the Lonja River are at present limited, necessary monitoring of the river water quantity and quality should be commenced immediately.

TABLES

1999
2015
1999
2015
1999
2015
1999
2015
Sesv
ete-
East
Agr
opro
tein
ka d
.d.
228
377
2,23
0 25
0 50
8 94
Lo
nja
R. (
II)
Sew
erag
e9.
91
Dum
a K
o�e
d.o.
o.50
9 1,
222
686
250
349
306
Lonj
a R
. (II
)Se
wer
age
2.00
Vrb
ovec
PIK
Vrb
ovec
Mes
na In
d.2,
132
3,52
3 18
6 18
6 39
7 65
5 Lo
nja
R. (
II)
Sew
erag
e-
Sisa
kIn
dust
rija
Naf
te d
.d. R
afin
erija
9,39
9 15
,531
27
25
25
1 38
8 K
upa
R. (
II)
Kup
a R
. (II
)10
.30
Her
bos d
.d.
604
939
205
205
124
192
Sew
erag
eSe
wer
age
1.50
Term
oele
ktra
na S
isak
451
745
5 5
2 3
Sava
R. (
II)
Sava
R. (
II)
1.00
Tvor
nica
Seg
estic
a 20
4 33
7 86
6 25
0 17
7 84
Se
wer
age
Sew
erag
e7.
16
Zelje
zara
Pod
uzec
e M
etav
al3,
182
4,94
9 12
12
39
61
Sa
va R
. (II
)Sa
va R
. (II
)2.
00
Ljud
evit
Posa
vski
Mlin
i Pe
kare
83
137
1,58
4 25
0 13
1 34
Se
wer
age
Sew
erag
e5.
91
Kut
ina
Petro
kem
ija (I
ndus
try)
10,3
88
17,1
65
11
11
115
191
Kut
ina
R. (
II)
Kut
ina
R. (
II)
10.0
0
Petro
kem
ija (S
anita
ry)
663
1,06
3 19
19
12
20
Se
wer
age
Sew
erag
e-
Kar
lova
cK
arlo
vaek
a Pi
pova
ra d
.d.
2,30
1 3,
802
456
250
1,04
9 95
1 Se
wer
age
Sew
erag
e16
.28
PPK
-kar
lova
cka
Indu
strij
a M
esn a
348
609
484
250
168
152
Kup
a R
. (II
)Se
wer
age
7.46
Vel
ebit
248
410
150
150
37
62
Kup
a R
. (II
)Se
wer
age
-
Lola
Rib
ar30
7 50
7 11
6 11
6 36
59
M
re�n
ica
R. (
II)
Sew
erag
e-
Kar
lova
cka
Indu
strij
a M
lijek
a25
0 41
3 14
7 14
7 37
61
K
upa
R. (
II)
Sew
erag
e0.
50
Dug
a R
esa
Pam
ućna
Indu
strij
a D
uga
Res
a2,
416
3,99
2 12
0 12
0 29
0 47
9 M
rzen
ica
R. (
II)
Sew
erag
e0.
10
Zabr
e�ić
PLIV
A1,
928
3,18
6 33
9 25
0 65
4 79
7 Sa
va R
. (II
)Se
wer
age
15.3
0
Petri
nja
Gav
rilov
ic d
.d.
1,35
7 1,
979
116
116
157
230
Kup
a R
. (II
)Se
wer
age
1.00
Sub-
tota
l (S
ewer
age)
3,85
5 22
,496
1,
494
4,17
5
Sub-
tota
l (R
iver
)33
,143
38
,390
3,
041
644
Tota
l36
,998
60
,886
4,
534
4,81
8 90
.42
Tabl
e I-
1 P
ropo
sed
Was
tew
ater
Tre
atm
ent o
f Lar
ge P
ollu
tant
Indu
stri
es
Tow
nIn
dust
ry N
ame
Was
tew
ater
Qua
ntity
W
aste
wat
er Q
ualit
y P
ollu
tion
Load
Ef
fluen
t Rec
ipie
nt
Con
stru
ctio
nC
ost
(Mill
ion
Kun
a)(m
3 /d)
BO
D (m
g/l)
BO
D (k
g/d)
(Cat
egor
y)
T-1

1999
2015
1999
2015
Dom
estic
Indu
stry
Tota
lC
olle
ctor
WW
TPTo
tal
1Za
greb
800,
000
935,
000
25,6
0025
,600
274,
860
167,
510
442,
370
1,50
0,00
0A
S1,
365.
0 2
Sesv
ete-
East
11,9
0017
,600
555
837
7,04
01,
599
8,63
929
,600
AO
17.2
49
.3
66.5
3
Dug
o Se
lo
9,10
014
,200
516
1,07
25,
680
05,
680
18,5
00A
O49
.7
41.3
91
.0
4V
rbov
ec5,
000
8,40
039
379
12,
856
3,71
06,
566
20,4
00A
O36
.5
41.7
78
.2
5Si
sak
39,4
0052
,400
944
2,38
020
,960
1,41
322
,373
73,4
00A
O67
.8
92.0
15
9.8
6K
utin
a16
,100
24,8
0054
91,
303
9,92
01,
063
10,9
8332
,900
AO
43.7
40
.2
84.0
K
arlo
vac
-28
,200
55,8
0096
61,
978
22,3
207,
603
29,9
2394
,800
D
uga
Res
a3,
800
10,9
0013
320
54,
360
3,99
28,
352
22,2
008
Sv. I
van
Zelin
a3,
200
7,00
025
156
92,
380
02,
380
7,70
0O
D18
.1
25.5
43
.6
Ivan
ić G
rad
-5,
700
10,6
0052
486
34,
240
1,28
35,
523
14,3
00
Klo
�tar
Ivan
ić60
080
013
815
027
20
272
900
10Sa
mob
or15
,400
29,2
001,
518
1,91
411
,680
1,52
813
,208
39,5
00A
O14
.4
44.0
58
.4
11Za
pre�
ić13
,300
30,5
0094
91,
491
12,2
006,
544
18,7
4461
,300
AO
29.4
76
.8
106.
3 12
Vel
ika
Gor
ica
33,5
0062
,400
1,45
32,
011
24,9
6066
225
,622
82,2
00A
S30
.0
47.5
77
.5
13Ja
stre
bars
ko5,
300
8,10
040
962
32,
754
180
2,93
49,
600
OD
8.4
27.7
36
.0
14Pe
trinj
a10
,300
13,1
0041
965
05,
240
1,97
97,
219
20,9
00A
O10
.4
45.2
55
.6
15G
lina
2,00
05,
200
175
480
1,76
80
1,76
85,
800
OD
14.3
22
.3
36.6
16
Topu
sko
500
1,60
034
8454
40
544
1,80
0A
L3.
5 3.
0 6.
5 17
Popo
vaća
1,80
03,
600
123
179
1,22
474
71,
971
7,20
0O
D3.
7 23
.1
26.7
18
Lipo
vlja
ni
800
3,00
060
328
1,02
00
1,02
03,
300
OD
11.2
17
.1
28.3
19
Nov
ska
4,00
09,
000
380
541
3,06
00
3,06
09,
900
OD
9.0
28.2
37
.2
20O
gulin
010
,400
046
84,
160
340
4,50
013
,800
AO
8.5
34.0
42
.5
21Pl
a�ki
080
00
5227
20
272
900
OD
3.0
9.3
12.4
22
Slun
j 60
02,
400
6221
981
60
816
2,70
0O
D7.
8 15
.7
23.4
21
0,50
038
1,80
010
,549
19,1
8614
9,72
632
,643
182,
369
573,
600
2,73
8.8
1,01
0,50
01,
316,
800
36,1
4944
,786
424,
586
200,
153
624,
739
2,07
3,60
053
0.8
843.
0 1,
373.
8
2): Z
apre
�ić
incl
udes
Brd
ovec
Tab
le I-
2 P
ropo
sed
Sew
erag
e D
evel
opm
ent P
lan
Nam
eSe
rved
Pop
ulat
ion
Serv
ed A
rea
(ha)
Des
ign
Qua
ntity
(m3 /d
ay)
Pers
onEq
uiva
lent
(PE)
Trea
tmen
tPr
oces
s *
Con
stru
ctio
n C
ost (
Mill
ion
Kun
a)
259.
9
43.4
7A
O13
3.2
126.
7
9A
O10
.9
32.4
Sub-
tota
l (ex
cept
Zag
reb)
Tota
l1)
: * A
S:A
ctiv
ated
Slu
dge,
AO
: Ana
erob
ic O
xic
Act
ivat
ed S
ludg
e, O
D: O
xida
tion
Ditc
h, A
L: A
erat
ed L
agoo
n
T-2

FIGURES