THE STRUCTURE OF U 6+ SORPTION COMPLEXES ON … 47/47-4-439.pdf · THE STRUCTURE OF U 6+ SORPTION...
19
Clays and Clay Minerals, Vol.47, No. 4, 439-457, [999. THE STRUCTURE OF U 6+ SORPTION COMPLEXES ON VERMICULITE AND HYDROBIOTITE ERIC A. HUDSON, l't LOUIS J. TERMINELLO, ~ BRIAN E. VIANI, 2 MELISSA DENECKE, 3 TOBIAS REICH, 3 PATRICK G. ALLEN, 1'4 JEROME J. BUCHER, 4 DAVID K. SHUH, 4 AND NORMAN M. EDELSTEIN 4 i Glenn T. Seaborg Institute for Transactinium Science, Lawrence Livermore National Laboratory, L-231, EO. Box 808, Livermore, California 94551, USA 2 Earth and Environmental Sciences Directorate, Lawrence Livermore National Laboratory, L-219, PO. Box 808, Livermore, California 94551, USA 3 Institut t'tir Radiochemie, Forschungszentrum Ross endorf, Postfach 510119, D-01314 Dresden, Germany 4 Lawrence Berkeley National Laboratory, MS 70A-1150, 1 Cyclotron Rd., Berkeley, California 94720, USA Abstract--The sorption of the uranyl oxo-cation (UOz2+)at different types of binding sites on layer silicate mineral surfaces was investigated. Well-characterized samples of vermiculite and hydrobiotite were ex- posed to aqueous uranyl under conditions designed to promote surface sorption either at fixed charge ion- exchange sites or at amphoteric surface hydroxyl sites. The local structure of uranium in the sorption samples was directly measured using uranium L3-edge extended X-ray absorption fine structure (EXAFS). Polarized Lt- and L3-edge X-ray absorption near-edge structure (XANES) measurements were used to characterize the orientation of uranyl groups in layered samples. X-ray diffraction (XRD) measurements of interlayer spacings were used to assess the effects of ion-exchange and dehydration upon the mineral structure. The most significant findings are: (1) Under conditions which greatly favor ion-exchange sorp- tion mechanisms, uranyl retains a symmetric local structure suggestive of an outer-sphere complex, with a preferred orientation of the uranyl axis parallel to the mineral layers; (2) Upon dehydration, the ion- exchange complexes adopt a less symmetric structure, consistent with an inner-sphere complex, with less pronounced orientation of the uranyl axis; and (3) For conditions which favor sorption at surface hydroxyl sites, uranyl has a highly distorted equatorial shell, indicative of stronger equatorial ligation, and the detection of a neighboring U atom suggests the formation of surface precipitates and/or oligomeric com- plexes. Key Words Cation Exchange, EXAFS, Sorption, Surface Complex, Uranium, Uranyl, Vermiculite, XANES, XRD. INTRODUCTION Transport of uranium in the geosphere is a complex phenomenon which is not yet fully characterized. Ura- nium migration is a concern both in the management of contaminated sites and in the planning of waste- disposal installations. There is a growing effort to im- prove the understanding of the processes which con- trol U transport, both to facilitate remediation of con- taminated sites and to improve the prediction of mi- gration behavior. One such process is the retardation of U transport in ground water due to sorption on min- eral surfaces. Despite the importance of this mecha- nism, there is limited direct knowledge about U-min- eral interactions at the molecular level. Thus, we have investigated the structure of U bound at different bind- ing sites on layer silicate surfaces. In contact with air and water, U exists predomi- nantly in the +6 oxidation state as the linear uranyl oxo-cation UO2 2+. Our examination of U immobiliza- tion on mineral surfaces begins with a consideration of the aqueous chemistry of uranyl. Although the two axial oxygen atoms are tightly bonded to the U atom, , Present address: Lam Research Corp., CA-3, 4650 Cush- ing Pkwy., Fremont, California 94538, USA. there are four to six additional coordination sites avail- able about the equator of the uranyl cation. In fact, uranyl exhibits a rich coordination chemistry through these equatorial sites, with strong complexation by hy- droxide and carbonate among the many possibilities (Grenthe et al., 1992). Uranyl may similarly be ex- pected to form inner-sphere complexes at active sites on a mineral surface, with surface O atoms acting as equatorial ligands. Uranyl also tends to form oligo- mers in aqueous solution, especially at neutral or high pH, or in the presence of ligands which favor bridged structures (Grenthe et al., 1992; Allen et al., 1996a). Oligomeric surface complexes or surface precipitates are therefore strong possibilities in the interaction of uranyl with minerals. Aqueous uranyl also may coor- dinate to cation-exchange sites in many materials, such as clays and zeolites (Suib et al., 1986). The selectivity of montmorillonite ion-exchange sites for uranyl is be- tween those of divalent and monovalent metal cations (Tsunashima et al., 1981). The following investigation of uranyl interaction with layer silicate surfaces con- siders several potential sorption mechanisms, includ- ing inner- and outer-sphere complexation, oligomeric surface complexation, ion-exchange complexation, and surface precipitation. These mechanisms are not Copyright 1999, The Clay Minerals Society 439
Transcript of THE STRUCTURE OF U 6+ SORPTION COMPLEXES ON … 47/47-4-439.pdf · THE STRUCTURE OF U 6+ SORPTION...
Clays and Clay Minerals, Vol. 47, No. 4, 439-457, [999.
T H E S T R U C T U R E OF U 6+ S O R P T I O N C O M P L E X E S O N V E R M I C U L I T E
A N D H Y D R O B I O T I T E
ERIC A. HUDSON, l't LOUIS J. TERMINELLO, ~ BRIAN E. VIANI, 2 MELISSA DENECKE, 3 TOBIAS REICH, 3 PATRICK G. ALLEN, 1'4 JEROME J. BUCHER, 4 DAVID K. SHUH, 4 AND NORMAN M. EDELSTEIN 4
i Glenn T. Seaborg Institute for Transactinium Science, Lawrence Livermore National Laboratory, L-231, EO. Box 808, Livermore, California 94551, USA
2 Earth and Environmental Sciences Directorate, Lawrence Livermore National Laboratory, L-219, PO. Box 808, Livermore, California 94551, USA
3 Institut t'tir Radiochemie, Forschungszentrum Ross endorf, Postfach 510119, D-01314 Dresden, Germany 4 Lawrence Berkeley National Laboratory, MS 70A-1150, 1 Cyclotron Rd., Berkeley, California 94720, USA
Abs t r ac t - -The sorption of the uranyl oxo-cation (UOz2+)at different types of binding sites on layer silicate mineral surfaces was investigated. Well-characterized samples of vermiculite and hydrobiotite were ex- posed to aqueous uranyl under conditions designed to promote surface sorption either at fixed charge ion- exchange sites or at amphoteric surface hydroxyl sites. The local structure of uranium in the sorption samples was directly measured using uranium L3-edge extended X-ray absorption fine structure (EXAFS). Polarized Lt- and L3-edge X-ray absorption near-edge structure (XANES) measurements were used to characterize the orientation of uranyl groups in layered samples. X-ray diffraction (XRD) measurements of interlayer spacings were used to assess the effects of ion-exchange and dehydration upon the mineral structure. The most significant findings are: (1) Under conditions which greatly favor ion-exchange sorp- tion mechanisms, uranyl retains a symmetric local structure suggestive of an outer-sphere complex, with a preferred orientation of the uranyl axis parallel to the mineral layers; (2) Upon dehydration, the ion- exchange complexes adopt a less symmetric structure, consistent with an inner-sphere complex, with less pronounced orientation of the uranyl axis; and (3) For conditions which favor sorption at surface hydroxyl sites, uranyl has a highly distorted equatorial shell, indicative of stronger equatorial ligation, and the detection of a neighboring U atom suggests the formation of surface precipitates and/or oligomeric com- plexes.
Key Words Cation Exchange, EXAFS, Sorption, Surface Complex, Uranium, Uranyl, Vermiculite, XANES, XRD.
I N T R O D U C T I O N
Transpor t of u r an ium in the geosphere is a com p l ex p h e n o m e n o n wh ich is not yet ful ly character ized. Ura- n ium migra t ion is a conce rn bo th in the m a n a g e m e n t of c o n t a m i n a t e d sites and in the p l ann ing of waste- d isposal instal la t ions. The re is a g rowing effor t to im- p rove the unde r s t and ing of the processes w h i c h con- trol U t ransport , bo th to faci l i ta te r emed ia t i on of con- t amina t ed sites and to i m pr ove the pred ic t ion of mi- gra t ion behavior . One such process is the re ta rda t ion of U t ranspor t in g round wate r due to sorp t ion on min - eral surfaces. Desp i te the impor t ance of this mecha - n ism, there is l imi ted direct k n o w l e d g e abou t U - m i n - eral in te rac t ions at the molecu la r level. Thus , we have inves t iga ted the s t ructure of U b o u n d at d i f ferent b ind- ing sites on layer si l icate surfaces.
In contac t wi th air and water, U exis ts p redomi- nant ly in the + 6 ox ida t ion state as the l inear u rany l oxo-ca t ion UO2 2+. Our exam i na t i on o f U immobi l i za - t ion on mine ra l surfaces beg ins wi th a cons ide ra t ion of the aqueous c h e m i s t r y of uranyl . A l t h o u g h the two axial oxygen a toms are t ight ly b o n d e d to the U atom,
, Present address: Lam Research Corp., CA-3, 4650 Cush- ing Pkwy., Fremont, California 94538, USA.
there are four to six addi t iona l coord ina t ion sites avai l- able about the equa to r of the uranyl cat ion. In fact, u rany l exhib i t s a r ich coord ina t ion c h e m i s t r y t h rough these equator ia l sites, w i th s t rong c o m p l e x a t i o n by hy- d rox ide and ca rbona te a m o n g the m a n y poss ib i l i t i es (Gren the e t a l . , 1992). Urany l m a y s imi lar ly be ex-
pec ted to fo rm inner - sphere c o m p l e x e s at ac t ive sites on a mine ra l surface, w i th surface O a toms act ing as
equator ia l l igands. U r a n y l also tends to fo rm ol igo-
mers in aqueous solut ion, espec ia l ly at neut ra l or h igh pH, or in the p re sence of l igands w h i c h favor b r idged
s t ructures (Gren the e t a l . , 1992; A l l en e t a l . , 1996a). O l igomer i c surface c o m p l e x e s or surface prec ip i ta tes
are therefore s t rong poss ib i l i t ies in the in te rac t ion o f u rany l wi th minera ls . A q u e o u s uranyl also m a y coor-
d ina te to c a t i on -exchange sites in m a n y mater ia ls , such as c lays and zeol i tes (Su ib e t a l . , 1986). T h e se lec t iv i ty
of m o n t m o r i l l o n i t e i o n - e x c h a n g e si tes for u rany l is be-
tween those of d iva len t and m o n o v a l e n t me ta l ca t ions (Tsunash ima e t a l . , 1981). The fo l lowing inves t iga t ion
o f u rany l in te rac t ion wi th layer si l icate surfaces con-
s iders several po ten t ia l sorp t ion m e c h a n i s m s , inc lud- ing inner- and outer -sphere complexa t ion , o l igomer i c
su r f ace c o m p l e x a t i o n , i o n - e x c h a n g e c o m p l e x a t i o n , and surface precipi ta t ion . These m e c h a n i s m s are no t
Copyright �9 1999, The Clay Minerals Society 439

440 Hudson et al. Clays and Clay Minerals
exclusive and in fact some combinations are possible. In this paper, any immobilization of uranyl on external or interlamellar layer silicate surfaces is generally re- ferred to as "sorption".
Sorption sites for aqueous metal species on phyl- losilicate minerals are placed in two categories based on the sorption mechanism and the local structure of the mineral surface: (1) Ion-exchange at permanent negative charge sites; and (2) Complexation by chem- ically active surface hydroxyl groups at layer edges. The experiments presented here show trends in uranyl local structure as conditions are varied to favor sorp- tion at these two different types of sites. The possi- bility for such control arises from a combination of sorption properties. Complexation at surface hydroxyl sites becomes more likely as pH values increase, due to deprotonation of active groups (Sposito, 1984). This complexation can also be promoted by increasing the number of edge sites, i.e., by using a smaller size frac- tion of the mineral. These conditions also promote pre- cipitation of surface-stabilized solid phases on mineral faces with exposed surface hydroxyl sites. Ion ex- change is favored at lower ionic strengths, where there is less competition from background cations. In these experiments, ion-exchange interactions are promoted by maintaining low pH and low ionic strength, and in some cases by pre-exchanging with an easily remov- able monovalent cation. Surface complexation and/or surface precipitation at hydroxyl sites are promoted by using near-neutral pH, increased mineral surface areas, and higher ionic strength. The aqueous speciation of uranyl is strongly pH dependent, so geochemical mod- eling based on thermodynamic data was used to pre- dict the uranyl species, aiding in the interpretation of sorption trends. In fact, near-neutral pH tends to favor neutral or anionic uranyl species, reducing the likeli- hood of sorption by cation exchange.
This work also develops frontier techniques for the study of uranyl sorption. We directly measured the lo- cal structure of U in the sorption samples using X-ray absorption spectroscopy (XAS). This in s i tu probe of local atomic and electronic structure demonstrated considerable value to study surface sorption on min- erals (Brown, 1990). XAS measurements are inher- ently element specific due to the characteristic binding energies of core electrons. The ability to obtain struc- tural information only in the neighborhood of the el- ement of interest allows the study of dilute species in a complex hydrated matrix. XAS is commonly divided into two overlapping techniques: X-ray absorption near-edge structure (XANES) and extended X-ray ab- sorption fine structure (EXAFS). XANES focuses on spectral details at X-ray energies near the ionization threshold for a given core electron, providing infor- mation on site symmetry and oxidation state. By using X-ray energies 50-1500 eV above the ionization threshold, EXAFS extracts bonding information for
the first few atomic shells around the target element, including coordination numbers and interatomic dis- tances. EXAFS was previously used to probe the local structure of U bound to several different mineral sur- faces (Dent et aL, 1992; Chisholm-Brause et al. , 1994; Waite et al. , 1994). Some of those results are discussed below.
The XAS studies described in this paper include the application of U EXAFS to powder samples, and spe- cialized XANES measurements, which characterize the orientation of uranyl groups in layered structures. If mineral sorption samples can be created with a known macroscopic orientation of the crystal lattice, the polarization dependence of uranium L~- and L 3- edge XANES spectra can be exploited to characterize the molecular orientation of entrained uranyl species. In the present experiments, layered mineral structures were exposed to uranyl under conditions which favor extensive interlamellar ion-exchange. By comparing XANES spectra measured with the x-ray plane polar- ization vector either parallel or perpendicular to the structural layers, we have characterized the orientation of the uranyl cation with respect to the structural lay- ers. To our knowledge, this is the first application of polarization-dependent XANES to the study of uranyl sorption. In fact, one purpose of the present work is to introduce polarization-dependent XANES as a unique probe of uranyl orientation in mineral samples. Another goal of this study is to better establish EXAFS as a probe of uranyl sorption chemistry.
Expandable phyllosilicate minerals were selected for sorption experiments. Vermiculite and a regularly interstratified biotite-vermiculite, hydrobiotite, were used both with and without modification. These min- erals are available in large homogeneous crystals, al- lowing the production of powders with specific size fractions and with uniform composition. Furthermore, slices from these crystals provided oriented samples for the polarization-dependent XANES measurements. Structural changes in these minerals are easily fol- lowed by X-ray diffraction (XRD) measurements of the basal-plane interlayer spacing, d(001).
Apart from its immediate significance in the area of U migration, the present work is also relevant to other environmentally hazardous actinides, such as neptu- nium, plutonium, and americium. The uranyl cation provides a direct analog for other actinyl species, e.g. ,
PuO22§ and PuO2 +, but with a significantly simplified redox chemistry. Furthermore, the XAS tools devel- oped here for uranyl are applicable to other actinyl species. From a practical standpoint, the natural iso- topes of U are much easier to handle than the available isotopes of these other actinides, which are highly ra- dioactive. This provides additional motivation to de- velop a detailed understanding of U sorption as a basis for much more challenging experiments on other ac- tinides.
Vol. 47, No. 4, 1999 U 6+ sorption complexes on vermiculite and hydrobiotite 441
MATERIALS AND METHODS
Mineral preparation
Vermiculite (Sanford, North Carolina) was obtained from Ward's Natural Science Establishment, Roches- ter, New York, USA, and hydrobiotite (labeled as "vermiculi te" , Palabora open pit, Phalaborwa, Trans- vaal, Republic of South Africa) was obtained from Mineralogical Research Co., San Jose, California, USA. The sorption experiments used two different size fractions of the ground minerals, as well as slices cut from the best parts of the samples. Portions of each mineral were ground in an alumina shatterbox, in con- tact with deionized water. Fractions with particle sizes <45 fxm and from 45 to 250 Ixm were separated by wet sieving. Thin slices, --1.2 • 0.8 X 0.1 cm, were cut and lightly polished from epoxy-mounted crystals of each mineral. The large faces are perpendicular to the (001) cleavage plane. This provided a sufficiently large sample with a well-defined orientation for use in the angle-dependent XAS experiments.
To adjust the accessibility of interlayer-cation ex- change sites, portions of each mineral were treated to replace the exchangeable cations. Starting with the 45- 250/zm size fractions, Li+-exchanged vermiculite and hydrobiotite samples were prepared by three succes- sive treatments with 1.0 M LiC1 at 60~ The slices were also Li+-exchanged using a similar process at room temperature. The <45 p~m size fractions were used to prepare K+-exchanged vermiculite and hydro- biotite. The minerals were treated twice with 0.1 M KC1, once at 65~ and again at room temperature, and then baked at 220~ for 5 b. Dried samples of the unmodified minerals were also prepared, using the 45 - 250 Ixm size fractions, by storing for one day in a vacuum desiccator at room temperature. These sam- ples were maintained under argon gas and double- sealed in 0.10 mm polyethylene (PE) bags, along with anhydrous C a S t 4 desiccant in each bag.
Mineral characterization
Specific surface areas of the minerals, after grind- ing, were measured by BET analysis, using nitrogen gas adsorption in a Micromeritics Instrument Corp. system, model ASAP 2000. The qualitative elemental compositions of the minerals were determined from X- ray fluorescence spectra. Spectra were measured using a Hitachi Model S-800 Scanning Electron Microscope with a 25 kV beam energy and a Kevex 8000 Energy Dispersive Spectroscopy (EDS) system with a Quan- tum window.
The cation exchange capacity (CEC) was measured by initially loading the mineral exchange sites with Na § and then removing the Na § by exchanging with Mg 2§ Half-gram portions of finely ground mineral (<45 p~m) were treated with a 1.0 M NaC1 solution, rinsed with a 0.010 M NaC1 solution, and then treated
with a 0.50 M MgC12 solution, Each treatment com- prised shaking the mineral with three successive 45- mL aliquots of the solution for >2 h. The MgC12 so- lutions were combined and analyzed to determine the amount of Na § released. The concentration of Na § was measured by inductively coupled plasma atomic emis- sion spectroscopy (ICP-AES), using a Fisons Instru- ments/Applied Research Laboratories Model 3560B ICP Analyzer with an Optical Emission Spectroscopy Direct Reader. Duplicate analyses for each mineral gave results which agreed within the expected uncer- tainty ranges.
Preparation of uranium-mineral sanwles
Uranium-mineral sorption samples were prepared by exposing the minerals to aqueous solutions of ura- nyl. All chemicals used were reagent grade. A Milli- Q Reagent Water System from Millipore Corp. pro- vided deionized (DI) water with a resistivity >14 MO cm. Samples were prepared in air at room temperature and no special measures were taken to exclude carbon dioxide. Solution pH values were measured using an Orion 8103 Ross combination electrode and an Orion Research 601A Digital Ionanalyzer pH meter.
Details about each U sorption sample are given in Table 1. The mineral mass was 100 mg for each sam- ple, except for the --200 mg oriented slices, V-OR and HB-OR. The -IE2, -IE3, -SC, and -SCK samples were prepared as follows. The volume of the exposure so- lution was 0.500 L. After 4 d stirring in high density PE bottles, the solid phase was separated by filtration, rinsed with 200 mL DI water, and packaged for XAS analysis without drying. Uptake of U by the mineral was determined by measuring the U concentration in solution before and after treatment. Uranium concen- trations were determined by ICP-AES and/or by ICP- mass spectroscopy using a Fisons Instruments Model PQ1 1CP-MS.
Samples V-IE1, HB-IE1, V-OR, and HB-OR, were treated differently. For the -IE1 samples, the exposure volume was 40 mL, whereas the -OR pair used 15 mL. To maximize the loading of uranyl onto ion-exchange sites, these four samples were exposed to three suc- cessive aliquots of their stock solutions. A large mass action effect is achieved through the combination of relatively high uranyl concentrations and multiple ex- posures, In addition, the Li+-exchanged minerals were used for these samples because the monovalent Li + is more easily displaced than the natural divalent Mg 2+ interlayer cation. These treatments were performed in polypropylene centrifuge cones. The minerals were shaken 1-4 d with each aliquot and the solid phase was separated by filtration, centrifugation and/or de- canting, Samples were rinsed twice with 40 mL of DI water and packaged for XAS analysis without drying.
After initial XAS analysis, samples V-IE1, HB-IE1, and V-OR were aged 3 mo and then dried overnight
442 Hudson et al.
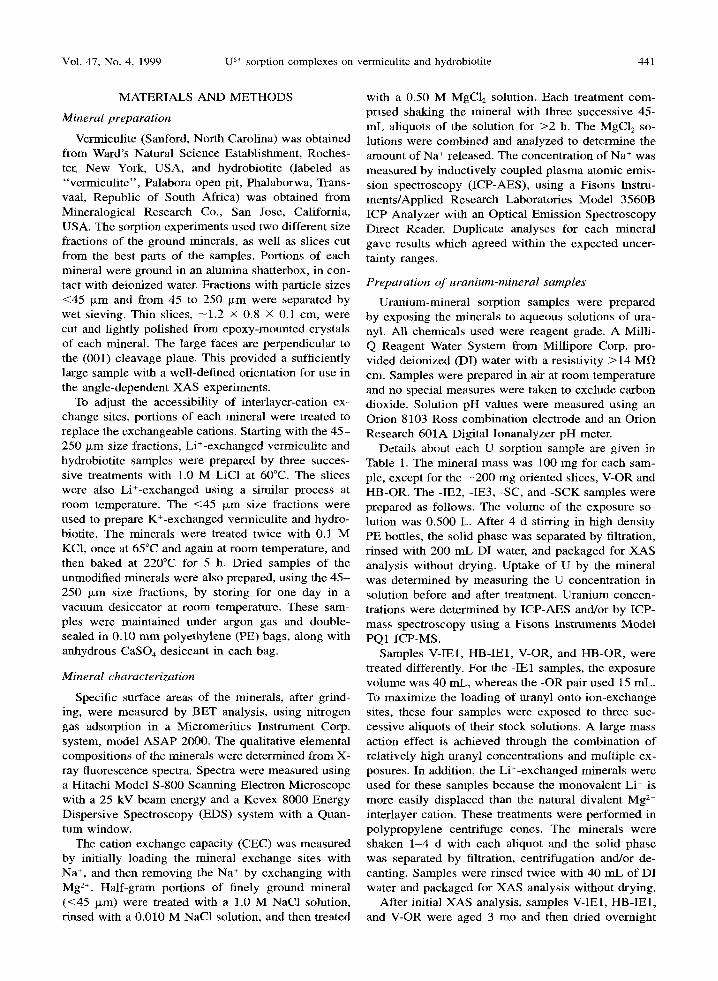
Table 1. Summary of U sorption samples.
Clays and Clay Minerals
Mineral Initial [UO2 2+] Initial Final Additional Uptake Sample I (size fraction) (counter-ion) pH pH electrolyte of U Description
V-IE12 Li+-exchanged 1.7 • l0 2 M 2.6 - - Uranyl ion exchange, vermiculite (NO3) large mass action, (45-250 ~m) monovalent cation
HB-IE13 Li+-exchanged 1.7 • 10 2 M 2.6 - - Uranyl ion exchange, hydrobiotite (NO 3 ) large mass action, (45-250 Ixm) monovalent cation
V-IE2 Vermiculite 9.2 x 10 4 M 2.0 1.8 - - 9.5% Uranyl ion exchange (45 250 ixm) (NO 3 )
HB-IE2 Hydrobiotite 9.2 )< 10 ..4 M 2.0 1.8 - - 11.4% Uranyl ion exchange (45-250 ~m) (NO 3 )
V-IE3 Vermiculite 1.1 • 10 4 M 2.4 2.5 - - 3.6% Uranyl ion exchange, (<45 txm) (C1) low loading
HB-IE3 Hydrobiotite 1.1 x l0 4M 2.5 2.6 2.7% Uranyl ion exchange, (<45 txm) (C1) low loading
V-SC Vermiculite 3.2 • 10 6 M 6.5 6.9 5.0 • 10 4 M 77.6% Promote surface (<45 o,m) (C1) MgC12 complexation
HB-SC Hydrobiotite 3.2 • 10 6 M 6.5 7.1 5.0 • 10 4 M 53.9% Promote surface (<45 p.m) (C1) MgCI2 complexation
V-SCK K+-exchanged 2.8 • 10 6 M 6.5 7.5 1.0 • l0 3 M 33.0% Promote surface vermiculite (C1) KC1 complexation, partly (<45 Fxm) collapsed interlayer
HB-SCK K+-exchanged 2.8 • 10 6 M 6.5 7.7 1.0 • 10 3 M 62.8% Promote surface hydrobiotite (C1) KC1 complexation, (<45 txm) collapsed interlayer
V-OR 4 Li+-exchanged 1.7 • 10 2 M 2.6 - - - - Uranyl ion exchange, vermiculite (NO 3 ) large mass action, (oriented slice) monovalent cation
HB-OR Li+-exchanged 1.7 • 10 2 M 2.6 - - Uranyl ion exchange, hydrobiotite (NO 3 ) large mass action, (oriented slice) monovalent cation
V- refers to vermiculite, HB- refers to hydrobiotite; -IE refers to ion-exchange samples, -SC refers to surface complexation samples.
2 Dehydrated sample is V-IE1-D. 3 Dehydrated sample is HB-IE1-D. 4 Dehydrated sample is V-OR-D.
in a vacuum desiccator at room temperature and re- packaged under argon gas. These dry samples, referred to here as V-IE1-D, HB-IE1-D, and V-OR-D, respec- tively, were again analyzed by XAS.
X-ray di f f ract ion
X R D patterns were measured using a Cu-anode
Scintag P A D - V powde r X-ray diffract ion sys tem with a Kevex Psi Pel t ier -cooled SiLi X-ray detector, gated to accept only CuKcx radiation. Because the d(001) value was important , mos t samples were spread onto a stainless steel plate to enhance the horizontal ori- entation o f platelets and thus the (00/) reflections. Dried samples were examined in double-sea led PE
bags.
Predic t ion o f u ran ium spec ia t ion
The speciat ion of the uranyl ion in solut ion may influence the sorpt ion mechanism. This speciat ion is predic ted f rom known, and most ly control lable, ex- per imental parameters , by using the E Q 3 N R geochem-
ical mode l ing p rogram with the G E M B O C H S ther- m o d y n a m i c database (version R16), both deve loped at Lawrence L ivermore National Laboratory. These ther- m o d y n a m i c parameters are based, in part, upon a crit- ical compi la t ion of U constants by Grenthe et al. (1992). The format ion constant Kf for the neutral hy- drolysis product UOz(OH)2 (aq) is one of several im- portant in predict ing U speciat ion at near-neutral pH.
H o w e v e r Grenthe et al. r e c o m m e n d e d only a l imit ing value, log Kf < - 1 0 . 3 , for this species. Therefore the predic t ions are based on two sets o f c a l c u l a t i o n s - - o n e assuming this l imit ing value for log Kf (as in the G E M - B O C H S database) and another using the value log K t. = - 1 2 , g iven by Lemi re and Tremaine (1980).
Table 2 shows U speciat ion predic t ions for selected condit ions, representa t ive of the solutions used here for sample preparat ion. Calculat ions used parameters for 25~ for compar i son to exper iments pe r fo rmed at room tempera ture ( - 2 0 ~ Carbonate and bicarbonate concent ra t ions were de te rmined by assuming equil ib- r ium with air. The background electrolyte (KC1 or
Vol. 47, No. 4, 1999 U 6+ sorption complexes on vermiculite and hydrobiotite 443
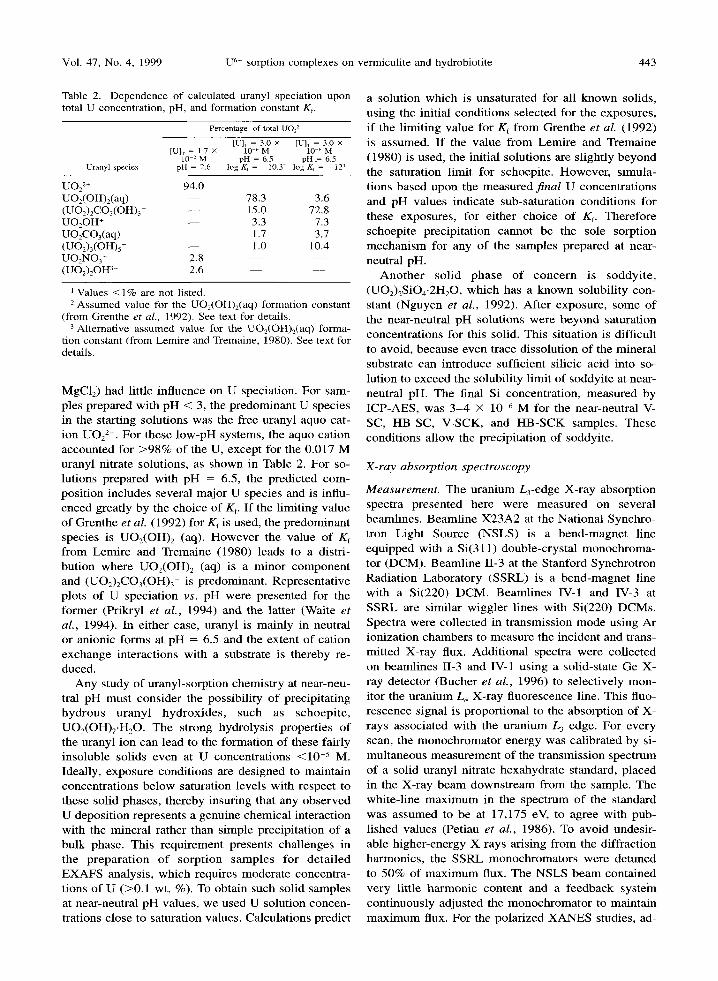
Table 2. Dependence of calculated uranyl speciation upon total U concentration, pH, and formation constant Kf.
U r a n y l spec ie s
P e r c e n t a g e t o f to ta l U O 2 2+
[U]-r - 3 . 0 • [U], r = 3 .0 • [U]w = 1.7 • 10 6 M 10 ~ M
10 2 M p H - 6 .5 p H , - 6 .5 p H - 2 .6 l o g K r - 10.3 ~ l og Kf - - 1 2 ~
U022+ 94.0 UO2(OH)2(aq) - - 78.3 3.6 (UO2)2CO3(OH)3 - - 15.0 72.8 UOzOH ~ - - 3.3 7.3 UO2CO3(aq) - - 1.7 3.7 (UO2)3(OH)5 + - - 1.0 10.4 U O 2 N O 3 + 2.8 - - - - ( U O 2 ) 2 O H 3~ 2.6 - - - -
i Values <1% are not listed. 2 Assumed value for the UO2(OH)a(a q) formation constant
(from Grenthe et al., 1992). See text for details. 3 Alternative assumed value for the UO2(OH)2(aq) forma-
tion constant (from Lemire and Tremaine, 1980). See text for details.
MgC12) had little influence on U speciation. For sam- ples prepared with pH < 3, the predominant U species in the starting solutions was the free uranyl aquo cat- ion U O f +. For these low-pH systems, the aquo cation accounted for > 9 8 % of the U, except for the 0.017 M uranyl nitrate solutions, as shown in Table 2. For so- lutions prepared with pH = 6.5, the predicted com- posit ion includes several major U species and is influ- enced greatly by the choice of Kf. If the l imit ing value o f Grenthe et al. (1992) for Kf is used, the predominant species is UO2(OH)2 (aq). Howeve r the value of Kt. f rom Lemire and Tremaine (1980) leads to a distri- bution where UO2(OH) 2 (aq) is a minor component and ( U O 2 ) 2 C O 3 ( O H ) 3 - is predominant. Representat ive plots of U speciation vs. pH were presented for the former (Prikryl et al., 1994) and the latter (Waite et al., 1994). In either case, uranyl is mainly in neutral or anionic forms at pH = 6.5 and the extent of cation exchange interactions with a substrate is thereby re- duced.
Any study of uranyl-sorption chemis t ry at near-neu- tral pH must consider the possibil i ty of precipitat ing hydrous u rany l hydrox ides , such as schoepi te , UO2(OH)2.H20. The strong hydrolysis properties of the uranyl ion can lead to the format ion of these fairly insoluble solids even at U concentrat ions < 1 0 -5 M. Ideally, exposure condit ions are designed to maintain concentrat ions be low saturation levels with respect to these solid phases, thereby insuring that any observed U deposi t ion represents a genuine chemical interaction with the mineral rather than simple precipitat ion of a bulk phase. This requirement presents chal lenges in the prepara t ion o f sorp t ion samples for de ta i led E X A F S analysis, which requires moderate concentra- tions of U (>0.1 wt. %). To obtain such solid samples at near-neutral pH values, we used U solution concen- trations close to saturation values. Calculat ions predict
a solution which is unsaturated for all known solids, using the initial condit ions selected for the exposures, i f the l imit ing value for Kf f rom Grenthe et al. (1992) is assumed. I f the value f rom Lemire and Tremaine (1980) is used, the initial solutions are slightly beyond the saturation l imit for schoepite. However , s imula- tions based upon the measured f i na l U concentrat ions and pH values indicate sub-saturation condit ions for these exposures, for either choice of Kf. Therefore schoepite precipitat ion cannot be the sole sorption mechan i sm for any of the samples prepared at near- neutral pH.
Ano the r sol id phase o f conce rn is soddyi te , (UO2)zSiO4.2H20, which has a known solubil i ty con- stant (Nguyen et al., 1992). Af ter exposure, some of the near-neutral pH solutions were beyond saturation concentrat ions for this solid. This situation is difficult to avoid, because even trace dissolut ion o f the mineral substrate can introduce sufficient silicic acid into so- lution to exceed the solubil i ty l imit of soddyite at near- neutral pH. The final Si concentrat ion, measured by ICP-AES, was 3 - 4 • 10 -6 M for the near-neutral V- SC, HB-SC, V-SCK, and H B - S C K samples. These condit ions al low the precipi tat ion of soddyite.
X - r a y absorp t ion spec t roscopy
M e a s u r e m e n t . The uranium L3-edge X-ray absorption spectra presented here were measured on several beamlines. Beaml ine X23A2 at the Nat ional Synchro- tron Light Source (NSLS) is a bend-magnet line equipped with a Si(311) double-crysta l monochroma- tot (DCM). Beaml ine II-3 at the Stanford Synchrotron Radiat ion Laboratory (SSRL) is a bend-magnet line with a Si(220) DCM. Beaml ines IV-I and IV-3 at S S R L are similar wiggler l ines with Si(220) DCMs. Spectra were col lected in t ransmission mode using Ar ionizat ion chambers to measure the incident and trans- mit ted X-ray flux. Addi t ional spectra were col lected on beamlines II-3 and IV-1 using a solid-state Ge X- ray detector (Bucher et al., 1996) to se lect ively mon- itor the uranium L~ X-ray f luorescence line. This fluo- rescence signal is proport ional to the absorption of X- rays associated with the uranium L3 edge. For every scan, the monochromato r energy was cal ibrated by si- mul taneous measurement of the t ransmission spectrum of a solid uranyl nitrate hexahydrate standard, p laced in the X-ray beam downs t ream from the sample. The white- l ine m a x i m u m in the spectrum of the standard was assumed to be at 17,175 eV, to agree with pub- l ished values (Petiau et al., 1986). To avoid undesir- able higher-energy X-rays arising f rom the diffract ion harmonics, the S S R L monochromators were detuned to 50% of m a x i m u m flux. The N S L S b e a m contained very little harmonic content and a feedback system cont inuously adjusted the monochromato r to maintain m a x i m u m flux. For the polar ized X A N E S studies, ad-
444 Hudson et al. Clays and Clay Minerals
ditional spectra were col lected in transmission mode at the uranium L1 edge.
Powder samples were mounted in 1.5-mm thick PE holders with 17 • 2 m m slots, and held in place with 0.08 m m Mylar tape. The holders were oriented at 45 ~ to the incident beam, al lowing the simultaneous mea- surement o f f luorescence and transmission spectra. For these samples, the beam size was typically 9 • 1 mm. For polar izat ion-dependent measurements , the thin mineral slices were mounted normal to the beam. For these samples, spectra were col lected in t ransmission mode with a beam size of typically 3 • 0.5 ram. All samples were double-sealed in 0.05 m m PE bags for safety purposes. Dried samples were double-sealed in 0.10-ram PE bags and packaged with anhydrous C a S t 4 desiccant in each bag to min imize the penetra- tion of ambient humidity. E X A F S data were also col- lected for a l iquid sample of 0.05 M U O z ( N O 3 ) 2 at pH = 2. Under these conditions, the uranyl speciat ion is predicted to be 92% UO22+ and 6% UO2NO3 +.
D a t a ana lys i s . EXAFS. The reduct ion and analysis of E X A F S data fo l lowed standard practices, using the E X A F S P A K software suite developed at S S R L by G. George and I. Picketing. Osci l la tory x(k) curves were calculated f rom the mesured spectra assuming an ion- ization potential E0 = 17,181 eV. Structural parameters were extracted f rom the data by l e a s t - s q u a r e s fitting of the U-weigh ted x(k) curves. For the transmission- mode data, the fitted range of k-values was 3-16.5 A i (3-13.5 ,~ ~ for the aqueous sample). For the fluores- cence-mode data, the range was 3-13 or 14 ,~-~. The fitting mode l included at least two coordinat ion shells o f O atoms and, in some cases, a single shell o f U atoms. Photoelectron scattering ampli tudes and phase shifts were calculated using the F E F F 6 code (Rehr et al. , 1991). This ab in i t io source of scattering param- eters was successfully applied to uranium L3 E X A F S (Waite et al. , 1994; Al len et al. , 1995, 1996a, 1996b; Hudson e t aL, 1996) and X A N E S (Hudson et al. , 1995, 1996). The model compound for the calculat ion w a s ( ~ - U O z ( O H ) 2 , using atomic coordinates deter- mined by X R D (Taylor, 1971). The axial O atoms of the uranyl cat ion have different scattering parameters compared to those of the equatorial O atoms. Mult iple- scattering (MS) of the photoelectron within the linear uranyl cat ion influences the E X A F S (Hudson et al. , 1996). Contributions f rom the m o s t important MS path, as determined by F E F F 6, were included in the fits, with the effect ive bond distance and Debye-Wal ler (DW) factor both fixed at twice the single-scattering values (i.e., f rom the axial O shell).
The equatorial atoms around the uranyl cation were assumed to be O, representing possible l igat ion by wa- ter, hydroxide, carbonate, and/or surface O atoms. All data sets were fit twice, by assuming either one or two shells of equatorial O atoms, each with adjustable pa-
rameters. An important quali tat ive result o f this anal- ysis is to determine i f two equatorial shells are re- quired to best fit a g iven data set. Due to fundamental l imitations, two distinct equatorial shells can be iden- tified only if their U - O bond distances differ by more than the inherent distance resolut ion of the measure- ment. For our E X A F S results, this resolution ranges f rom 0.095 to 0.12 ,~, depending on the range o f k measured. Smal ler differences (splittings) within the equatorial shell cannot be observed directly, al though they may become apparent by an increased D W factor, 0 -2"
Fits using two equatorial shells which gave apparent splittings less than the resolut ion were rejected as not physical ly reasonable. As ide f rom this restriction, the results based upon the fit with the smaller reduced er- ror are reported here. Note that the reduced error ac- counts for the introduction of additional adjustable pa- rameters in the fits with two equatorial shells. For all data sets, the statistical indicat ion of a better fit was accompanied by a discernible improvement in the agreement be tween fit and experiment.
Ident ifying the presence and degree o f splitting in the equatorial shell is one o f the most useful results of this E X A F S analysis. Such distortions are sensi t ive indicators of the chemica l interaction be tween uranyl and the mineral substrate. For example, a split equa- torial shell was identified, using E X A F S , for the case of uranyl inner-sphere surface complexat ion by ferri- hydrite (Waite e t al. , 1994). In that study, the proposed structure was conf i rmed by identifying a neighbor ing iron atom at the expected distance. Further ev idence for an inner-sphere mechan i sm came f rom the appli- cation of a surface complexa t ion mode l to extens ive uptake data.
E X A F S features which are indicat ive of U scatterers were observed for several samples. Fits of possible U features were only undertaken i f the corresponding Fourier t ransform (FT) peak was above the noise level measured at h igher R + A. The identity of the U scat- terer was first conf i rmed by back-t ransforming the peak and fitting this Fourier-fi l tered exper imental E X A F S with calculated U parameters. Good agree- ment was obtained using reasonable values for the U fitting parameters, whereas much poorer agreement and/or unreasonable results were obtained when oxy- gen or si l icon scattering parameters were used.
Because E0 is c losely correlated with interatomic distance R in the fits, the hE0 values for all oxygen shells were fixed at 0 eV. This was very close to the op t imum value for most samples. This restriction, which is reasonable for systems with similar chemis- try, enhances the significance of trends in the der ived bond distances. AE 0 was a l lowed to vary for the U scatterers. Note that the coordinat ion number, N, is c losely correlated to the D W factor, and therefore
Vol. 47, No. 4, 1999 U 6+ sorption complexes on vermiculite and hydrobiotite 445
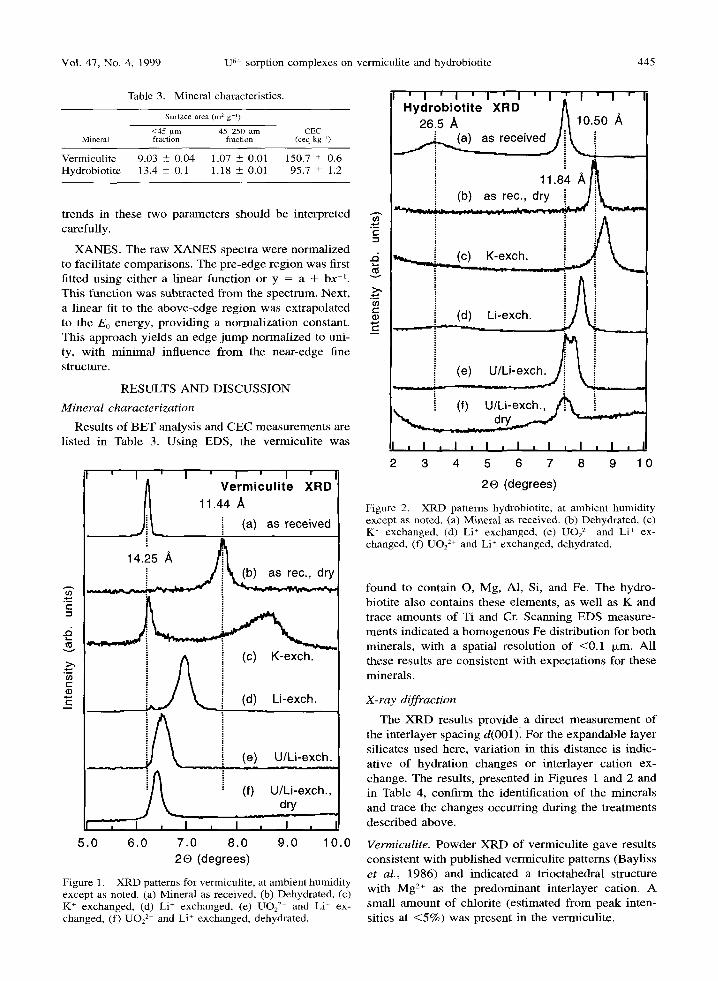
Table 3. Mineral characteristics.
Surface area (rn 2 g ')
<45 Ixm 45 250 Ixm CEC Mineral fraction fraction (ceq kg ')
Vermiculite 9.03 • 0.04 1.07 • 0.01 150.7 + 0.6 Hydrobiotite 13.4 • 0,1 1.18 • 0.0l 95.7 § 1.2
t rends in these two pa ramete r s shou ld be in te rpre ted carefully.
X A N E S . The raw X A N E S spect ra were no rma l i zed to faci l i ta te compar i sons . The p re -edge reg ion was first fit ted us ing e i ther a l inear func t ion or y = a + bx ~. Th i s func t ion was sub t rac ted f r o m the spect rum. Next , a l inear fit to the above -edge reg ion was ex t rapola ted to the E0 energy, p rov id ing a no rma l i za t i on constant . This approach yields an edge j u m p n o r m a l i z e d to uni- ty, wi th m i n i m a l inf luence f rom the near -edge fine structure.
R E S U L T S A N D D I S C U S S I O N
Mineral characterization
Resul ts of B E T analys is and C E C m e a s u r e m e n t s are l is ted in Table 3. Us ing EDS, the ve rmicu l i t e was
' I . I ' I ' I ' % V e r m i c u l i t e X R D
11.44 A
(a) as received
14.~25 A
/ ~ (c) K-exch.
J \ l=
(d) Li-exch.
i . . . .
i /e)U/Li-e,ch. I ~ (f) U/Li-exch.,
dry
I -t i-- , I ,
5.0 6.0 7.0 8.0 9.0 10.0 2e (degrees)
Figure 1. XRD patterns for vermiculite, at ambient humidity except as noted. (a) Mineral as received, (b) Dehydrated, (c) K + exchanged, (d) Li + exchanged, (e) UO2 2+ and Li + ex- changed, (f) UO2 2+ and Li + exchanged, dehydrated.
I ' I ' I ' i ' I ' I ' I ' I ' I H y d r o b i o t i t e X R D
I 26 5 A / A 1 0 . 5 0 A i �9 !
,,:4 4 (b) as rec., dry i J i k_ _
r
�9 ,,,~.,..._!._ (c) K-exch. ~ , j
i (d) Li-exch. i i
. . . . ._ (e)_ U/Li-ex_c
~ . . (f) U/Li-exch., & i _ ~ ]
2 3 4 5 6 7 8 9 10 2e (degrees)
Figure 2. XRD patterns hydrobiotite, at ambient humidity except as noted. (a) Mineral as received. (b) Dehydrated, (c) K + exchanged, (d) Li ~ exchanged, (e) UO~ 2+ and Li + ex- changed, (f) UO2 2+ and Li + exchanged, dehydrated.
f ound to con ta in O, Mg, A1, Si, and Fe. The hydro- biot i te also con ta ins these e lements , as wel l as K and t race amoun t s of Ti and Cr. Scann ing EDS measu re - men t s ind ica ted a h o m o g e n o u s Fe d i s t r ibu t ion for b o t h minera ls , wi th a spat ia l reso lu t ion o f <0 .1 Ixm. Al l these resul ts are cons i s ten t wi th expec ta t ions for these minera ls .
X-ray diffraction
The X R D resul ts p rov ide a direct m e a s u r e m e n t of the in te r layer spac ing d(001) . For the e x p a n d a b l e layer si l icates used here, var ia t ion in this d i s tance is indic- a t ive o f hydra t ion changes or in te r layer ca t ion ex- change . The results , p resen ted in F igures 1 and 2 and in Table 4, con f i rm the ident i f ica t ion of the minera l s and t race the changes occurr ing dur ing the t r ea tmen t s desc r ibed above .
Vermiculite. P o w d e r X R D of ve rmicu l i t e gave resul ts cons i s t en t wi th pub l i shed vermicu l i t e pa t t e rns (Bayl i ss et al., 1986) and ind ica ted a t r ioc tahedra l s t ructure wi th M g 2§ as the p r e d o m i n a n t in te r layer cat ion. A smal l a m o u n t o f ch lor i te (es t imated f rom peak in ten- sit ies at < 5 % ) was p resen t in the vermicul i te .

446 Hudson et al. Clays and Clay MineraL~
Table 4. Measured XRD spacings.
d(O01) (A)~
Treatment Vermiculite Hydrobiotite 2
as received 14.25 27, 11.82, 8.39, 4.92, 3.47, 3.10, 2.69
1 = 1 , 2 , 3 , 5 , 7 , 8 , 9 as received, dried 11.41 I0.53, (7.05), (5.27),
4.11, 3.41, 3.11, 2.67
l - 2, 3,4,5, 6, 7, 8 K+-exchanged 14.18, 10.2 10.1, 5.02, 3.37, 2.52
I = 1 , 2 , 3 , 4 Li+-exchanged (14.09), 12.73 24, 11.06, 5.48, 3.62,
3.20, 2.74, (2.48) / - 1 , 2 , 4 , 6 , 7 , 8 , 9
U/Li+-exchanged 3 13.63 20.5, 11.81, 11.39, 8.02, 7.70, 4.80, 3.45, 3.05, 2.70
l = 1, 2a, 2b, 3a, 3b, 5a, 7a, 8a, 9a 4
U/Li+-exchanged, 13.82 11.88 dried 5 1 = 2
1 Spacings corresponding to peaks of very low intensity are in parenthesis.
2 The most likely assignment of diffraction order l is listed for each peak.
3 Sorption samples V-IE1 and HB-IEI. 4 These spacings are assigned to two distinct phases, de-
noted by a and b. 5 Sorption samples V-IEI-D and HB-IE1-D.
The d(001)-value for vermiculite (Figure 1) ranges from --10 to 15 A, reflecting changes to the interlayer under various conditions. The untreated vermiculite at ambient humidity has a 14.25-,~ spacing, indicative of two water layers in the interlamellar region. For the dried vermiculite, which was not baked, the observed 11.4-A spacing indicates a single-water-layer structure. The high background in this pattern apparently ob- scures the chlorite impurity (001) peak at --14.1 * . K+-exchanged vermiculite shows a broad peak at 10.2 A, indicative of a collapsed interlayer, i.e., a nonhy- drated mica-like structure. The 14.2-A peak persists with considerable intensity, presumably as a result of incomplete K+-exchange and/or collapse. The consid- erable asymmetry of the 10.2-A peak indicates random interstratification of the two spacings. The Li+-vermic - ulite, measured at ambient humidity, has a d(001)-val- ue of 12.7 ,~. In samples saturated with DI water, not shown, this peak nearly disappears and a 14.4-]k peak appears. In dried samples, not shown, the 12.7-,~ peak is replaced by a peak at 11.7 A. These changes with hydration are similar to MacEwan and Wilson (1980).
Sample V-IE1 was prepared by treating Li+-ex - changed vermiculite with uranyl. The XRD results show that uranyl exchange expands the 12.7-A spacing to 13.6 ,~. This is less than the 14.5-A d(001)-value observed for a uranyl-exchanged montmoril lonite (Tsunashima et al., 1981). The 13.6-A spacing is also
smaller than the 14.25-A spacing observed for untreat- ed vermiculite under similar hydration conditions. These comparisons show that the UO22+ is not behav- ing as a divalent metal cation. After drying the uranyl/ Li+-vermiculite to obtain sample V-IE1D, the interlay- er spacing is essentially unchanged, indicating that wa- ter is more tightly bound in the uranyl/Li+-vermiculite or that the large uranyl cation is hindering reduction of the interlayer. These possibilities are discussed be- low along with EXAFS and polarized XANES results.
Hydrobiot i te . XRD of untreated hydrobiotite showed a d(001)-value of - 2 7 A and higher-order reflections with spacings and intensities characteristic of regular interstratification (Sawhney, 1967). The pattern resem- bles that of a Transvaal hydrobiotite (Brindley et at., 1983), with d(001) larger than expected and d(002) somewhat smaller. These comparisons, and the ab- sence of -10- ,~ and - 1 5 - A peaks, indicate that the hydrobiotite used here has almost equal amounts of interstratified biotite and vermiculite layers.
Figure 2 shows results of hydrobiotite exchange re- actions that are complicated by the regular interstrat- ification of the layers. The d(001)-value ranges from --20 to --27 * and represents the distance between pairs of biotite and vermiculite layers. Because of dif- ficulties in measuring peaks accurately at low angles, and the large width of this peak, this measurement is approximate. Therefore, the much sharper (002) re- flection was used for the measurement of spacing changes. Higher-order d(001)-values are reported in Table 4.
The d(005)-value confrms that the dry hydrobiotite retained a regular interstratified structure. The (001) peak was not observed for this sample, which was double sealed in 0.10 mm PE bags, apparently due to the large attenuation of X-rays in the plastic at low angles of incidence. After K+-exchange, the pattern indicates that the vermiculite layer has collapsed and the mineral has adopted a well-ordered mica-like structure with d(001) = 10.1 ,~. The three observed higher-order reflections (Table 4) show rational spac- ings based on the 10.1-,~ peak. The absence of a peak at --20 A, and of any peaks of l = odd based on the 20-,~ peak, demonstrates that interstratification has been eliminated by the collapse of the interlayer as- sociated with the vermiculite layer. In contrast, the Li+-hydrobiotite shows both a (001) peak at 24 A and an intense (007) reflection at 3.20 A, indicating that this form is regularly interstratified.
Sample HB-IE1 was prepared by treating the Li +- hydrobiotite with uranyl. The resulting XRD pattern (Figure 2e) resolves two (002) reflections, with in- creased spacings relative to Li+-hydrobiotite, indicat- ing the presence of two phases with slightly different interlayer spacings. Higher-order peaks are also ob- served, including odd-order reflections which show
Vol. 47, No. 4, 1999 U 6+ sorption complexes on vermiculite and hydrobiotite 447
| ' 1 ' ' ' I ' ' ' I ' ' ' 1 ' ' ' I ' ' ' 1 ' ' ' 1 ' ' '
i l l l l s l , , , I , , , l , , 1 , , , I , , , I , , ,
4 6 8 1 0 1 2 1 4 1 6 k (,'h, -1)
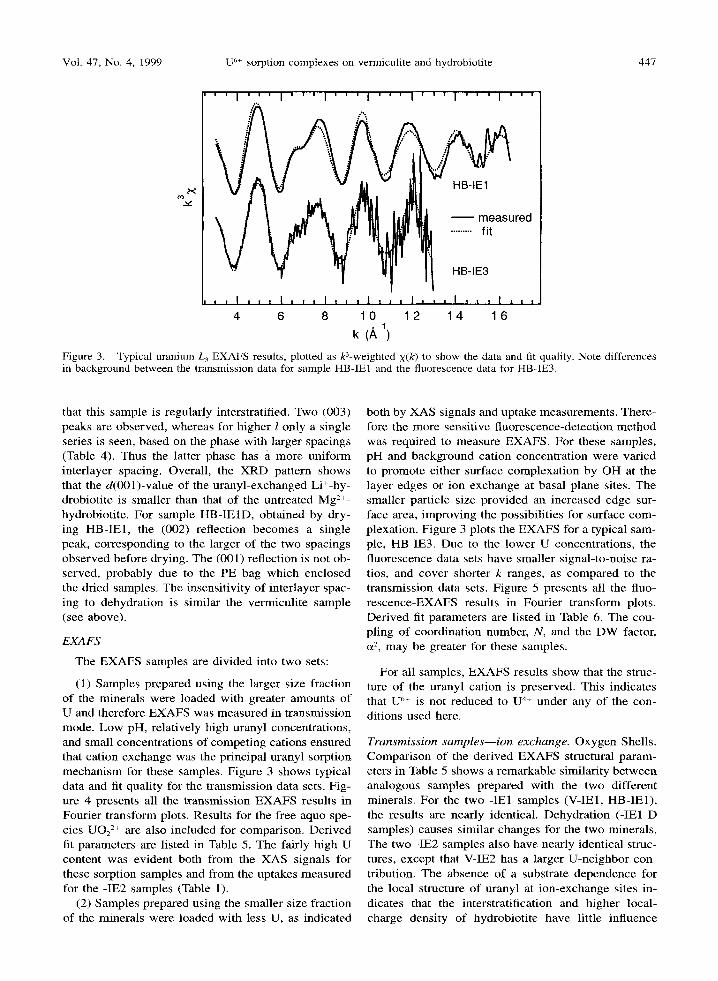
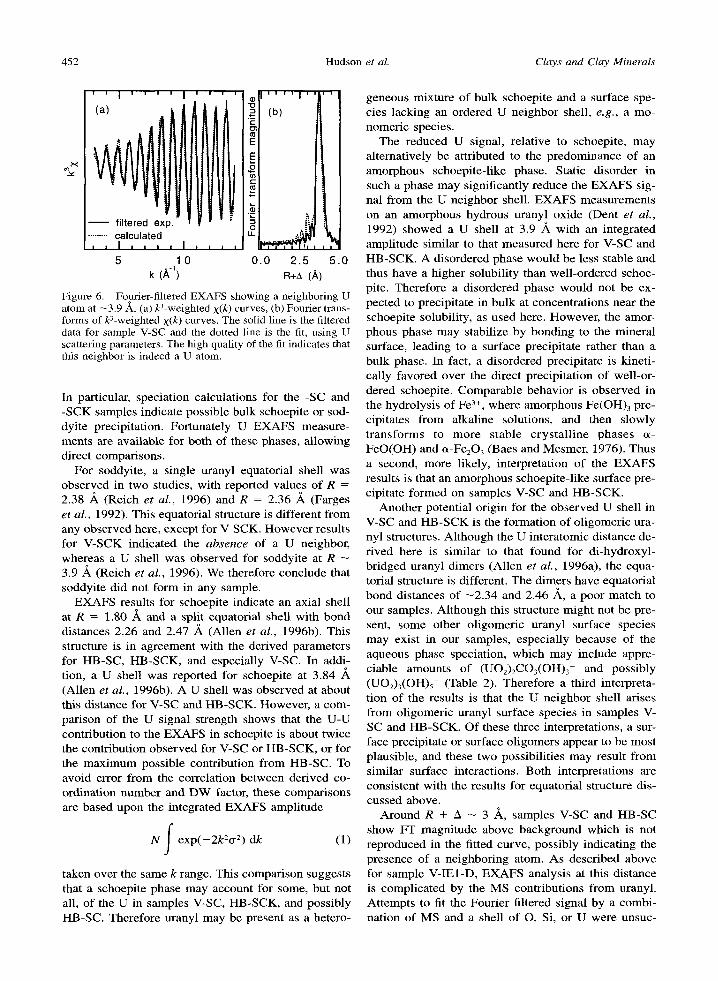
Figure 3. Typical uranium L 3 EXAFS results, plotted as k3-weighted X(k) to show the data and fit quality. Note differences in background between the transmission data for sample HB-IEI and the fluorescence data for HB-IE3.
that this sample is regularly interstratified. Two (003) peaks are observed, whereas for higher t only a single series is seen, based on the phase with larger spacings (Table 4). Thus the latter phase has /l more uniform interlayer spacing. Overall, the XRD pattern shows that the d(001)-value of the uranyl-exchanged Li+-hy - drobiotite is smaller than that of the untreated Mg 2+- hydrobiotite. For sample HB-IE1D, obtained by dry- ing HB-IE1, the (002) reflection becomes a single peak, corresponding to the larger of the two spacings observed before drying. The (001) reflection is not ob- served, probably due to the PE bag which enclosed the dried samples. The insensitivity of interlayer spac- ing to dehydration is similar the vermiculite sample (see above).
EXAFS
The EXAFS samples are divided into two sets:
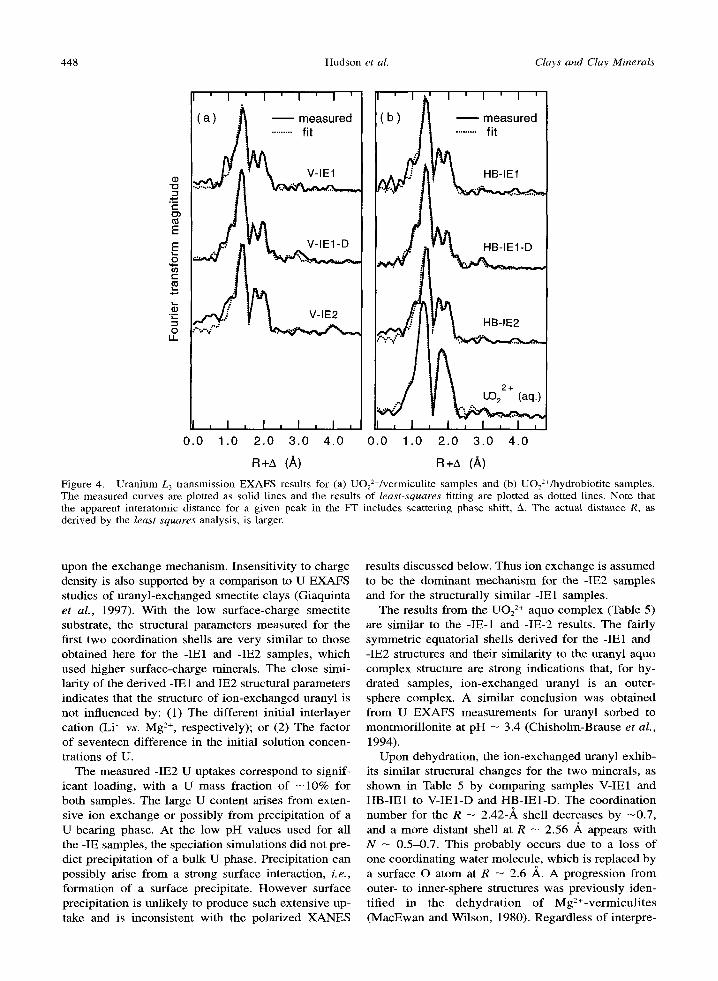
(1) Samples prepared using the larger size fraction of the minerals were loaded with greater amounts of U and therefore EXAFS was measured in transmission mode. Low pH, relatively high uranyl concentrations, and small concentrations of competing cations ensured that cation exchange was the principal uranyl sorption mechanism for these samples. Figure 3 shows typical data and fit quality for the transmission data sets. Fig- ure 4 presents all the transmission EXAFS results in Fourier transform plots. Results for the free aquo spe- cies UO22+ are also included for comparison. Derived fit parameters are listed in Table 5. The fairly high U content was evident both from the XAS signals for these sorption samples and from the uptakes measured for the -IE2 samples (Table 1).
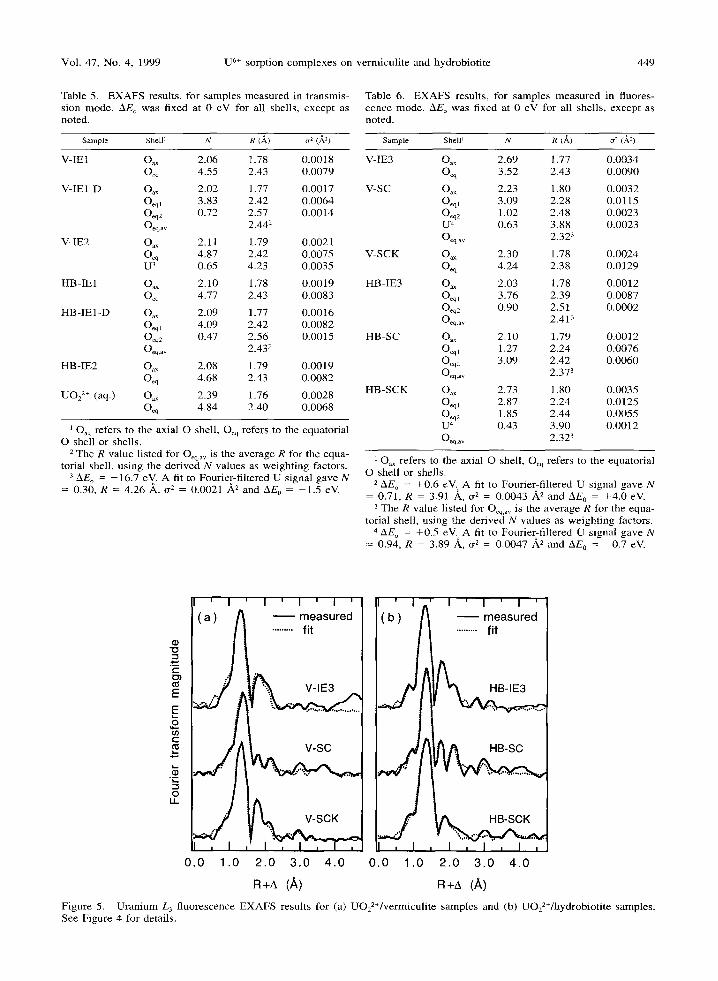
(2) Samples prepared using the smaller size fraction of the minerals were loaded with less U, as indicated
both by XAS signals and uptake measurements. There- fore the more sensitive fluorescence-detection method was required to measure EXAFS. For these samples, pH and background cation concentration were varied to promote either surface complexation by OH at the layer edges or ion exchange at basal plane sites. The smaller particle size provided an increased edge sur- face area, improving the possibilities for surface com- plexation. Figure 3 plots the EXAFS for a typical sam- ple, HB-IE3. Due to the lower U concentrations, the fluorescence data sets have smaller signal-to-noise ra- tios, and cover shorter k ranges, as compared to the transmission data sets. Figure 5 presents all the fluo- rescence-EXAFS results in Fourier transform plots. Derived fit parameters are listed in Table 6. The cou- pling of coordination number, N, and the DW factor, a2, may be greater for these samples.
For all samples, EXAFS results show that the struc- ture of the uranyl cation is preserved. This indicates that U c'+ is not reduced to U 4+ under any of the con- ditions used here.
Transmission samples--ion exchange. Oxygen Shells. Comparison of the derived EXAFS structural param- eters in Table 5 shows a remarkable similarity between analogous samples prepared with the two different minerals. For the two -IE1 samples (V-IE1, HB-IE1), the results are nearly identical. Dehydration (-IE1-D samples) causes similar changes for the two minerals. The two -IE2 samples also have nearly identical struc- tures, except that V-IE2 has a larger U-neighbor con- tribution. The absence of a substrate dependence for the local structure of uranyl at ion-exchange sites in- dicates that the interstratification and higher local- charge density of hydrobiotite have little influence
448 Hudson et al. Clays and Clay Minerals
"12
r
t ~
E
E 0
t -
. m L,_ "-a
0 1.1_
' I ' I ' I ' I '
measured ......... f i t
, I , I , I , [ i
0.0 1.0 2 .0 3 .0 4 .0 0 .0 1.0 2 .0 3 .0 4 .0
R+,5 (A) R+4 (A)
Figure 4. Uranium L 3 transmission EXAFS results for (a) UOz2+/vermiculite samples and (b) UO2 2~/hydrobiotite samples. The measured curves are plotted as solid lines and the results of least-squares fitting are plotted as dotted lines. Note that the apparent interatomic distance for a given peak in the FT includes scattering phase shift, A. The actual distance R, as derived by the least-squares analysis, is larger.
upon the exchange mechanism. Insensit ivity to charge density is also supported by a comparison to U EXAFS studies of uranyl-exchanged smecti te clays (Giaquinta et al. , 1997). With the low surface-charge smecti te substrate, the structural parameters measured for the first two coordinat ion shells are ve ry similar to those obtained here for the -1El and -IE2 samples, which used higher surface-charge minerals. The close simi- larity of the der ived -IE 1 and IE2 structural parameters indicates that the structure of ion-exchanged uranyl is not inf luenced by: (1) The different initial interlayer cation (Li + vs. Mg 2+, respectively); or (2) The factor of seventeen difference in the initial solution concen- trations of U.
The measured -IE2 U uptakes correspond to signif- icant loading, with a U mass fraction o f - 1 0 % for both samples. The large U content arises f rom exten- sive ion exchange or possibly f rom precipitat ion of a U-bear ing phase. At the low pH values used for all the -IE samples, the speciation simulations did not pre- dict precipi tat ion of a bulk U phase. Precipitat ion can possibly arise f rom a strong surface interaction, i.e., format ion of a surface precipitate. H o w e v e r surface precipitat ion is unlikely to produce such extensive up- take and is inconsistent with the polar ized X A N E S
results discussed below. Thus ion exchange is assumed to be the dominant mechan i sm for the -IE2 samples and for the structurally similar -IE1 samples.
The results f rom the UO2 > aquo complex (Table 5) are similar to the -IE-1 and -IE-2 results. The fairly symmetr ic equatorial shells der ived for the -IE1 and -IE2 structures and their similari ty to the uranyl aquo complex structure are strong indications that, for hy- drated samples, ion-exchanged uranyl is an outer- sphere complex. A similar conclus ion was obtained f rom U E X A F S measurements for uranyl sorbed to montmori l loni te at pH -- 3.4 (Chisholm-Brause et al . ,
1994). Upon dehydration, the ion-exchanged uranyl exhib-
its similar structural changes for the two minerals , as shown in Table 5 by compar ing samples V-IE1 and HB-IE1 to V-IE1-D and HB-IE1-D. The coordinat ion number for the R -- 2.42-,~ shell decreases by - 0 . 7 , and a more distant shell at R -- 2.56 A appears with N - 0.5-0.7. This probably occurs due to a loss o f one coordinat ing water molecule , which is replaced by a surface O atom at R - 2.6 ,~. A progress ion f rom outer- to inner-sphere structures was previous ly iden- t i f ied in the dehydra t ion o f Mg2+-vermicu l i t e s (MacEwan and Wilson, 1980). Regardless of interpre-
Vol. 47, No. 4, 1999 U 6+ sorption complexes on vermiculite and hydrobiotite 449
Table 5. EXAFS results, for samples measured in transmis- sion mode. AE o was fixed at 0 eV for all shells, except as noted.
Sample ShelP N R (k,) o-Z (,~2)
V-IE 1 O~ 2.06 1.78 0.0018 O~q 4.55 2.43 0.0079
V-IE1-D O~ 2.02 1.77 0,0017 O~ql 3.83 2.42 0.0064 O~q2 0.72 2.57 0.0014 Oeq,a v 2 - 4 4 2
V-IE2 O~x 2.11 1.79 0.0021 Oeq 4.87 2.42 0.0075 U 3 0.65 4.23 0.0035
HB-IE1 Oax 2.10 1.78 0.0019 Oeq 4.77 2.43 0.0083
HB-IE 1 -D Oa~ 2.09 1.77 0.0016 Oeq 1 4.09 2.42 0.0082 Oeq 2 0.47 2.56 0.0015 O~qa~ 2.432
HB-IE2 O,~ 2.08 1.79 0.0019 O~q 4.68 2.43 0.0082
UO22+ (aq.) O~ 2.39 1.76 0.0028 O~q 4.84 2.40 0.0068
O~ refers to the axial O shell, Oeq refers to the equatorial O shell or shells.
2 The R value listed for Oeq,a v is the average R for the equa- torial shell, using the derived N values as weighting factors.
3 AEo = -16 .7 eV. A fit to Fourier-filtered U signal gave N = 0.30, R = 4.26 A, ~y2 = 0.0021 ~2 and AE 0 = -1 .5 eV.
Table 6. EXAFS results, for samples measured in fluores- cence mode. AEo was fixed at 0 eV for all shells, except as noted.
Sample Shell' N R (A) cr ~ (A~)
V-IE3 O,x 2.69 1.77 0.0034 O~q 3.52 2.43 0.0090
V-SC O~,~ 2.23 1.80 0.0032 Oeq I 3.09 2.28 0.0115 Oeq 2 1.02 2.48 0.0023 U 2 0.63 3.88 0.0023 Oeq,av 2.323
V-SCK O~ 2.30 1.78 0.0024 O~q 4.24 2.38 0.0129
HB -IE3 Oax 2.03 1.78 0.0012 O~q / 3.76 2.39 0,0087 Oeq 2 0.90 2.51 0.0002 O~q,a ~ 2.413
HB-SC O~• 2.10 1.79 0.0012 O~q Z 1.27 2.24 0.0076 Oeq 2 3.09 2.42 0.0060 O~q,av 2.373
HB-SCK Oax 2.73 1.80 0.0035 O,qj 2.87 2.24 0.0125 Oeq 2 1.85 2.44 0.0055 U 4 0.43 3.90 0.0012 O~q,a ~ 2.323
i O~x refers to the axial O shell, Oeq refers to the equatorial O shell or shells.
2 AEo = +0.6 eV. A fit to Fourier-filtered U signal gave N - 0.71, R = 3.91 A, cr 2 = 0.0043 ~2 and AE 0 - +4.0 eV.
3 The R value listed for Oeq,av is the average R for the equa- torial shell, using the derived N values as weighting factors.
4 AEo = +0.5 eV. A fit to Fourier-filtered U signal gave N = 0.94, R 3.89 A, (r 2 = 0.0047 ~2 and AE 0 = -0 .7 eV.
(D
t - C~
E
g o 0 r "
i . .
t, -"1
o LL
' I
, I
0 . 0 1 . 0
I ' I ' I '
measured ......... f i t
V-SC
I ' I ' I ' I ' I '
( b ) I I measured Pl ......... " '
J 2 . 0 3 . 0 4 . 0 0 . 0 1 .0 2 . 0 3 . 0 4 . 0
R+a (A) R+~ (A) 2+ Figure 5. Uranium L 3 fluorescence EXAFS results for (a) UO22Vvermiculite samples and (b) UO 2 /hydrobiotite samples.
See Figure 4 for details.
450 Hudson et al. Clays and Clay Minerals
tation, a modif icat ion of the equatorial shell upon de- hydration is clearly shown by the E X A F S results. This is direct ev idence of a local structural change for the two dried samples under condit ions which did not in- duce an interlayer contraction, as observed by XRD. These results indicate that some water is r emoved from the inter lamellar region at low humidity, but con- traction is hindered, perhaps by steric effects o f the uranyl cation.
Addit ional Shells. The E X A F S FT in Figure 4a for sample V-IE1-D, which has a good signal- to-noise ra- tio, shows indications of a neighboring~ atom contrib- uting FT magni tude at R + A -- 3.1 A. Analysis of potential neighbors in this interatomic distance range is compl ica ted by mult iple-scat ter ing (MS) contribu- tions, including those f rom the uranyl axial O atoms. The approach used here is to fit the Fourier-fi l tered E X A F S from this range with a combinat ion of axial MS and single scattering f rom a neighboring atom. For this data set, the filtered signal could not be success- fully fit with reasonable structural parameters when the neighboring atom was assumed to be Si, O, or U. Note that electron scattering parameters vary gradually with atomic number, so Si serves also as a mode l for A1 and Mg. The lack of success in this case may indicate that the measured FT has a spurious peak, or that in- terfering signals f rom several different neighbors at similar distances create the feature. The l imited suc- cess of uranyl MS model ing by FEFF 6, which has been previously discussed (Hudson, et al. 1996), may also prevent an accurate analysis of the filtered signal. No definit ive conclus ion is possible at present, al- though the presence of a scatterer in this distance range is consistent with the formation of an inner- sphere complex, as proposed above.
In Figure 4a, sample V-IE2 shows a F F peak, wel l above noise levels, which is assigned to a U shell at R -- 4.2 ,~. The large AE0 value obtained for this shell in the full E X A F S analysis is not physical ly meaning- ful. Howeve r the value obtained in the fit to the Fou- rier-filtered U peak is more reasonable (Table 5). This fit to the V-IE2 filtered U signal is not as successful as the fit shown be low for V-SC, with some phase and ampli tude d isagreement for k < 6 * ~. H o w e v e r the overall agreement is worse, and fit parameters became unreasonable, i f Si or O scatterers were assumed in- stead. The FT ' s of samples V-IE1, HB-IE1, and HB- IE2, in Figure 4, show a possible U feature at R + A
3.9 ,~, with less magni tude than the corresponding feature for V-IE2. Fits to the filtered peaks, not pre- sented here, gave results similar to those for V-IE2, with smaller coordinat ion numbers and AE0 be tween - 9 and - 15 eV. Overal l the results for V-IE2 are more compel l ing evidence of U neighbors, because they are based upon a larger-magnitude exper imental feature.
Samples V-IE1-D and HB- IE1-D show no indicat ion of U neighbors.
Solut ion condit ions for the transmission samples were well be low solubil i ty l imits for any known U bulk phase. The observed U - U distance of - -4 .2 -4 .3 ,~ is too large to result f rom a reported di -hydroxyl- br idged uranyl d imer structure. E X A F S measurements yielded a U - U distance o f - 3 . 9 A for several such dimers (Al len et al., 1996a). Furthermore, the equa- torial bond distances der ived here are different f rom those observed for such dimers. The present results suggest a tendency for outer-sphere uranyl at ion-ex- change sites to form loosely bound ol igomers. The de- r ived U - U distance suggests dimers which share a sin- gle equatorial ligand, though the direct observat ion o f a fairly uni form equatorial O shell, without splitting, appears to contradict this model . Perhaps dimers are favored by the structured aqueous envi ronment o f the interlayer region rather than by a direct bonding be- tween uranyl complexes . Dehydrat ion could alter this environment , leading to the observed absence of the U neighbor for V-IE-D and HB-IE-D. Note that sur- face precipitat ion is not a l ikely explanat ion for the presence of a U neighbor, based on the preceding dis- cussion and the polar ized X A N E S results g iven below. Also disappearance of the U neighbor upon dehydra- tion is difficult to reconci le for a surface precipitate.
Fluorescence samples--ion exchange vs. sorption by surface hydroxyls. Oxygen Shells. Structural parame- ters der ived f rom the least-squares analysis are pre- sented in Table 6. Results for sample HB-IE3 are sim- ilar to those of HB-IE1-D, with a split equatorial shell of about four O atoms at an intermediate distance and a more distant O atom. Results for the analogous sam- pie V-IE3 indicate a single equatorial shell at the same distance observed for other ion-exchange samples. Al- though stable fits with two resolved equatorial shells were not obtained for V-IE3, note in Figure 5a that the fit may be missing a scattering shell around R + A -- 2.1 ,~. Therefore, V-IE3 may be structurally more similar to HB-IE3 than the l isted fit parameters sug- gest. In any case, the split-shell result for HB-IE3 probably reflects the much lower U content, as com- pared to the other HB ion-exchange samples. At lower loadings, a significant port ion of the uranyl may bond at defect and/or impuri ty sites which are chemica l ly react ive but present in low concentrat ions in the min- eral. Defects are expected to be more c o m m o n in more finely ground -IE3 powders, as compared to other -IE samples. The format ion of strong bonds to these chem- ical ly act ive sites would create inner-sphere complexes with split equatorial shells, as observed for HB-IE3. Alternat ively, the results for HB-IE3 may be realted to the much larger surface area of this sample, as com- pared to the other HB ion-exchange samples. This sample should have a greater fraction of uranyl bound

Vol. 47, No. 4, 1999 U 6+ sorption complexes on vermiculite and hydrobiotite 451
to ion-exchange sites on external basal plane surfaces, as opposed to inter lamellar surfaces. Uranyl at these external sites does not have the symmetr ic environ- ment o f two closely separated surfaces, and the mea- sured distortion of the equatorial shell may reflect a more directional, possibly inner-shell, interaction with the single basal plane surface.
The -SC samples for both vermicul i te and hydro- biotite exhibit a large splitting of the equatorial shell, with a difference in bond distance o f 0 .18-0 .20 ,~. The average axial bond distance for all ion-exchange sam- ples is 1.78 ,~, whereas the two -SC samples have larger values of 1.80 and 1.79 ,~. This is probably a significant difference, which indicates stronger overall equatorial chemical bonding to the U for the -SC sam- pies. A similar conclus ion is obtained by compar ing the averaged equatorial bond distances (Tables 5 and 6). These are smaller for all the -SC and - S C K sam- pies, as compared to all the -IE samples.
This trend towards stronger overal l equatorial bond- ing, and especial ly the pronounced equatorial splitting, is consistent with several possible sorption mecha- nisms, all involv ing hydrolysis or similar processes. One possibil i ty is bidentate, monomer ic inner-sphere surface complexat ion, where the splitting of the equa- torial groups arises because the two surface O atoms are more distant f rom the U than the other equatorial O atoms. Another possibil i ty is the presence of aque- ous uranyl species, such as hydroxyl and carbonate complexes , bound as inner-or outer-sphere complexes on the mineral surface. Uranyl is predicted to form a variety of monomer ic and ol igomeric aqueous com- plexes under the near-neutral pH condit ions used here (Table 2). Molecular structures are not well known for these complexes , but it is l ikely that they would ex- hibit a split equatorial shell, due to the combinat ion of strong ligands (OH , CO32 ) and weak ligands (H20). On surfaces, such complexes could exhibit equatorial splitting as a result of complexa t ion by free ligands, regardless of surface interaction. A third possibil i ty is the formation, through hydrolysis reactions, o f a pre- cipitate or surface precipitate. Uranyl in such solids will also exhibit a split equatorial shell. These possi- bilities are considered in more detail below. Regard- less of interpretation, the E X A F S measurements clear- ly indicate that the local structure of uranyl is modif ied under condit ions which favor sorption at surface hy- droxyl sites, as compared to ion exchange sites.
Two U E X A F S studies of uranyl sorbed on mont- mori l loni te at near-neutral pH (Dent et al., 1992; Chis- ho lm-Brause et aL, 1994) gave results similar to those observed here. Al though splitting of the equatorial shell was not resolved due to the l imited k-range of the data sets, both studies indicated a large amount of static disorder in the equatorial shell. Using U E X A F S , a significant splitting of the equatorial shell was ob- served for uranyl sorbed on ferrihydrite (Waite et al.,
1994). That local structure was attributed to bidentate, monomer ic inner-sphere surface complexat ion, as dis- cussed in the data analysis section above.
The - S C K samples were prepared by exposing ura- nyl to K+-exchanged minerals with col lapsed interlay- er regions. These samples were used to assess whether the inter layer regions play an active role in sorption under the condit ions intended to favor sorption at layer edge sites. The der ived bond lengths for H B - S C K are very similar to those o f HB-SC, suggest ing similar chemistry. This suggests that interlayer ion-exchange is not the dominant process under these conditions.
In contrast, the structural parameters for V - S C K are not similar to those f rom V-SC. The single equatorial shell and the axial bond length of 1.78 ,~ are similar to results for the ion-exchanged V-IE samples, but the equatorial bond distance is smaller. Note that the X R D results indicated only partial inter layer collapse for the K+-vermiculi te . This may explain the dif ference in E X A F S results for V-SCK, as compared to H B - S C K , which had complete collapse. H o w e v e r it is not clear why incomplete collapse would lead to the observed structure. One possibi l i ty is that the vermicul i te ion exchange sites are highly select ive for cationic uranyl species over the monova len t K cations, leading to sig- nificant ion exchange of uranyl for K + within the non- col lapsed interlayer. For cat ion exchange on mont- moril lonite, UO22+ was found to be highly preferred to K*, especial ly at low uranyl concentrat ions (Tsunash- ima et al., 1981). H o w e v e r the aqueous UO22~ con- centration for V-SCK is predicted to be four orders o f magni tude less than the K + concentration, and the UO2OH + concentrat ion is expected to be three orders of magni tude less. Even highly preferential exchange chemis t ry may be unable to ove rcome the K + mass action advantage.
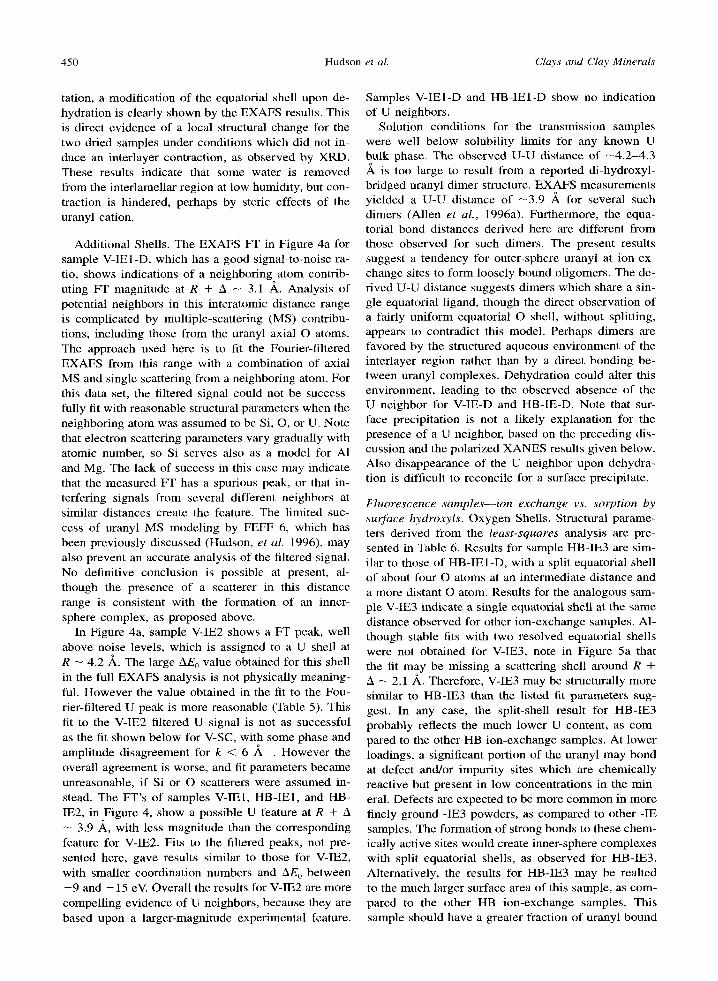
Addi t ional Shells. A U shell was included in the fit for samples V-SC and HB-SCK. The identification of U is conf i rmed by the fit to the Four ier filtered signal (Figure 6 for the V-SC data). Excel lent agreement be- tween the calculated and filtered E X A F S is obtained using reasonable fit parameters (Table 6). Similar re- suits were obtained for the filtered H B - S C K data. At- tempts to fit the filtered E X A F S with Si or O scatterers gave much poorer agreement and unreasonable param- eters. Due to high noise, we cannot determine i f an appreciable U - U contribution is present for samples V- IE3, HB-IE3, or HB-SC. However , sample V-SCK has lower noise, and shows no indication of a U neighbor. Thus, the U shell observed for V-SC is absent for V- SCK, a difference which is not surprising in light of the dissimilar equatorial structures discussed above.
For the two samples with a clear U - U contribution, V-SC and HB-SCK, we bel ieve at least part of that signal arises f rom an o l igomer ic surface species and/ or a surface precipitate. Other possible origins exist.
452 Hudson et al. Clays and Clay Minerals
' ' I . . . . I '
(a)
f i l tered exp ......... calculated
, , I . . . . I ,
5 1 0 k (A "I)
i i I
i
_ (b) &
E
$
I i
0 . 0 2 . 5 5 . 0
R+A (A)
Figure 6. Fourier-filtered EXAFS showing a neighboring U atom at -3.9 ,~. (a) k3-weighted • curves, (b) Fourier trans- forms of U-weighted • curves. The solid line is the filtered data for sample V-SC and the dotted line is the fit, using U scattering parameters. The high quality of the fit indicates that this neighbor is indeed a U atom.
In particular, speciation calculations for the -SC and -SCK samples indicate possible bulk schoepite or sod- dyite precipitation. Fortunately U EXAFS measure- ments are available for both of these phases, allowing direct comparisons.
For soddyite, a single uranyl equatorial shell was observed in two studies, with reported values of R = 2.38 A (Reich et al. , 1996) and R = 2.36 A (Farges et al. , 1992). This equatorial structure is different from any observed here, except for V-SCK. However results for V-SCK indicated the absence of a U neighbor, whereas a U shell was observed for soddyite at R 3.9 ,~ (Reich et al. , 1996). We therefore conclude that soddyite did not form in any sample.
EXAFS results for schoepite indicate an axial shell at R = 1.80 ,~ and a split equatorial shell with bond distances 2.26 and 2.47 A (Allen et al., 1996b). This structure is in agreement with the derived parameters for HB-SC, HB-SCK, and especially V-SC. In addi- tion, a U shell was reported for schoepite at 3.84 * (Allen et al. , 1996b). A U shell was observed at about this distance for V-SC and HB-SCK. Howevel, a com- parison of the U signal strength shows that the U-U contribution to the EXAFS in schoepite is about twice the contribution observed for V-SC or HB-SCK, or for the maximum possible contribution from HB-SC. To avoid error from the correlation between derived co- ordination number and DW factor, these comparisons are based upon the integrated EXAFS amplitude
N l exp(-2k2~r2) dk (1)
taken over the same k range. This comparison suggests that a schoepite phase may account for some, but not all, of the U in samples V-SC, HB-SCK, and possibly HB-SC. Therefore uranyl may be present as a hetero-
geneous mixture of bulk schoepite and a surface spe- cies lacking an ordered U neighbor shell, e.g. , a mo- nomeric species.
The reduced U signal, relative to schoepite, may alternatively be attributed to the predominance of an amorphous schoepite-like phase. Static disorder in such a phase may significantly reduce the EXAFS sig- nal from the U neighbor shell. EXAFS measurements on an amorphous hydrous uranyl oxide (Dent et al. , 1992) showed a U shell at 3.9 ,~ with an integrated amplitude similar to that measured here for V-SC and HB-SCK. A disordered phase would be less stable and thus have a higher solubility than well-ordered schoe- pite. Therefore a disordered phase would not be ex- pected to precipitate in bulk at concentrations near the schoepite solubility, as used here. However, the amor- phous phase may stabilize by bonding to the mineral surface, leading to a surface precipitate rather than a bulk phase. In fact, a disordered precipitate is kineti- cally favored over the direct precipitation of well-or- dered schoepite. Comparable behavior is observed in the hydrolysis of Fe 3§ where amorphous Fe(OH)3 pre- cipitates from alkaline solutions, and then slowly transforms to more stable crystal l ine phases o~- FeO(OH) and a-Fe203 (Baes and Mesmer, 1976). Thus a second, more likely, interpretation of the EXAFS results is that an amorphous schoepite-like surface pre- cipitate formed on samples V-SC and HB-SCK.
Another potential origin for the observed U shell in V-SC and HB-SCK is the formation of oligomeric ura- nyl structures. Although the U interatomic distance de- rived here is similar to that found for di-hydroxyl- bridged uranyl dimers (Allen et al. , 1996a), the equa- torial structure is different. The dimers have equatorial bond distances of - 2 . 3 4 and 2.46 A, a poor match to our samples. Although this structure might not be pre- sent, some other oligomeric uranyl surface species may exist in our samples, especially because of the aqueous phase speciation, which may include appre- ciable amounts of (UO2)2CO3(OH)3 and possibly (UO2)3(OH)5 + (Table 2). Therefore a third interpreta- tion of the results is that the U neighbor shell arises from oligomeric uranyl surface species in samples V- SC and HB-SCK. Of these three interpretations, a sur- face precipitate or surface oligomers appear to be most plausible, and these two possibilities may result from similar surface interactions. Both interpretations are consistent with the results for equatorial structure dis- cussed above.
Around R + A -- 3 * , samples V-SC and HB-SC show FT magnitude above background which is not reproduced in the fitted curve, possibly indicating the presence of a neighboring atom. As described above for sample V-IE1-D, EXAFS analysis at this distance is complicated by the MS contributions from uranyl. Attempts to fit the Fourier filtered signal by a combi- nation of MS and a shell of O, Si, or U were unsuc-
Vol. 47, No. 4, 1999 U 6+ sorption complexes on vermiculite and hydrobiotite 453
c -
O
O
r
<
I
( a )
I
17150
i i I i i i
~" . ~ U L 3 - E d g e X A N E S :
- O R
Layers PARALLEL to polarization
- - - Powder sample ......... Layers PERPENDIC.
to polarization
I I I i
17200 Photon Energy (eV)
' ' [ . . . . I . . . . I . . . . I
, , " - o.
( b )
= / V -OR
&
8 . Q
<
F Layers pARALLEL to polarization
j - - - Powder sample
" 7 , I , , , , I H H I , , , , I , , i , , , , I , , , , l , ~ ~ , 2 1 7 5 0 2 1 8 0 0 2 1 8 5 0 2 1 9 0 0
Photon Energy (eV)
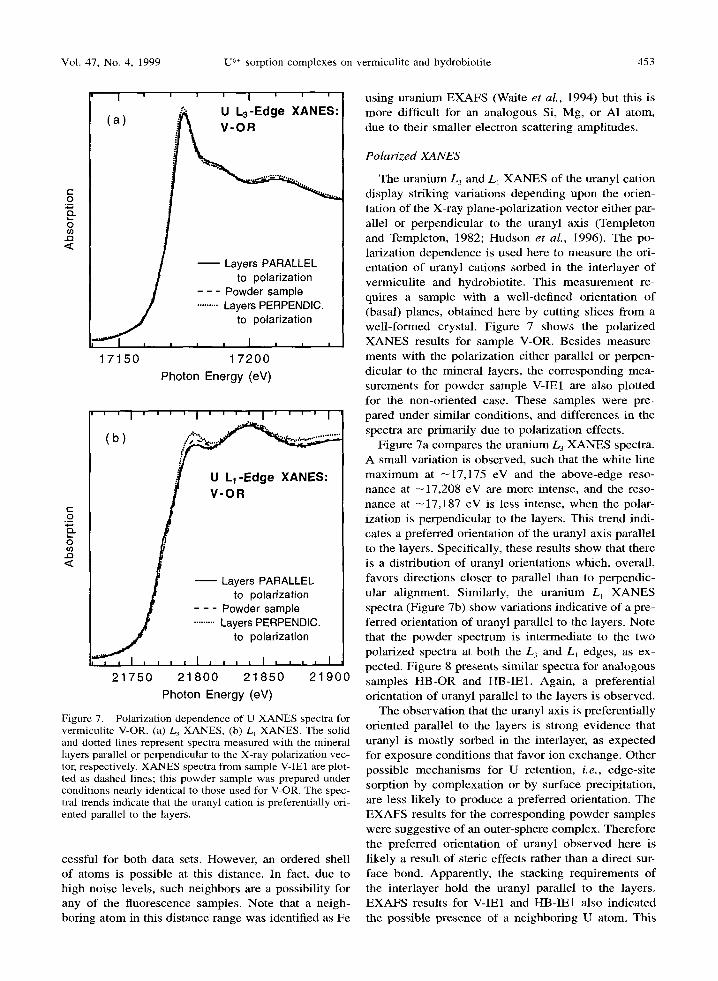
Figure 7. Polarization dependence of U XANES spectra for vermiculite V-OR. (a) L 3 XANES, (b) L~ XANES. The solid and dotted lines represent spectra measured with the mineral layers parallel or perpendicular to the X-ray polarization vec- tor, respectively. XANES spectra from sample V-IE1 are plot- ted as dashed lines; this powder sample was prepared under conditions nearly identical to those used for V-OR. The spec- tral trends indicate that the uranyl cation is preferentially ori- ented parallel to the layers.
cessful for both data sets. However , an ordered shell of atoms is possible at this distance. In fact, due to high noise levels, such neighbors are a possibil i ty for any of the f luorescence samples. Note that a neigh- boring a tom in this distance range was identified as Fe
using uranium E X A F S (Waite et al., 1994) but this is more difficult for an analogous Si, Mg, or A1 atom, due to their smaller electron scattering amplitudes.
P o l a r i z e d X A N E S
The uranium L 3 and L1 X A N E S of the uranyl cat ion display striking variations depending upon the orien- tation o f the X-ray plane-polar izat ion vector either par- allel or perpendicular to the uranyl axis (Templeton and Templeton, 1982; Hudson et al., 1996). The po- larization dependence is used here to measure the ori- entation o f uranyl cations sorbed in the inter layer o f vermicul i te and hydrobiotite. This measurement re- quires a sample wi th a wel l -def ined orientat ion o f (basal) planes, obtained here by cutting slices f rom a wel l - fo rmed crystal. Figure 7 shows the polar ized X A N E S results for sample V-OR. Besides measure- ments with the polarizat ion either parallel or perpen- dicular to the mineral layers, the corresponding mea- surements for powder sample V-IE1 are also plotted for the non-oriented case. These samples were pre- pared under similar condit ions, and differences in the spectra are pr imari ly due to polarizat ion effects.
Figure 7a compares the uranium L3 X A N E S spectra. A small variat ion is observed, such that the white line m a x i m u m at - 1 7 , 1 7 5 eV and the above-edge reso- nance at - 1 7 , 2 0 8 eV are more intense, and the reso- nance at - 1 7 , 1 8 7 eV is less intense, when the polar- ization is perpendicular to the layers. This trend indi- cates a preferred orientation of the uranyl axis parallel to the layers. Specifically, these results show that there is a distribution of uranyl orientations which, overall , favors directions closer to parallel than to perpendic- ular al ignment. Similarly, the uranium L~ X A N E S spectra (Figure 7b) show variations indicat ive of a pre- ferred orientation of uranyl parallel to the layers. Note that the powder spectrum is intermediate to the two polar ized spectra at both the L 3 and LI edges, as ex- pected. Figure 8 presents similar spectra for analogous samples H B - O R and t tB-IE1. Again, a preferential orientation o f uranyl parallel to the layers is observed.
The observat ion that the uranyl axis is preferent ial ly oriented parallel to the layers is strong ev idence that uranyl is most ly sorbed in the interlayer, as expected for exposure condit ions that favor ion exchange. Other possible mechanisms for U retention, i.e., edge-si te sorption by complexat ion or by surface precipitation, are less l ikely to produce a preferred orientation. The E X A F S results for the corresponding powder samples were suggest ive of an outer-sphere complex. Therefore the preferred orientat ion of uranyl observed here is l ikely a result of steric effects rather than a direct sur- face bond. Apparently, the stacking requirements o f the interlayer hold the uranyl parallel to the layers. E X A F S results for V-IE1 and HB-IE1 also indicated the possible presence of a neighbor ing U atom. This
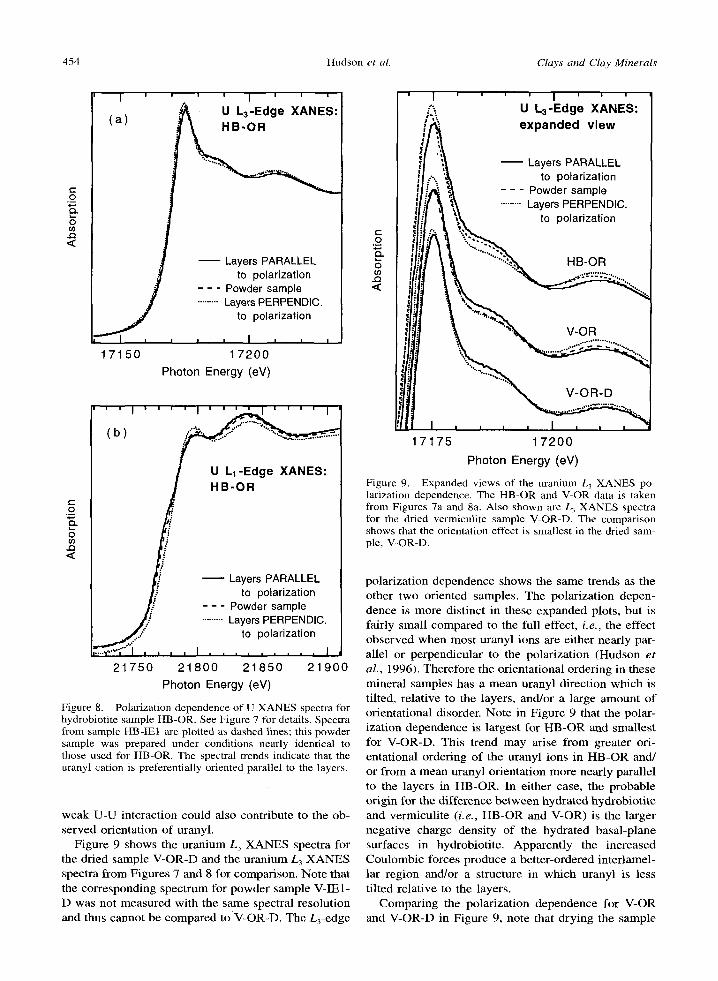
454 Hudson et al. Clays and Clay Minerals
r
O
O
<
I ( a )
i | I | | |
. .~ U L3-Edge XANES:
I ~ ' HB'O I
J 1 7 1 5 0
- - Layers PARALLEL to polarization
- - - Powder sample ......... Layers PERPENDIC.
to polarization
I I I I I I
17200 Photon Energy (eV)
' ' I . . . . I . . . . I . . . . I
( ) .4" "'" . . . . . . . . . . . . . . . ..-.- 4
,-- ~ HB-OR .s g
~ ,f/ ffl
.El <
Layers PARALLEL I / to polarization
~..~ - - - Powder sample y ~ . - Layers PERPENDIC.
~ , I . . . - t , o pol :ri:at:on. ,
2 1 7 5 0 2 1 8 0 0 2 1 8 5 0 2 1 9 0 0 Photon Energy (eV)
Figure 8. Polarization dependence of U XANES spectra for hydrobiotite sample HB-OR. See Figure 7 for details. Spectra from sample HB-IE1 are plotted as dashed lines; this powder sample was prepared under conditions nearly identical to those used for HB-OR. The spectral trends indicate that the uranyl cation is preferentially oriented parallel to the layers.
weak U-U interaction could also contribute to the ob- served orientation of uranyl.
Figure 9 shows the uranium L 3 XANES spectra for the dried sample V-OR-D and the uranium L3 XANES spectra from Figures 7 and 8 for comparison. Note that the corresponding spectrum for powder sample V-IEI- D was not measured with the same spectral resolution and thus cannot be compared to V-OR-D. The L3-edge
U) . .Q ,<
I ' I ...... ' I ' ' ' I U L3-Edge XANES: I expanded view
Layers PARALLEL to polarization
- - - Powder sample ......... Layers PERPENDIC.
to polarization
HB-OR
V-OR
V-OR-D
1 7 1 7 5 1 7 2 0 0
Photon Energy (eV)
Figure 9. Expanded views of the uranium L 3 XANES po- larization dependence. The HB-OR and V-OR data is taken from Figures 7a and 8a. Also shown a r e L 3 XANES spectra for the dried vermiculite sample V-OR-D. The comparison shows that the orientation effect is smallest in the dried sam- ple, V-OR-D.
polarization dependence shows the same trends as the other two oriented samples. The polarization depen- dence is more distinct in these expanded plots, but is fairly small compared to the full effect, i.e., the effect observed when most uranyl ions are either nearly par- allel or perpendicular to the polarization (Hudson e t al. , 1996). Therefore the orientational ordering in these mineral samples has a mean uranyl direction which is tilted, relative to the layers, and/or a large amount of orientational disorder. Note in Figure 9 that the polar- ization dependence is largest for HB-OR and smallest for V-OR-D. This trend may arise from greater ori- entational ordering of the uranyl ions in HB-OR and/ or from a mean uranyl orientation more nearly parallel to the layers in HB-OR. In either case, the probable origin for the difference between hydrated hydrobiotite and vermiculite (i.e., HB-OR and V-OR) is the larger negative charge density of the hydrated basal-plane surfaces in hydrobiotite. Apparently the increased Coulombic forces produce a better-ordered interlamel- lar region and/or a structure in which uranyl is less tilted relative to the layers.
Comparing the polarization dependence for V-OR and V-OR-D in Figure 9, note that drying the sample
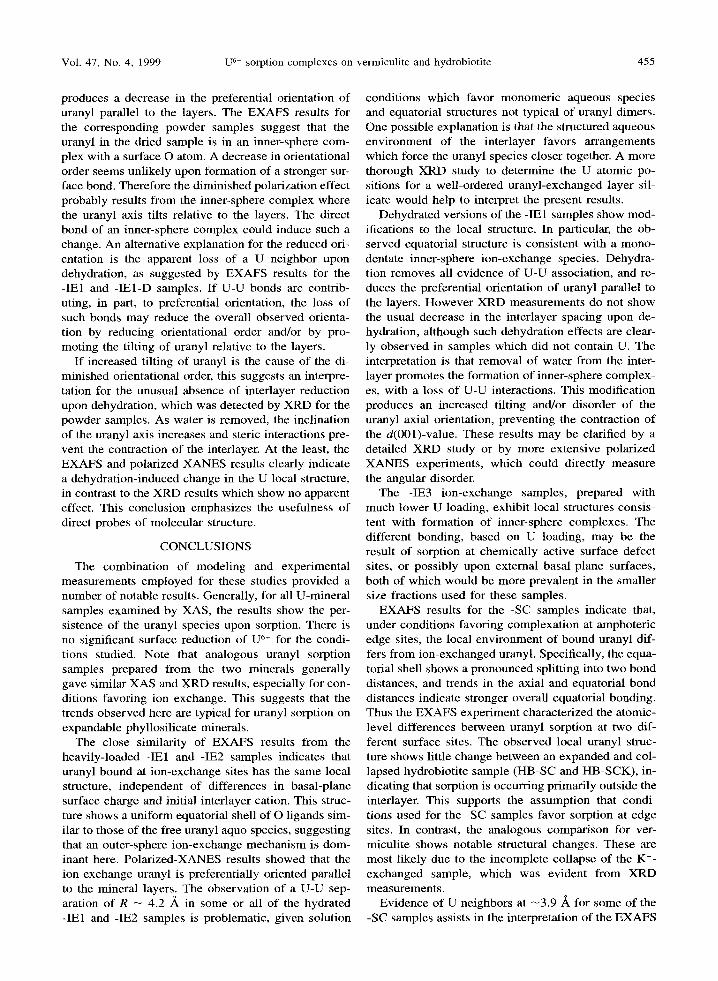
Vol. 47, No, 4, 1999 U 6+ sorption complexes on vermiculite and hydrobiotite 455
produces a decrease in the preferential orientation of uranyl parallel to the layers. The EXAFS results for the corresponding powder samples suggest that the uranyl in the dried sample is in an inner-sphere com- plex with a surface O atom. A decrease in orientational order seems unlikely upon formation of a stronger sur- face bond. Therefore the diminished polarization effect probably results from the inner-sphere complex where the uranyl axis tilts relative to the layers. The direct bond of an inner-sphere complex could induce such a change. An alternative explanation for the reduced ori- entation is the apparent loss of a U neighbor upon dehydration, as suggested by EXAFS results for the -IE1 and -IE1-D samples. If U-U bonds are contrib- uting, in part, to preferential orientation, the loss of such bonds may reduce the overall observed orienta- tion by reducing orientational order and/or by pro- moting the tilting of uranyl relative to the layers.
If increased tilting of uranyl is the cause of the di- minished orientational order, this suggests an interpre- tation for the unusual absence of interlayer reduction upon dehydration, which was detected by XRD for the powder samples. As water is removed, the inclination of the uranyl axis increases and steric interactions pre- vent the contraction of the interlayer. At the least, the EXAFS and polarized XANES results clearly indicate a dehydration-induced change in the U local structure, in contrast to the XRD results which show no apparent effect. This conclusion emphasizes the usefulness of direct probes of molecular structure.
CONCLUSIONS
The combination of modeling and experimental measurements employed for these studies provided a number of notable results. Generally, for all U-mineral samples examined by XAS, the results show the per- sistence of the uranyl species upon sorption. There is no significant surface reduction of U 6+ for the condi- tions studied. Note that analogous uranyl sorption samples prepared from the two minerals generally gave similar XAS and XRD results, especially for con- ditions favoring ion exchange. This suggests that the trends observed here are typical for uranyl sorption on expandable phyllosilicate minerals.
The close similarity of EXAFS results from the heavily-loaded - |El and -IE2 samples indicates that uranyl bound at ion-exchange sites has the same local structure, independent of differences in basal-plane surface charge and initial interlayer cation. This struc- ture shows a uniform equatorial shell of O ligands sim- ilar to those of the free uranyl aquo species, suggesting that an outer-sphere ion-exchange mechanism is dom- inant here. Polarized-XANES results showed that the ion-exchange uranyl is preferentially oriented parallel to the mineral layers. The observation of a U-U sep- aration of R -- 4.2 A in some or all of the hydrated -IE1 and -IE2 samples is problematic, given solution
conditions which favor monomeric aqueous species and equatorial structures not typical of uranyl dimers. One possible explanation is that the structured aqueous environment of the interlayer favors arrangements which force the uranyl species closer together. A more thorough XRD study to determine the U atomic po- sitions for a well-ordered uranyl-exchanged layer sil- icate would help to interpret the present results.
Dehydrated versions of the -IE1 samples show mod- ifications to the local structure. In particular, the ob- served equatorial structure is consistent with a mono- dentate inner-sphere ion-exchange species. Dehydra- tion removes all evidence of U-U association, and re- duces the preferential orientation of uranyl parallel to the layers. However XRD measurements do not show the usual decrease in the interlayer spacing upon de- hydration, although such dehydration effects are clear- ly observed in samples which did not contain U. The interpretation is that removal of water from the inter- layer promotes the formation of inner-sphere complex- es, with a loss of U-U interactions. This modification produces an increased tilting and/or disorder of the uranyl axial orientation, preventing the contraction of the d(001)-value. These results may be clarified by a detailed XRD study or by more extensive polarized XANES experiments, which could directly measure the angular disorder.
The -IE3 ion-exchange samples, prepared with much lower U loading, exhibit local structures consis- tent with formation of inner-sphere complexes. The different bonding, based on U loading, may be the result of sorption at chemically active surface defect sites, or possibly upon external basal-plane surfaces, both of which would be more prevalent in the smaller size fractions used for these samples.
EXAFS results for the -SC samples indicate that, under conditions favoring complexation at amphoteric edge sites, the local environment of bound uranyl dif- fers from ion-exchanged uranyl. Specifically, the equa- torial shell shows a pronounced splitting into two bond distances, and trends in the axial and equatorial bond distances indicate stronger overall equatorial bonding. Thus the EXAFS experiment characterized the atomic- level differences between uranyl sorption at two dif- ferent surface sites. The observed local uranyl struc- ture shows little change between an expanded and col- lapsed hydrobiotite sample (HB-SC and HB-SCK), in- dicating that sorption is occurring primarily outside the interlayer. This supports the assumption that condi- tions used for the -SC samples favor sorption at edge sites. In contrast, the analogous comparison for ver- miculite shows notable structural changes. These are most likely due to the incomplete collapse of the K § exchanged sample, which was evident from XRD measurements.
Evidence of U neighbors at --3.9 ,~ for some of the -SC samples assists in the interpretation of the EXAFS
456 Hudson et al. Clays and Clay Minerals
results. O f the poss ibi l i t ies cons ide red here, the mos t l ikely are: (1) The fo rma t ion of an a m o r p h o u s schoe- pi te- l ike surface precipi ta te and (2) The sorpt ion of o l igomer ic u rany l complexes con ta in ing hyd r oxy and/ or c a r b o n a t e l igands f rom the aqueous phase . A be t te r unde r s t and ing o f uranyl aqueous specia t ion, in bo th the t h e r m o d y n a m i c mode l ing and the detai ls of local a tomic structure, wou ld a l low be t te r charac te r iza t ion of u rany l sorpt ion. In particular, a more accura te de- t e rmina t ion of the UO2(OH) 2 (aq.) f o rma t ion cons tan t is essent ia l for an i m p r o v e d unde r s t and ing of near- neut ra l p H uranyl aqueous specia t ion and precipi ta- tion.
In s u m m a r y , the mos t s ignif icant conc lus ions are: (1) U n d e r l o w - p H condi t ions wh ich grea t ly favor ion- exchange sorpt ion m e c h a n i s m s , uranyl re ta ins a sym- metr ic local s t ructure sugges t ive of an ou te r - sphere complex , wi th a prefer red o r ien ta t ion o f the uranyl axis para l le l to the minera l layers; (2) U p o n dehydra- t ion, these i on -exchange complexes adopt a less sym- metr ic structure, cons i s ten t wi th an inner - sphere com- plex, wi th less p r o n o u n c e d or ien ta t ion of the uranyl axis; and (3) For neu t ra l -pH condi t ions f avor ing sorp- t ion at sur face hydroxy l sites, u ranyl has a h igh ly dis- tor ted equator ia l shell, ind ica t ive of s t ronger equator ia l l igat ion. The de tec t ion of a ne i ghbo r i ng U a tom sug- gests the fo rma t ion of surface prec ip i ta tes and /or olig- omer ic complexes .
A C K N O W L E D G M E N T S
The authors thank R. Pletcher of LLNL for expert assis- tance in the preparation of mineral samples, and J. Woicik for technical support at NSLS. C. Bruton and T. Wolery of LLNL provided useful advice on speciation calculations and access to the EQ3NR code and GEMBOCHS data base. NSLS and SSRL are supported by the U.S. Department of Energy, Divisions of Materials Sciences and Chemical Sci- ences. This work was supported in part by the Division of Materials Science, Office of Basic Energy Science, and per- formed under the auspices of the U.S. Department of Energy by Lawrence Livermore National Laboratory under contract W-7405-ENG-48.
R E F E R E N C E S
Allen, RG., Bucher, J.J., Clark, D.L., Edelstein, N.M., Ekberg, S.A., Gohdes, J.W., Hudson, E.A., Kaltsoyannis, N., Lu- kens, W.W., Neu, M.R, Pahner, RD., Reich, T., Shuh, D.K., Tait, C.D., and Zwick, B.D. (1995) Multinuclear NMR, Ra- man, EXAFS, and x-ray diffraction studies of uranyl car- bonate complexes in near-neutral aqueous solutions. Inor- ganic Chemistry, 34, 4797-4807.
Allen, RG., Shuh, D.K., Bucher, J.J., Edelstein, N.M., Reich, T., Denecke, M.A., and Nitsche, H. (1996a) EXAFS deter- mination of uranium structures: The uranyl ion complexed with tartaric, citric, and malic acids. Inorganic Chemistry, 35, 784-787.
Allen, RG., Shuh, D.K., Bucher, J.J., Edelstein, N.M., Palmer, C.E.A., Silva, R.J., Nguyen, S.N., Marquez, L.N., and Hud- son, E.A. (1996b) EXAFS determination of uranium struc- tures: Schoepite and other U(VI) oxide precipitates. Radi- ochimica Acta, 75, 47-53.
Baes, C.E, Jr. and Mesmer, R.E. (1976) The Hydrolysis o f Cations. Wiley, New York, 489 pp.
Bayliss, R, Erd, D.C., Mrose, M.E., Sabina, A.R, and Smith, D.K. (1986) Mineral Powder Diffraction File Data Book. International Center for Diffraction Data, Swarthmore, Pennsylvania, USA, 596 pp.
Brindley, G.W., Zalba, RE., and Bethke, C.M. (1983) Hydro- biotite, a regular 1:1 interstratification of biotite and ver- miculite layers. American Mineralogist, 68, 420-425.
Brown, G.E., Jr. (1990) Spectroscopic studies of chemisorp- tion reaction mechanisms at oxide-water Interfaces. In Re- views in Mineralogy, Volume 23, Mineral-Water Interface Geochemistry, M.E Hochella, Jr. and A.E White, eds., Min- eral Society of America, Washington, D.C., 309-363.
Bucher, J.J., Edelstein, N.M., Osborne, K.R, Shuh, D.K., Madden, N., Luke, R, Pehl, D., Cork, C., Malone, D., and Allen, RG. (1996) A multi-channel Ge detector system for fluorescence x-ray absorption spectroscopy. Reviews o f Sci- entific Instruments, 67, 1-4.
Chisholm-Brause, C., Conradson, S.D., Buscher, C.T., Eller, RG., and Morris, D.E. (1994) Speciation of uranyl sorbed at multiple binding sites on montmorillonite. Geochimica et Cosmochimica Acta, 58, 3625-3631.
Dent, A.J., Ramsay, J.D.E, and Swanton, S.W. (1992) An EXAFS study of uranyl ion in solution and sorbed onto silica and montmorillonite clay colloids. Journal o f Colloid and Interface Science, 150, 45 60.
Farges, E, Ponader, C.W., Calas, G., and Brown, G.E, Jr. (1992) Structural environments of incompatible elements in silicate glass/melt systems: II. U TM, U v, and U w. Geo- chimica et Cosmochimica Acta, 56, 4205 4220.
Giaquinta, D.M., Soderholm, L., Yuchs, S.E., and Wasser- man, S.R. (1997) The speciation of uranium in a smectite clay: Evidence for catalysed uranyl reduction. Radiochim- ica Acta, 76, 113-121.
Grenthe, I., Fuger, J., Konings, R.J.M., Lemire, R.J., Muller, A.B., Nguyen-Trung, C., and Wanner, H. (1992) Chemical Thermodynamics of Uranium: Nuclear Energy Agency, Chemical Thermodynamics, Volume 1. North-Holland El- sevier Science, New York, 715 pp.
Hudson, E.A., Rehr, J.J., and Bucher, J.J. (1995) Multiple- scattering calculations of the uranium L3-edge x-ray ab- sorption near-edge structure. Physical Review B, 52, 13815-13826.
Hudson, E.A., Allen, RG., Terminello, L.J., Denecke, M., and Reich, T. (1996) Polarized x-ray absorption spectra of the uranyl ion: Comparison of theory and experiment. Physical Review B, 54, 156-165.
Lemire, R.J. and Tremaine, RR. (1980) Uranium and pluto- nium equilibra in aqueous solutions to 200~ Journal o f Chemical and Engineering Data, 25, 361 370.
MacEwan, D.M.C. and Wilson, M.J. (1980) Interlayer and intercalation complexes of clay minerals. In Crystal Struc- tures o f Clay Minerals and Their X-ray Identification, G.W. Brindley and G. Brown, eds., Mineralogical Society, Lon- don, 197-248.
Nguyen, S.N., Silva, R.J., Weed, H.C., and Andrews, J.E., Jr. (1992) Standard Gibbs free energies of formation at the temperature 303.15 K of four uranyl silicates: Soddyite, uranophane, sodium boltwoodite, and sodium weeksite. Journal o f Chemical Thermodynamics, 24, 359-376.
Petiau, J., Calas, G., Petitmaire, D., Bianconi, A., Benfatto, M., and Marcelli, A. (1986) Delocalized versus localized unoccupied 5f states and the uranium site structure in ura- nium oxides and glasses probed by x-ray-absorption near- edge structure. Physical Review B, 34, 7350-7631.
Prikryl, J.D., Pabalan, R.T., Turner, D.R., and Leslie, B.W. (1994) Uranium sorption on a-alumina: Effects of pH and
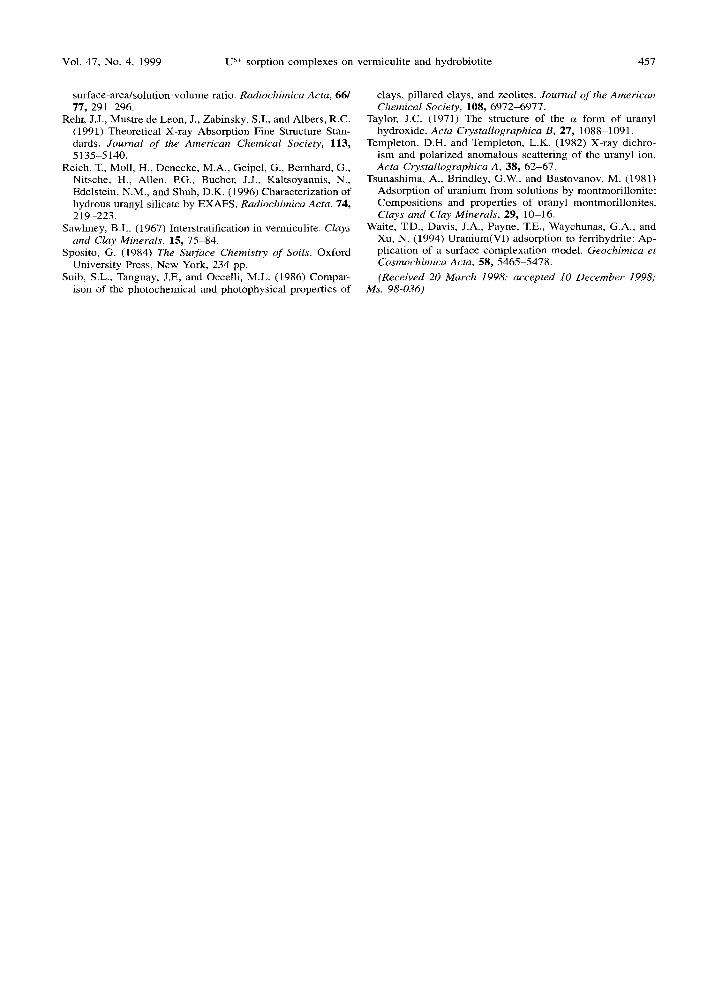
Vol. 47, No. 4, 1999 U 6§ sorption complexes on vermiculite and hydrobiotite 457
surface-area/solution-volume ratio. Radiochimica Acta, 66/ 77, 291-296.
Rehr, J.J., Mustre de Leon, J., Zabinsky, S.I., and Albers, R.C. (1991) Theoretical X-ray Absorption Fine Structure Stan- dards. Journal o f the American Chemical Society, 113, 5135-5140.
Reich, T., Moll, H., Denecke, M.A., Geipel, G., Bernhard, G., Nitsche, H., Alien, PG., Bucher, J.J., Kaltsoyannis, N., Edelstein, N.M., and Shuh, D.K. (1996) Characterization of hydrous uranyl silicate by EXAFS. Radiochimica Acta, 74, 219-223.
Sawhney, B.L. (1967) Interstratification in vermiculite. Clays and Clay Minerals, 15, 75 84.
Sposito, G. (1984) The Surface Chemistry o f Soils'. Oxford University Press, New York, 234 pp.
Suib, S.L., Tanguay, J.E, and Occelli, M.L. (1986) Compar- ison of the photochemical and photophysical properties of
clays, pillared clays, and zeolites. Journal o f the American Chemical Society, 108, 6972-6977.
Taylor, J.C. (1971) The structure of the e~ form of uranyl hydroxide. Acta Crystallographica B, 27, 1088-1091.
Templeton, D.H. and Templeton, L.K. (1982) X-ray dichro- ism and polarized anomalous scattering of the uranyl ion. Acta Crystallographica A, 38, 62-67.
Tsunashima, A., Brindley, G.W., and Bastovanov, M. (1981) Adsorption of uranium from solutions by montmorillonite: Compositions and properties of uranyl montmorillonites. Clays and Clay Minerals, 29, 10-16.
Waite, TD., Davis, J.A., Payne, T.E., Waychunas, G.A., and Xu, N. (1994) Uranium(VI) adsorption to ferrihydrite: Ap- plication of a surface complexation model. Geochimica et Cosmochimica Acta, 58, 5465-5478. (Received 20 March 1998; accepted 10 December 1998;
Ms. 98-036)