The Structure of Consensus: Cohesion and Hierarchy in Peer Networks G. Robin Gauthier Duke...
22
The Structure of Consensus: Cohesion and Hierarchy in Peer Networks G. Robin Gauthier Duke University Partial support for this project thanks to NSF/HSD: 0624158 (Moody, McFarland & Gest, PIs), W. T. Grant Foundation 8316 & NIDA 1R01DA018225-01 (Osgood, Moody, Feinberg, Gest, PIs)
-
Upload
osborn-strickland -
Category
Documents
-
view
214 -
download
0
Transcript of The Structure of Consensus: Cohesion and Hierarchy in Peer Networks G. Robin Gauthier Duke...
The Structure of Consensus: Cohesion and Hierarchy in Peer Networks
G. Robin GauthierDuke University
Partial support for this project thanks to NSF/HSD: 0624158 (Moody, McFarland & Gest, PIs), W. T. Grant Foundation 8316 & NIDA 1R01DA018225-01 (Osgood, Moody, Feinberg, Gest, PIs)
Main Question
• What accounts for variation in peer group consensus?
• What do I mean by consensus?– Group level agreement
• What has past literature shown broadly?– Shortened path lengths increases diffusion
(Friedkin 1986)
Outline
•Background Theory
•Theoretical Model and Expectations
•Data
•Simulation results
•Empirical Results

Network Theory I
Dependent VariableConsensus (on what?)
Attitudinal Agreement Friedkin, 1986; Martin, 2002
Correlation between Attitudes Martin, 1997
Peer Group Behaviors (especially delinquency)Anderson, 1964; Cohen, 1977
Theory II
Independent Variables• Network Transitivity– Cohesive Subgroups (Haynie, Anderson)– Communication and sanctioning power
• Hierarchy• Friedkin’s Model of Social Influence– How are the network structures Friedkin (1986)
analyzed empirically distributed?

Theoretical Model and ExpectationsDo Hierarchy and Cohesion each have a linear effect on
consensus, or do their effects depend on the combination of the two?
Low Cohesion High Cohesion
Low Hierarchy
High Hierarchy
?
?

Data
• National Longitudinal Study of Adolescent Health (Add Health)
• 125 Schools• 4019 Peer Groups– Fast and Greedy • Clauset, Newman and Moore, 2004
– Label Propagation• Raghavan, Albert and Kumara, 2007
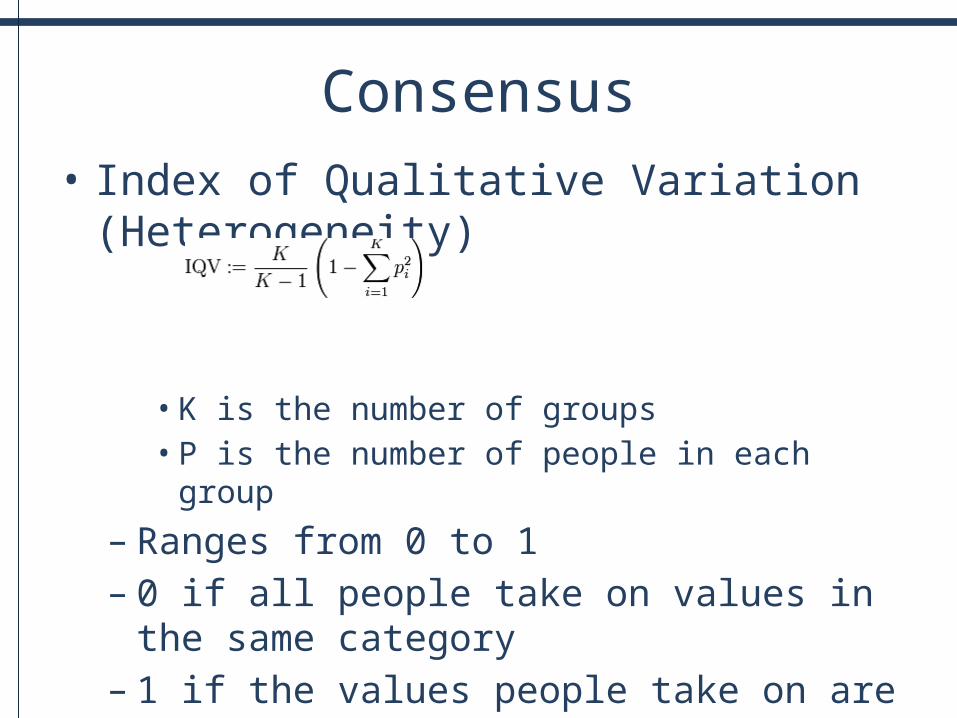
Consensus• Index of Qualitative Variation (Heterogeneity)
• K is the number of groups• P is the number of people in each group
– Ranges from 0 to 1– 0 if all people take on values in the same category– 1 if the values people take on are divided equally
across the categories
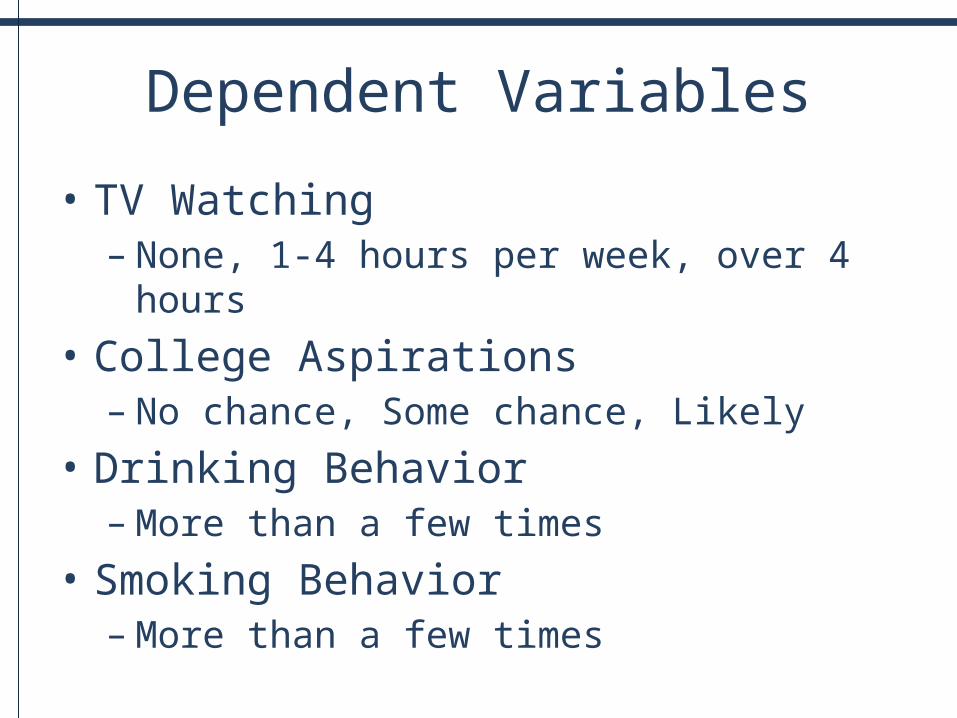
Dependent Variables
• TV Watching– None, 1-4 hours per week, over 4 hours
• College Aspirations– No chance, Some chance, Likely
• Drinking Behavior– More than a few times
• Smoking Behavior– More than a few times
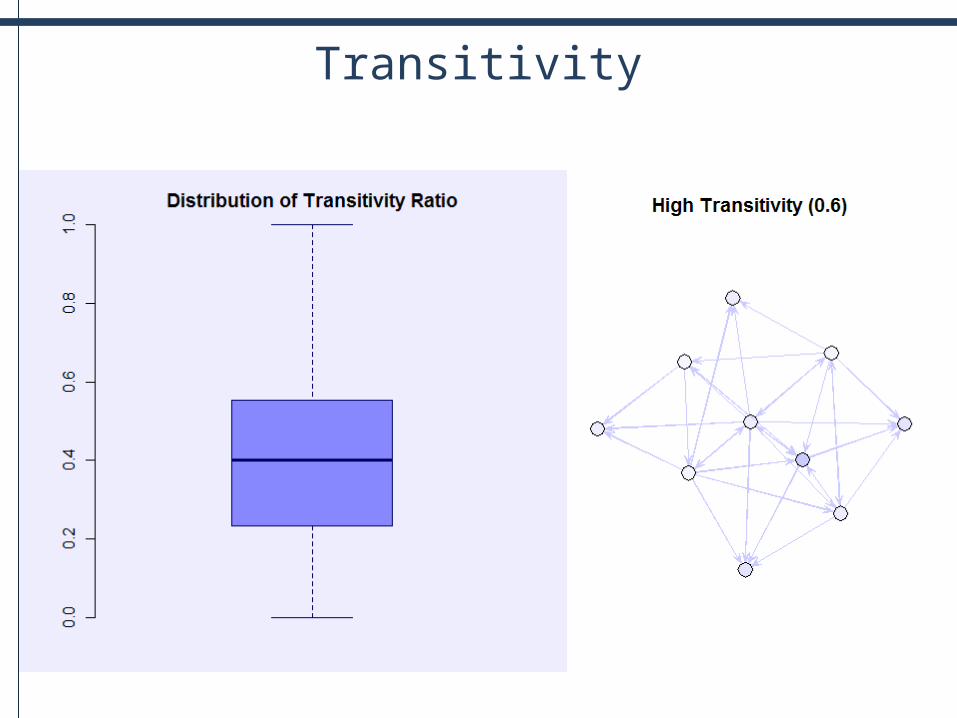
Transitivity
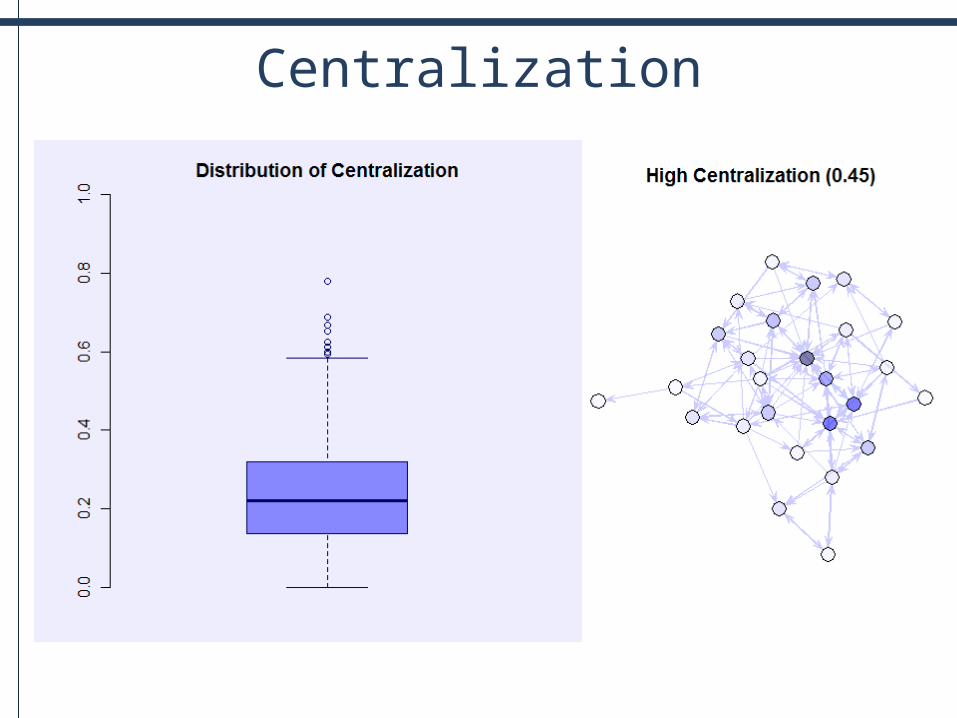
Centralization
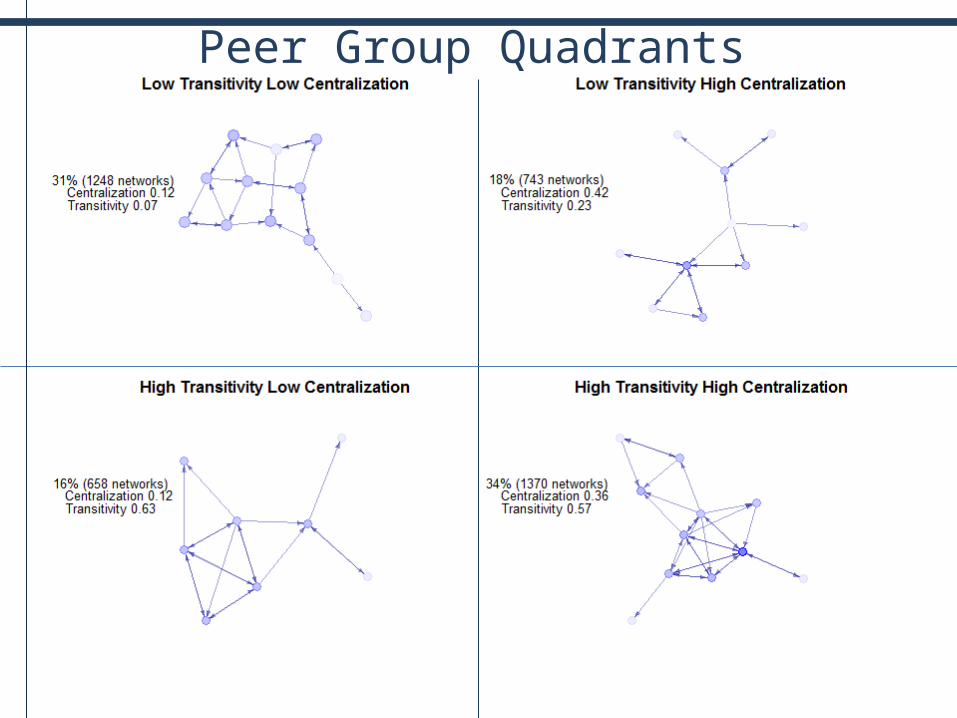
Peer Group Quadrants
Why Simulation
• Generate hypotheses for the off-diagonal cases
• Isolate social process • Clarify underlying assumptions
• Equilibrium model• Edges carry equal weight

Directed paths were modeled for each actor with a probability of 5% for transmission at each step
All uninfected adjacent actors remained susceptible through all steps until the network was saturated or 100 steps had been reached
The proportion of the network infected at each step was recorded
Step 1 Step 2 Step 3 Step 4
Simulation Process
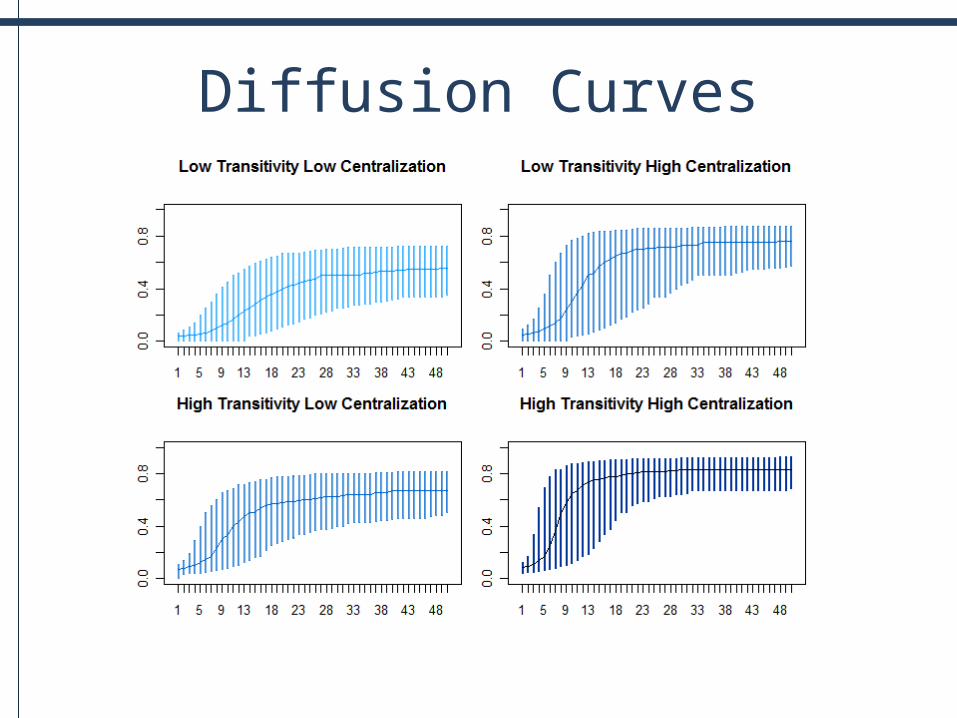
Diffusion Curves
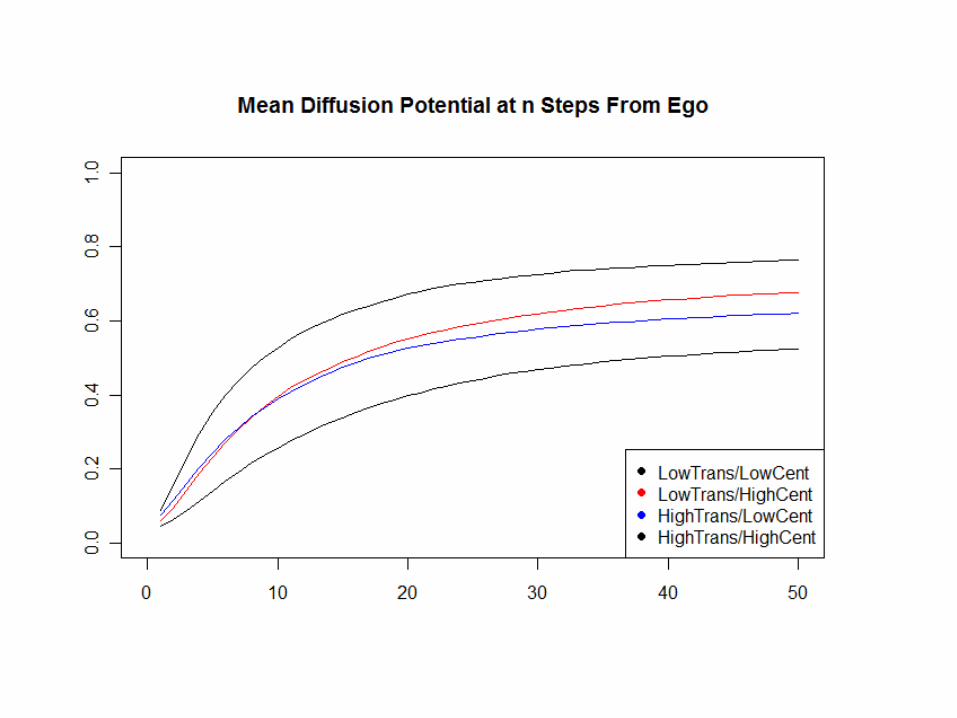
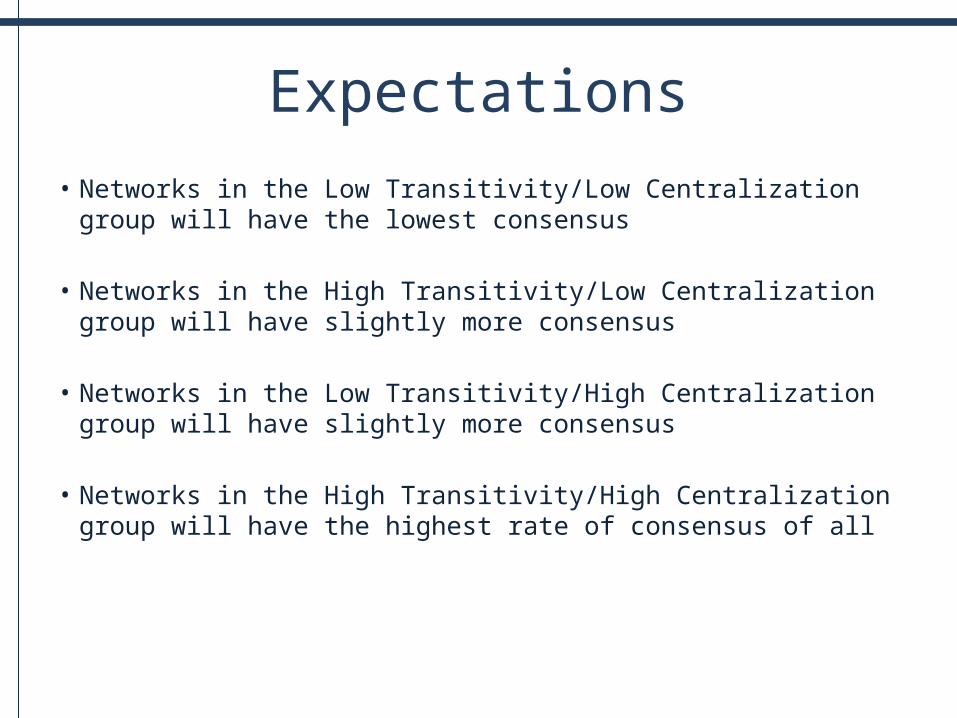
Expectations• Networks in the Low Transitivity/Low Centralization group will have the
lowest consensus
• Networks in the High Transitivity/Low Centralization group will have slightly more consensus
• Networks in the Low Transitivity/High Centralization group will have slightly more consensus
• Networks in the High Transitivity/High Centralization group will have the highest rate of consensus of all
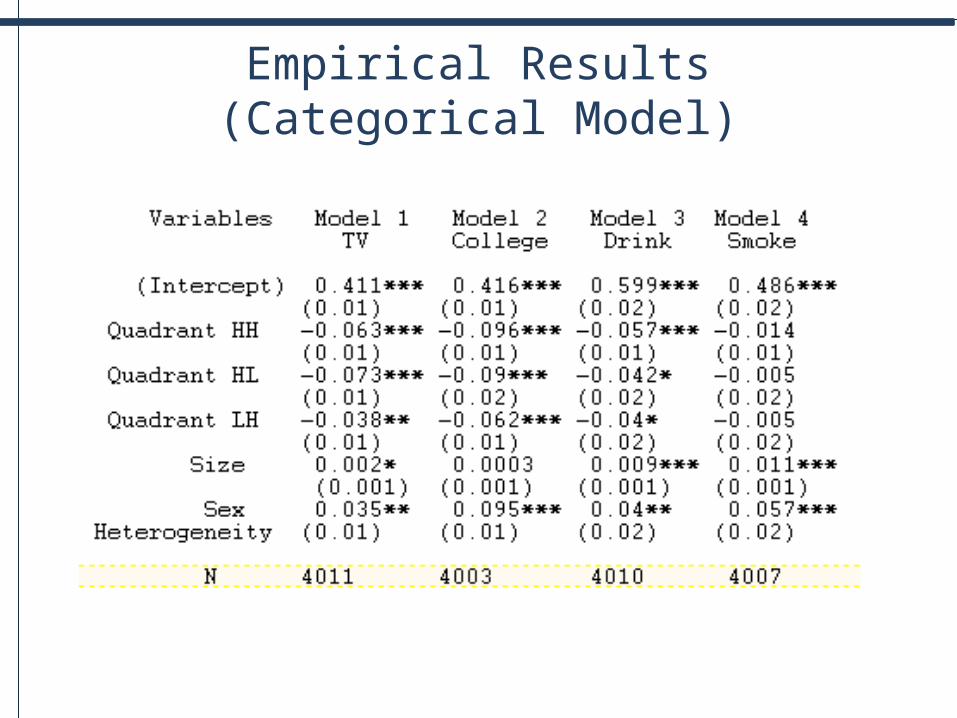
Empirical Results(Categorical Model)

Linear Models

Linear Model
Conclusion
• Both transitivity and centralization contribute to reducing heterogeneity (increasing consensus)
• Centralization is the weaker force• The effect of centralization depends of the
level of transitivity in the group

Thank You