The Stress-Velocity Relationship for Shock & Vibration By Tom Irvine.
29
The Stress-Velocity Relationship for Shock & Vibration By Tom Irvine
-
Upload
olivia-gibbs -
Category
Documents
-
view
250 -
download
2
Transcript of The Stress-Velocity Relationship for Shock & Vibration By Tom Irvine.

The Stress-Velocity Relationship for Shock & Vibration
By Tom Irvine
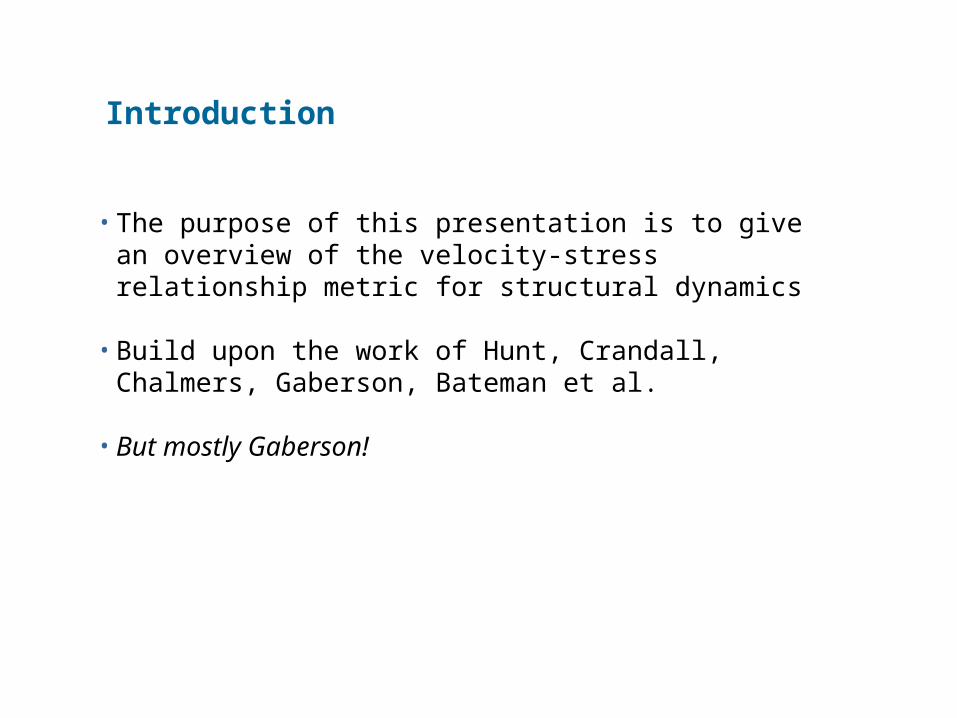
• The purpose of this presentation is to give an overview of the velocity-stress relationship metric for structural dynamics
• Build upon the work of Hunt, Crandall, Chalmers, Gaberson, Bateman et al.
• But mostly Gaberson!
Introduction

• Predicting whether an electronic component will fail due to vibration fatigue during a test or field service
Project Goals
Develop a method for . . . paperppppppssss
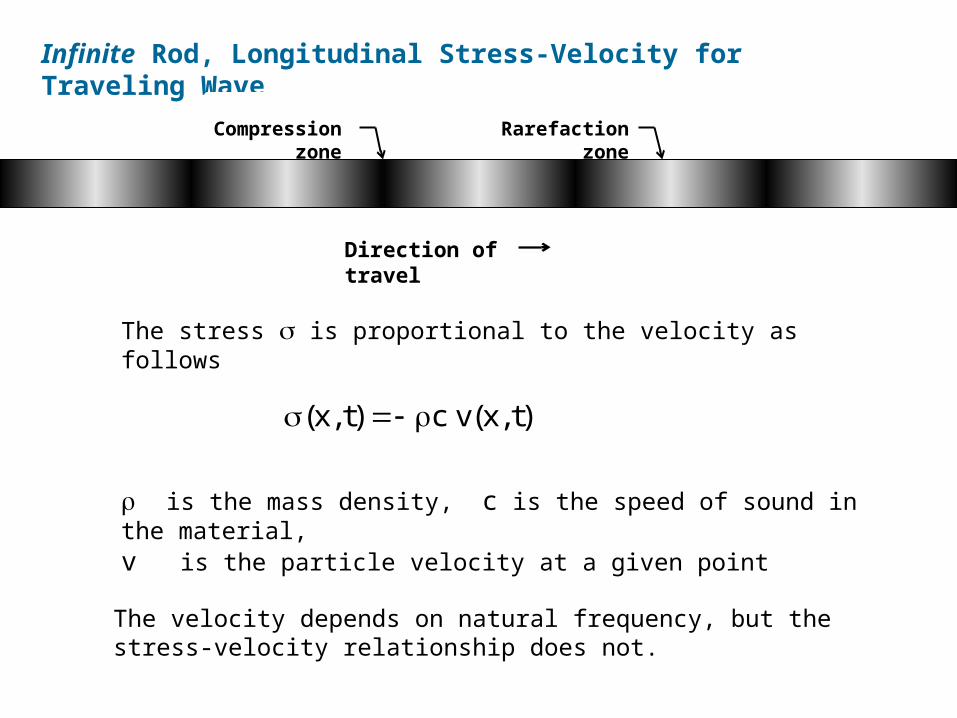
Infinite Rod, Longitudinal Stress-Velocity for Traveling Wave
The stress is proportional to the velocity as follows
Direction of travel
Compression zone Rarefaction zone
)t,x(vc)t,x(
is the mass density, c is the speed of sound in the material, v is the particle velocity at a given point
The velocity depends on natural frequency, but the stress-velocity relationship does not.

Finite Rod, Longitudinal Stress-Velocity for Traveling or Standing Wave
Direction of travel
max,nmaxn vc
• Same formula for all common boundary conditions• Maximum stress and maximum velocity may occur at different locations• Assume stress is due to first mode response only• Response may be due to initial conditions, applied force, or base excitation

Beam Bending, Stress-Velocity
• Same formula for all common boundary conditions• Maximum stress and maximum velocity may occur at different locations• Assume stress is due to first mode response only• Response may be due to initial conditions, applied force, or base excitation
Again,
max,nmax vI
AEc
c Distance to neutral axis
E Elastic modulus
A Cross section area
Mass per volume
I Area moment of inertia

Bateman’s Formula for Stress-Velocity
maxnmaxn VEC
where
C is a constant of proportionality dependent upon the geometry of the structure, often assumed for complex equipment to be
8C4
To do list: come up with case histories for further investigation & verification

• An empirical rule-of-thumb in MIL-STD-810E states that a shock response spectrum is considered severe only if one of its components exceeds the level
• Threshold = [ 0.8 (G/Hz) * Natural Frequency (Hz) ]
• For example, the severity threshold at 100 Hz would be 80 G
• This rule is effectively a velocity criterion
• MIL-STD-810E states that it is based on unpublished observations that military-quality equipment does not tend to exhibit shock failures below a shock response spectrum velocity of 100 inches/sec (254 cm/sec)
• Equation actually corresponds to 50 inches/sec. It thus has a built-in 6 dB margin of conservatism
• Note that this rule was not included in MIL-STD-810F or G, however
MIL-STD-810E, Shock Velocity Criterion

-300
-200
-100
0
100
200
300
0 0.005 0.010 0.015 0.020 0.025 0.030 0.035 0.040
TIME (SEC)
AC
CE
L (G
)ACCELERATION V-BAND/BOLT-CUTTER SEPARATION SOURCE SHOCK
The time history was measured during a shroud separation test for a suborbital launch vehicle.
V-band/Bolt-Cutter Shock

SRS Q=10 V-band/Bolt-Cutter Shock

Space Shuttle Solid Rocket Booster Water Impact
-100
-50
0
50
100
0 0.05 0.10 0.15 0.20
TIME (SEC)
AC
CE
L (
G)
ACCELERATION SRB WATER IMPACT FWD IEA
The data is from the STS-6 mission. Some high-frequency noise was filtered from the data.

SRS Q=10 SRB Water Impact, Forward IEA

-1000
-500
0
500
1000
0 0.5 1.0 1.5 2.0 2.5 3.0 3.5 4.0 4.5 5.0
TIME (SEC)
AC
CE
L (
G)
SR-19 Motor Ignition Static Fire Test Forward Dome
The combustion cavity has a pressure oscillation at 650 Hz.
SR-19 Solid Rocket Motor Ignition

SRS Q=10 SR-19 Motor Ignition

-10000
-5000
0
5000
10000
91.462 91.464 91.466 91.468 91.470 91.472 91.474 91.476 91.478
TIME (SEC)
AC
CE
L (
G)
ACCELERATION TIME HISTORY RV SEPARATION
The time history is a near-field, pyrotechnic shock measured in-flight on an unnamed rocket vehicle.
RV Separation, Linear Shaped Charge

SRS Q=10 RV Separation Shock

-0.5
-0.4
-0.3
-0.2
-0.1
0
0.1
0.2
0.3
0.4
0.5
0 5 10 15 20 25
TIME (SEC)
AC
CE
L (G
)ACCELERATION TIME HISTORY EL CENTRO EARTHQUAKE 1940
NORTH-SOUTH COMPONENT
El Centro (Imperial Valley) Earthquake
The magnitude was 7.1.

SRS Q=10 El Centro Earthquake North-South Component

SRS Q=10, Half-Sine Pulse, 10 G, 11 msec

Maximum Velocity & Dynamic Range of Shock Events
Event
MaximumPseudo Velocity
(in/sec)
VelocityDynamic Range
(dB)
RV Separation, Linear Shape Charge 526 31
SR-19 Motor Ignition, Forward Dome 295 33
SRB Water Impact, Forward IEA 209 26
Half-Sine Pulse, 50 G, 11 msec 125 32
El Centro Earthquake, North-South Component
31 12
Half-Sine Pulse, 10 G, 11 msec 25 32
V-band/Bolt-Cutter Source Shock 11 15
But also need to know natural frequency for comparison.

Sample Material Velocity Limits
MaterialE
(psi)
(psi)
(lbm/in^3)
Rod
Vmax
(in/sec)
Beam
Vmax
(in/sec)
Plate
Vmax
(in/sec)
Douglas Fir 1.92e+06 6450 0.021 633 366 316
Aluminum6061-T6
10.0e+06 35,000 0.098 695 402 347
MagnesiumAZ80A-T5
6.5e+06 38,000 0.065 1015 586 507
Structural Steel
29e+06 33,000 0.283 226 130 113
High StrengthSteel
29e+06 100,000 0.283 685 394 342

• Predicting whether an electronic component will fail due to vibration fatigue during a test or field service
Project Goals
Develop a method for . . .

• Predicting whether an electronic component will fail due to vibration fatigue during a test or field service
Project Goals
Develop a method for . . .
• Predicting whether an electronic component will fail due to vibration fatigue during a test or field service
Project Goals
Develop a method for . . .

• Predicting whether an electronic component will fail due to vibration fatigue during a test or field service
Project Goals
PUT IN YOUR OWN BEAM BENDING EXAMPLE

• Global maximum stress can be calculated to a first approximation with a course-mesh finite element model
Advantages
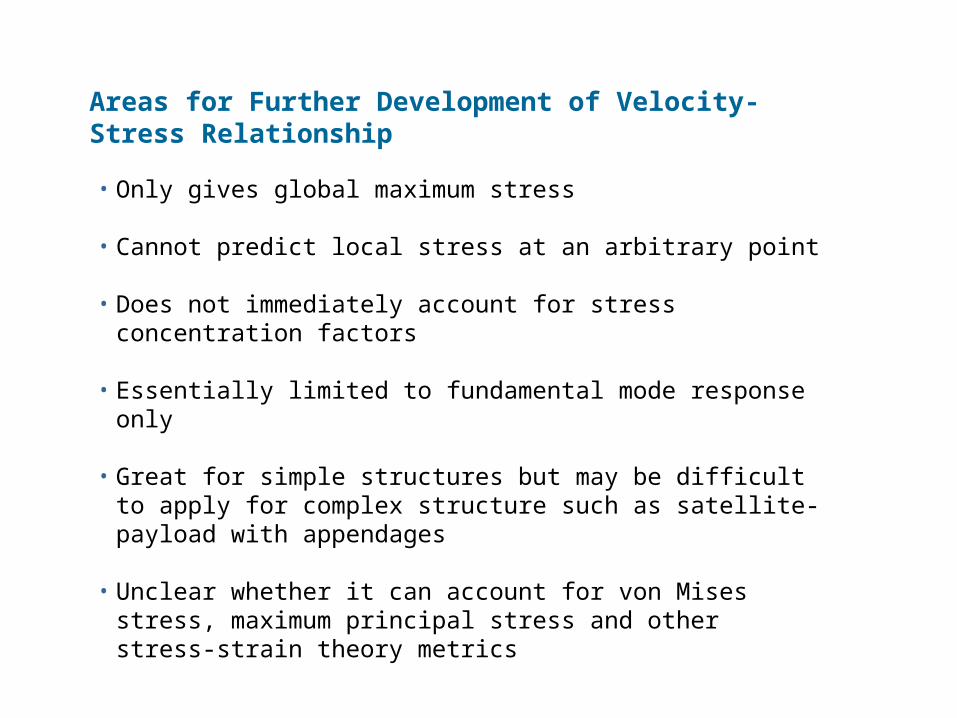
• Only gives global maximum stress
• Cannot predict local stress at an arbitrary point
• Does not immediately account for stress concentration factors
• Essentially limited to fundamental mode response only
• Great for simple structures but may be difficult to apply for complex structure such as satellite-payload with appendages
• Unclear whether it can account for von Mises stress, maximum principal stress and other stress-strain theory metrics
Areas for Further Development of Velocity-Stress Relationship

http://vibrationdata.wordpress.com/
Related software & tutorials may be freely downloaded from
Or via Email request
The tutorial paper include derivations.

• Stress-velocity relationship is useful, but further development is needed including case histories, application guidelines, etc.
• Dynamic stress is still best determined from dynamic strain
• This is especially true if the response is multi-modal and if the spatial distribution is needed
• The velocity SRS has merit for characterizing damage potential
• Tripartite SRS format is excellent because it shows all three amplitude metrics on one plot
Conclusions