The Status of Elderly in West Bengal, 2011 Bengal.pdfThe Status of Elderly in West Bengal, 2011...
122
The Status of Elderly in West Bengal, 2011
-
Upload
vuongkhuong -
Category
Documents
-
view
219 -
download
2
Transcript of The Status of Elderly in West Bengal, 2011 Bengal.pdfThe Status of Elderly in West Bengal, 2011...

The Status of Elderlyin West Bengal, 2011
The Status of Elderly in West Bengal, 2011

Building a Knowledge Base on Population Ageing in India
February 2014
The Status of Elderly in West Bengal, 2011

CONTRIBUTORS
Moneer Alam
Sumit Mazumdar
Indrani Chakravarty
Pratima Yadav

PAGE
iii
ACKNOWLEDGEMENTRecently, United Nations Population Fund and its collaborating institutions – Institute for Social
and Economic Change (Bangalore), Institute of Economic Growth (Delhi) and Tata Institute of Social
Sciences (Mumbai) – have successfully conducted an in-depth survey on ‘Building a Knowledge
Base on Population Ageing in India (BKPAI)’. The survey was conducted in seven major states of
the country, selected on the basis of speedier ageing and relatively higher proportions of the
elderly in the population. The successful completion of this survey was largely due to the seminal
contributions made by various institutions and individuals including the current and the former
UNFPA Country Representatives, Ms. Frederika Meijer and Mr. Nesim Tumkaya. The guidance and
dynamic leadership provided by Ms. Meijer led to the completion of the survey towards the end of
2011. The Directors of the collaborating institutions have provided extensive support throughout
the period of this survey and its subsequent data analysis, which was published in the form of a
comprehensive report, Report on the Status of Elderly in Select States of India, 2011, in November 2012.
Both during the release ceremony of the report and thereafter, it was strongly felt by the Technical
Advisory Committee (TAC) of the project and many other experts that a separate state level report
be brought out for each of the seven states included in the report published in 2012. These experts
have also advised that the reports be widely disseminated at state level so as to initiate a dialogue
not only with civil society organizations but also with the state government and its officials.
This volume is largely in response to those suggestions.
The authors are thankful for overall guidance and technical directions provided by the BKPAI
Coordinators. We also express our sincere gratitude to Professor P.M. Kulkarni for providing the
technical support that led to the finalization of this report. Our entire team – authors, contributors
and researchers – benefitted from the critical insights of a number of luminaries, experts, social
scientists and members of our Technical Advisory Committee including Professors K. Srinivasan,
S. Irudaya Rajan, Arvind Pandey and Tulsi Patel. We would also like to thank all the participants of the
state report finalization workshop organized jointly by the partner institutions at Manesar (Haryana).
Several individuals and officials of Government of West Bengal including Mrs. Nilanjana
Sengupta (Deputy Director, Ministry of Panchayat and Rural Development), Mr. Subhranshu Das
(Assistant Director, Food Department), Mr. P.K. Samanta (Former Secretary, Department of Social
Welfare), Dr. Pradip Malhotra (State Advisor, Non-Communicable Diseases), Mr. Debashis Bose
(Joint Secretary, Health and Family Welfare), Dr. Saumitra Basu (Research Associate, Calcutta
Metropolitan Institute of Gerontology) and Help Age India (Kolkata) have helped immensely by
providing substantial data and information support. We sincerely thank all of them.

PAGE
iv
We gratefully acknowledge the dedicated support of our partner institutions and their staff. In
particular, we would like to thank Professor Manoj Panda (Director, Institute of Economic Growth)
for his unconditional support all through this study. We are also very grateful to Ms. Isha Chaudhry,
a bright post-graduate in Development Economics from University of Sussex, for her support in
finalizing the report.
We owe a debt of gratitude to Mr. Navin Joneja and Mrs. Marie Joneja of Mensa Design Pvt. Ltd. for
their patience and excellent editorial support.
As always, the UNFPA team has been extremely generous and provided us every support in making
this work possible. Our special thanks are due to all of them. We are also grateful to UNFPA for
agreeing to upload this volume on their web site and later, provide a dedicated web space for this
and many other forthcoming studies under the aegis of this project.
The responsibility for any errors or omissions, however, is ours alone and not that of the individuals
or institutions who have so generously supported us.
Authors
February 2014

PAGE
v
ACRONYMSADL Activities of Daily Living
APL Above Poverty Line
AYUSH Ayurveda, Yoga and Naturopathy, Unani, Siddha and Homeopathy
BKPAI Building a Knowledge Base on Population Ageing in India
BPL Below Poverty Line
BY Briddhashree Yojana
CMIG Calcutta Metropolitan Institute of Gerontology
COPD Chronic Obstructive Pulmonary Disease
CPRC Chronic Poverty Research Centre
DCC Day Care Centres
DK Don’t Know
DMO District Magistrate’s Office
ESHG Elderly Self-Help Group
FY Financial Year
GHQ General Health Questionnaire
GoWB Government of West Bengal
HCE Health Care for Elderly
HH Household
HR Human Resource
IADL Instrumental Activities of Daily Living
IAY Indira Awas Yojana
ICF International Classification of Functioning, Disability and Health
ICICI Industrial Credit and Investment Corporation of India
IEG Institute of Economic Growth
IGNDPS Indira Gandhi National Disability Pension Scheme
IGNOAPS Indira Gandhi National Old Age Pension Scheme
IGNWPS Indira Gandhi National Widow Pension Scheme
IMA Indian Medical Association
IPOP Integrated Programme for Older Persons
ISEC Institute for Social and Economic Change
IT Information Technology
KMC Kolkata Medical College
LPG Liquefied Petroleum Gas
MGNREGA Mahatma Gandhi National Rural Employment Guarantee Act
MIPAA Madrid International Plan of Action on Ageing
MMU Mobile Medicare Unit

PAGE
vi
MORD Ministry of Rural Development
MOSJE Ministry of Social Justice and Empowerment
MPCE Monthly Per Capita Consumer Expenditure
NA Not Available
NCDs Non-communicable Diseases
NFBS National Family Benefit Scheme
NGO Non Governmental Organization
NHB National Housing Bank
NLM National Literacy Mission
NPHCE National Programme for Health Care of the Elderly
NPOP National Policy on Older Persons
NRI Non Resident Indian
NSAP National Social Assistance Plan
NSSO National Sample Survey Organisation
OAH Old Age Home
OAPS Old Age Pension Scheme
OBC Other Backward Classes
OPD Out Patient Department
PDS Public Distribution System
PPP Public-Private Partnership
PPS Probability Proportional to Population Size
PRC Population Research Centre
PSU Primary Sampling Unit
RDCS Residential and Day Care Services
RGGVY Rajiv Gandhi Grameen Vidyutikaran Yojana
RSBY Rashtriya Swasthya Bima Yojana
SC Scheduled Caste
SES Socio-economic Status
SRH Self-Rated Health
SRS Sample Registration System
ST Scheduled Tribe
SUBI Subjective Well Being Inventory
SWB Subjective Well Being
TAC Technical Advisory Committee
TISS Tata Institute of Social Sciences
TSC Total Sanitation Campaign
UCO Bank United Commercial Bank
UNFPA United Nations Population Fund
VYSC Varishtha Yojana for Senior Citizens

PAGE
vii
CONTENTS
Acknowledgement iii
Acronyms v
1. Background 1
2. Sample Households and Elderly Population 3
2.1 Household Characteristics 4
2.2 Profile of the Elderly 5
3. Work, Income and Assets 8
3.1 Work Participation Rate and Work Intensity 8
3.2 Need for Current Work 9
3.3 Reasons for Not Working 10
3.4 Work Benefits 11
3.5 Personal Income of the Elderly 12
3.6 Economic Contribution of the Elderly to the Family 13
3.7 Economic Dependence 14
3.8 Asset Ownership 15
4. Living Arrangement and Family Relations 18
4.1 Type of Living Arrangement and Reasons for Living Alone 18
4.2 Level of Satisfaction with Present Living Arrangement 20
4.3 Preferred Living Arrangements 21
4.4 Family Interaction and Monetary Transactions 21
4.5 Engagement in Family Activities and Decision Making 22
4.6 Social Engagement 23
4.7 Elderly Abuse 25

PAGE
viii
5. Health and Subjective Well-Being 27
5.1 Self-rated Health, Functionality and Well-Being 27
5.2 Morbidity, Health Care Access and Financing 36
6. Social Security 46
6.1 Introduction 46
6.2 Overview of the Social Security Schemes 47
6.3 Awareness of Major Social Security Schemes 53
6.4 Coverage and Financing of Major Social Security Schemes 54
6.5 Emerging Issues of Social Security Schemes for the Elderly 58
6.6 Summary of Findings and Policy Direction 59
7. The Way Forward 60
Appendices 65
References 98
Details of Contributors 101
BKPAI Project Coordinators 103

PAGE
ix
List of Tables
3.1: Per cent distribution of elderly by asset ownership according to place of residence and sex, West Bengal 2011 16
4.1: Percentage of elderly by participation in various activities according to place of residence and sex, West Bengal 2011 23
4.2: Per cent distribution of elderly by the frequency of attending any public meetings one year preceding the survey by place of residence and sex, West Bengal 2011 24
4.3: Per cent distribution of the elderly attending religious programmes or services (excluding weddings and funerals) in the one year preceding the survey by place of residence and sex, West Bengal 2011 24
4.4: Per cent distribution of the elderly by experience of abuse after turning 60 and in the month preceding the survey according to place of residence and sex, West Bengal 2011 25
5.1: Percentage of elderly classified based on GHQ-12 and SUBI according to select background characteristics, West Bengal 2011 33
5.2: Average expenditure (in last episode) on hospitalization by type of hospitals according to major heads, West Bengal 2011 44
6.1: Major social security schemes for the elderly in West Bengal 48
6.2: Coverage of various social security schemes for elderly in West Bengal in recent years 55
6.3: Per cent distribution of elderly awareness and coverage under Rashtriya Swasthya Bima Yojana (RSBY) by place of residence and sex, West Bengal 2011 58
Appendix Tables 66
2.1: Per cent distribution of elderly households by select household and housing characteristics according to place of residence, BKPAI survey and census, West Bengal 2011 66
2.2: Percentage of elderly households with various possessions, loan and support system according to place of residence, BKPAI survey and census, West Bengal 2011 67
2.3: Per cent distribution of elderly by select background characteristics, West Bengal 2011 69
3.1: Percentage of elderly currently working or ever worked according to place of residence and sex, West Bengal 2011 70
3.2: Percentage of elderly according to their work status and intensity of work by background characteristics, West Bengal 2011 70

PAGE
x
3.3: Per cent distribution of currently working elderly by type of occupation and sector of employment according to place of residence and sex, West Bengal 2011 72
3.4: Per cent distribution of currently working elderly by the need to work according to background characteristics, West Bengal 2011 73
3.5: Percentage of elderly receiving work benefits by background characteristics, West Bengal 2011 74
3.6: Per cent distribution of elderly by annual personal income according to place of residence and sex, West Bengal 2011 75
3.7: Percentage of elderly by sources of current personal income according to place of residence and sex, West Bengal 2011 75
3.8: Per cent distribution of elderly by their perceived magnitude of contribution towards household expenditure according to place of residence and sex, West Bengal 2011 75
3.9: Per cent distribution of elderly by their financial dependency status and main source of economic support according to place of residence and sex, West Bengal 2011 76
4.1: Per cent distribution of elderly by type of living arrangement according to select background characteristics, West Bengal 2011 76
4.2: Per cent distribution of elderly by preferred living arrangement in old age according to present living arrangement and sex, West Bengal 2011 77
4.3: Percentage of elderly with no meeting and no communication between elderly and their non co-residing children, West Bengal 2011 78
4.4: Percentage of elderly by participation in various activities according to age groups, West Bengal 2011 79
4.5: Per cent distribution of elderly by their main reason for not going out more, according to place of residence and sex, West Bengal 2011 79
4.6: Per cent distribution of elderly by experience of abuse after turning 60 and in the month preceding the survey according to select background characteristics, West Bengal 2011 79
5.1: Percentage of elderly by self rated health status according to place of residence and sex, West Bengal 2011 81
5.2: Percentage of elderly by self rated health according to select background characteristics, West Bengal 2011 81
5.3: Percentage of elderly needing full/partial assistance in ADL activities according to place of residence and sex, West Bengal 2011 82
5.4: Percentage of elderly by IADL limitations according to place of residence and sex, West Bengal 2011 83

PAGE
xi
5.5: Percentage of elderly by ADL and IADL limitations according to background characteristics, West Bengal 2011 83
5.6: Percentage of elderly by full/partial disability according to place of residence and sex, West Bengal 2011 84
5.7: Percentage of elderly by full/partial locomotor disability according to background characteristics, West Bengal 2011 85
5.8: Percentage of elderly using disability aids according to sex and place of residence, West Bengal 2011 85
5.9: Percentage of elderly classified based on General Health Questionnaire (GHQ-12) and 9 items Subjective Well-Being Inventory (SUBI) according to place of residence and sex, West Bengal 2011 86
5.10: Percentage of elderly classified based on 9 items of SUBI according to age and sex, West Bengal 2011 86
5.11: Percentage of elderly by ability to immediate recall of words (out of ten words) according to place of residence and sex, West Bengal 2011 86
5.12: Percentage of elderly by personal health habits or risky health behaviours according to place of residence and sex, West Bengal 2011 87
5.13: Percentage of elderly undergoing routine medical check-ups with the frequency and presently under medical care, according to place of residence and sex, West Bengal 2011 87
5.14: Percentage of elderly reporting any acute morbidity according to place of residence and sex, West Bengal 2011 88
5.15: Prevalence rate (per 1000) of the elderly reporting any acute morbidity according to select background characteristics, West Bengal 2011 88
5.16: Per cent distribution of last episode of acute morbidities pattern among elderly by sex and place of residence, West Bengal 2011 89
5.17: Percentage of acute morbidity episodes for which treatment was sought according to place of residence and sex, West Bengal 2011 89
5.18: Per cent distribution of elderly by source of treatment for the last episode of acute morbidity according to place of residence and sex, West Bengal 2011 89
5.19: Per cent distribution of elderly seeking treatment for last episode of acute morbidity according to select background characteristics, West Bengal 2011 90
5.20: Average expenditure made for treatment of acute morbidities according to major heads and source of treatment, West Bengal 2011 90
5.21: Per cent distribution of elderly by source of payment for last episode of acute morbidity according to sex, West Bengal 2011 91
5.22: Prevalence rate (per 1,000) of chronic morbidities among elderly according to place of residence and sex, West Bengal 2011 91

PAGE
xii
5.23: Prevalence rate (per 1,000) of common chronic morbidities among the elderly according to selected background characteristics, West Bengal 2011 92
5.24: Percentage of elderly seeking treatment for common chronic ailments during last 3 months according to sex and place of residence, West Bengal 2011 92
5.25: Per cent distribution of elderly by reason for not seeking any treatment for common chronic morbidities, West Bengal 2011 93
5.26: Per cent distribution of elderly by source of payment for treatment of common chronic morbidities according to sex, West Bengal 2011 93
5.27: Per cent distribution of diseases as the reason for hospitalization (last episode) among elderly according to sex and place of residence, West Bengal 2011 94
5.28: Per cent distribution of elderly by source of hospitalization care (last episode) according to place of residence and sex, West Bengal 2011 94
5.29: Per cent distribution of elderly by source of payment for last hospitalization episode according to place of residence and sex, West Bengal 2011 95
6.1: Per cent distribution of elderly aware of national social security schemes according to place of residence, sex and BPL and non-BPL households, West Bengal 2011 95
6.2: Per cent distribution of elderly utilizing national social security schemes according to place of residence, sex and BPL and non-BPL status, West Bengal 2011 96
6.3: Per cent distribution of elderly by awareness and utilization of special government facilities/schemes according to place of residence and sex, West Bengal 2011 97
6.4: Performance of Indira Awas Yojana (IAY) in West Bengal 97
List of Figures
2.1: Population Aged 60 years and above according to Census 2001 and 2011 4
2.2: Monthly per capita consumption expenditure of elderly households according to place of residence, West Bengal 2011 5
2.3: Sex ratio (females per 1,000 males), West Bengal 2011 6
2.4: Elderly by marital status according to sex, West Bengal 2011 6
3.1: Currently working elderly by age and sex, West Bengal 2011 8
3.2: Main workers and those working more than 4 hours a day among elderly workers, West Bengal 2011 9
3.3: Elderly working due to compulsion by place of residence and sex, West Bengal 2011 10
3.4: Elderly working due to compulsion by age, caste and wealth quintile, West Bengal 2011 10

PAGE
xiii
3.5: Five major reasons for elderly currently not working by sex, West Bengal 2011 11
3.6: Elderly by work benefits they receive according to sex, West Bengal 2011 11
3.7: Elderly by annual personal income by sex, West Bengal 2011 12
3.8: Elderly with no income by wealth quintile and sex, West Bengal 2011 12
3.9: Elderly by sources of current personal income according to sex, West Bengal 2011 13
3.10: Elderly providing economic contribution to household expenditure by place of residence and sex, West Bengal 2011 14
3.11: Elderly by their perceived magnitude of contribution towards household expenditure according to sex, West Bengal 2011 14
3.12: Elderly by their financial dependency status and main source of economic support according to sex, West Bengal 2011 15
4.1: Living arrangement of the elderly by sex, West Bengal 2011 18
4.2: Elderly women living alone in seven select states, 2011 19
4.3: Main reasons for living alone or with spouse only according to place of residence and sex, West Bengal 2011 19
4.4: Elderly comfortable or satisfied with present living arrangement by place of residence and sex, West Bengal 2011 20
4.5: Elderly who think they live with their children rather than children living with them by age and marital status, West Bengal 2011 20
4.6: Preferred living arrangement of the elderly by sex, West Bengal 2011 21
4.7: Elderly with no meeting or no communication with their non co-residing children according to sex, West Bengal 2011 22
4.8: Elderly who have monetary transfer between them and their non co-residing children by place of residence, West Bengal 2011 22
4.9: Elderly reporting no role in various decision making activities according to sex, West Bengal 2011 23
4.10: Forms and sources of abuse faced by elderly after age 60, West Bengal 2011 25
4.11: Sources of abuse among elderly who reported any abuse in the month preceding the survey by place of residence and sex, West Bengal 2011 26
5.1: Self-rated current health status by age and sex, West Bengal 2011 27
5.2: Self-rated current health status by marital status, caste and highest and lowest wealth quintile, West Bengal 2011 28
5.3: Elderly needing full/ partial assistance in at least one ADL domain by sex and place of residence, West Bengal 2011 29
5.4: Elderly needing full/partial assistance by ADL domains according to age groups, West Bengal 2011 29

PAGE
xiv
5.5: Elderly who cannot perform any IADL activity according to sex, place of residence and age, West Bengal 2011 30
5.6: Elderly by type of disability and age, West Bengal 2011 31
5.7: Elderly using disability aids according to age and sex, West Bengal 2011 31
5.8: Mean number of words immediately recalled by the elderly according to select background characteristics, West Bengal 2011 34
5.9: Elderly who currently have risky health habits by age group, West Bengal 2011 35
5.10: Prevalence rate of acute morbidity per 1000 elderly according to select background characteristics, West Bengal 2011 37
5.11: Acute morbidity episode (last episode) for which treatment was sought according to place of residence, sex and age, West Bengal 2011 38
5.12: Average expenditure on treatment of last episode of acute morbidities by type of facility and select background characteristics, West Bengal 2011 39
5.13: Prevalence of seven common chronic ailments among per 1,000 elderly by sex, age and place of residence, West Bengal 2011 40
5.14: Elderly by source of treatment of common chronic morbidities, West Bengal 2011 41
5.15: Average monthly expenditure on treatment of common chronic morbidities by source of treatment, West Bengal 2011 42
5.16: Elderly hospitalized one year preceding the survey according to sex, place of residence, age and wealth quintile, West Bengal 2011 42
5.17: Elderly with persons accompanying them during hospital stay (last episode) by sex, West Bengal 2011 43
5.18: Average expenditure (in last episode) on hospitalization by wealth quintile, caste and BPL/APL category, West Bengal 2011 44
6.1: Elderly by preferred support system in old age according to sex and BPL/APL household category, West Bengal 2011 47
6.2: Elderly aware of national social security schemes according to sex and BPL/non-BPL household category, West Bengal 2011 54
6.3: Elderly utilizing national social security schemes according to sex for BPL households, West Bengal 2011 55
6.4: Elderly utilizing national social security schemes according to wealth quintile and caste/tribe, West Bengal 2011 56
6.5: Elderly utilizing the facilities/schemes by lowest and highest wealth quintile, West Bengal 2011 57
6.6: Elderly covered under health insurance and other policies by sex, West Bengal 2011 57
PAGE
1
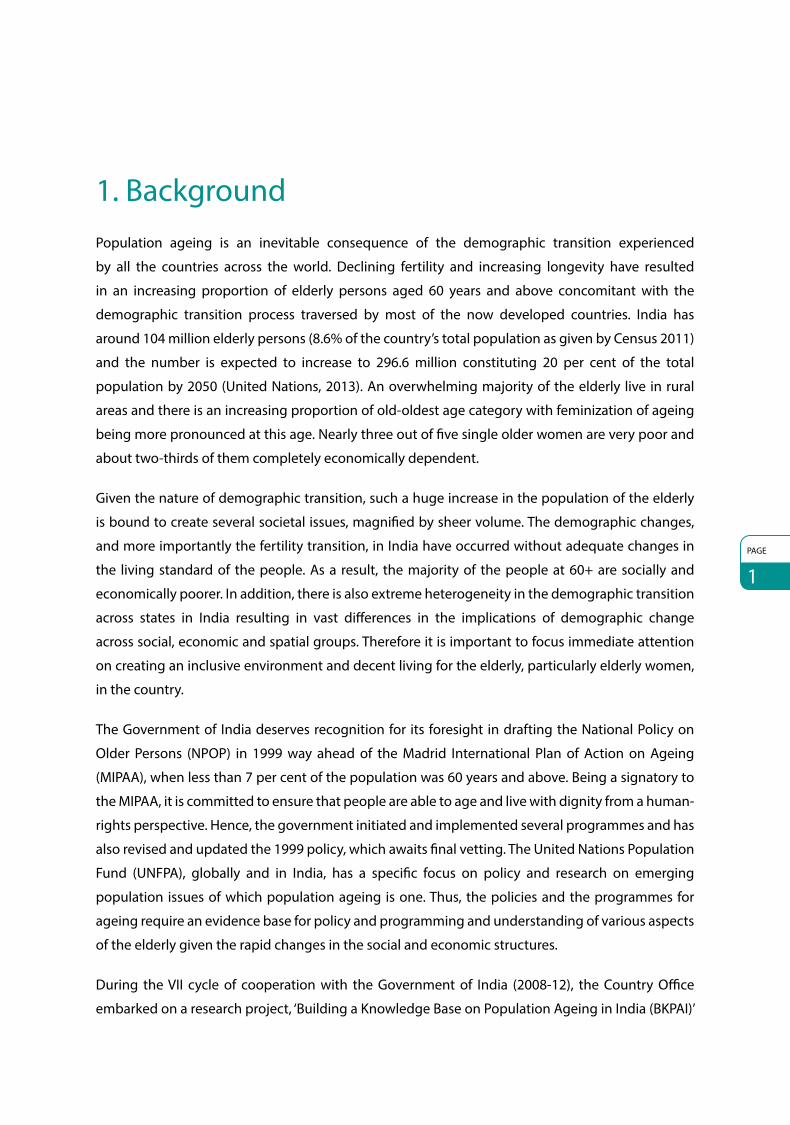
1. BackgroundPopulation ageing is an inevitable consequence of the demographic transition experienced
by all the countries across the world. Declining fertility and increasing longevity have resulted
in an increasing proportion of elderly persons aged 60 years and above concomitant with the
demographic transition process traversed by most of the now developed countries. India has
around 104 million elderly persons (8.6% of the country’s total population as given by Census 2011)
and the number is expected to increase to 296.6 million constituting 20 per cent of the total
population by 2050 (United Nations, 2013). An overwhelming majority of the elderly live in rural
areas and there is an increasing proportion of old-oldest age category with feminization of ageing
being more pronounced at this age. Nearly three out of five single older women are very poor and
about two-thirds of them completely economically dependent.
Given the nature of demographic transition, such a huge increase in the population of the elderly
is bound to create several societal issues, magnified by sheer volume. The demographic changes,
and more importantly the fertility transition, in India have occurred without adequate changes in
the living standard of the people. As a result, the majority of the people at 60+ are socially and
economically poorer. In addition, there is also extreme heterogeneity in the demographic transition
across states in India resulting in vast differences in the implications of demographic change
across social, economic and spatial groups. Therefore it is important to focus immediate attention
on creating an inclusive environment and decent living for the elderly, particularly elderly women,
in the country.
The Government of India deserves recognition for its foresight in drafting the National Policy on
Older Persons (NPOP) in 1999 way ahead of the Madrid International Plan of Action on Ageing
(MIPAA), when less than 7 per cent of the population was 60 years and above. Being a signatory to
the MIPAA, it is committed to ensure that people are able to age and live with dignity from a human-
rights perspective. Hence, the government initiated and implemented several programmes and has
also revised and updated the 1999 policy, which awaits final vetting. The United Nations Population
Fund (UNFPA), globally and in India, has a specific focus on policy and research on emerging
population issues of which population ageing is one. Thus, the policies and the programmes for
ageing require an evidence base for policy and programming and understanding of various aspects
of the elderly given the rapid changes in the social and economic structures.
During the VII cycle of cooperation with the Government of India (2008-12), the Country Office
embarked on a research project, ‘Building a Knowledge Base on Population Ageing in India (BKPAI)’

PAGE
2
BKPAI: West Bengal
with two main components: (i) research using secondary data; and (ii) collecting primary data
through sample surveys on socio-economic status, health and living conditions of the elderly that
can be used for further research, advocacy and policy dialogue. This project was coordinated by the
Population Research Centre (PRC) at the Institute for Social and Economic Change (ISEC), Bangalore
and the Institute of Economic Growth (IEG), Delhi. Collaboration with the Tata Institute of Social
Sciences (TISS), Mumbai was initiated at a later stage for developing an enabling environment
through advocacy and networking with stakeholders. In order to fill the knowledge gaps identified
by these papers, a primary survey was carried out in seven states – Himachal Pradesh, Kerala,
Maharashtra, Odisha, Punjab, Tamil Nadu and West Bengal – having a higher percentage of
population in the age group 60 years and above compared to the national average.
In this study, the sample for each state was fixed at 1,280 elderly households. The sample size
was equally split between urban and rural areas and 80 primary sampling units (PSUs) equally
distributed between rural and urban areas selected using probability proportion to the population
size (PPS). The details about survey such as sampling procedures, survey protocols, questionnaire
contents and definitions and computations of different indicators are available in the Report on the
Status of Elderly in Select States of India, 2011 – Sample Design, Survey Instruments, and Estimates of
Sampling Errors.
This report is the outcome of the survey carried out in West Bengal from May to July 2011, as part
of the seven-state study by Sigma Consultancy Organisation, New Delhi. The report consists of
seven sections, where the first section provides a brief introduction; the second section discusses
the profile of elderly households and individual elderly; the third section is on work, income and
asset holdings among the elderly; section four covers the living arrangements and family relations;
section five provides information on the health status of the elderly including subjective and mental
health, morbidity – acute and chronic – and hospitalization, access of health care and financing;
section six covers social security in old age; and the last section is the way forward.

PAGE
3
2. Sample Households and Elderly PopulationWest Bengal, a state located in the eastern part of India and bordered by Bhutan and Sikkim in the
north and Bangladesh in the east, is one of the most populous states of the country with about
7.5 per cent of the country’s total population, or a little over 91.3 million in absolute numbers
(Census of India, 2011). According to Encyclopaedia Britannica, the word ‘Bengal’ or ‘Bangla’ was
derived from the ancient kingdom of ‘Vanga’ or ‘Banga’, which suggests the historical roots of the
state and antiquity of its culture (Britannica Online Encyclopedia).
West Bengal has been a success story in the realm of its demographics, and started witnessing
improvement in its demographic parameters decades ago despite a large rural population, various
economic inadequacies, low levels of industrialization, too much reliance on agriculture coupled
with high female illiteracy – especially in rural areas – undermining women’s empowerment
(Planning Commission 2010; Mukherjee 2004). Currently, the state compares fairly well with many
other progressive states in the country including the high-performing states like Punjab, Himachal
Pradesh, Kerala, Tamil Nadu.
Along with lower birth and death rates, the expected lifespan of the people in West Bengal is also
projected to remain higher than the national average. To illustrate, life expectancy at birth of an
average person (e0) in West Bengal was estimated to be 69 years during 2006–10 as compared
to 68.9 years in Tamil Nadu and 67.2 years in Karnataka. The only two states with higher life
expectancies than West Bengal were Kerala where e0 was estimated at 74.2 years and Punjab, where
e0 was marginally higher at 69.3 years (Sample Registration System 2012). An almost similar pattern
emerges at the later ages as well.
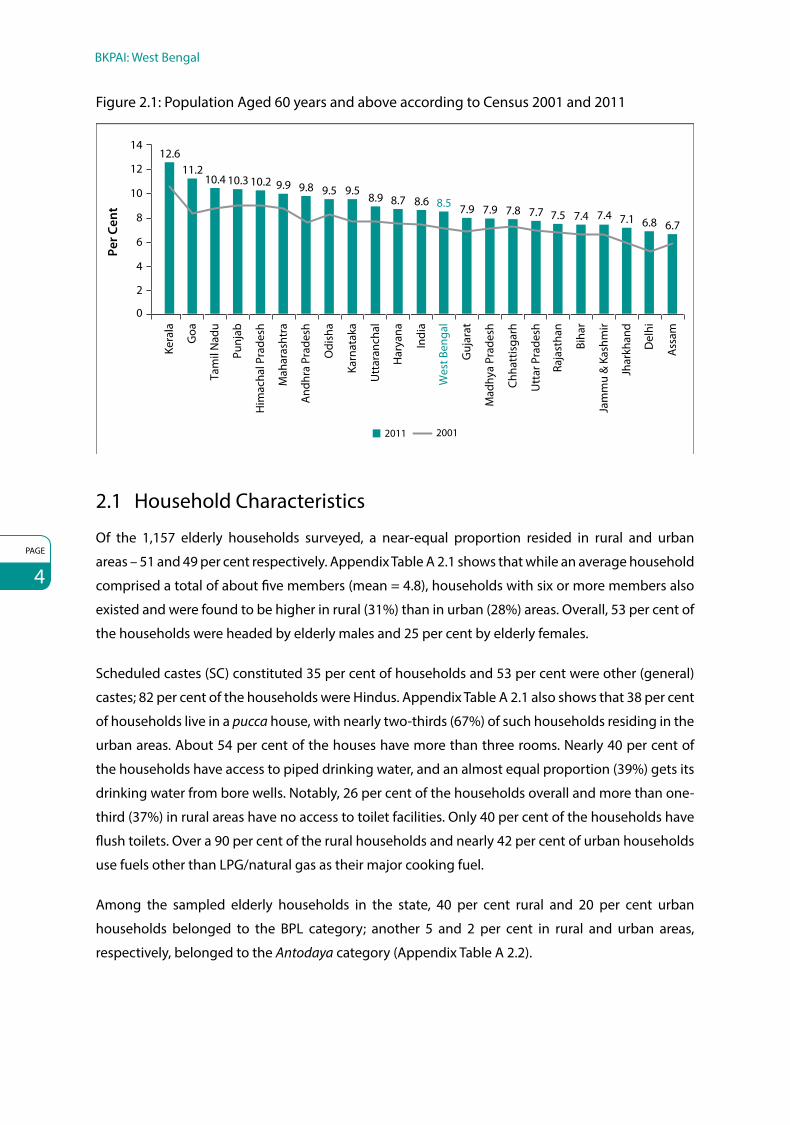
West Bengal is no exception to the dynamics of population ageing in the country (Fig. 2.1). There
are 74,90,514 persons (51.4% males and 48.6% females) above 60 years of age with 68 per cent
residing in rural areas and 32 per cent residing in the urban locales. Around 33 per cent of the total
elderly population is below poverty line (BPL) (Kumar and Anand 2006). The decadal growth rate
of 60+ populations in West Bengal, projected by the Technical Group of Population Projections,
National Commission on Populations, indicates that over the next few years, the state will undergo
a huge demographic shift and while the total population is projected to rise by 26 per cent in
the year 2026 as compared to the base year of 2001, population of 60+ age groups will rise by
170 per cent over the same period (Central Statistics Office 2011).
PAGE
4
BKPAI: West Bengal
Figure 2.1: Population Aged 60 years and above according to Census 2001 and 2011
12.611.2
10.4 10.3 10.2 9.9 9.8 9.5 9.58.9 8.7 8.6 8.5 7.9 7.9 7.8 7.7 7.5 7.4 7.4 7.1 6.8 6.7
2
0
4
6
8
10
12
14
Kera
la
Goa
Tam
il N
adu
Punj
ab
Him
acha
l Pra
desh
Mah
aras
htra
And
hra
Prad
esh
Odi
sha
Karn
atak
a
Utt
aran
chal
Har
yana
Indi
a
Wes
t Ben
gal
Guj
arat
Mad
hya
Prad
esh
Chha
ttis
garh
Utt
ar P
rade
sh
Raja
stha
n
Biha
r
Jam
mu
& K
ashm
ir
Jhar
khan
d
Del
hi
Ass
am
2011 2001
Per C
ent
2.1 Household Characteristics
Of the 1,157 elderly households surveyed, a near-equal proportion resided in rural and urban
areas – 51 and 49 per cent respectively. Appendix Table A 2.1 shows that while an average household
comprised a total of about five members (mean = 4.8), households with six or more members also
existed and were found to be higher in rural (31%) than in urban (28%) areas. Overall, 53 per cent of
the households were headed by elderly males and 25 per cent by elderly females.
Scheduled castes (SC) constituted 35 per cent of households and 53 per cent were other (general)
castes; 82 per cent of the households were Hindus. Appendix Table A 2.1 also shows that 38 per cent
of households live in a pucca house, with nearly two-thirds (67%) of such households residing in the
urban areas. About 54 per cent of the houses have more than three rooms. Nearly 40 per cent of
the households have access to piped drinking water, and an almost equal proportion (39%) gets its
drinking water from bore wells. Notably, 26 per cent of the households overall and more than one-
third (37%) in rural areas have no access to toilet facilities. Only 40 per cent of the households have
flush toilets. Over a 90 per cent of the rural households and nearly 42 per cent of urban households
use fuels other than LPG/natural gas as their major cooking fuel.
Among the sampled elderly households in the state, 40 per cent rural and 20 per cent urban
households belonged to the BPL category; another 5 and 2 per cent in rural and urban areas,
respectively, belonged to the Antodaya category (Appendix Table A 2.2).

Sample Households and Elderly Population
PAGE
5
Household Possessions, Loans and Household Support System
Electricity connection is available in 95 per cent urban households and 71 per cent of rural
households; 31 per cent of elderly households in rural areas and 79 per cent in urban areas own
colour televisions as given in Appendix Table A 2.2. More than two-thirds of the households
have cellular/mobile phones, and 46 per cent of the urban households own a refrigerator.
Fifty two per cent of households in rural areas own no agricultural land. In terms of the wealth
quintiles, 39 per cent of the households in West Bengal fall in the poorest quintile and 24 per cent in
the second-lowest class; only about 22 per cent of the households overall and a majority of urban
households fall in the two uppermost or wealthiest groups; 63 per cent of households do not have
any outstanding loans. Nearly a quarter of loan (26 per cent) expenditure is on agriculture, while a
fifth (19 per cent) of loans is taken to meet the health expenditure of the elderly.
As shown in Figure 2.2, roughly half of total households in rural areas (47.5%) have monthly per
capita consumption expenditure (MPCE) levels up to Rs. 1,000. Only a small fraction of about
10 per cent has average MPCE higher than Rs. 2,500. The situation is markedly better in urban areas
as nearly one-third (32%) of the urban households have MPCE higher than Rs. 2,500 and about
20 per cent lower than Rs. 1,000.
Figure 2.2: Monthly per capita consumption expenditure of elderly households according to place of residence, West Bengal 2011
Rural
47.5%
29.1%
13.8%
9.6%
20.2%
21.4%
26.2%
32.3%
Urban
≤1000Rupees
1001-1500
1501-2500
2501+
2.2 Profile of the Elderly
Elderly individuals comprise nearly one-fourth (24.5%) of the household population in West Bengal.
The overall sex ratio (females per 1,000 males) in the state, among the elderly households, indicates
a near-even ratio of 1,009, and considering only the elderly population rises to about 1,135, with a
marginally higher sex ratio in rural (1,137) than in urban (1,131) areas (Appendix Table A 2.1).

PAGE
6
BKPAI: West Bengal
Figure 2.3: Sex ratio (females per 1,000 males), West Bengal 2011
1053
12581376
1135
0
200
400
600
800
1000
1200
1400
1600
60-69 70-79 80+ Total
Age Group
Fem
ales
per
100
0 M
ales
The sex ratio across the elderly age groups, as shown in Figure 2.3, clearly indicates a steadily
increasing female dominance with age – the sex ratio increases from 1,053 (60-69 years) to 1,376 in
the 80+ age group.
The age structure among the elderly in West Bengal indicates a pattern nearly similar to the
combined seven state average and similar across both sexes; 35 per cent of the elderly (36% males
and 34% females) are in the age group 60–64, and about 27 per cent in the 65–69 age group. Less
than 10 per cent of the elderly were aged over 80 years (Appendix Table A 2.3). As indicated in
Figure 2.4, 72 per cent of elderly women in West Bengal are widowed, much higher than the seven
state average of 58 per cent (Alam et al 2012) while 84 per cent of elderly men have surviving
spouses. Among the currently married elderly, remarriage is rare – 7 per cent of males in rural areas
and only 3 per cent in urban areas have remarried.
Figure 2.4: Elderly by marital status according to sex, West Bengal 2011
WomenMen
83.6%
11.8%
4.6%
Never married
Widowed
Others
Currently married
26.2%
71.7%
2.1%
Sample Households and Elderly Population
PAGE
7
Two-thirds of elderly females (66%) and 29 per cent of elderly males has no formal education while
43 per cent of elderly males and only 12 per cent of elderly females have completed more than
eight years of formal education. The survey attempted to estimate the rate of migration among the
elderly – both lifetime migration and that undertaken after attaining 60 years of age. The latter is
extremely rare; less than 4 per cent have migrated after 60 years of age. Due to marriage-migration,
lifetime migration among women is high (82%) as compared to that among males (36%) (Appendix
Table A 2.3).
To summarize, overall the housing structure of elderly in West Bengal is dilapidated in nature and
requires some concrete measures from the Government. More than half (57%) of the rural elderly
resides in a kaccha house and more than a quarter (26%) of the households overall doesn’t have a
toilet facility. Only 40 per cent of households have access to piped drinking water. Wood was the
most widely used cooking fuel among rural households (38%). There was near universal access to
electricity (95%) by the urban elderly households, while more than half of the rural households
(52%) doesn’t own any agricultural land. Overall, 39 per cent of the elderly belonged to the lowest
wealth quintile while only one out of 10 elderly belonged to the highest wealth quintile. Significant
variation was observed in the MPCE across rural and urban areas; while one-third of the elderly
households had an MPCE of Rs. 2,500+ in urban areas, this was true for only 10 per cent of the elderly
from rural areas. A majority of rural households (48%) had an MPCE of less than Rs. 1,000. Thirty six
per cent of the elderly households had an outstanding loan and 19 per cent of such loans were
sought to meet the health expenditure of the elderly, which is marginally higher than the seven
state average (13%).
Rising feminization of ageing was prominent in West Bengal, similar to the seven state report, with
the sex ratio being 1135 females per 1000 males in the 60+ age group. Nearly two-thirds of the elderly
(63%) are in the 60-69 age group confirming ageing as a recent phenomenon requiring immediate
attention. Almost three-quarters of the elderly females are widows and the lifetime migration
among the elderly women is very high (82%) as against men (36%). Surprisingly, remarriage rate is
marginally higher in rural locales (4%) than the urban locales (1%). Nearly half the elderly population
(48%) surveyed in the state has no formal education.

PAGE
8
3. Work, Income and AssetsThis section discusses the work participation, sources of income and the extent of asset holdings
among the elderly in the state. Each of these dimensions inter alia provides an indication of the
extent of economic independence of the elderly.
3.1 Work Participation Rate and Work Intensity
Work participation rate in West Bengal among the elderly based on current working status is
24 per cent overall (Appendix Table A 3.1), with 42 per cent for males and 8 per cent for females.
Notably, work participation rate falls among the elderly males in urban areas (26%) similar to the
seven states pattern, but is higher for the females (8.5%) (Alam et al 2012). Figure 3.1 shows that
more than half (52%) of the elderly males in the age group 60–69 are currently working; even
beyond the age of 80, 9 per cent of the males continue to work.
Work intensity among the elderly in West Bengal who continue to be active in the labour force
depicts a socio-economic pattern suggestive of economic compulsions and poverty as the main
drivers of labour force participation (Appendix Table A 3.2). Nearly 71 per cent of the current workers
in the lowest wealth quintile category are main workers indicating that they work for more than
six months in a year. Also, the working elderly in the lowest socio-economic status group work
for longer hours, with 95 per cent working for more than four hours. Similarly, compared to the
Figure 3.1: Currently working elderly by age and sex, West Bengal 2011
52.1
27.7
9.19.0 6.74.3
0
10
20
30
40
50
60
60-69 70-79 80+
Per C
ent
Age Group
Men Women

Work, Income and Assets
PAGE
9
Figure 3.2: Main workers and those working more than 4 hours a day among elderly workers, West Bengal 2011
Per C
ent
Main worker (more than 6 months)
More than 4 hours a day
Men Women Total
78.1 75.3 77.6
97.4
82.7
94.8
0
20
40
60
80
100
current workers staying with children, those staying with spouses tend to work more regularly
and for longer hours. Overall more than three-quarters (78%) of the elderly are main workers and
95 per cent works for more than four hours in a day (Fig. 3.2).
The major occupations among the elderly workers are other wage labour activities (34%) and
agricultural labour (26%); 36 per cent of rural men and about 17 per cent of rural women are
agricultural labourers. Appendix Table A 3.3 shows that informal employment is the major type of
employment undertaken by the elderly – 67 per cent of the workers in rural areas and 42 per cent in
urban areas are informally employed – followed by self-employment (25% overall).
3.2 Need for Current Work
Workforce participation among the elderly in West Bengal, cutting across sex and in rural and
urban areas alike, is predominantly influenced by economic and other compulsions. Nearly 9 out
of 10 working elderly in both rural and urban areas do so out of such compulsions. For women,
economic compulsions are universally applicable reasons for work (Fig. 3.3).
Motivations for work vary across background attributes of the elderly, such as age and living
standards. As shown in Figure 3.4, the influence of economic or other compulsions as work
motivators steadily declines from about 99 per cent in the poorest wealth quintile to about 37 per
cent in the richest quintile. Across social groups, the only pattern that emerges indicates a higher
proportion of the elderly from SC/ST groups working out of economic and other compulsions.

PAGE
10
BKPAI: West Bengal
Figure 3.3: Elderly working due to compulsion by place of residence and sex, West Bengal 2011
91.7
84.6
88.0
100.0
75
80
85
90
95
100
Rural Urban Men Women
Place of Residence Sex
Per C
ent
Figure 3.4: Elderly working due to compulsion by age, caste and wealth quintile, West Bengal 2011
90.7
90.8
64.7
95.1
83.2
86.4
99.3
93.6
85.2
55.0
37.1
0 20 40 60 80 100
60-69
70-79
80+
Lowest
Second
Middle
Fourth
Highest
Cast
e/Tr
ibe
SC/ST
OBC
Others
Age
Gro
upW
ealth
Qui
ntile
Per Cent
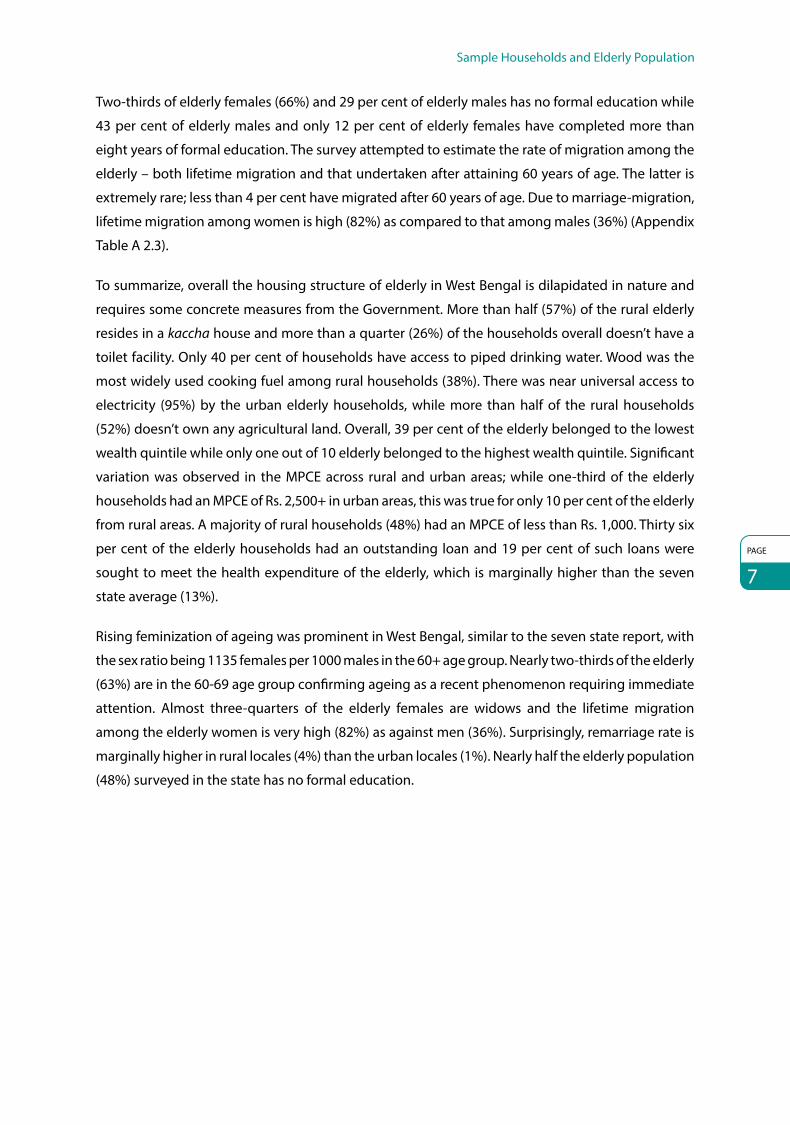
3.3 Reasons for Not Working
The results of the BKPAI survey suggest that functional disability is one of the major reasons for the
elderly not working currently with 47 per cent of elderly women and 39 per cent of elderly men
reporting being functionally disabled as reasons for not working, followed by 32 per cent men and
12 per cent women indicating that they have retired from work while 20 per cent of elderly women
and 12 per cent of elderly men stated that they were too old to work (Fig. 3.5).
Work, Income and Assets
PAGE
11
Figure 3.5: Five major reasons for elderly currently not working by sex, West Bengal 2011
39.1
31.8
12.1 11.0
0.4
5.6
47.1
11.7
20.0
10.4
3.67.3
Functionally disabled
Retired Too old towork
Healthproblems
Have to takecare of family
Others0
5
10
15
20
25
30
35
40
45
50
Per C
ent
Men Women
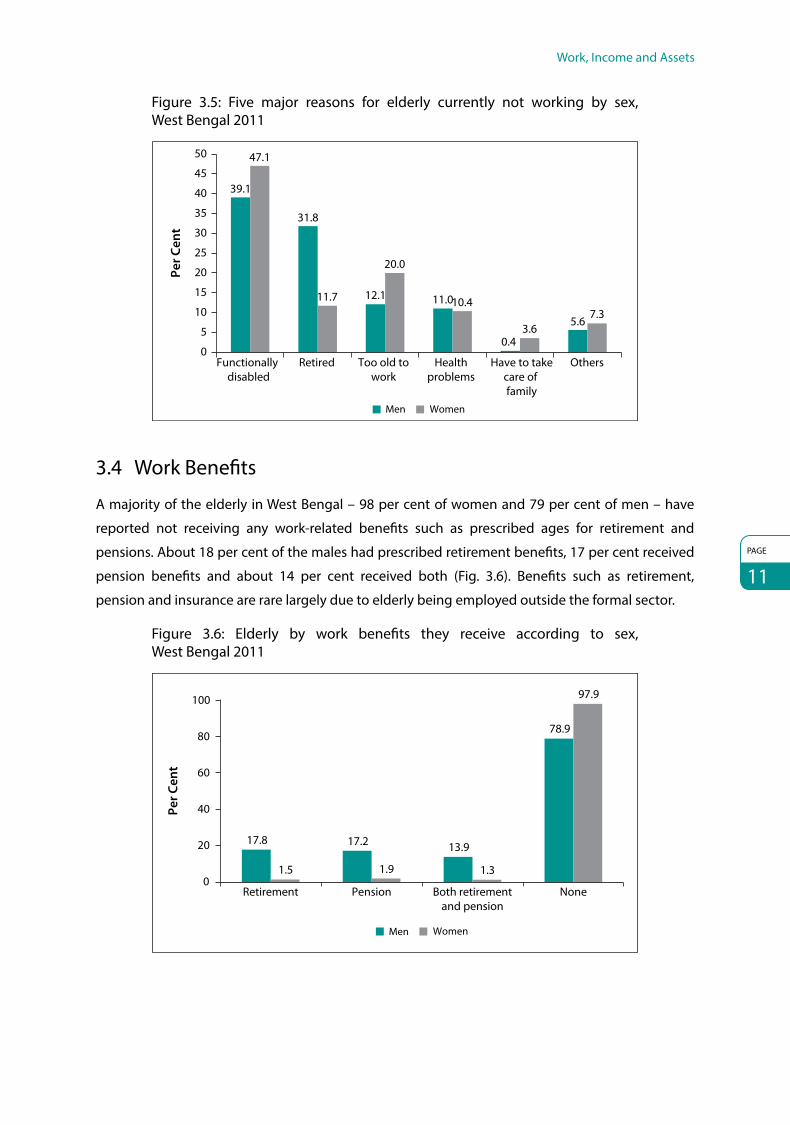
3.4 Work Benefits
A majority of the elderly in West Bengal – 98 per cent of women and 79 per cent of men – have
reported not receiving any work-related benefits such as prescribed ages for retirement and
pensions. About 18 per cent of the males had prescribed retirement benefits, 17 per cent received
pension benefits and about 14 per cent received both (Fig. 3.6). Benefits such as retirement,
pension and insurance are rare largely due to elderly being employed outside the formal sector.
Figure 3.6: Elderly by work benefits they receive according to sex, West Bengal 2011
Per C
ent
Retirement Pension Both retirementand pension
None
Men Women
17.8 17.2 13.9
78.9
1.5 1.9 1.3
97.9
0
20
40
60
80
100

PAGE
12
BKPAI: West Bengal
3.5 Personal Income of the Elderly
Appendix Table A 3.6 shows that overall nearly 53 per cent of the elderly earn some income,
with a higher proportion of income-earning individuals being males and in urban areas. In urban
areas, 43 per cent of elderly males earn more than Rs. 50,000 annually, and a little more than
one-fifth (21%) of the rural males earns over Rs. 24,000, or about Rs. 2,000 per month. Among
the income-earning elderly women, a majority earns around Rs. 12,000 annually, reflected in the
average income of Rs. 7,414 earned annually by the women. The gender differentials in earnings
are shown in Figure 3.7.
Figure 3.7: Elderly by annual personal income by sex, West Bengal 2011
27.3%
15.2%
15.4%
18.4%
23.7% No income
≤12000
12001-24000
24001-50000
50001+
Rupees
Men Women
4.0% 4.8%
65.3%
22.8%
3.1%
The average proportion of the elderly having no personal income indicates some association with
the living standards in terms of the wealth quintiles (Fig. 3.8). As seen in the figure, among males
Figure 3.8: Elderly with no income by wealth quintile and sex, West Bengal 2011
30.0 28.0 29.723.8
14.4
54.6
76.680.3
71.0
51.1
0
10
20
30
40
50
60
70
80
90
Per C
ent
Lowest Second Middle Fourth Highest
Wealth Quintile
Men Women

Work, Income and Assets
PAGE
13
Figure 3.9: Elderly by sources of current personal income according to sex, West Bengal 2011
0
10
20
30
40
50
60
70
80
25.0
6.2
15.7
4.18.8
18.8 17.8
0.8
15.88.4
27.1
65.3Pe
r Cen
t
Salary/Wages Employer’s pension
(government or other)
Social pension (old age/ widow)
Agricultural/Farm income
Other sourcesof income
No income
Men Women
the proportion of no-income elderly falls from 30 per cent in the lowest wealth quintile to about
14 per cent in the richest quintile. For females, however, the pattern is rather irregular.
A look at the sources of income earned by the elderly reveals that for men, nearly one-fourth of
the income is through salaries and wages (25%), while for women the major source is from social
pensions (old-age/widow pensions) (19%) (Fig. 3.9). About 16 per cent of males earn their incomes
through employer’s pensions and about 18 per cent from agricultural sources. Notably, in urban
areas employer’s pensions are the major source of income for males (36%) explained by higher
engagement with formal employment sources in urban areas. For rural males, salary/wages (29%)
and agricultural income (27%) are quite significant (Appendix Table A 3.7).
3.6 Economic Contribution of the Elderly to the Family
The survey also asked respondents about their perception on the magnitude of their economic
contribution to household expenditure; a little more than half the earning elderly (52%) reported
that they do contribute. Three-quarters of males (75%) and 38 per cent of females in urban areas
and 70 per cent males and 31 per cent females in rural areas contribute their personal incomes to
household expenditure in West Bengal (Fig. 3.10). Overall, nearly half (47%) the elderly respondents
reported that they do not contribute to household expenses (Appendix Table A 3.8).
About 20 per cent felt that their contribution covers more than 80 per cent of the household’s
total expenditure. Due to higher income-earning proportions, men generally contribute more,
and also account for a larger part of the household’s expenses out of their own incomes (Fig. 3.11).

PAGE
14
BKPAI: West Bengal
Figure 3.10: Elderly providing economic contribution to household expenditure by place of residence and sex, West Bengal 2011
69.874.8
71.4
31.037.9
33.3
49.255.2
51.1
Rural Urban Total
Per C
ent
0
10
20
30
40
50
60
70
80
Men Women Total
Place of Residence
Figure 3.11: Elderly by their perceived magnitude of contribution towards household expenditure according to sex, West Bengal 2011
Men Women
No income/No contribution
≤40%
40-60%
60-80%
80+
3.1%
27.5%
13.6%
13.7%10.8%
34.3%
66.6%16.0%
5.6%
8.8%
Notably, 34 per cent of elderly males and 9 per cent of females consider that their incomes contribute
to more than 80 per cent of the household expenditure; in addition, about one in every 10 elderly
males feels that his contribution to household expenditure falls in the range of 60–80 per cent
(Appendix Table A 3.8).
3.7 Economic Dependence
Only 14 per cent of the elderly in West Bengal are economically independent; 60 per cent are fully
dependent and 27 per cent are partially dependent on others for sustenance (Appendix Table A 3.9).

Work, Income and Assets
PAGE
15
Figure 3.12: Elderly by their financial dependency status and main source of economic support according to sex, West Bengal 2011
61.5
2.8
2.3
11.5
21.9
42.1
36.0
21.9
65.3
5.7
2.3
20.1
6.7
75.3
18.0
6.7
0 10 20 30 40 50 60 70 80
Son
Spouse
Daughter
Others
Not dependent on anyone
Fully dependent
Partially dependent
Not dependent
Sour
ce o
f Ec
onom
ic S
uppo
rtFi
nanc
ial
Dep
ende
nce
Per Cent
Men Women
Economic independence among the elderly is slightly higher in urban areas (18%) vis-a-vis rural
areas (12%). Economic independence among males is almost three times higher than that of
females, both in urban and rural areas.
Across rural and urban areas, as well as for male and female elderly respondents, sons are the
predominant sources of economic support – overall their contribution as sources of support
accounts for nearly two-thirds of all elderly respondents (64%) (Fig. 3.12).
3.8 Asset Ownership
More than one-third (36%) of the elderly interviewed in West Bengal does not own any assets
(Table 3.1). Asset ownership among the elderly indicates a strong gender differential – about
59 per cent of females in rural areas and 44 per cent in urban areas do not own any assets, as
compared to only about 14 per cent for males. The male–female differential in asset ownership is
also evident in the ownership patterns for assets such as inherited land and houses. Half the rural
males and only 13 per cent of rural females own inherited land; similarly, three-fourths of urban men
and only one-fourth of urban women own either inherited or acquired houses.
More than half (53%) the elderly men in urban areas own some form of savings in bank, post office
and cash, while about 22 per cent of rural men have such savings. Overall less than 1 per cent elderly
have savings in other financial products like bonds, shares and mutual funds.

PAGE
16
BKPAI: West Bengal
Table 3.1: Per cent distribution of elderly by asset ownership according to place of residence and sex, West Bengal 2011
Type of Assets Rural Urban Total
Men Women Total Men Women Total Men Women Total
Inherited land 47.6 12.9 29.1 18.8 5.0 11.5 38.1 10.3 23.3
Self acquired land 26.5 3.8 14.4 26.7 6.4 15.9 26.5 4.6 14.9
Inherited house(s) 40.3 16.5 27.7 24.2 7.6 15.4 35.0 13.6 23.6
Self acquired house(s) 23.2 9.6 15.9 47.6 16.4 31.0 31.2 11.8 20.9
Housing plot(s) 2.7 0.5 1.6 9.2 1.6 5.1 4.9 0.9 2.7
Inherited gold or jewellery 0.0 4.5 2.4 0.0 13.0 6.9 0.0 7.3 3.9
Self acquired gold or jewellery 1.9 5.9 4.1 5.0 20.7 13.3 2.9 10.8 7.1
Savings in bank, post office, cash 21.5 10.6 15.7 52.6 27.4 39.2 31.8 16.1 23.4
Savings in bonds, shares, mutual funds 0.4 0.3 0.4 3.3 0.1 1.6 1.4 0.2 0.8
Life insurance 0.0 0.0 0.0 0.0 0.0 0.0 0.0 0.0 0.0
Don’t own any asset 14.5 59.2 38.3 14.1 44.1 30.0 14.4 54.2 35.6
Number of elderly 296 347 643 302 330 632 598 677 1,275
In general, a higher level of work participation by the elderly is desirable only if it is by choice
and not by economic or social compulsion. However, the current rate and pattern of work
participation in West Bengal clearly indicates the link between current work participation and
poverty and illiteracy. Further the survey also found that work participation of the elderly continues
even beyond age 80, a strong indication of lack of any social and economic support. The survey
shows significant gender differentials in the labour market. Although the work participation rate is
lower among females, it appears that those who are working have no choice but to do so, as a large
proportion of women reported that the work participation is primarily driven by economic and
other compulsions. Women living alone have higher incidence of work participation compared to
those living with spouse or others. The majority of the elderly who are participating in the labour
market are working for more than four hours a day (95%). The survey also found that the reasons for
work for the majority of the elderly are economic or other compulsions. The occupational structure
of currently working elderly shows significant numbers are employed in unskilled and low paid
jobs. Pension or retirement benefits are not available to the majority (89%). A negligible number of
women receive retirement benefits (2%) as compared to 18 per cent among men. This is despite the
fact that a large majority of the elderly women are widows.
Nearly half the elderly (47%) have reported that they earn no income and the annual mean income
of the elderly (Rs. 22,558) is marginally lower than the seven state average (Rs. 24,974) reflecting the
dire need of government intervention and improving the monetary support provided to the elderly
in the state. Nearly one-fourth of the elderly have reported pension (employer’s and social pension)
as the major source of income followed by wages. One-third of the elderly men and 20 per cent

Work, Income and Assets
PAGE
17
of elderly overall perceive that they contribute to more than 80% of the household expenditure.
This reaffirms the fact that elderly are not merely a burden on the household and have a significant
contribution to the household. Sixty per cent of the elderly have reported being economically
fully dependent, citing their son as the major source for economic support. Moreover, 36 per cent
of the elderly have reported that they don’t own any assets. Findings from this section highlight
the economic vulnerability of the elderly, especially the women, which requires advocacy by the
government in order to address it.

PAGE
18
4. Living Arrangement and Family RelationsIndia has always maintained the traditional system of joint families with several generations living
together under one roof. However, this system is slowly changing to the nuclear family system
owing to rapid urbanization, global migration and family values becoming obsolete. This section
will discuss the living arrangements of the elderly by comparing their current living pattern and
perceived level of satisfaction. It also focuses on the different roles played by the elderly in the daily
activities of the households and discusses the important emerging issue of elderly abuse.
4.1 Type of Living Arrangement and Reasons for Living Alone
In West Bengal, more than 10 per cent of elderly females and about 2 per cent of elderly males stay
alone; 14 per cent of men and 5 per cent of women co-reside with only their spouses, while the rest
stay with other family members including spouses, children and grandchildren (Fig. 4.1).
In fact among the seven states considered in the study, West Bengal follows Tamil Nadu with
the second highest proportion of women living alone (Fig. 4.2), which has clear psychosocial
implications (Alam et al 2012).
The proportion of the elderly living alone does not change significantly across age groups, but is
higher in rural areas. In terms of socio-economic status, 13 per cent of the elderly in the lowest
wealth quintile class stays alone, and in better-off classes the proportion is significantly lower
(Appendix Table A 4.1).
Figure 4.1: Living arrangement of the elderly by sex, West Bengal 2011
10.5%5.0%
84.5%
1.6%
13.7%
84.7%
Men Women
Alone
Others
Spouse only

Living Arrangement and Family Relations
PAGE
19
Figure 4.2: Elderly women living alone in seven select states, 2011
6.3
3.2
10.5
4.9
10.1
5.4
26.4
9.6
0 5 10 15 20 25 30
Himachal Pradesh
Punjab
West Bengal
Odisha
Maharashtra
Kerala
Tamil Nadu
Total
Per Cent
In both rural and urban areas, and with an equal predominance across the sexes, the main reason
for the elderly living alone is having no children or children staying away. Such a pattern is more
evident in urban areas. While one-third of rural men and women indicated having no children
or children staying away as the main reason for living alone, in urban areas the corresponding
figures increase sharply to about 60 per cent. Notably, close to 40 per cent of the elderly in rural
areas reportedly stay alone due to family conflicts as against one-fourth for elderly women and
14 per cent for elderly men in urban areas (Fig. 4.3). Nearly one-fourth of elderly males (23% in rural
and 25% in urban areas) prefers to be independent and hence chooses to stay alone.
Figure 4.3: Main reasons for living alone or with spouse only according to place of residence and sex, West Bengal 2011
34.9 37.5
56.8 59.8
39.3 40.9
14.0
24.523.115.5
25.2
10.32.7 6.2 4.1 5.4
0
10
20
30
40
50
60
70
Men Women Men Women
Per C
ent
Rural UrbanNo children/Children away
Family con�ict
Prefer to be independent
Others

PAGE
20
BKPAI: West Bengal
4.2 Level of Satisfaction with Present Living Arrangement
As shown in Figure 4.4, more than two-third of elderly males (69%) and 76 per cent of elderly females
are satisfied with their present living arrangements. The level of satisfaction across both sexes is
found to be considerably higher in urban than in rural areas.
Figure 4.4: Elderly comfortable or satisfied with present living arrangement by place of residence and sex, West Bengal 2011
64.1
82.3
69.4
73.2
80.3
76.2
68.4
81.2
72.6
0 20 40 60 80 100
Rural
Urban
Total
Per Cent
Total MenWomen
Again, and highlighting the perceptions regarding economic independence and its linkage with
living patterns, a majority of the women considers themselves to be staying with children, and not
the other way round. As seen from Figure 4.5, such perception steadily increases with age and is
very high among all women except those who are currently married.
Figure 4.5: Elderly who think they live with their children rather than children living with them by age and marital status, West Bengal 2011
29.7
46.957.8
33.6
54.263.367.0
80.989.8
51.8
81.3 82.3
0102030405060708090
100
Age Group Marital Status
Per C
ent
Men Women
60-69 70-79 80+ Currentlymarried
Widowed Others

Living Arrangement and Family Relations
PAGE
21
4.3 Preferred Living Arrangements
Living with sons is the most preferred living arrangement of the elderly respondents in West Bengal.
However, this indicates a gender difference in perception – men prefer less to stay with their sons
and more to stay with their spouses as compared to women. About 2 per cent of elderly males
and 6 per cent of elderly females prefer staying alone as shown in Figure 4.6. Notably, both elderly
males and females whose preferred living arrangement is staying with their children and others
(mostly grandchildren, and spouses) are found to have similar living arrangements, largely explaining
the higher proportion of the elderly expressing their satisfaction with present living arrangements.
On the other hand, about two-thirds of the elderly (65% males and 67% females) who prefer to stay
with only their spouses are found to be presently staying with their children and others (Appendix
Table A 4.2).
Figure 4.6: Preferred living arrangement of the elderly by sex, West Bengal 2011
Alone
With spouse only
With daughters
Either with son or daughter
Others
With sons
With other relatives
In an old age home
Men
2.1%1.3%
1.5%
1%0.4% 1.0%
33.6%
59.1%
Women
5.7%
13.3%
70.6%
5.2%
1.8%1.1%
0.7%1.6%
4.4 Family Interaction and Monetary Transactions
Nearly 68 per cent of the elderly and their non co-residing children frequently communicate
with each other, and 89 per cent have frequent meetings (Appendix Table A 4.3). In fact, in both
these dimensions, the elderly in West Bengal are much better placed than their counterparts from
the other six states considered in this study. However, the lack of communication between the
elderly and their children staying apart/away appears to be more prevalent among women than
men (Fig. 4.7).

PAGE
22
BKPAI: West Bengal
Figure 4.7: Elderly with no meeting or no communication with their non co-residing children according to sex, West Bengal 2011
8.0
13.611.2
24.2
37.8
31.8
0
10
20
30
40
Men Women
Per C
ent
Total
No meeting No communication
The direction of the monetary transfers between the elderly and their children indicates that
in nearly one-fifth of instances (18%) transfers originate from the children to the elders, while about
5 per cent of the elderly provide monetary support to their children (Fig. 4.8).
Figure 4.8: Elderly who have monetary transfer between them and their non co-residing children by place of residence, West Bengal 2011
17.919.4
18.4
5.6 5.2 5.4
0
5
10
15
20
25
Per C
ent
Rural Urban Total
By children By elderly
4.5 Engagement in Family Activities and Decision Making
It is evident from the survey results that the elderly in West Bengal, both male and female and from
both rural and urban areas, contribute to a number of different household activities. While for men
shopping and payment of bills are important activities, women mostly help in taking care of the
grandchildren or in cooking. Notably, in both rural and urban areas elderly men are still found to

Living Arrangement and Family Relations
PAGE
23
Table 4.1: Percentage of elderly by participation in various activities according to place of residence and sex, West Bengal 2011
Rural Urban Total
Men Women Total Men Women Total Men Women Total
Taking care of grandchildren 39.5 53.1 46.7 39.2 48.5 44.1 39.4 51.6 45.9
Cooking/cleaning 12.0 59.0 37.0 10.6 61.3 37.6 11.5 59.8 37.2
Shopping for household 73.5 32.8 51.8 75.5 42.6 58.0 74.1 36.0 53.9
Payment of bills 57.2 9.9 32.0 64.5 15.8 38.6 59.6 11.8 34.2
Advice to children 78.2 51.2 63.8 82.5 55.5 68.2 79.6 52.6 65.3
Settling disputes 77.1 40.3 57.6 82.9 51.6 66.3 79.0 44.0 60.4
Note: All row percentages for men refer to 598 cases, all row percentages for women refer to 677 cases, and all row percentages for total refer to the full sample of 1,275 elderly.
have high social and intra-familial position – nearly four of every five elderly men and half the elderly
women reportedly provide advice to their children and help settle disputes (Table 4.1).
It was seen that elderly men as well as women do contribute to making decisions for the family. Less
than 15 per cent of the elderly men do not participate in any form of decision making, while the
same is true for nearly one-third of the elderly women (Fig. 4.9).
Figure 4.9: Elderly reporting no role in various decision making activities according to sex, West Bengal 2011
0 5 10 15 20 25 30 35
8.2
11.5
14.4
7.8
32.2
32.4
28.5
20.3
Buying and selling property
Buying household items
Gifts to relatives
Arrangement of social andreligious events
Women Men
Per Cent
4.6 Social Engagement
Social engagement of the elderly was assessed in the survey through a set of questions seeking
to know whether they participated in any meetings, community gatherings and social or religious
functions. The frequency of such attendances was also recorded. As seen from Table 4.2, more
than three-quarters of the elderly (78%) in West Bengal have never attended any such meeting in

PAGE
24
BKPAI: West Bengal
Table 4.2: Per cent distribution of elderly by the frequency of attending any public meetings in the one year preceding the survey by place of residence and sex, West Bengal 2011
Frequency of Attendance in Meetings
Rural Urban Total
Men Women Total Men Women Total Men Women Total
Never 62.0 89.8 76.8 65.5 92.5 79.8 63.1 90.7 77.8
Rarely 29.9 8.8 18.7 30.0 6.4 17.5 29.9 8.0 18.3
Occasionally 7.5 1.1 4.1 3.4 1.1 2.2 6.1 1.1 3.5
Frequently 0.6 0.3 0.5 1.1 0.0 0.5 0.8 0.2 0.5
Total 100.0 100.0 100.0 100.0 100.0 100.0 100.0 100.0 100.0
Number of elderly 296 347 643 302 330 632 598 677 1,275
the year preceding the survey. Notably, for both men and women, a higher proportion of the elderly
in rural areas has attended such meetings; on an average nearly one in every three elderly men
attended meetings.
However, a different pattern emerges when attendance in religious programmes and services,
excluding marriages and funerals is considered (Table 4.3). About 58 per cent males and
53 per cent females have attended such events at least once or twice during the past year.
However, while attending such events was found to be slightly higher among urban men (59%) than
among their rural counterparts (57%), the reverse was the case for rural women (54%) compared to
urban women (49%).
Elderly were questioned about the reason for not going out more. The main reason cited was health
problems (45%) followed by the financial problems (41%) (Appendix Table A 4.5).
Table 4.3: Per cent distribution of the elderly attending religious programmes or services (excluding weddings and funerals) in the one year preceding the survey by place of residence and sex, West Bengal 2011
Frequency of Attendance in Religious Programmes
Rural Urban Total
Men Women Total Men Women Total Men Women Total
Never 29.4 35.7 32.7 33.1 41.5 37.6 30.6 37.6 34.3
Once or twice per year 57.1 54.4 55.7 59.3 48.7 53.7 57.8 52.6 55.0
Once or twice per month 6.2 3.5 4.8 2.9 5.1 4.1 5.1 4.1 4.6
Once or twice per week 2.4 2.0 2.2 3.1 2.3 2.7 2.6 2.1 2.3
Daily 5.0 4.4 4.7 1.6 2.3 2.0 3.9 3.7 3.8
Total 100.0 100.0 100.0 100.0 100.0 100.0 100.0 100.0 100.0
Number of elderly 296 347 643 302 330 632 598 677 1,275

Living Arrangement and Family Relations
PAGE
25
4.7 Elderly Abuse
The reported level of elderly abuse in West Bengal is not very high. Overall, 8 per cent of the
elders have experienced any form of abuse after age 60, and 3 per cent were reportedly abused
in the month preceding the survey. However this is higher than other states like Kerala (3%) and
Tamil Nadu (2%) (Alam et al 2012). Notably, higher levels of abuse were reported in rural areas
(9% as against 5% in urban areas) with a marginally higher level among women (Table 4.4).
Table 4.4: Per cent distribution of the elderly by experience of abuse after turning 60 and in the month preceding the survey according to place of residence and sex, West Bengal 2011
Experienced Abuse
Rural Urban Total
Men Women Total Men Women Total Men Women Total
Yes, after age 60 8.4 9.0 8.7 4.6 5.5 5.1 7.2 7.9 7.5
Yes, last month 3.5 2.8 3.1 2.3 3.5 2.9 3.1 3.0 3.0
Number of elderly 296 347 643 302 330 632 598 677 1,275
Figure 4.10 shows the different forms and sources of abuse faced by the elderly. Except for verbal
abuse, the main source of abuse was within the family: women were more likely to be abused
verbally within the family and men outside the family. The sources of abuse due to economic
reasons, disrespect and neglect were almost equally divided among within or outside the family as
well as from both sources. Major sources of abuse are daughter-in-law followed by son across sex
and place of residence (Fig. 4.11).
Figure 4.10: Forms and sources of abuse faced by elderly after age 60, West Bengal 2011
97.7 97.6
93.8 92.9
98.797.3 98.2
96.398.0 97.4
0.7 1.4
1.4 4.0
0.61.8 1.0
1.8
1.1 1.51.3
1.1
4.12.2
0.5 0.9 0.61.6
0.6 0.9
88
90
92
94
96
98
100
Per C
ent
Men Women Men Women Men Women Men Women Men Women
Physical Verbal Economic Disrespect Neglect
No Within family Outside family

PAGE
26
BKPAI: West Bengal
Figure 4.11: Sources of abuse among elderly who reported any abuse in the month preceding the survey by place of residence and sex, West Bengal 2011
0.0
0.1
0.2
0.3
0.4
0.5
0.6
0.7
0.8
0.2
0.3
0.2
0.3
0.1
0
0.1
00 00 0
0.5
0.7
0.3
0.7
0.3
0.1
0.3
0.20.2
0.1
0.2
0.1
Rural Urban Men Women
Place of Residence Sex
Per C
ent
Spouse Son Daughter Son-in-law Daughter-in-law Relatives Neighbours
In a nutshell, the living arrangement of the elderly in West Bengal is coherent with the findings of
the seven state study. The majority of the elderly are presently staying with their spouses, children
and grandchildren. However, the proportion of women living alone is second highest among
the BKPAI surveyed states which reflects the dismal condition of elderly women in the state. The
predominant reason for the elderly living alone is due to the migration of children, followed by
family conflicts. Furthermore, three-fourths of the elderly have expressed that their present living
arrangement is comfortable, with the elderly women being marginally more satisfied than the
elderly men. Meetings between the elderly and their children are frequent; however the absence
of communication between the two is significantly higher in West Bengal (32%) than the seven
state average (21%). While the elderly participate actively in routine household activities, their role
in decision making is slightly restricted. Social engagement of the elderly in attending religious
programmes or public meetings is severely restricted and this is mainly due to their ill health and
financial constraints. The major issue emerging in this section is elderly abuse. Although the extent
of abuse is relatively lower in West Bengal compared to the seven state average, it requires further
investigation to ensure physical security provisioning for the elderly in the state.

PAGE
27
5. Health and Subjective Well-BeingAt the core of the well-being and quality of life of the elderly is their health – both physical and
mental. Accordingly, measures of objective health status – presence or absence of any diseases
or functional limitations – combined with perceptions on health and health-related well-being
concerns are necessary to determine the full spectrum of elderly health. This section reports the
findings on elderly health collected by the UNFPA-BKPAI survey for West Bengal and is organized as
follows: starting with health perceptions and self-assessed health status, functionality, mental health
and cognition and risky health behaviours, the discussion moves to acute and chronic morbidity,
hospitalization and financing health-care expenditure.
5.1 Self-rated Health, Functionality and Well-Being
5.1.1 Self-rated Health
Self-rated health (SRH) status is a measure which provides a good account of functional ability, life
satisfaction and familial factors and is also sensitive to variations in objective health.1 As shown
in Figure 5.1, the SRH ratings in West Bengal indicate better health perceptions among males
than females, and in lower age groups than among the elderly. Based on current health status
only (Appendix Table A 5.1), more than one-third (37%) of the elderly in rural West Bengal and
Figure 5.1: Self-rated current health status by age and sex, West Bengal 2011
Good Fair/PoorExcellent/Very good
5.1 2.6 3.5 2.1 0.1 0.0
22.7 20.5 16.29.3 9.6
15.9
72.1 77.0 80.488.6 90.3
84.1
Men Women Men Women Men Women
60-69 70-79 80+
Per C
ent
0
20
40
60
80
100
Age Group
1 Zimmer, Z., Natividad, J., Lin, H.S., Chayovan, N. 2000. “A cross-national examination of the determinants of self-assessed health.” Journal of Health and Social Behavior, 41, (4): 465–481.

PAGE
28
BKPAI: West Bengal
Figure 5.2: Self-rated current health status by marital status, caste and highest and lowest wealth quintile, West Bengal 2011
0102030405060708090
100
12.813.9
35.8
86.1
51.5
Lowest Highest
2.0 1.7 4.0
16.5 13.919.7
81.5 84.476.3
SC/ST OBC Others
4.6 1.4 3.9
21.514.3 16.0
74.084.3 80.1
Currently married
Widowed Others
Per C
ent
Wealth QuintileCaste/TribeMarital Status
Good Fair/PoorExcellent/Very good
28 per cent in urban areas have rated their health as poor. Notably, in terms of perceived health
status, the elderly in West Bengal (on an equal footing with those in Kerala) on an average tend
to have poor health perceptions, highlighting the need for further studies to identify their
determinants (Alam et al 2012).
Figure 5.2 further highlights the socio-economic gradient in perceived health status: perceptions of
being in very good or excellent health is nearly three times higher in the richest quintile than in the
poorest, and is significantly higher among currently married individuals. This is clearly indicative of
the positive effects of economic well-being and having surviving spouses that link subjective health
valuations with feelings of emotional security as well as economic well-being.
5.1.2 Functionality
The notion of functionality for the elderly involves the ability to perform self-care, self-maintenance
and physical activity. Such notions involve a process of progressivity that leads to impaired or
loss of physical functioning among the aged, or the disablement process. Under the International
Classification of Functioning, Disability and Health (ICF) which has its theoretical underpinnings
in social models of disability, physical functioning and disability are considered outcomes of
interactions between health conditions and contextual factors. The concepts and measures of
activities of daily living (ADL) and instrumental activities of daily living (IADL) have emerged as the
most common approaches in empirical assessments of functionality among the elderly and are
considered to fit in with the ICF framework.
The ADLs are the basic tasks of everyday life. In the household survey, respondents were asked
to assess their level of independence for six different types of ADLs covering physical domains
of functionality viz., bathing, dressing, using the toilet, mobility, continence and feeding,
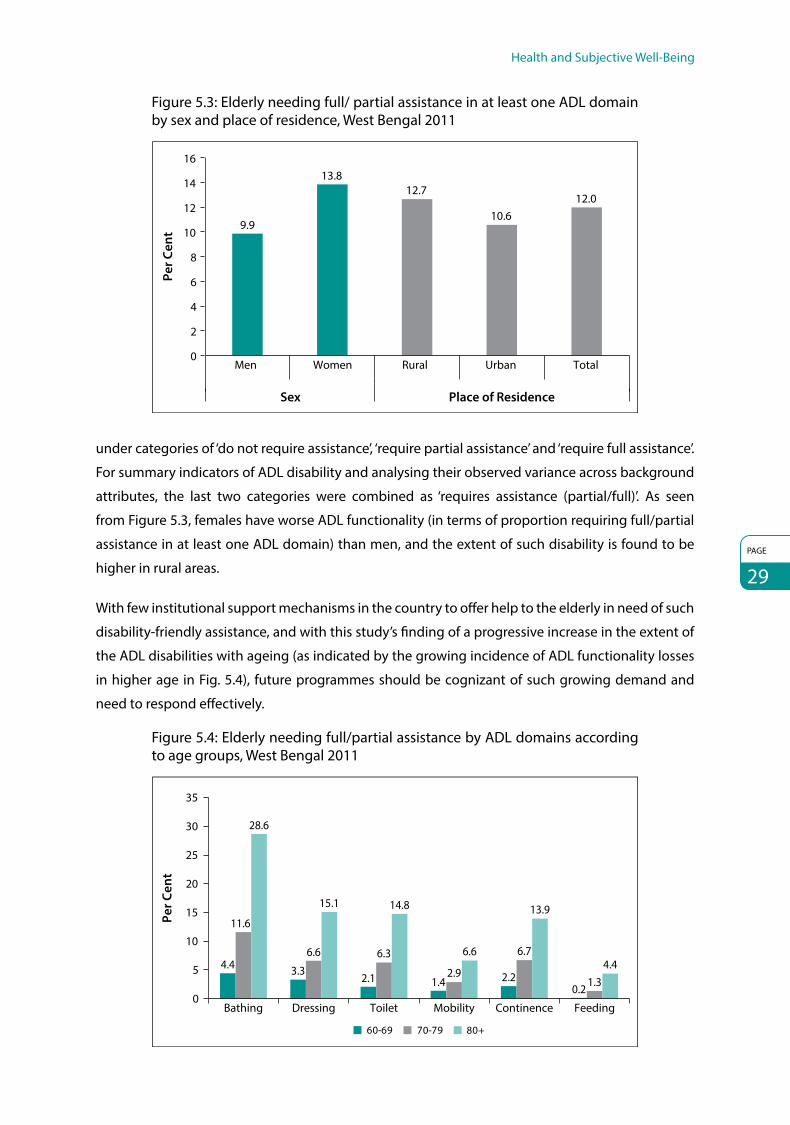
Health and Subjective Well-Being
PAGE
29
Figure 5.3: Elderly needing full/ partial assistance in at least one ADL domain by sex and place of residence, West Bengal 2011
9.9
13.812.7
10.612.0
0
2
4
6
8
10
12
14
16
Men Women Rural Urban Total
Per C
ent
Sex Place of Residence
under categories of ‘do not require assistance’, ‘require partial assistance’ and ‘require full assistance’.
For summary indicators of ADL disability and analysing their observed variance across background
attributes, the last two categories were combined as ‘requires assistance (partial/full)’. As seen
from Figure 5.3, females have worse ADL functionality (in terms of proportion requiring full/partial
assistance in at least one ADL domain) than men, and the extent of such disability is found to be
higher in rural areas.
With few institutional support mechanisms in the country to offer help to the elderly in need of such
disability-friendly assistance, and with this study’s finding of a progressive increase in the extent of
the ADL disabilities with ageing (as indicated by the growing incidence of ADL functionality losses
in higher age in Fig. 5.4), future programmes should be cognizant of such growing demand and
need to respond effectively.
Figure 5.4: Elderly needing full/partial assistance by ADL domains according to age groups, West Bengal 2011
4.4 3.32.1 1.4 2.2
0.2
11.6
6.6 6.3
2.9
6.7
1.3
28.6
15.1 14.8
6.6
13.9
4.4
0
5
10
15
20
25
30
35
Bathing Dressing Toilet Mobility Continence Feeding
Per C
ent
60-69 70-79 80+
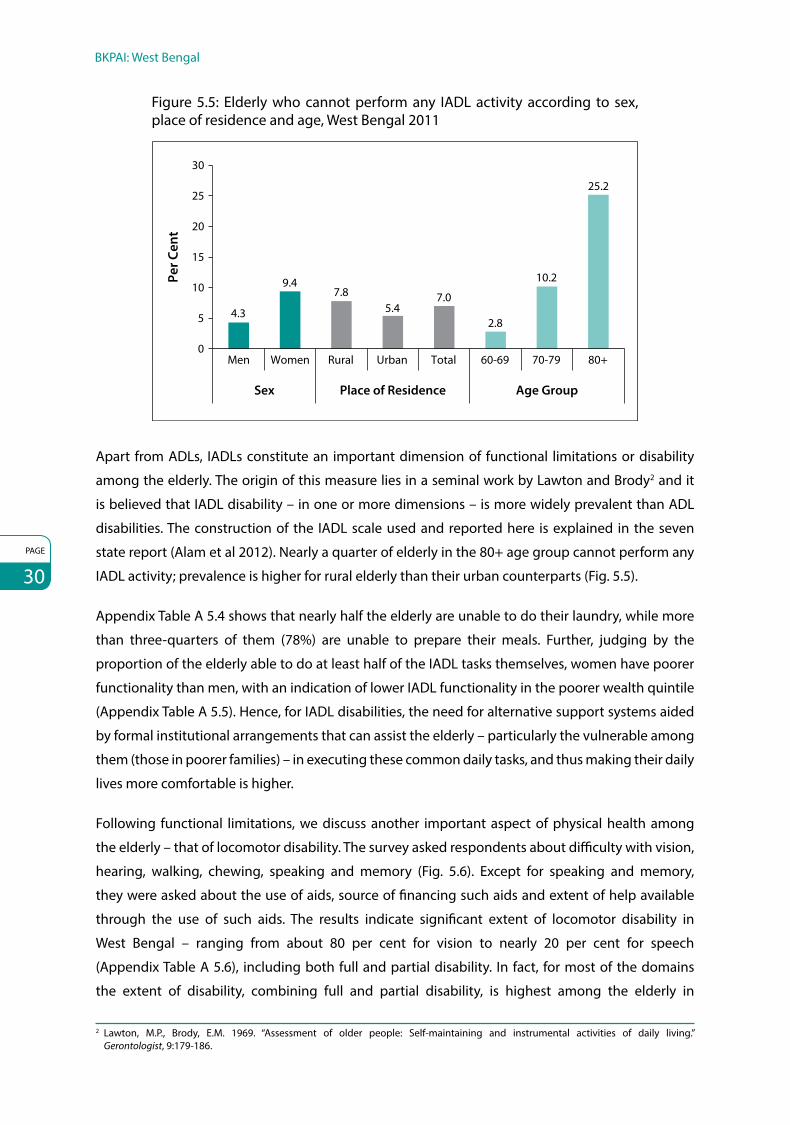
PAGE
30
BKPAI: West Bengal
Figure 5.5: Elderly who cannot perform any IADL activity according to sex, place of residence and age, West Bengal 2011
4.3
9.47.8
5.47.0
2.8
10.2
25.2
0
5
10
15
20
25
30
Men Women Rural Urban Total 60-69 70-79 80+
Sex Place of Residence Age Group
Per C
ent
Apart from ADLs, IADLs constitute an important dimension of functional limitations or disability
among the elderly. The origin of this measure lies in a seminal work by Lawton and Brody2 and it
is believed that IADL disability – in one or more dimensions – is more widely prevalent than ADL
disabilities. The construction of the IADL scale used and reported here is explained in the seven
state report (Alam et al 2012). Nearly a quarter of elderly in the 80+ age group cannot perform any
IADL activity; prevalence is higher for rural elderly than their urban counterparts (Fig. 5.5).
Appendix Table A 5.4 shows that nearly half the elderly are unable to do their laundry, while more
than three-quarters of them (78%) are unable to prepare their meals. Further, judging by the
proportion of the elderly able to do at least half of the IADL tasks themselves, women have poorer
functionality than men, with an indication of lower IADL functionality in the poorer wealth quintile
(Appendix Table A 5.5). Hence, for IADL disabilities, the need for alternative support systems aided
by formal institutional arrangements that can assist the elderly – particularly the vulnerable among
them (those in poorer families) – in executing these common daily tasks, and thus making their daily
lives more comfortable is higher.
Following functional limitations, we discuss another important aspect of physical health among
the elderly – that of locomotor disability. The survey asked respondents about difficulty with vision,
hearing, walking, chewing, speaking and memory (Fig. 5.6). Except for speaking and memory,
they were asked about the use of aids, source of financing such aids and extent of help available
through the use of such aids. The results indicate significant extent of locomotor disability in
West Bengal – ranging from about 80 per cent for vision to nearly 20 per cent for speech
(Appendix Table A 5.6), including both full and partial disability. In fact, for most of the domains
the extent of disability, combining full and partial disability, is highest among the elderly in
2 Lawton, M.P., Brody, E.M. 1969. “Assessment of older people: Self-maintaining and instrumental activities of daily living.” Gerontologist, 9:179-186.

Health and Subjective Well-Being
PAGE
31
Figure 5.6: Elderly by type of disability and age, West Bengal 2011
75.4
24.7
36.7 35.1
16.6
36.1
83.7
39.545.5 43.7
22.9
37.9
85.8
55.660.2
53.6
35.4
54.5
0
20
40
60
80
100
Vision Hearing Walking Chewing Speaking Memory
Per C
ent
80+60-69 70-79
West Bengal among the seven states included in the survey (Alam et al 2012). Differentials in the
extent of these disabilities across sex or wealth quintile are irregular, and there appears some
indication of a higher prevalence among widowed individuals.
However, what is of greater concern is the significant extent of unmet need – measured among
those reporting any difficulty and using any aid – in the use of locomotor aids. As evident from
Appendix Table A 5.8, less than half the urban elderly and two-thirds of those in rural areas with
vision problems in West Bengal do not use spectacles or lenses; use of walking sticks is rare for
other-than-oldest old ages, dentures and hearing aids are rarely used (Fig. 5.7). While poverty/
affordability could be a reason for not using the aids, lack of adequate awareness and ready
availability – particularly dentures and hearing aids – in rural areas or small towns could be a major
impediment, clearly requiring corrective action. Again, an integrated strategy for addressing the
functionality needs of the elderly that allows for low-cost aids to be distributed among those unable
to afford them is clearly the need of the hour in high-burden populations such as in West Bengal.
Figure 5.7: Elderly using disability aids according to age and sex, West Bengal 2011
Per
Cen
t
39.835.1
42 41.7
34.3
42.2
0.6 0.4 2 1.7 0 1.14
26.3
10.5
26.2
11.1
2.2 0.8 1.4 2.75.9
20
10
20
30
40
50
Men Women Men Women Men Women
60-69 70-79Age Group
80+
Spectacles/Lenses Hearing aids Walking sticks Dentures

PAGE
32
BKPAI: West Bengal
5.1.3 Mental Health and Cognitive Ability
In the present study, a number of standardized scales and questions were used to assess the
general mental health conditions among the elderly respondents. These included the 12-item
General Health Questionnaire (GHQ) and the 9-item Subjective Well-being Inventory (SUBI) scales.
The next section presents the salient findings from the data collected through these instruments.
General Health Questionnaire
The GHQ was originally developed in the United Kingdom as a screening instrument to identify
general psychological distress in primary care settings. Developed by Goldberg and Blackwell
(1970), it was originally designed as a 60-item questionnaire, but several shorter versions (30-item,
28-item, 20-item and the 12-item GHQ) have been used subsequently. In this study, the shorter
12-item questionnaire, commonly referred as GHQ-12, has been used. The GHQ-12 has been
translated, used and validated in various contexts and study settings, including in India. The
results using GHQ-12 have been found to be comparable to longer versions of the GHQ in
multi-country assessments; in India little difference in the ability of alternative scales and
questionnaire items, which included the GHQ-12, could be found to identify cases accurately. For
details on the GHQ methodology, please refer to the seven state report (Alam et al 2012).
Subjective Well-being Inventory
The SUBI is designed to measure ‘feelings of well-being or ill-being as experienced by an individual
or a group of individuals in various day-to-day life concerns’. An important aspect of mental
health and psychological well-being, empirical assessments of subjective well-being (SWB)
involve evaluations of one’s life in terms of judgments of overall life satisfaction as well as one’s
experience of pleasant and unpleasant emotions. In the present study, a 9-item SUBI has been used:
(i) life – whether interesting; (ii) life – compared with the past; (iii) things one has been doing in
recent years; (iv) fulfilment of expectations – standard of living; (v) congruence success – desserts,
(vi) congruence accomplishments – efforts; (vii) confidence of managing unexpected situations;
(viii) confidence in facing crisis situations and (ix) confidence in coping with future challenges.
Details of the SUBI methodology are laid out in the seven state report (Alam et al 2012). The results
for both GHQ and SUBI-based measure are summarized in Table 5.1.
In terms of the 9-item SUBI score as followed in the study, overall nearly 7 per cent of elderly females
and 3 per cent of elderly males fall under subjective ‘ill-being’ category in West Bengal (Table 5.1).
Further diversification of subjective ill-being across rural and urban areas shows proportionally
higher prevalence in elderly from rural areas (5%) as against those in urban areas (4%). With age,
the proportion of elderly scoring high on ill-being increases. Noticeably, a much higher proportion
of the elderly who are not currently married recorded ill-being (i.e., currently married 3%, widowed/
divorced 8%, others 8%). Similarly, compared to the elderly from the highest wealth quintile
(1%), subjective ill-being is among the elderly belonging to lowest wealth quintile is almost

Health and Subjective Well-Being
PAGE
33
Table 5.1: Percentage of elderly classified based on GHQ-12 and SUBI according to select background characteristics, West Bengal 2011
Background Characteristics GHQ Score Below Threshold Level (≤12) SUBI (All Negative)
Age Group
60–69 68.1 4.9
70–79 76.3 5.5
80+ 85.1 5.1
Sex
Men 70.5 2.8
Women 73.3 7.1
Place of Residence
Rural 75.2 5.4
Urban 65.5 4.4
Marital Status
Currently married 70.0 2.9
Widowed 74.5 7.6
Others 72.2 8.3
Wealth Quintile
Lowest 78.3 7.6
Highest 47.5 1.4
Total 72.0 5.1
7 per cent higher. These findings are along expected lines and establish susceptibility to poor life
satisfaction and subjective well-being among socio-economically weaker elderly populations.
To complement the findings on the extent of ill-being among the elderly in the state considering
SUBI scores, psychological stress suffered by them is assessed on the basis of the 12-item GHQ
responses. Comparing the seven states based on GHQ scale, presence of psychological distress
among the elderly is highest in West Bengal (72%), closely followed by Odisha (67%) (Alam et al
2012). In West Bengal, 29 per cent men and about 27 per cent women demonstrated satisfactory
psychological conditions if a cut-off reference is set on a 12-point score in the GHQ scale.
The burden of mental distress is more among the rural elderly than among their urban counterparts,
as is demonstrated by proportion of the elderly recording scores above cut-off point (viz., 75% for
rural and 66% for urban). Comparatively better psychological health is noted among the elderly
who are currently married (30%, scoring below 12-point cut-off for GHQ), compared to the
widowed (25%) and other groups (28%). The phenomenon of psychological distress seems more
congruent with increasing age, as shown by the increasing proportion of the elderly scoring GHQ
score above the 12-point cut-off in West Bengal (viz., 60–69 years; 68%, 70–79 years; 76%, and
80+ years; 85%). The difference in reported GHQ score above the 12-point threshold is indeed
striking when compared across the highest and lowest wealth quintiles – while nearly 50 per cent
of the elderly belonging to the highest quintile recorded better psychological well-being compared
to only 22 per cent in the lowest quintile (Table 5.1). While SUBI all negative implies serious health
conditions, GHQ is indicative of first screening of mental health for the individuals.

PAGE
34
BKPAI: West Bengal
In a nutshell, West Bengal demonstrates presence of higher amount of psychological stress
among the elderly as compared to the other states under study, which further increases with age,
rural background, poor economic status and not being married currently. This trend perfectly
matches the SUBI scale, establishing deteriorating subjective well-being among those with the
above characteristics.
To assess the degree of cognitive ability among the elderly respondents in addition to the GHQ
and SUBI scale-based assessments of mental health conditions and subjective well-being, a brief
exercise was conducted during the survey. A list of 10 commonly used words (bus, house, chair,
banana, sun, bird, cat, sari, rice and monkey) was read out to the respondents and they were asked
to recall the words. The order of the words recalled was kept flexible. The number of words recalled
as well as the time taken for the recall was recorded. The combined results for all the seven states
under study indicate that 40 per cent of the respondents could recall five or more words, with the
average respondent being able to recall about four words (mean = 4.1, SD 1.7) (Alam et al 2012).
On an average, the elderly from West Bengal were found to recall fewer words (mean = 3.3)
(Appendix Table A 5.11) than the average number recalled by the elderly across the seven states
(mean = 4.1). The methodology of assessing cognitive ability through this exercise indicated that
the elderly who are found to have better mental health conditions and better subjective well-being
are able to recall higher average number of words. The gradient is thus found enhanced for the
elderly from urban areas (mean = 3.4). The mean number of words recalled decreased with age, if
currently not married and if belonging to economically weaker sections (Fig. 5.8).
Figure 5.8: Mean number of words immediately recalled by the elderly according to select background characteristics, West Bengal 2011
3.33.3
3.43.6
3.13.6
3.12.5
3.63.0
3.53.2
3.8
0.0 0.5 1.0 1.5 2.0 2.5 3.0 3.5 4.0
TotalRural
UrbanMen
Women60-6970-79
80+
WidowedCurrently married
OthersLowest
Highest
Resi
den
ceSe
xA
ge
Gro
upM
arita
l St
atus
Wea
lth
Qui
n-ti
le
Mean
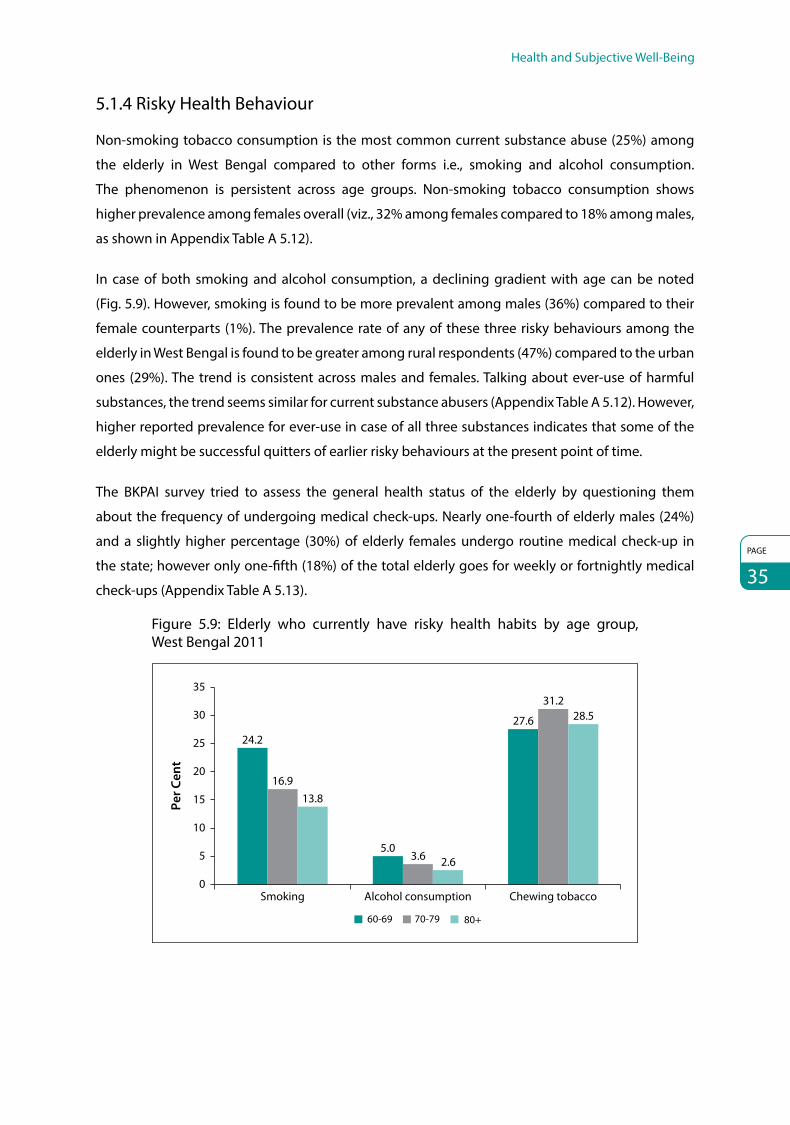
Health and Subjective Well-Being
PAGE
35
5.1.4 Risky Health Behaviour
Non-smoking tobacco consumption is the most common current substance abuse (25%) among
the elderly in West Bengal compared to other forms i.e., smoking and alcohol consumption.
The phenomenon is persistent across age groups. Non-smoking tobacco consumption shows
higher prevalence among females overall (viz., 32% among females compared to 18% among males,
as shown in Appendix Table A 5.12).
In case of both smoking and alcohol consumption, a declining gradient with age can be noted
(Fig. 5.9). However, smoking is found to be more prevalent among males (36%) compared to their
female counterparts (1%). The prevalence rate of any of these three risky behaviours among the
elderly in West Bengal is found to be greater among rural respondents (47%) compared to the urban
ones (29%). The trend is consistent across males and females. Talking about ever-use of harmful
substances, the trend seems similar for current substance abusers (Appendix Table A 5.12). However,
higher reported prevalence for ever-use in case of all three substances indicates that some of the
elderly might be successful quitters of earlier risky behaviours at the present point of time.
The BKPAI survey tried to assess the general health status of the elderly by questioning them
about the frequency of undergoing medical check-ups. Nearly one-fourth of elderly males (24%)
and a slightly higher percentage (30%) of elderly females undergo routine medical check-up in
the state; however only one-fifth (18%) of the total elderly goes for weekly or fortnightly medical
check-ups (Appendix Table A 5.13).
Figure 5.9: Elderly who currently have risky health habits by age group, West Bengal 2011
24.2
5.0
27.6
16.9
3.6
31.2
13.8
2.6
28.5
Smoking Alcohol consumption Chewing tobacco0
5
10
15
20
25
30
35
Per C
ent
60-69 70-79 80+

PAGE
36
BKPAI: West Bengal
5.2 Morbidity, Health Care Access and Financing
Health of an individual can also be ascertained through the presence of acute and chronic
morbidity, which is likely to impact his overall well-being. Prevalence and incidence of morbidity
increases with age and therefore access to adequate health care facilities is a pre-requisite for the
elderly. This section describes the incidence of morbidities – acute and chronic – in the elderly and
availability, access and utilization of health care services in West Bengal.
5.2.1 Acute Morbidity
Under the BKPAI survey, respondents were asked a set of questions regarding recent, acute
ailments suffered during the 15 days prior to survey; about 13 per cent of the respondents
reported falling ill during this time (Alam et al 2012). However, differing from the general pattern
in prevalence of common or acute illnesses among the elderly as found from the 60th Round
of the National Sample Survey Organisation (NSSO) survey on Condition of the Aged (2004–05)
(as reported in Alam and Karan, 2012), self-reported acute ailments are more common among the
elderly in rural areas. Such a rural–urban differential is evident across most of the study states, apart
from Punjab and Tamil Nadu.
The burden of acute morbidities among the elderly is found to be the highest in West Bengal
(26%). Although the urban morbidity levels in the state are comparable to the seven state
average (13%), nearly one-third (32%) of the rural elderly in West Bengal has reported suffering
from ailments during the reference period as shown in Appendix Table A 5.14. The rate of acute
disease prevalence is higher for women both from rural (33%) and urban areas (15%) compared
to their male counterparts (rural 31%, urban 11%). The mean number of illness episodes was more
than 1 across location and gender during the reference period of 15 days preceding the survey.
Over the preceding 15-day reference period, as reported, the elderly mostly suffered from fever
(prevalence rate 24% among males and 26% among females), followed by cold and cough and
problems related to blood pressure. However, the rate of prevalence of fever was radically higher
in case of rural areas (27%) than urban areas (19%). Similar drastic difference in prevalence is also
found for the other two ailments mentioned above (Appendix Table A 5.16).
If acute disease prevalence rate among the elderly in the state is checked across certain other
important background characteristics (Fig. 5.10), the rate increases with age (339/1000 in 80+ age
group compared to 242/1000 in the 60–69 age group). Compared to the general caste (243/1000),
both SC and ST elderly reportedly show higher prevalence of acute morbidity. Reconfirming the

Health and Subjective Well-Being
PAGE
37
Figure 5.10: Prevalence rate of acute morbidity per 1000 elderly according to select background characteristics, West Bengal 2011
Prevalence per 1000
259
320
135
246
242
270
297
360
90
273
325
243
0 50 100 150 200 250 300 350 400
Total
Rural
Urban
Men
Women
60-69
70-79
80+
Currently married
Widowed
Others
Lowest
Highest
ST/SC
OBC
Others
Resi
d-en
ceSe
xA
ge G
roup
Mar
ital
Stat
usW
ealth
Q
uint
ileCa
ste/
Trib
e271
339
192
232
positive association between better standard of living and better health status, reported
prevalence of acute morbidity among the elderly belonging to the highest wealth quintile (90/1000)
is found to be one-fourth the rate among the lowest wealth quintile (360/1000). Across marital
status, highest prevalence rate of acute morbidity is found among the elderly who are widowed
(297/1000). However, it is observed that the elderly who live with their spouse only reported a
comparatively lower prevalence of acute illnesses (231/1000) than those living with their children
(257/1000) or living alone (330/1000) (Appendix Table A 5.15).
It is satisfactory that 90 per cent of the elderly suffering from acute morbidity over the 15-day
reference period sought treatment for their conditions. Seeking treatment was higher in rural
areas (91%) than in urban areas (87%), and proportionally higher among males than among
females in both rural and urban areas (Appendix Table A 5.17). Not much variation is noted across
age groups (Fig. 5.11).

PAGE
38
BKPAI: West Bengal
Figure 5.11: Acute morbidity episode (last episode) for which treatment was sought according to place of residence, sex and age, West Bengal 2011
89.0 92.5
78.3
99.789.8 91.0 88.1 89.9
0
20
40
60
80
100
120
Men Men 80+ Total
Rural Urban Age Group
60-69 70-79
Per C
ent
Women Women
In terms of sources of treatment seeking, more than half the elderly from rural background sought
help from ‘other sources’, which may indicate their preference for over-the-counter medication or
other informal treatment sources. Private dispensaries are preferred over government sources in
both the locations (urban: government 25%, private 45%; rural: government 17%, private 23%)
(Appendix Table A 5.18). Half the urban female elderly are found to have visited private physicians
for treatment, showing higher preference even over the ‘other sources’. With higher wealth quintiles,
seeking treatment from ‘other sources’ is found reduced to a considerable extent, which may mean
with higher affordability, the elderly preferred more formal options. However, this requires further
analysis to reach a coherent conclusion.
Regarding cost of treatment, average expenditure was found to be much higher for private sources
(Rs. 1,789), compared to government sources (Rs. 666). Similarly, a higher mean expenditure is
observed in urban areas (Rs. 1,634) than in rural ones (Rs. 616). It is interesting to observe that mean
expenditure incurred for treatment of acute ailments was much higher for females (Rs. 942) than
for males (Rs. 588). This may be due to the fact that a considerably higher proportion of females
sought treatment from private physicians. A similar explanation probably holds true for the elderly
belonging to the highest wealth quintile, who actually incurred double the cost (Rs. 1,569) towards
treatment than their counterparts belonging to the lowest wealth quintile (Rs. 715).
Expenditure incurred towards medicines is found maximum across all sources, accounting for
over one-third of the total expenditure. Cost incurred towards medicines is the maximum when
treatment was sought from ‘other sources’ (60% of total expenditure) (Appendix Table A 5.20).
For elderly males, a majority bore their own expenses towards treatment of acute diseases (44%),
while for nearly 60 per cent of the elderly females, the cost was met by their children, which was
significantly higher than the cost incurred by elderly males (Appendix Table A 5.21 and Fig. 5.12).
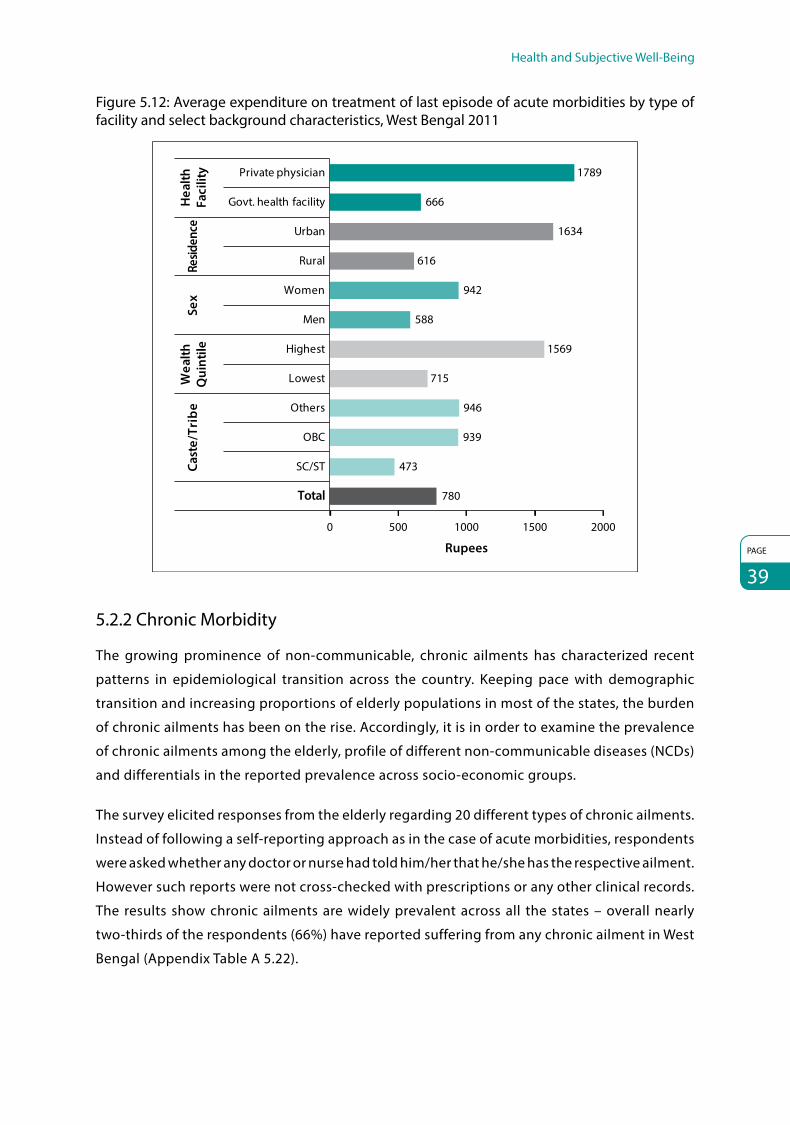
Health and Subjective Well-Being
PAGE
39
Figure 5.12: Average expenditure on treatment of last episode of acute morbidities by type of facility and select background characteristics, West Bengal 2011
Govt. health facility
Private physician
Rural
Men
Lowest
SC/ST
OBC
Total
Hea
lthFa
cilit
yRe
siden
ceSe
xW
ealth
Qui
ntile
Cast
e/Tr
ibe
Rupees
0 500 1000 1500 2000
666
616
588
715
473
939
780
1789
1634
942
1569
946
Urban
Women
Highest
Others
5.2.2 Chronic Morbidity
The growing prominence of non-communicable, chronic ailments has characterized recent
patterns in epidemiological transition across the country. Keeping pace with demographic
transition and increasing proportions of elderly populations in most of the states, the burden
of chronic ailments has been on the rise. Accordingly, it is in order to examine the prevalence
of chronic ailments among the elderly, profile of different non-communicable diseases (NCDs)
and differentials in the reported prevalence across socio-economic groups.
The survey elicited responses from the elderly regarding 20 different types of chronic ailments.
Instead of following a self-reporting approach as in the case of acute morbidities, respondents
were asked whether any doctor or nurse had told him/her that he/she has the respective ailment.
However such reports were not cross-checked with prescriptions or any other clinical records.
The results show chronic ailments are widely prevalent across all the states – overall nearly
two-thirds of the respondents (66%) have reported suffering from any chronic ailment in West
Bengal (Appendix Table A 5.22).

PAGE
40
BKPAI: West Bengal
Among the seven common ailments prevalent in West Bengal (e.g., high blood pressure, arthritis,
cataract, loss of all natural teeth, heart disease, diabetes and injury due to fall), the elderly mostly
suffer from high blood pressure (239/1000), followed by arthritis (213/1000), cataract (162/1000)
and problems due to loss of teeth (160/1,000). Overall prevalence of all the four chronic complaints
was higher among females compared to males, and a higher prevalence was noted in rural locales
than in urban areas except for high blood pressure. The elderly aged over 80 years demonstrated
maximum prevalence of high blood pressure (333/1000) (Fig. 5.13).
Nearly 91 per cent of those suffering from high blood pressure sought treatment, while 82 per cent,
49 per cent and 37 per cent sought treatment for arthritis, cataract and loss of all natural teeth,
respectively (Appendix Table A 5.24). Except for diabetes (which is found to be the sixth major
chronic ailment suffered by the elderly in West Bengal), in all other cases, a higher proportion of
males is found seeking treatment for chronic ailments than their female counterparts.
Earlier it was observed that the children of elderly females more often took major responsibility for
escorting them to the doctor when they suffered from acute ailments. If this could be considered
a practice, it might establish dependence among elderly females on their immediate relatives.
Hence, seeking treatment in the case of females may in turn be determined by whether they feel
the need for escorts or not. Since chronic diseases are often low intensity and do not show sudden
worsening status of overall health, need for immediate treatment may also appear unnecessary
to their escorts, thus indicating a lower proportion of elderly female treatment seekers across
different chronic ailments. The assumption is further strengthened by the observation that for
Figure 5.13: Prevalence of seven common chronic ailments among per 1,000 elderly by sex, age and place of residence, West Bengal 2011
Prev
alen
ce p
er 1
000
Sex Residence Age Group
Total Men Women Rural Urban 80+60-69 70-79
High blood pressure Arthritis Cataract Loss of all natural teeth Heart disease Diabetes Injury due to fall
0
50
100
150
200
250
300
350
239
201
272
216
285
206
279
333
213
148
271
232
175
218 21
2
188
162
157 16
5
163
160
120
225
246
160 17
7
145
174
132
127
200
261
82
95
70
85
75 78
104
39
77 82
73
64
103
73
86
74
52
33
68
54 47 52 48
62

Health and Subjective Well-Being
PAGE
41
Figure 5.14: Elderly by source of treatment of common chronic morbidities, West Bengal 2011
20.0
27.2
37.0
14.9
27.7
19.3
31.6
61.2
52.848.1
45.0 45.3
65.7
49.9
18.8 20.014.9
40.1
26.9
15.018.5
0
10
20
30
40
50
60
70
High bloodpressure
Arthritis Cataract Loss of allnatural teeth
Heartdisease
Diabetes Injury dueto fall
Per C
ent
Government hospital Private hospital Others
the most low-intensity chronic ailment, i.e., loss of teeth, only 30 per cent of the females reportedly
seeks treatment, compared to nearly 43 per cent of elderly males. A similar trend is observed even
in the case of certain comparatively high-intensity chronic problems, such as injury due to fall.
While 100 per cent of the elderly males sought treatment, only 82 per cent among the elderly
females who got hurt by falling were reported seeking any sort of medical help. The elderly
commonly cited reasons like financial crunch or ailments not being considered serious enough for
not seeking treatment (Appendix Table A 5.25).
Treatment for chronic ailments (Fig. 5.14) had almost universally been sought from private
hospitals, followed by a considerable share from government sources, while limited dependence
on other sources could be noted. A comparatively higher proportion of treatment was sought from
government hospitals in case of cataract (37%) and fall (32%) than for any other. Towards cost of
treatment for chronic ailments, highest average expenditure is observed in case of injury due to fall.
In case of all the seven common chronic ailments, average costs incurred monthly for services
from private hospitals are much higher. Unfortunately, as observed earlier, a majority of the elderly
are found seeking care from private hospitals for chronic morbidities, incurring large monthly
expenditure. A comparison drawn for cost of treatment of cataract or loss of tooth from private
and public sources shows a large difference. While the average monthly cost for cataract treatment
from a government hospital is only Rs. 341 and loss of teeth costs on an average Rs. 93, treatment
on an average costs Rs. 1,058 for cataract and Rs. 629 for loss of natural teeth in private hospitals
(Fig. 5.15). The difference in the cost might be due to subsidies provided at the government hospitals
for similar services; however, as evident from the study, the elderly in West Bengal prefer private
sources for treatment of chronic ailments.

PAGE
42
BKPAI: West Bengal
Figure 5.15: Average monthly expenditure on treatment of common chronic morbidities by source of treatment, West Bengal 2011
561
269 341
93
882
333
1490
530 599
1058
629
1261
666
1880
197391
233123
471313
1011
0200400600800
100012001400160018002000
High bloodpressure
Arthritis Cataract Loss of allnatural teeth
Heartdisease
Diabetes Injury dueto fall
Government hospital Private hospital Other
Rupe
es
Similar to the observation on acute ailments, while much more than half the elderly males funded
themselves, costs towards treatment for chronic ailments among elderly females were borne by
their children (Appendix Table A 5.26).
5.2.3 Hospitalization
A possible approach of ascertaining the severity of ailments – either self-reported based on
symptoms, or based on the respondents’ reports on being informed about such ailments by medical
personnel – is to examine the extent of hospitalization or in-patient stays in health facilities. Overall,
about 10 per cent of the respondents reported ‘major health problems requiring hospitalization’
during the past one year. The proportion of females admitted for hospitalized treatment in the past
one year was slightly higher (10%) compared to the proportion of males (9%) (Fig. 5.16).
Figure 5.16: Elderly hospitalized one year preceding the survey according to sex, place of residence, age and wealth quintile, West Bengal 2011
8.6
10.2 10.1
8.29.0 9.3
12.911.7
7.5
9.5
0
2
4
6
8
10
12
14
Men Women Rural Urban 60-69 70-79 80+ Lowest Highest Total
Sex Residence Age Group Wealth Quintile
Per C
ent

Health and Subjective Well-Being
PAGE
43
The trend across wealth quintiles shows that while 12 per cent of respondents from the
poorest quintile sought hospitalized care during the preceding one year, a lower proportion from
the richest quintile (7.5%) sought similar care. The rate of hospitalization shows an increase with age
and in case of rural residence. Among elderly males, a majority (20%) sought hospitalized treatment
for accident/injury, followed by treatment for heart disease (12%), while among females, the major
cause of hospitalized treatment was for diarrhoea (17%) and cataract and other eye surgery (14%)
(Appendix Table A 5.27). Mostly overall hospitalized treatment (63%) was sought from government
sources, compared to 32 per cent from private sources (Appendix Table A 5.28).
For a majority of both elderly males and females, their children accompanied them during hospital
stay (males 49% and females 72%), followed by spouse in case of males (34%) and other relatives
(8%) in case of females (Fig. 5.17).
As seen in Table 5.2, average expenditure for hospitalization (calculated based on 120 valid cases)
showed a huge difference, for treatment sought from government hospitals (Rs. 2,593) as compared
to treatment from private hospitals (Rs. 15,983). Apart from the ‘other’ unspecified head which
forms the largest share across all sources (i.e., government, private and others), a major part of the
expenditure was incurred on hospitalization (Rs. 4,092) in private hospitals and towards medicines
(Rs. 902) in government hospitals. This large difference in incurred costs towards hospitalized
treatment across private and government hospitals indeed raises concerns for the elderly and
will need further investigation as to why the respondents did not seek in-patient services from
government sources which would have reduced their financial burden to a large extent.
Figure 5.17: Elderly with persons accompanying them during hospital stay (last episode) by sex, West Bengal 2011
7.1%
34.4%
48.7%
6.7%
3.1%
Men Women
5.1%7.2%
72.4%
8.2%
7.1%
None
Spouse
Children
Relatives
Others

PAGE
44
BKPAI: West Bengal
Table 5.2: Average expenditure (in last episode) on hospitalization by type of hospitals according to major heads, West Bengal 2011
Average Expenditure by Major Heads Government Hospitals Private Hospitals Others Total
Total 2593 15983 3576 6966
Consultation 58 1407 340 507
Medicines 902 2959 2191 1619
Diagnostic tests 195 2820 187 1048
Hospitalization 295 4092 350 1526
Transportation 170 534 187 287
Food 298 581 322 391
Others 1252 4827 0 2353
Others (indirect cost) 674 3591 0 1589
Note: Item-wise expenses were provided for 120 spells of hospitalization and average expenditure has been worked out accordingly.
Average expenditure towards hospitalized expenditure was higher for the richest quintile
compared to that for the poorest quintile among general castes and the elderly from above poverty
line (APL) households. This probably indicates their preference for private hospitals, which increased
the expenditure that they had to incur (Fig. 5.18).
It is seen that for slightly over two-thirds of the elderly females who needed hospitalized services,
the costs were borne by their children, followed by their spouses (13%). Nearly 40 per cent of the
elderly males bore their costs themselves, and a nearly similar proportion (41%) was borne by their
children. The trend appears similar across urban and rural areas (Appendix Table A 5.29).
To conclude, this section examined the self-rated health, functionality, cognitive ability, risky
health-behaviour, levels of acute and chronic morbidity and its treatment in detail. A majority of
Figure 5.18: Average expenditure (in last episode) on hospitalization by wealth quintile, caste and BPL/APL category, West Bengal 2011
5404
9893
6816 63627240
9069
5100
0
2000
4000
6000
8000
10000
12000
Lowest Highest SC/ST OBC Others APL BPL
Wealth Quintile Caste/Tribe APL/BPL Category
Rupe
es

Health and Subjective Well-Being
PAGE
45
the elderly in West Bengal has reported their current health as poor and deteriorating
health can be observed with increasing age. A significant proportion of elderly in the state faces
strong functional limitations in performance of various daily activities (ADL and IADL) which
requires suitable attention.
In West Bengal, high levels of psychological distress among the elderly as evident from the
GHQ responses needs to be further studied from the perspective of social epidemiology to
comprehensively study and understand the dimensions and determinants of mental health
aspects among them. This area has been studied sporadically, and the BKPAI results indicate the
need to study the issues in-depth. While better awareness and reporting ‘thresholds’ about health
conditions may be responsible to an extent for the reported levels – as also noted for the acute and
chronic morbidity levels – further evidence is required to comment and draw correct inferences.
The indications however are less ambiguous that health-related well-being, covering all the
relevant health dimensions, continues to be lower among the lower socio-economic status (SES)
population groups, calling for more intensive, targeted interventions aimed at these groups.
Risky health behaviours are also found to be considerably higher compared to the national
average, especially smoking and chewing tobacco. The burden of acute morbidity is found to be
significantly high and fever is one of the most prevalent diseases in the state. High blood pressure
is the most common chronic ailment present in both urban and rural locales. It is important to note
that most of the health expenditure for treatment of acute ailments is on the private physicians
and hospitals which are far more costly and often cause severe economic hardship. The major
component of health expenditure is on the cost of medicines. The major source of financing the
treatment expenditure for elderly women is their children, while a majority of elderly men finance
their own health expenditure. These findings call for important initiatives to be taken by the
Government of West Bengal to ensure better quality of services being offered in the government
hospitals and regulation of drug prices.

PAGE
46
6. Social Security
6.1 Introduction
The concept of social security is traditional in the state. Providing care to seniors in Bengali families
is often termed seva. The prevalent cultural model is that at the heart of the joint family, a system
of intergenerational reciprocity exists. However, rise of the middle class and rapid disintegration of
the family system augmented by complex reforms of economic liberalization in the 1990s caused
severe erosion in the tradition of intergenerational reciprocity and elder care in Bengali families
in both rural and urban settings. Dwindling family support, increasing number of economically
dependent elderly and inadequate availability of resources are complex variables in the equation of
social security support to the elderly in West Bengal. The labyrinthine governance system is also a
hindrance to the optimal use of resources in the state.
The concept of ‘social security’ has different implications for APL and BPL families. The well-off
elderly need care and service from the family and society whereas those from BPL families need
income security for their survival. Therefore the majority of the elderly poor have to work as long as
they are physically able (Alam et al 2012).
A survey by Calcutta Metropolitan Institute of Gerontology (CMIG) in 2012 shows that 80 per cent
of senior citizens in Kolkata prefer to stay with their children and feel that the family is still the best
place to live in. The study further reveals that dependence on kin has been the dominant way of
living and a major source of support for the elderly. The BKPAI survey also gathered information
regarding support system for the elderly in their old age. Over 44 per cent elderly across household
status and gender opine that their children should provide support in their old age, followed by
their preference for independence, while nearly one sixth of the elderly think that government
should support them in their old age, the proportion of BPL elderly being higher (Fig. 6.1).
Socio-economic changes, along with demographic transition, necessitate that a specific social
security policy be in place for the elderly to meet the multidimensional challenges of older persons.
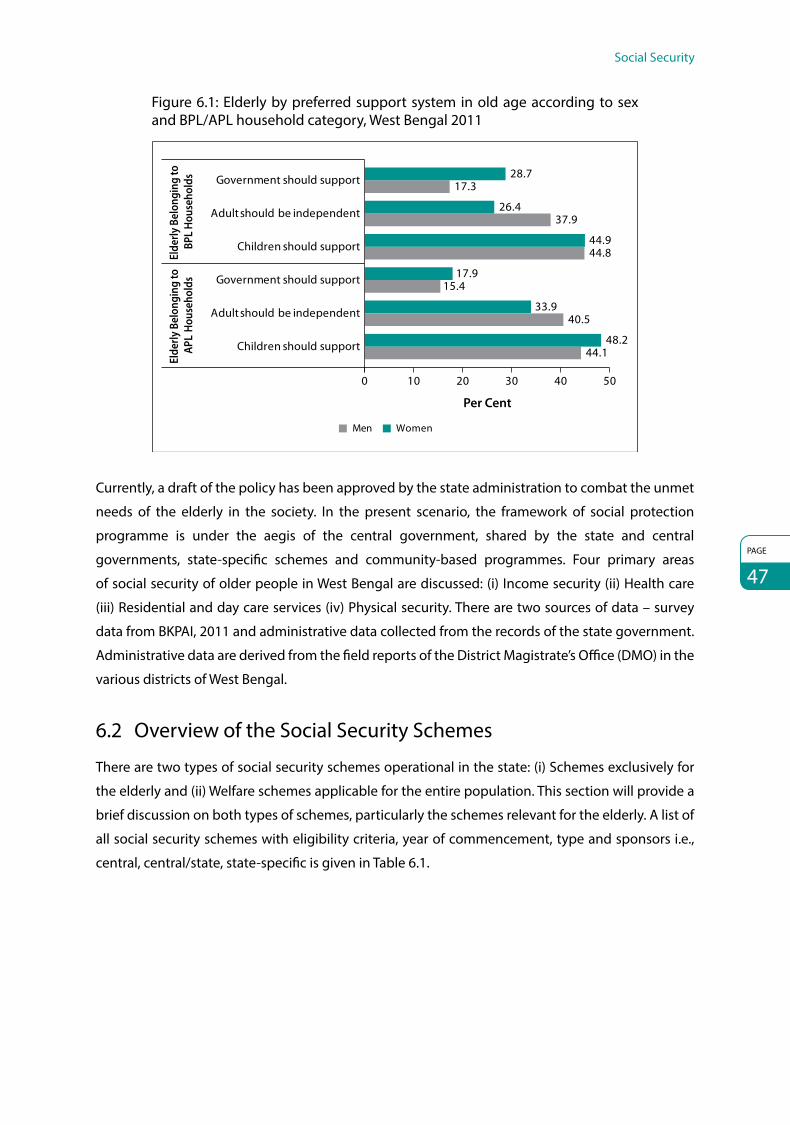
Social Security
PAGE
47
Figure 6.1: Elderly by preferred support system in old age according to sex and BPL/APL household category, West Bengal 2011
28.717.3
26.437.9
44.944.8
17.915.4
33.940.5
48.244.1Children should support
Adult should be independent
Government should support
Children should support
Adult should be independent
Government should supportEl
derly
Bel
ongi
ng to
BP
L Ho
useh
olds
Elde
rly B
elon
ging
to
APL
Hous
ehol
ds
Per Cent
0 10 20 30 40 50
WomenMen
Currently, a draft of the policy has been approved by the state administration to combat the unmet
needs of the elderly in the society. In the present scenario, the framework of social protection
programme is under the aegis of the central government, shared by the state and central
governments, state-specific schemes and community-based programmes. Four primary areas
of social security of older people in West Bengal are discussed: (i) Income security (ii) Health care
(iii) Residential and day care services (iv) Physical security. There are two sources of data – survey
data from BKPAI, 2011 and administrative data collected from the records of the state government.
Administrative data are derived from the field reports of the District Magistrate’s Office (DMO) in the
various districts of West Bengal.
6.2 Overview of the Social Security Schemes
There are two types of social security schemes operational in the state: (i) Schemes exclusively for
the elderly and (ii) Welfare schemes applicable for the entire population. This section will provide a
brief discussion on both types of schemes, particularly the schemes relevant for the elderly. A list of
all social security schemes with eligibility criteria, year of commencement, type and sponsors i.e.,
central, central/state, state-specific is given in Table 6.1.

PAGE
48
BKPAI: West Bengal
Table 6.1 Major social security schemes for the elderly in West Bengal
Type of Scheme
Name of the Scheme
Year of Commencement Eligibility Criteria
State/Central Sponsored
Scheme
Elde
rly S
chem
es
Income Security
IGNOAPS 2002-03 BPL persons aged 60–79 years and above, excluding widows and beneficiaries of Indira Gandhi National Disability Scheme (IGNDPS)
NSAP
Annapurna Scheme
2002-03 BPL men and women aged 60+ who, though eligible, are not covered under any pension scheme
NSAP
OAPS GoWB* 2009-10 BPL, Male-65 years, Female-60 years, resident of WB, non-beneficiary of IGNOAPS or any other programme
State Scheme
Health care NPHCE 2013 BPL/APL 60+ population Central Scheme
Mobile Medicare Unit (MMU)
2008 BPL 60+ infirm, destitute and widows
Central Scheme/IPOP
Residential and Day Care Services (RDCS)
OAH 2008 BPL 60+ Population Central Scheme/ IPOP
Physical security
Pronam NA BPL/APL 60+ population Kolkata Police
Saanjhbaati NA BPL/APL 60+ population West Bengal Police
Oth
ers
Income security IGNWPS 2002–03 BPL widows in age group 40–59
or above NSAP
Health care RSBY 2008 BPL population Central Scheme
Residential IAY 1985–86 BPL families Central Scheme
and Day Care Services
Gitanjali Amar Thikana 2012 BPL families State Scheme
*GoWB: Government of West Bengal
‘Social protection’ refers to a set of benefits available from the state, market, civil society and
community response. This section will discuss the government run schemes and community
response for the welfare of the elderly in West Bengal.
6.2.1 Income Security Schemes among the Elderly in West Bengal
As seen from Table 6.1, there are various income security schemes operational in West Bengal for
providing financial support to the elderly. For instance, Indira Gandhi National Old Age Pension
Scheme (IGNOAPS) provides Rs. 400 for people in the age group 60–79 years and Rs. 1,000 for
people 80 years and above with equal shares contributed by central and state governments. The
amount is payable through bank account and postal account. Payment on the basis of Aadhar has
not yet been started in West Bengal. But Aadhar-based old age pension payment is prioritized in
the e-governance action plan of the state. With features similar to IGNOAPS, the state government

Social Security
PAGE
49
also runs the Old Age Pension Scheme (OAPS) to cover sections of the elderly poor not covered by
IGNOAPS. The pension amount is Rs. 750 per month. All payments are made through bank/postal
account. In the financial year 2013–14, budget provision of the state is just adequate to support
10,000 beneficiaries under State-Specific Pension for Elderly.
Besides these two major schemes, Indira Gandhi National Widow Pension Scheme (IGNWPS) is
implemented by the Ministry of Rural Development, Government of India. In West Bengal, the
Gram Panchayats in rural areas and municipal bodies in urban areas monitor the list of widows in
the age group of 40–59 years under BPL category in order to provide pension under IGNWPS at
Rs. 500 per month. This amount is shared equally by the central and state governments. Pension
is withdrawn in case of remarriage and once the widow crosses the BPL line. All beneficiaries of
IGNWPS are automatically converted into IGNOAPS at the age of 60.
The Annapurna Scheme is another initiative taken by the state to provide food security to those
older persons who, though eligible, have remained uncovered under any old age pension scheme.
Under this scheme, 10 kg of food grains per month are provided free of cost to the beneficiaries
through the public distribution system (PDS). There are more than 20,000 PDS units throughout
the state, but the beneficiaries of Annapurna are mostly in some vulnerable rural segments located
in the districts of Bankura, Purulia and some parts of South Parganas, the areas badly affected by
natural calamities (Supreme Court Commissioner, 2010).
In the domain of income security, two important community response initiatives are stated below.
Elderly Self-Help Group (ESHG)
Over the past five years, HelpAge India has pioneered and successfully implemented a model of
sustainable care for the rural elderly using a two-pronged approach to address vulnerability and
preparedness encompassing welfare, development and rights. The two important elements are
self-help approach (elders for elders) and access to elders’ rights and entitlements, often referred to
as the rights-based approach. There are 120 ESHGs in the state formed with financial assistance from
HelpAge India and covering 1,996 beneficiaries (HelpAge India, 2012).
Reverse Mortgage
Reverse mortgage is, to a large extent, a solution for senior citizens who do not have a substantial
source of liquid assets to depend on. Through reverse mortgage, their residences can be virtually
transformed into a steady source of cash till the time of their death, giving them the financial
independence to live a comfortable life with dignity. To tackle the growing financial insecurity faced
by many senior citizens post-retirement, HelpAge India and the National Housing Bank (NHB, a
housing finance regulator) joined hands to provide a solution for them through reverse mortgage,
according to which the payment stream is ‘reversed’ as compared to conventional mortgage.

PAGE
50
BKPAI: West Bengal
The maximum period for a reverse mortgage loan is 15 years. On the death of the senior citizen/s
availing this or on permanent vacation of the residential property, the loan is repaid with the interest
accumulated by selling the property or alternatively repayment of the loan by the heirs. The loan will
be extended by primary lending institutions like scheduled banks or housing finance companies
registered with NHB. The amount of loan will depend on the market value of the residential property,
age and prevalent interest rate. In West Bengal, State Bank of India, Bank of Allahabad, ICICI, Union
Bank of India, UCO Bank and Central Bank of India extend reverse mortgage to the elderly. However,
overall awareness in the state about the scheme and response is extremely poor. The total number
of elderly who have opted for reverse mortgage in West Bengal is 65 since 2009, with 142 more
cases in the pipeline.3
6.2.2 Health Care for the Elderly (HCE)
Public health expenditure in West Bengal is reasonably low. The elderly here largely suffer from
communicable diseases and impairment of special sensory functions like vision and hearing.
Track records of the estimates of health burden of the BPL elderly are not in order. Geriatrics is
not yet a popular specialty. As a result, there was no dedicated infrastructure for elderly health
care particularly for the groups under the BPL category till the National Programme for the Health
Care for the Elderly (NPHCE) commenced in 2013. This section discusses the currently operational
government initiated health care schemes and community response initiatives for the elderly.
National Programme for Health Care of the Elderly (NPHCE)
The NPHCE scheme is financed in the ratio 80:20 by the central and state governments
respectively. The purpose of this scheme is to provide acceptable, affordable and quality long-term
comprehensive dedicated health care services to the ageing population of the country. For West
Bengal 2013 is the maiden year. In the first phase of this programme, three districts are being
covered – Darjeeling, Jalpaiguri and South Dinajpur (GoWB, 2013). All the three districts have
commissioned 10-bed geriatric wards in the district hospitals and regular geriatric clinics. As per
administrative data, 12 blocks have been covered where geriatric clinics are operational and work
in another 33 blocks is in progress. NPHCE is open to all the elderly, irrespective of economic class.
In order to address human resource issues under the NPHCE, it has been proposed to develop
12 additional regional geriatric centres in select medical colleges of the country in addition to 8
regional geriatric centres being developed during the 11th Plan. One of the regional centres and
medical colleges proposed is Kolkata Medical College (KMC).
3 www.reversemortgage.org

Social Security
PAGE
51
Briddhashree Yojana (BY) of Government of West Bengal
The Government of West Bengal has announced Briddhashree Yojana for the health care of
17 lakh (approximately) BPL elderly beneficiaries on record receiving old age pension. This scheme
would be operational during the current fiscal year. Three districts where trial runs are underway
for NPHCE – Darjeeling, Jalpaiguri and South Dinajpur – have been selected in the first phase. In
these districts, geriatric care infrastructure for geriatric medical care is growing with the initiatives of
NPHCE. Under the Yojana, 1,000 health check-up camps are proposed in the three selected districts
and 4,200 health check-up camps are proposed in the rest of the state for the assessment of the
health burden and escalation of medical care at the district hospitals and medical colleges of the
state absolutely free of cost. Budget provision for the first 1,000 camps is Rs. 30 lakh, while the total
provision for 5,200 camps is Rs.166 lakh (Ananda Bazar Patrika, 19 October 2013).
Varistha Yojana for Senior Citizens (VYSC)
This programme has been launched by National Insurance and other major insurance companies
and caters to multiple health needs of senior citizens in the age group 60–80 years. The policy
covers hospitalization and domiciliary hospitalization expenses as well as expenses for treatment of
critical illnesses. However, beneficiaries of this scheme in West Bengal constitute only 2 per cent in
APL category (The Economic Times, 10 July 2004).
Mobile Medicare Unit (MMU)
The scheme framed by the Ministry of Social Justice and Empowerment (MOSJE) limits grants-in-aid
for projects for older people living in slums, rural and inaccessible areas where proper health facilities
are not available. Currently there are seven MMUs in the state. The total number of beneficiaries is
2,800 (Annual Report, GoWB, 2011).
Contemporary West Bengal is focused more on ageing and elderly care than child care. One notable
community health service of the state is briefly described in Box 6.1.
BOX 6.1
Indian Medical Association, BehalaIndian Medical Association (IMA), Behala Chapter, has created an exemplary medical support system at the
community level. This centre, managed by doctors, is located in the thickly populated Behala region of Kolkata
metropolis and renders yeoman service to the parental generation. Services include: (i) home visit by professional
doctors; (ii) subsidized rate for diagnostics; (iii) ambulance facilities; (iv) hospitalization in both public and private
hospitals depending on the capacity of the beneficiary; (v) medical insurance and coverage against five fatal
diseases (COPD, knee replacement, severe heart disease, eye, kidney transplant and cancer). Unlike many
organizations promoting their profile in text or website, IMA, Behala is a genuine organization which believes
in its commitments and actions.

PAGE
52
BKPAI: West Bengal
6.2.3 Residential and Day Care Services for the Elderly
Subsidies and cash assistance are provided to people in villages for constructing their houses
themselves under (i) Indira Awas Yojana (IAY) (ii) Gitanjali and Amar Thikana. The schemes are briefly
described below.
Indira Awas Yojana (IAY)
IAY is a flagship scheme under the Ministry of Rural Development (MORD). It addresses rural housing
needs by giving grants for construction of dwelling units of BPL families. IAY has been operational
in the state since 1985–86. The funding of IAY is shared between the central and state governments
in the ratio of 75:25 respectively. Under the scheme, financial assistance of Rs. 70,000 in plain areas
and Rs. 75,000 in difficult areas (or hilly areas) is provided for construction of houses. The houses are
allotted in the name of the woman or jointly to husband and wife. The construction of the house
is the sole responsibility of the beneficiary and engagement of contractors is strictly prohibited.
Sanitary latrines and smokeless chullahs are required to be constructed along with each IAY house
for which additional financial assistance is provided from Total Sanitation Campaign (TSC) and Rajiv
Gandhi Grameen Vidyutikaran Yojana (RGGVY) respectively. Manual scavengers, tribal groups and
Maoist-affected areas are given preference in allotments. Funds are allotted under consolidated
proposals from the state government and not district-level organizations. The number of IAY
beneficiaries in the state till 2012–13 is 90,282. All beneficiaries are women, about 9,000 of whom
have crossed 60 years of age (Appendix Table A 6.4).
Gitanjali and Amar Thikana
Apart from IAY, the Government of West Bengal runs two exclusive housing schemes for BPL
category – Gitanjali and Amar Thikana. In the rural areas more than 34,000 houses have been
constructed under these two schemes. As per the administrative records there are more than 4,000
elderly beneficiaries. In the budget provision for 2013–14 Rs. 570 crores have been set aside for the
two schemes (Housing, GoWB, 2013).
Integrated Programme for Older Persons (IPOP)
In the list of sanctioned IPOP schemes recommended by the state government, the following
programmes are incorporated for shelters and day care services for the elderly – day care centre for
the elderly (DCC) and old age homes (OAH).
Day Care Centres (DCC)
Assistance is provided to non-governmental organizations (NGOs) for the maintenance of DCCs for
the aged in urban, slum, rural and tribal areas. The programme aims to keep the aged integrated
in their respective families and supplement the activities of the family by looking after their needs.

Social Security
PAGE
53
Its objective is improvement of quality of life and productive utilization of spare time. Each centre
is able to accommodate at least 50 elderly persons. There are 33 DCCs in West Bengal and the total
beneficiaries of DCC in the state are 2,700 (Annual Report, GoWB, 2011).
Old Age Homes (OAH)
The state has 23 OAHs which are run in collaboration with NGOs in different districts. The sanctioned
strength is 735 (Annual Report, GoWB, 2011).
Less than 2 per cent of the BPL elderly are utilizing day care centres and a negligible proportion (0.3%)
is utilizing old age homes provided in the state under IPOP grant-in-aid programme (Department of
Women & Child Development and Social Welfare).
6.2.4 Physical Security
A 24-hour helpline through a joint venture of Kolkata Police and NGO ‘The Bengal’ is a unique
support mechanism for the elderly. This service delivery model is named “Pronam” and is an
attempt to reach out to the elderly in the city of Kolkata by providing them psychological support
and physical security. Whenever there is an emergency call, an ambulance rushes to the caller,
and ensures hospitalization as and when needed. Pronam also extends financial support to its
members in a restricted way. If the patient is not able to bear the cost of private hospitals, he or she
is shifted to a government hospital. The total number of persons under the security umbrella of
Pronam is 8,671 (Dignity Foundation, 2011).
While Pronam is the initiative of the Kolkata Police, the West Bengal Police has initiated a similar
programme called “Saanjhbaati” in Salt Lake City where a majority of the parents of NRIs lives alone.
This group is often targeted by social miscreants. Saanjhbaati has 2,017 members (Hindustan Times,
10 September 2012).
6.3 Awareness of Major Social Security Schemes
The BKPAI survey tried to discern the awareness level of major social security schemes among
the elderly namely, IGNOAPS, IGNWPS and Annapurna Scheme in addition to any other state run
schemes. As can be seen from Figure 6.2, nearly three-quarters of men were aware of the IGNOAPS
and IGNWPS across APL and BPL categories. Surprisingly, elderly women in the BPL categories are
better aware about the widow pension scheme than their APL counterparts. Level of awareness
regarding Annapurna Scheme is relatively low for BPL elderly households.

PAGE
54
BKPAI: West Bengal
Figure 6.2: Elderly aware of national social security schemes according to sex and BPL/non-BPL household category, West Bengal 2011
72.0
32.7
69.2
76.4
37.0
77.3
42.9
18.9
81.2
44.1
20.5
68.2
0 20 40 60 80 100
IGNOAPS
Annapurna Scheme
IGNWPS
IGNOAPS
Annapurna Scheme
IGNWPS
Elde
rly
Belo
ngs
to B
PL
Hou
seho
lds
Elde
rly
Belo
ngs
to A
PL
Hou
seho
lds
Per Cent
WomenMen
Note: Only 4 elderly persons have reported awareness about any other state specific social security scheme – Indira Awas Yojana and Old Age Pension Scheme.
6.4 Coverage and Financing of Major Social Security Schemes
This section provides information on the penetration of social security schemes with respect to the
beneficiaries covered, quantum of benefits (with the years of revision) and financing for financial
years 2011–12 and 2012–13.
As can be seen from Table 6.2, the percentage of elderly benefitting from IGNOAPS has drastically
declined from 75 per cent in 2011-12 to 53 per cent in 2012-13. On the other hand, elderly benefitting
from IGNWPS has more than doubled during the same period. There is no major difference
in the proportion of elderly benefitting from other schemes in the state. Another interesting
thing to note here is that although the allocation of funds towards the scheme has increased by
Rs. 306.61 crores (64%) in this one year, the annual expenditure on these schemes has drastically
declined by Rs. 313.40 crores (53.7%) (Table 6.2). Such underutilization indicates a misappropriation
of the government funds which has serious implications on the credibility and functioning of the
state government. A total allotment of Rs. 1,049 crores was done for the health care and services
provision in the state for the current fiscal year (2013-14), of which 40 per cent was allocated for the
BPL citizens. However, total funds allocated for the elderly households is not yet clear (since it is the
currently running FY) (Administrative data, GoWB).
Nearly one-fourth of the BPL women utilize IGNWPS while a slightly lower percentage of BPL
men utilize IGNOAPS (Fig. 6.3). There is a fairly low utilization of Annapurna Scheme as well. The
gap between awareness and utilization of the social security schemes by the BPL elderly (Fig. 6.2
and Fig. 6.3) needs to be bridged to ensure their effective implementation.
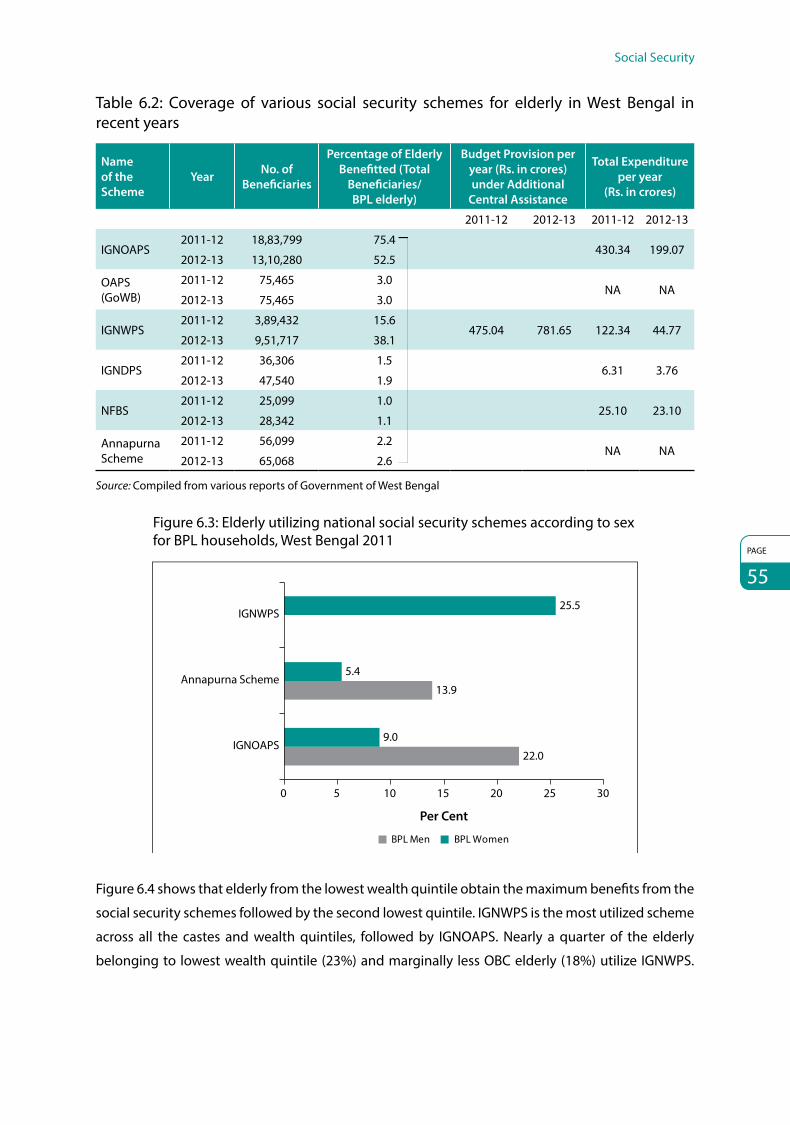
Social Security
PAGE
55
Table 6.2: Coverage of various social security schemes for elderly in West Bengal in recent years
Name of the Scheme
Year No. of Beneficiaries
Percentage of Elderly Benefitted (Total
Beneficiaries/ BPL elderly)
Budget Provision per year (Rs. in crores) under Additional
Central Assistance
Total Expenditure per year
(Rs. in crores)
2011-12 2012-13 2011-12 2012-13
IGNOAPS2011-12 18,83,799 75.4
430.34 199.072012-13 13,10,280 52.5
OAPS (GoWB)
2011-12 75,465 3.0NA NA
2012-13 75,465 3.0
IGNWPS2011-12 3,89,432 15.6
475.04 781.65 122.34 44.772012-13 9,51,717 38.1
IGNDPS2011-12 36,306 1.5
6.31 3.762012-13 47,540 1.9
NFBS2011-12 25,099 1.0
25.10 23.102012-13 28,342 1.1
Annapurna Scheme
2011-12 56,099 2.2NA NA
2012-13 65,068 2.6
Source: Compiled from various reports of Government of West Bengal
Figure 6.3: Elderly utilizing national social security schemes according to sex for BPL households, West Bengal 2011
22.0
13.9
9.0
5.4
25.5
0 5 10 15 20 25 30
IGNOAPS
Annapurna Scheme
IGNWPS
Per Cent
BPL WomenBPL Men
Figure 6.4 shows that elderly from the lowest wealth quintile obtain the maximum benefits from the
social security schemes followed by the second lowest quintile. IGNWPS is the most utilized scheme
across all the castes and wealth quintiles, followed by IGNOAPS. Nearly a quarter of the elderly
belonging to lowest wealth quintile (23%) and marginally less OBC elderly (18%) utilize IGNWPS.

PAGE
56
BKPAI: West Bengal
Figure 6.4: Elderly utilizing national social security schemes according to wealth quintile and caste/tribe, West Bengal 2011
0 5 10 15 20 25
SC/ST
OBC
11.56.0
15.95.9
6.618.0
4.51.9
13.8Others
Cast
e/Tr
ibe
IGNWPS Annapurna Scheme IGNOAPS
Per Cent
Lowest
Second
Middle
Fourth
1.90.0
12.88.3
23.44.8
2.115.6
3.2
5.12.6
0.0
0.0
4.7
HighestW
ealth
Qui
ntile
Similarly, SC/ST elderly also avail comparatively higher benefits (16%) from IGNOAPS. This pattern
indicates the right direction in the targeting of beneficiaries for such welfare schemes. Annapurna
Scheme has the least utilization among all the elderly across higher wealth status categories and
social groups.
Other Schemes and Facilities
Besides the above mentioned major social security schemes, the Government of India and several
state governments provide various other benefits in terms of travel concessions, deposit interest
rates, MGNREGA benefits to the elderly etc. (Alam et al 2012). BKPAI survey respondents were
questioned about their utilization of such facilities and schemes and their answers were recorded.
One-fourth of the elderly belonging to the highest wealth quintile (24%) enjoys train ticket
concessions, followed by higher interest rate in bank deposits (18%) and bus seat reservation
(9%). However, MGNREGA Scheme is utilized by the poor elderly (7%) (Fig. 6.5). This suggests that
elderly are eager to engage in the less physically strenuous work activities to earn income for their
sustenance. It also reaffirms the fact that elderly with financial constraints fail to take advantage of
income benefits provided by the government due to poor availability of personal income. Moreover,
this highlights the fact that the elderly in the lowest wealth quintile suffers from extreme poverty
which requires concrete efforts from the government to provide them adequate financial assistance
and food subsidies.

Social Security
PAGE
57
Figure 6.5: Elderly utilizing the facilities/schemes by lowest and highest wealth quintile, West Bengal 2011
0.8 0.1 0 0 0
6.6
24.3
9.4
0
18.4
2.50
0
5
10
15
20
25
30
Train ticket concession
Bus seat reservation
Income taxbene�ts
MGNREGA
Lowest Highest
Preferencefor
telephoneconnection
Higherinterest fordeposits inbanks/post
o�ces
Per C
ent
Health Insurance Schemes
Health insurance schemes are not spread across the country because only less than 2 per cent of
the total population is covered under such schemes and for the elderly, it is less than 1 per cent
(NSSO 60th round), despite the fact that a large number of the elderly suffers from acute or chronic
morbidities and requires hospitalization as seen in the previous section. The survey respondents
were asked if they are covered by health insurance – government, public, private or any other
type – and it was observed that health insurance coverage is abysmally low in the state with only
1 per cent of elderly men covered under the government-assisted schemes. An almost negligible
proportion of elderly are covered under public and private health insurance schemes (Fig. 6.6).
Figure 6.6: Elderly covered under health insurance and other policies by sex, West Bengal 2011
1.3
0.4
0.10
0.7
0.2
0
0.5
1
1.5
Men Women Total
Per C
ent
Government assisted Public and private health insurance schemes

PAGE
58
BKPAI: West Bengal
Rashtriya Swasthya Bima Yojana (RSBY)
This IT-enabled health insurance programme provides cashless insurance for hospitalization in
government as well as private hospitals. The scheme started enrolling in April 2008. Every BPL family
pays Rs. 30 as registration fee to get a biometric-enabled smart card containing their fingerprints
and photographs. This enables them to receive patient medical care up to Rs. 30,000 per family
per year in any of the empanelled hospitals. Pre-existing illness is covered for the head of the
household, spouse and up to three dependent children or parents. This is a shared financial scheme
of central government (75%) and state government (25%). RSBY is bringing health care investment
in Public-Private Partnership (PPP) model in semi-urban and rural areas for setting up state-of-the-
art hospitals. According to the latest updates of the administrative records 55,39,688 citizens in West
Bengal are served under RSBY (Health & Family Welfare, GoWB, 2013).
BKPAI respondents were questioned about their awareness and utilization of the RSBY scheme.
Nearly one-tenth of the elderly in BPL households is aware of the scheme with 7 per cent
registered under the scheme. However, awareness and registration is less in the case of APL
households. Men are more likely to be aware about the scheme than the women across rural and
urban areas (Table 6.3).
Table 6.3: Per cent distribution of elderly awareness and coverage under Rashtriya Swasthya Bima Yojana (RSBY) by place of residence and sex, West Bengal 2011
Awareness and Coverage of RSBY
Rural Urban Total
Men Women Total Men Women Total Men Women Total
Elderly Belonging to BPL Households
Awareness of RSBY 12.7 10.0 11.2 11.3 1.5 5.4 12.4 8.2 10.1
Registered under RSBY 7.9 8.6 8.3 0.4 0.1 0.2 6.5 6.9 6.7
Number of elderly 122 164 286 69 89 158 191 253 444
Elderly Belonging to APL Households
Awareness of RSBY 15.0 2.8 8.8 7.6 1.7 4.5 12.0 2.4 7.0
Registered under RSBY 0.0 0.3 0.1 0.6 0.0 0.3 0.3 0.2 0.2
Number of elderly 168 176 344 226 237 463 394 413 807
All
Awareness of RSBY 14.2 6.1 9.9 8.8 2.0 5.2 12.4 4.7 8.3
Registered under RSBY 3.8 4.1 3.9 0.6 0.4 0.5 2.7 2.9 2.8
Number of elderly 296 347 643 302 330 632 598 677 1,275
6.5 Emerging Issues of Social Security Schemes for the Elderly
The provision of social security schemes as explained in this section is not efficiently and universally
utilized and even availed of by the non-targeted population in certain instances (i.e. the APL elderly)
hence, identification of existing bottlenecks in the implementation of these welfare schemes is of

Social Security
PAGE
59
utmost importance. The prime domains of the problem areas in the effective implementation of the
social security schemes for the elderly are listed below:
(i) IGNWPS: Exclusion and inclusion errors, lack of transparency, no grievance redressal mechanism.
(ii) IGNOAPS: Timeliness – delayed pension payment. Only 21 per cent of beneficiaries receive
monthly payment. No grievance redressal mechanism.
(iii) Annapurna Scheme: Inept social marketing.
(iv) Government of West Bengal Pension Plan for the Elderly: Fund Crunch.
6.6 Summary of Findings and Policy Direction
This section has described the various social security schemes currently operational in the state and
their coverage across the length and breadth of the state. Several pertinent issues have emerged in
this study which require immediate attention from the government and civil society.
z Overall, financial securities are considered inadequate by the beneficiaries, because of the
gap between the cost index of the commodity market and the amount of the benefits. It is
disheartening to notice some political protectionism also deprives older people of their genuine
share in the social security schemes. There are complaints that some benefits were often based
on the discretion of the Panchayat administration.
z Maintenance and Welfare of Parents and Senior Citizens Act, 2007 came into force in West Bengal
from 12 January 2009. In the present scenario, 66 Maintenance Tribunals are operational in 20
districts of West Bengal. One Appellate Tribunal has been set up in every district. On record there
are 82 claims for maintenance filed in the Maintenance Tribunals, of which 34 have been settled.
In the Appellate Tribunals, 51 cases have been filed and 2 have been rejected (GoWB, 2013).
z It is observed that the health-based programme, NPHCE, is yet to achieve its maturity. There is a
huge shortage of professional doctors in the rural areas.
z Social marketing is inadequate to generate awareness of the benefits of the common services
for the elderly.
z Veracity of the data on the BPL elderly beneficiaries on record for payment of old age pension
ought to be ratified during the proposed 5,200 medical check-up camps under the Briddhashree
Yojana (BY).
z As Aadhar is gaining momentum in the state, it is expected that complexities of identification
will be reduced in the coming years.
z Social security supports for the elderly are unsafe without a government to citizen-centric
grievance redressal mechanism. This tool should be put in place for the elderly beneficiaries
under national as well as state-specific schemes on priority basis.

PAGE
60
7. The Way ForwardThis report describes the status of the elderly in West Bengal by analyzing five key dimensions
of their life encompassing: (i) livelihood and employment, (ii) income and assets, (iii) living
arrangements and family relationships, (iv) health status, health seeking behaviour and health care
payments, and (v) knowledge and utilization of social welfare schemes. Barring the last – knowledge
of and access to welfare schemes – many of these issues were examined by using the data obtained
from the BKPAI survey as described at the beginning of the report. The section on state specific
welfare schemes for the elderly drew inputs from several states reports, one-on-one discussions
with officials of the concerned departments, state based NGOs and other knowledgeable persons.
All this has provided some important areas for consideration by the state welfare mandarins in
terms of the way ahead to further improve the quality of elderly population in the state over the
coming years.
Improving the Economic and Social Welfare of Senior Citizens
As seen from the discussion in Section 3 on work, income and asset ownership among the elderly in
West Bengal, it is evident that economic compulsions driven by poverty are the major reason for the
elderly persons to continue to work even at older ages. Although the results indicate that a majority
of the elderly earn some income, it is clear that such earnings fall short of their economic needs. For
females, and particularly for the widows and those belonging to no or low asset poor households,
income earned from all sources including pensions is mostly inadequate. Therefore, improving the
economic lives of the elderly and extending the benefits of social protection through well-designed
safety nets lie at the core of social welfare programmes for the elderly.
Due to factors like economic compulsions, low asset bases and overall poverty, a significant
proportion of the elderly from the poorer socio-economic groups continue to work in less
remunerative, informal occupations. Hence, the need for a well-targeted social security
scheme – primarily through old-age pensions – or engaging physically able elderly workers with
appropriately rewarding jobs such as under the MGNREGA or in alternative vocations through the
NLM (National Literacy Mission) is almost essential.
Appropriate measures need to be considered for late-life economic returns for the elderly by linking
them with suitable economic activity such as through self-help groups (SHGs), while simultaneously
addressing their special needs such as health and disability through integrated programmes.
As a priority measure, the elderly from BPL families or those without any familial support should be

The Way Forward
PAGE
61
accorded highest importance and catered to. Full coverage of all eligible persons on the BPL list
must be immediately ensured. Wide publicity of criteria to become eligible for BPL households must
be given by various means including local newspapers and FM channels to enhance awareness and
ensure more and more people can apply. Alongside, a strict monitoring mechanism may be laid
down to ensure timely payment. As a number of vulnerable people remain uncovered at present,
schemes that deal with socially vulnerable groups like the aged should be extended beyond the
BPL list to cover all families except those that are excluded as per the criteria adopted by the
Expert Group Report on BPL Identification Methodology during the 11th Five Year Plan. The Central
Government should make funds available for this purpose. All IT initiatives should also be made
available as means to redress grievances. Recent efforts by the IT Department, Government of West
Bengal, in electronic/mobile-governance are laudable.
Vrindavan Widows: An Epitome of Whammy and Vulnerability
An important illustration demonstrating the vulnerability of elderly is the “Vrindavan widows”.
A survey of 255 widows in and around Vrindavan (Uttar Pradesh) was conducted by the Guild of
Service (2007) and it was observed on the basis of the survey that a large majority of these women
(80%) were from West Bengal. The survey has also observed that these women were compelled to
leave their house after the death of their husband and they moved to Vrindavan not only to seek
spirituality but also to escape filial abuse, poverty and ill treatment. They lived in pathetic conditions
and were denied access to health, shelter and financial services from the various stakeholders. Only
25 per cent of them received some paltry pension, and the rest lived in penury as they were unaware
of the pension scheme operational in West Bengal. Moreover, they were also denied pension due to
absence of a legal identity or residential proof. They do not have a state domicile in Uttar Pradesh and
hence remain economically vulnerable. It is therefore imperative for the West Bengal government to
identify the widows from the state and issue them an identity card stating their domiciliary status so
that they can avail state sponsored benefits.
Interestingly, every district in West Bengal has a widow’s pension quota, but it is insufficient to cover
all the widowed. The survey of the Vrindavan widows mentioned above has also found out that the
district magistrate and officials were not even aware of widows leaving West Bengal for Vrindavan
to evade injustice. In order to resolve the challenges faced by these elderly women, it is essential to
establish rehabilitation homes in the state with food, shelter and medical facilities. Information on
the pension schemes applicable to the widows should be well advertised and registration of death
certificate should be efficiently tracked in the districts.
Creation of Supportive Environment and Improvement in Provisions for Physical Security
Supporting the persistence of strong social norms in the state, the survey further emphasises the
major role played by the elderly in both familial and social matters. These range from grandparenting

PAGE
62
BKPAI: West Bengal
to resolving various family disputes and conflicts. These roles and elderly contributions need to be
effectively communicated to the younger generation and society at large through short stories,
various media portals, local drama clubs, religious gatherings, video games where elderly may be
shown as arbitrators in a brawl or dispute, etc. Social media may have a role by displaying sentiments
against elderly abuse and age linked discrimination. Initiatives like Pronam and Saanjhbaati should
be given wider coverage to ensure safety against physical and/or mental abuse of the elderly.
Improving the Health Status of Elderly
The elderly in West Bengal are seen to have one of the worst health conditions – both in terms of
acute illnesses or chronic health conditions as well as functional limitations – as compared to their
peers in almost all other states, Kerala being an exception. Functional limitations, both involving
ADL and IADL activities, have been observed to be increasing in rural areas. This calls for a special
attention to the health system to gear up to respond to this largely unmet need and the growing
demand for geriatric services. Further studies are also required to understand the reasons explaining
the subjective health assessments or its correlates so that interventions can be broad-based by
integrating curative as well as preventive or health promotion aspects. This study clearly reveals the
urgent need to integrate geriatric health services as a part of the primary health care system with
adequate infrastructure (such as creation of age friendly healthcare facilities in hospitals, nursing
homes and other places, viz. ramps, sheds, etc.) and train the health workforce in the specific aspects
of elderly care.
Regarding mental health services, as noted earlier, the need of the hour is to undertake
comprehensive studies on the social epidemiology of mental health as well as explore possible
policy interventions integrated with the primary health care system – such as geriatric counsellors –
to address the issues of psychological health and related conditions among the elderly.
Measures for Improvement in RSBY
Response to RSBY in West Bengal is encouraging. Therefore, there should be proper tools to
improve the scheme to meet the needs of the beneficiaries. There are inbuilt mechanisms in RSBY
with room for improvement. These are:
z The inclusion provision of intermediaries such as NGOs in assisting BPL households. The
intermediaries will be paid for the services they render in reaching out to the beneficiaries.
z RSBY envisages a robust monitoring and evaluation system. An elaborate backend data
management system is proposed.
z The basic design of the scheme may be modified to include the elderly member/s of the
household as an insured member under the scheme.

The Way Forward
PAGE
63
Districts with Faster Ageing Need to Concentrate on Geriatric Planning
West Bengal has specific districts and regions with very high, almost double digit, share of elderly
populations. These districts include Kolkata, North 24 Parganas, Nadia and Hugli. The state
government may consider identifying such other fast greying districts for more focused and
elaborate planning for elderly care.
Public and Private Services Targeting the Elderly
With accelerating growth of 60+ cohorts across the country in general and West Bengal in particular,
services targeting the elderly such as health, income security, and measures against physical and
other forms of abuse require serious attention by most political parties in the state. With the
emerging realization that the elderly constitute a large vote bank, there may be a growing
assertion from pro-elderly NGOs and organizations seeking favour for older adults from the future
governments. Similarly, in the coming years, the elderly may act as economic power to boost
demand for various businesses including manufacturers, service providers, bankers, insurers and
retailers. Businesses therefore need to plan for age friendly services to tap the potential of this
important and growing market segment. Future elderly may be many times better off economically
than their current counterparts with considerably more purchasing power.


PAGE
65Appendices

PAGE
66
BKPAI: West Bengal
Appendix TablesTable A 2.1: Per cent distribution of elderly households by select household and housing characteristics according to place of residence, BKPAI survey and census, West Bengal 2011
Housing CharacteristicsBKPAI Census 2011
Rural Urban Total Total
Number of Usual Members
1 7.9 5.6 7.1 3.4
2 12.4 10.9 11.9 9.4
3-5 49.1 56.0 51.5 64.2
6+ 30.7 27.7 29.6 22.9
Total 100.0 100.0 100.0
Mean HH size 4.8 4.8 4.8
Head of the Household
Elderly men headed HHs 51.5 54.8 52.7
NAElderly women headed HHs 22.7 28.0 24.6
Non-elderly headed HHs 25.8 17.3 22.8
Age Group
<15 19.4 14.0 17.5
NA15-59 56.8 60.3 58.0
60+ 23.8 25.7 24.5
Sex Ratio (Females per 1,000 Males)
<15 964 1,043 986NA
15-59 1,037 1,057 1,044
60+ 1,137 1,131 1,135
Total 995 1,035 1,009 950
Religion of the HHs
Hindu 77.6 90.1 82.0
NAMuslim 22.3 9.9 17.9
Others 0.2 0.1 0.1
Caste/Tribe
SC 41.1 23.9 34.8
NAST 5.1 0.9 3.6
OBC 9.8 6.7 8.7
Others 44.0 68.6 53.0
Type of House
Kachha 57.1 7.6 39.7
NASemi-pucca 20.6 25.7 22.4
Pucca 22.3 66.7 37.9
No. of Rooms
1 24.3 11.5 19.8 52.2
2 30.1 19.8 26.5 29.2
3 24.7 34.4 28.1 8.4
4+ 20.9 34.4 25.6 6.6
Contd...

Appendices
PAGE
67
Housing CharacteristicsBKPAI Census 2011
Rural Urban Total Total
Source of Drinking Water
Own piped water 4.4 27.4 12.550.8
Public piped water 18.5 44.6 27.7
Own well/borewell 14.0 7.6 11.828.8
Public well/borewell 36.6 9.1 26.9
Others 26.4 11.3 21.1 20.4
Toilet Facility
Public latrine 4.0 6.5 4.9 2.5
Septic tank/Flush system 31.8 55.3 40.1 20.7
Pit latrine 27.4 31.9 29.0 25.6
No facility/Uses open 36.7 6.3 26.1 38.6
Cooking Fuel
Electricity NA NA NA 0.1
LPG/natural gas 5.9 57.5 24.1 18.0
Biogas 1.3 7.9 3.6 10.3
Kerosene 0.7 4.0 1.9 2.1
Coal/lignite 3.2 9.8 5.57.9
Charcoal 6.2 10.6 7.7
Wood 37.9 9.0 27.7 33.1
Straw/shrubs/grass 29.8 0.7 19.6NA
Agricultural crop waste 5.0 0.0 3.3
Dung cakes 9.2 0.2 6.1 10.0
Others 0.6 0.3 0.5 2.7
Total 100.0 100.0 100.0
No. of Elderly HH 597 560 1,157
NA: Data not available.
Table A 2.2: Percentage of elderly households with various possessions, loan and support system according to place of residence, BKPAI survey and census, West Bengal 2011
Household PossessionsBKPAI Census 2011
Rural Urban Total Total
Households Goods
Electricity 71.5 94.6 79.6 54.5
Mattress 20.5 52.2 31.6
NA
Pressure cooker 23.7 76.1 42.1
Chair 54.1 86.0 65.3
Cot or bed 87.5 94.9 90.1
Table 40.2 72.8 51.6
Electric fan 62.8 91.3 72.8
Radio or transistor 8.4 14.6 10.6 18.3
Black and white television 9.8 8.7 9.435.3
Colour television 30.8 78.9 47.7
Sewing machine 2.6 12.7 6.1 NA
Mobile phone 58.2 83.7 67.1 42.9
Contd...

PAGE
68
BKPAI: West Bengal
Household PossessionsBKPAI Census 2011
Rural Urban Total Total
Any landline phone 3.4 21.2 9.6 2.3
Computer 0.8 13.4 5.3 6.1
Internet facility 0.4 9.9 3.7 2.2
Refrigerator 6.2 45.9 20.1
NA
Watch or wall/Alarm clock 68.2 89.3 75.6
Water pump 5.1 19.5 10.2
Thresher 4.0 0.0 2.6
Tractor 0.4 0.0 0.3
Bicycle 65.1 64.8 65.0 27.2
Motorcycle or scooter 8.8 21.9 13.4 8.5
Animal-drawn cart 3.9 0.2 2.6 NA
Car/Jeep 0.5 3.4 1.5 2.2
Account in bank/Post office 52.1 81.3 62.4 48.8
Households Possessing Cards
APL 52.8 76.1 61.0
NA
BPL 40.3 19.6 33.0
Antyodaya 4.8 2.2 3.9
Not in possession of any card 1.9 1.9 1.9
Don’t know/No response 2.1 2.2 2.1
Own Any Agriculture Land
No land 52.0 94.8 67.0
NA
Only irrigated land 31.3 3.2 21.4
Only non-irrigated land 14.6 2.0 10.2
Both 2.1 0.0 1.4
Don’t know/No answer 52.0 94.8 67.0
Monthly Per Capita Consumption Expenditure (MPCE)
≤1000 47.5 20.2 37.9
NA
1001-1500 29.1 21.4 26.4
1501-2500 13.8 26.2 18.2
2500+ 9.6 32.3 17.6
Don’t Know NA NA NA
Wealth Quintile
Lowest 54.0 10.1 38.6
NA
Second 27.7 16.7 23.9
Middle 10.8 24.7 15.7
Fourth 5.3 23.7 11.7
Highest 2.3 24.8 10.2
Contd...

Appendices
PAGE
69
Contd...
Household PossessionsBKPAI Census 2011
Rural Urban Total Total
Amount of Outstanding Loan (Rs.)
None 53.1 81.9 63.2
NA
<15000 25.8 7.0 19.2
15000-30000 9.0 3.3 7.0
30000-60000 6.0 1.8 4.6
60000-100000 3.7 1.6 3.0
100000 – 150000 0.9 0.8 0.9
150000 – 200000 0.0 1.4 0.5
200000 + 0.8 1.9 1.2
DK/No answer 0.7 0.2 0.6
No. of Elderly HH 597 560 1,157
Purpose of Loan
Expenditure on health of elderly 16.8 28.2 18.8
NA
Expenditure on health of others 12.5 14.3 12.8
Agriculture 31.2 1.1 25.9
Business 7.9 20.4 10.1
Education 2.4 9.4 3.6
Marriage 10.4 11.4 10.6
Home/Vehicle loan 12.6 21.7 14.2
Others 24.4 15.1 22.8
No. of Elderly HH 278 108 386
Table A 2.3: Per cent distribution of elderly by select background characteristics, West Bengal 2011
Elderly CharacteristicsBKPAI
Men Women Total
Age Groups (Years)
60-64 36.0 34.1 35.0
65-69 28.8 25.9 27.3
70-74 18.3 19.0 18.7
75-79 8.5 10.8 9.7
80-84 5.5 5.9 5.7
85-89 2.0 2.4 2.2
90+ 0.9 1.8 1.4
Education Categories
No formal education 28.8 65.9 48.5
<5 years completed 16.1 11.4 13.6
5-7 years completed 11.4 9.7 10.5
8 years and above 42.9 12.2 26.5
Don't know/No response 0.9 1.0 0.9

PAGE
70
BKPAI: West Bengal
Elderly CharacteristicsBKPAI
Men Women Total
Marital Status
Currently married 83.6 26.2 53.1
Widowed 11.8 71.7 43.7
Others 4.6 2.1 3.3
Mean children ever born 3.9 4.6 4.3
Re-marriage among Ever Married
Rural 7.0 1.3 4.0
Urban 2.5 0.0 1.2
Total 5.5 0.9 3.0
Migration Status
Migrated after 60 years of age 2.8 3.8 3.3
Migrated before 60 years of age 35.8 81.9 60.3
Did not migrate 60.6 10.6 34.0
Don't know/No response 0.8 3.8 2.4
Number of Elderly 598 677 1,275
Table A 3.1: Percentage of elderly currently working or ever worked according to place of residence and sex, West Bengal 2011
Work StatusRural Urban Total
Men Women Total Men Women Total Men Women Total
Currently working 49.9 7.5 27.3 25.7 8.5 16.6 41.9 7.8 23.8
Ever worked 98.5 18.2 55.8 98.9 17.9 55.9 98.6 18.1 55.8
Number of elderly 296 347 643 302 330 632 598 677 1,275
Table A 3.2: Percentage of elderly according to their work status and intensity of work by background characteristics, West Bengal 2011
Background Characteristics
Currently Working
Number of Elderly
Main Worker (More Than 6 Months Per
Year)
More than Four Hours a Day
Number of Currently Working
Elderly
Age Group
60-69 30.0 794 77.7 96.1 239
70-79 16.0 359 79.0 91.8 58
80+ 6.3 122 * * 6
Sex
Men 41.9 598 78.1 97.4 242
Women 7.8 677 75.3 82.7 61
Residence
Rural 27.3 643 74.0 97.2 172
Urban 16.6 632 89.7 86.8 131
Contd...

Appendices
PAGE
71
Background Characteristics
Currently Working
Number of Elderly
Main Worker (More Than 6 Months Per
Year)
More than Four Hours a Day
Number of Currently Working
Elderly
Marital Status
Currently married 34.1 669 78.5 97.1 225
Widowed 11.2 560 72.3 87.8 66
Others (23.9) 46 * * 12
Education
None 21.3 604 78.1 94.8 131
1-4 years 31.9 172 69.3 93.1 55
5-7 years 24.4 153 (85.9) (95.8) 38
8+ years 24.2 346 79.1 95.6 79
Religion
Hindu 23.6 1,037 76.0 94.3 247
Muslim 25.0 235 84.9 97.1 56
Others * 3 NA NA NA
Caste/Tribe
SC/ST 31.7 377 71.6 94.5 117
OBC 18.8 97 * * 18
Others 19.9 801 82.9 94.5 168
Wealth Quintile
Lowest 32.2 418 70.6 94.6 141
Second 23.3 299 82.5 94.0 73
Middle 20.1 231 (93.6) (96.7) 49
Fourth 12.4 171 * * 23
Highest 12.6 153 * * 17
Living Arrangement
Living alone 31.6 86 (86.6) (85.1) 30
Living with spouse 38.9 122 (63.8) (96.8) 43
Living with all others 21.5 1,067 79.5 95.5 230
Total 23.8 1,275 77.6 94.8 303
Note: () Based on 25-49 unweighted cases * Percentage not shown; based on fewer than 25 unweighted cases.

PAGE
72
BKPAI: West Bengal
Table A 3.3: Per cent distribution of currently working elderly by type of occupation and sector of employment according to place of residence and sex, West Bengal 2011
Employment StatusRural Urban Total
Men Women Total Men Women Total Men Women Total
Type of Occupation
Technicians/professionals 4.2 (0.0) 3.6 11.9 (0.5) 8.8 5.7 0.2 4.8
Office/clerical 1.7 (0.0) 1.5 10.2 (14.6) 11.4 3.5 5.2 3.8
Cultivators 18.6 (2.1) 16.2 0.1 (0.0) 0.1 14.9 1.3 12.5
Petty traders/workers 5.7 (12.3) 6.7 5.8 (4.4) 5.4 5.7 9.5 6.4
Agricultural labourer 35.6 (17.0) 32.9 2.9 (0.3) 2.2 29.0 11.0 25.9
Other work 30.7 (30.5) 30.6 47.8 (33.4) 43.9 34.1 31.5 33.7
Don’t know/ No answer 3.5 (38.3) 8.6 21.4 (46.8) 28.3 7.1 41.3 13.1
Sector of Employment
Public sector 4.3 (2.9) 4.1 5.9 (16.0) 8.6 4.6 7.6 5.2
Private organised 2.1 (3.3) 2.3 23.0 (0.0) 16.8 6.4 2.1 5.6
Self-employed 27.4 (10.3) 24.9 30.7 (12.9) 25.9 28.0 11.2 25.1
Informal employment 65.0 (79.7) 67.1 31.4 (70.8) 42.1 58.2 76.5 61.4
Others 1.2 (3.8) 1.6 9.0 (0.3) 6.7 2.8 2.6 2.7
Total 100.0 (100.0) 100.0 100.0 (100.0) 100.0 100.0 100.0 100.0
Number of elderly currently working 146 26 172 96 35 131 242 61 303
Note: () Based on 25-49 unweighted cases

Appendices
PAGE
73
Table A 3.4: Per cent distribution of currently working elderly by the need to work according to background characteristics, West Bengal 2011
Background Characteristics By Choice By Economic/Other
Compulsion Total No. of Elderly
Age Group
60-69 9.3 90.7 100.0 239
70-79 9.2 90.8 100.0 58
80+ * * 100.0 6
Sex
Men 12.0 88.0 100.0 242
Women 0.0 100.0 100.0 61
Residence
Rural 8.3 91.7 100.0 172
Urban 15.4 84.6 100.0 131
Marital Status
Currently married 11.8 88.2 100.0 225
Widowed 4.3 95.7 100.0 66
Others * * * 12
Education
None 2.0 98.0 100.0 131
1-4 years 2.0 98.0 100.0 55
5-7 years (0.3) (99.7) 100.0 38
8+ years 32.0 68.0 100.0 79
Religion
Hindu 11.7 88.3 100.0 247
Muslim 2.0 98.0 100.0 56
Others * * * 0
Caste/Tribe
ST/SC 4.9 95.1 100.0 117
OBC * * 100.0 18
Others 13.6 86.4 100.0 168
Wealth Quintile
Lowest 0.7 99.3 100.0 141
Second 6.4 93.6 100.0 73
Middle (14.8) (85.2) 100.0 49
Fourth * * 100.0 23
Highest * * 100.0 17
Total 9.9 90.1 100.0 303
Living Arrangement
Living alone (4.5) (95.5) 100.0 30
With spouse (8.9) (91.1) 100.0 43
Others 10.7 89.3 100.0 230
Note: () Based on 25-49 unweighted cases * Percentage not shown; based on fewer than 25 unweighted cases.

PAGE
74
BKPAI: West Bengal
Table A 3.5: Percentage of elderly receiving work benefits by background characteristics, West Bengal 2011
Background Characteristics Retirement Pension Both Retirement
and Pension None Number of Elderly
Age Group
60-69 9.9 10.0 7.8 88.0 794
70-79 8.1 7.3 6.1 90.8 359
80+ 7.8 9.1 6.1 90.2 122
Sex
Men 17.8 17.2 13.9 78.9 598
Women 1.5 1.9 1.3 97.9 677
Residence
Rural 4.7 4.0 3.6 95.0 643
Urban 18.6 19.4 14.5 76.7 632
Marital Status
Currently married 13.7 14.0 10.9 83.2 669
Widowed 2.3 2.3 1.8 97.2 560
Others (26.7) (19.2) (19.2) (73.3) 46
Education
None 1.3 1.1 0.9 98.5 604
1-4 years 3.2 3.2 1.9 95.4 172
5-7 years 6.3 5.2 5.2 93.7 153
8+ years 28.1 28.2 22.5 66.1 346
Religion
Hindu 10.3 10.2 8.0 87.6 1,037
Muslim 3.4 3.0 2.7 96.3 235
Others * * * * 3
Caste/Tribe
SC/ST 4.0 3.9 3.3 95.4 377
OBC 10.7 10.2 8.7 87.8 97
Others 11.9 11.8 9.2 85.5 801
Wealth Quintile
Lowest 0.0 0.0 0.0 100.0 418
Second 3.3 3.7 2.5 95.6 299
Middle 11.7 11.4 7.8 84.7 231
Fourth 23.5 22.2 17.4 71.7 171
Highest 38.7 38.2 33.9 57.0 153
Living Arrangement
Living alone 3.4 3.0 2.0 95.6 86
With spouse 12.6 14.6 11.9 84.6 122
Others 9.2 8.9 7.1 89.0 1,067
Total 9.2 9.0 7.2 89.0 1,275

Appendices
PAGE
75
Table A 3.6: Per cent distribution of elderly by annual personal income according to place of residence and sex, West Bengal 2011
Income (in Rupees)
Rural Urban Total
Men Women Total Men Women Total Men Women Total
No income* 28.6 68.3 49.7 23.9 59.1 42.6 27.1 65.3 47.4
≤12,000 17.5 24.4 21.2 10.0 19.6 15.1 15.1 22.8 19.2
12,001–24,000 18.5 2.5 10.0 8.7 4.4 6.4 15.3 3.1 8.8
24,001–50,000 20.5 3.1 11.3 13.6 5.8 9.5 18.2 4.0 10.7
50,001+ 14.2 1.7 7.5 42.5 11.1 25.8 23.5 4.8 13.5
Total 100.0 100.0 100.0 100.0 100.0 100.0 100.0 100.0 100.0
Mean 31,371 4,535 17,048 57,333 13,296 33,818 39,897 7,414 22,558
Number of elderly 294 347 641 300 330 630 598 677 1,275
*No income includes don’t know/no response
Table A 3.7: Percentage of elderly by sources of current personal income according to place of residence and sex, West Bengal 2011
Sources of Income*Rural Urban Total
Men Women Total Men Women Total Men Women Total
Salary/Wages 28.7 5.8 16.5 17.6 6.9 11.9 25.0 6.2 15.0
Employer’s pension (government or other) 5.8 2.8 4.2 35.8 6.8 20.4 15.7 4.1 9.5
Social pension (old age/widow) 9.7 20.9 15.7 6.8 14.6 10.9 8.8 18.8 14.1
Agricultural/Farm income 26.5 1.2 13.0 0.0 0.0 0.0 17.8 0.8 8.8
Other sources of income 11.8 4.9 8.1 24.1 15.5 19.5 15.8 8.4 11.9
No income 28.6 68.3 49.7 23.9 59.1 42.6 27.1 65.3 47.4
Number of elderly 296 347 643 302 330 632 598 677 1,275
* Multiple sources of income
Table A 3.8: Per cent distribution of elderly by their perceived magnitude of contribution towards household expenditure according to place of residence and sex, West Bengal 2011
Proportion of Contribution
Rural Urban Total
Men Women Total Men Women Total Men Women Total
No income/ No contribution 28.6 68.3 49.7 23.9 59.1 42.6 27.1 65.3 47.4
<40% 12.8 14.9 13.9 14.7 17.5 16.2 13.4 15.7 14.7
40-60% 14.2 5.0 9.3 12.0 6.4 9.0 13.5 5.5 9.2
60-80% 11.1 3.2 6.9 9.8 2.7 6.0 10.7 3.0 6.6
80+ 31.6 7.7 18.9 38.3 10.5 23.5 33.8 8.6 20.4
Don’t know/ No answer 0.0 0.2 0.1 0.0 0.9 0.5 0.0 0.5 0.2
Total 100.0 100.0 100.0 100.0 100.0 100.0 100.0 100.0 100.0
Number of elderly 296 347 643 302 330 632 598 677 1,275

PAGE
76
BKPAI: West Bengal
Table A 3.9: Per cent distribution of elderly by their financial dependency status and main source of economic support according to place of residence and sex, West Bengal 2011
Rural Urban Total
Men Women Total Men Women Total Men Women Total
Financial Dependence
Fully dependent 46.0 77.7 62.9 34.3 70.3 53.4 42.1 75.3 59.7
Partially dependent 36.0 16.2 25.5 36.2 21.7 28.5 36.0 18.0 26.5
Not dependent 18.1 6.1 11.7 29.5 8.0 18.1 21.9 6.7 13.8
Don’t know/ No answer NA NA NA NA NA NA NA NA NA
Total 100.0 100.0 100.0 100.0 100.0 100.0 100.0 100.0 100.0
Source of Economic Support
Son 64.8 67.0 66.0 54.8 61.6 58.4 61.5 65.3 63.5
Spouse 3.5 4.5 4.1 1.5 8.0 5.0 2.8 5.7 4.4
Daughter 1.4 2.5 2.0 4.2 1.7 2.9 2.3 2.3 2.3
Others 12.2 19.8 16.3 10.0 20.7 15.7 11.5 20.1 16.1
Not dependent on anyone 18.1 6.1 11.7 29.5 8.0 18.1 21.9 6.7 13.8
Total 100.0 100.0 100.0 100.0 100.0 100.0 100.0 100.0 100.0
Number of elderly 296 347 643 302 330 632 598 677 1,275
Table A 4.1: Per cent distribution of elderly by type of living arrangement according to select background characteristics, West Bengal 2011
Background Characteristic Alone Spouse
OnlySpouse, Children
and GrandchildrenChildren and
Grandchildren Others Total Number of Elderly
Age Group
60-69 6.2 9.7 44.2 25.6 14.3 100.0 794
70-79 6.7 8.8 31.0 42.1 11.4 100.0 359
80+ 6.2 5.5 23.2 46.3 18.8 100.0 122
Sex
Men 1.6 13.7 61.6 9.9 13.3 100.0 598
Women 10.5 5.0 18.1 51.9 14.4 100.0 677
Residence
Rural 7.3 10.2 37.4 31.9 13.3 100.0 643
Urban 4.4 6.8 40.8 32.9 15.1 100.0 632
Marital Status
Currently married 0.1 16.5 72.5 0.0 10.9 100.0 669
Widowed 13.5 0.0 0.0 71.6 14.9 100.0 560
Others (11.3) (9.9) (0.0) (29.7) (49.1) (100.0) 46
Education
None 8.8 7.1 25.9 46.1 12.2 100.0 604
1-4 years 4.0 15.2 42.3 23.9 14.6 100.0 172
5-7 years 4.9 4.1 45.4 29.3 16.4 100.0 153
8+ years 3.5 11.6 57.5 11.7 15.7 100.0 346
Contd...

Appendices
PAGE
77
Background Characteristic Alone Spouse
OnlySpouse, Children
and GrandchildrenChildren and
Grandchildren Others Total Number of Elderly
Employment
Never worked 7.8 5.6 19.7 51.9 15.0 100.0 563
Previously worked 2.5 8.9 52.0 21.9 14.7 100.0 409
Currently working 8.7 15.8 55.2 9.7 10.7 100.0 303
Religion
Hindu 5.5 8.8 40.1 31.5 14.2 100.0 1,037
Muslim 10.4 9.6 31.4 36.0 12.6 100.0 235
Others * * * * * 100.0 3
Caste/Tribe
SC/ST 6.4 11.5 35.5 33.7 12.9 100.0 377
OBC 0.8 5.2 46.3 31.2 16.6 100.0 97
Others 7.0 8.2 39.2 31.5 14.1 100.0 801
Wealth Quintile
Lowest 12.9 10.6 29.7 34.6 12.3 100.0 418
Second 2.4 11.1 37.7 34.9 13.9 100.0 299
Middle 1.2 6.0 47.2 27.4 18.2 100.0 231
Fourth 2.2 6.8 53.3 26.1 11.6 100.0 171
Highest 4.5 6.2 42.9 30.8 15.5 100.0 153
Total 6.3 9.1 38.6 32.1 13.9 100.0 1,275
Table A 4.2: Per cent distribution of elderly by preferred living arrangement in old age according to present living arrangement and sex, West Bengal 2011
Preferred Living Arrangement
Present Living Arrangement
Alone Spouse Only Children and Others Total
Men
Alone 36.4 0.0 0.9 1.6
Spouse only 17.0 35.3 4.1 13.7
Children and others 46.7 64.7 94.9 84.7
Total 100.0 100.0 100.0 100.0
Women
Alone 66.7 7.4 6.5 10.5
Spouse only 5.6 26.0 1.9 5.0
Children and others 27.7 66.6 91.7 84.5
Total 100.0 100.0 100.0 100.0
Total
Alone 58.8 2.3 4.1 6.3
Spouse only 8.6 32.4 2.8 9.1
Children and others 32.7 65.3 93.0 84.6
Total 100.0 100.0 100.0 100.0

PAGE
78
BKPAI: West Bengal
Table A 4.3: Percentage of elderly with no meeting and no communication between elderly and their non co-residing children, West Bengal 2011
Background Characteristics No Meeting No Communication No. of Elderly
Age Group
60-69 9.3 24.4 593
70-79 13.0 42.7 302
80+ 16.8 43.3 100
Sex
Men 8.0 24.2 438
Women 13.6 37.8 557
Residence
Rural 9.2 34.8 539
Urban 15.7 24.7 456
Marital Status
Currently married 8.4 24.8 514
Widowed 14.4 39.4 469
Others * * 12
Education
None 11.0 38.6 494
1-4 years 10.1 34.1 144
5-7 years 12.4 22 118
8+ years 11.5 2.0 239
Employment
Never worked 13.7 40.0 462
Previously worked 12.3 31.2 313
Currently working 4.2 22.0 220
Religion
Hindu 10.6 30.2 789
Muslim 13.7 38.4 205
Others * * 1
Caste/Tribe
SC/ST 8.7 35.8 306
OBC 10.0 27.3 85
Others 12.8 30.0 604
Wealth Quintile
Lowest 10.5 39.1 352
Second 8.0 36.2 237
Middle 10.0 24.2 184
Fourth 14.6 18.3 123
Highest 23.7 14.1 99
Total 11.2 31.8 995
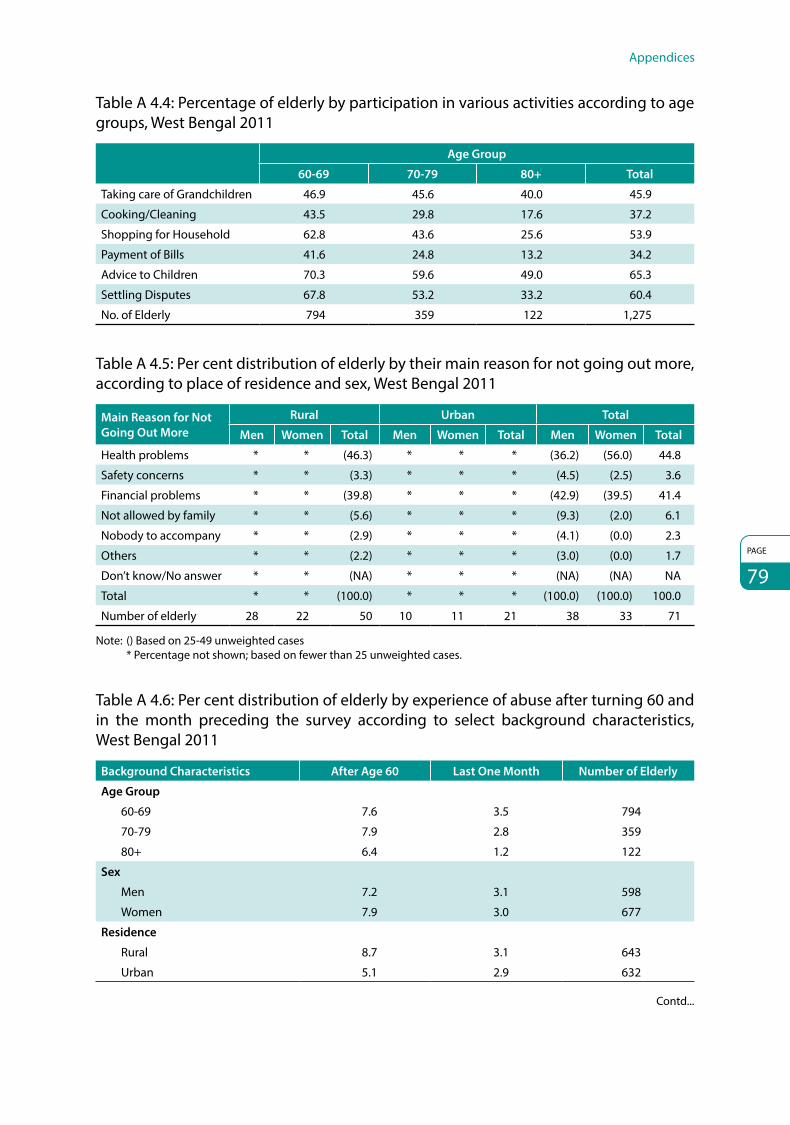
Appendices
PAGE
79
Table A 4.4: Percentage of elderly by participation in various activities according to age groups, West Bengal 2011
Age Group
60-69 70-79 80+ Total
Taking care of Grandchildren 46.9 45.6 40.0 45.9
Cooking/Cleaning 43.5 29.8 17.6 37.2
Shopping for Household 62.8 43.6 25.6 53.9
Payment of Bills 41.6 24.8 13.2 34.2
Advice to Children 70.3 59.6 49.0 65.3
Settling Disputes 67.8 53.2 33.2 60.4
No. of Elderly 794 359 122 1,275
Table A 4.5: Per cent distribution of elderly by their main reason for not going out more, according to place of residence and sex, West Bengal 2011
Main Reason for Not Going Out More
Rural Urban Total
Men Women Total Men Women Total Men Women Total
Health problems * * (46.3) * * * (36.2) (56.0) 44.8
Safety concerns * * (3.3) * * * (4.5) (2.5) 3.6
Financial problems * * (39.8) * * * (42.9) (39.5) 41.4
Not allowed by family * * (5.6) * * * (9.3) (2.0) 6.1
Nobody to accompany * * (2.9) * * * (4.1) (0.0) 2.3
Others * * (2.2) * * * (3.0) (0.0) 1.7
Don’t know/No answer * * (NA) * * * (NA) (NA) NA
Total * * (100.0) * * * (100.0) (100.0) 100.0
Number of elderly 28 22 50 10 11 21 38 33 71
Note: () Based on 25-49 unweighted cases * Percentage not shown; based on fewer than 25 unweighted cases.
Table A 4.6: Per cent distribution of elderly by experience of abuse after turning 60 and in the month preceding the survey according to select background characteristics, West Bengal 2011
Background Characteristics After Age 60 Last One Month Number of Elderly
Age Group
60-69 7.6 3.5 794
70-79 7.9 2.8 359
80+ 6.4 1.2 122
Sex
Men 7.2 3.1 598
Women 7.9 3.0 677
Residence
Rural 8.7 3.1 643
Urban 5.1 2.9 632
Contd...

PAGE
80
BKPAI: West Bengal
Background Characteristics After Age 60 Last One Month Number of Elderly
Marital Status
Currently married 5.6 3.0 669
Widowed 9.3 3.2 560
Others (15.3) (3.2) 46
Education
None 9.5 3.8 604
1-4 years 10.2 4.7 172
5-7 years 6.0 2.3 153
8+ years 3.0 1.1 346
Employment
Never worked 7.6 3.0 563
Previously worked 7.0 3.6 409
Currently working 8.2 2.4 303
Religion
Hindu 7.3 3.0 1,037
Muslim 8.9 3.5 235
Others 0.0 0.0 3
Caste/Tribe
SC/ST 6.1 2.6 377
OBC 5.5 1.4 97
Others 8.7 3.5 801
Wealth Quintile
Lowest 11.8 4.7 418
Second 7.3 2.5 299
Middle 4.5 2.5 231
Fourth 3.7 0.9 171
Highest 1.7 1.7 153
Living Arrangement
Alone 20.7 3.9 83
Spouse only 10.1 3.6 117
Spouse, children and grandchildren 5.2 3.1 479
Children and grand children 8.5 2.8 416
Others 4.1 2.6 180
Total 7.5 3.0 1,275

Appendices
PAGE
81
Table A 5.1: Percentage of elderly by self rated health status according to place of residence and sex, West Bengal 2011
Self Rated HealthRural Urban Total
Men Women Total Men Women Total Men Women Total
Current Health
Excellent NA NA NA NA NA NA NA NA NA
Very good 2.6 1.0 1.7 7.8 4.5 6.0 4.3 2.2 3.2
Good 17.9 14.3 16.0 23.9 21.6 22.7 19.9 16.7 18.2
Fair 49.2 41.3 45.0 50.0 37.6 43.4 49.4 40.1 44.5
Poor 30.4 43.4 37.3 18.4 36.3 27.9 26.4 41.1 34.2
Don’t know/No answer NA NA NA NA NA NA NA NA NA
Total 100.0 100.0 100.0 100.0 100.0 100.0 100.0 100.0 100.0
Current Health Compared to One Year Before
Better 2.1 1.3 1.7 3.1 2.1 2.5 2.4 1.6 2.0
Same 49.9 42.5 46.0 63.4 47.9 55.2 54.4 44.3 49.0
Worse 47.5 54.9 51.4 32.5 48.7 41.1 42.6 52.9 48.0
Don’t know/No answer 0.5 1.3 0.9 1.0 1.4 1.2 0.7 1.3 1.0
Total 100.0 100.0 100.0 100.0 100.0 100.0 100.0 100.0 100.0
Current Health Compared to People of Same Age
Better 12.2 8.1 10.0 12.0 11.5 11.7 12.1 9.2 10.6
Same 36.8 30.8 33.6 41.1 29.4 34.9 38.2 30.4 34.0
Worse 43.1 49.3 46.4 26.2 36.0 31.4 37.5 44.9 41.5
Don’t know/No answer 8.0 11.8 10.0 20.7 23.1 22.0 12.2 15.5 14.0
Total 100.0 100.0 100.0 100.0 100.0 100.0 100.0 100.0 100.0
Number of Elderly 296 347 643 302 330 632 598 677 1,275
Table A 5.2: Percentage of elderly by self rated health according to select background characteristics, West Bengal 2011
CharacteristicsCurrent Health: Excellent/Very
Good
Current Health Compared to One Year Before: Better or Same
Current Health Compared to People of Same Age:
Better or Same
Number of Elderly
Age Group
60-69 3.8 55.8 49.1 794
70-79 2.7 45.2 37.1 359
80+ 0.1 36.3 37.2 122
Sex
Men 4.3 56.8 50.3 296
Women 2.2 45.8 39.6 347
Residence
Rural 1.7 47.7 43.6 643
Urban 6.0 57.7 46.6 632
Marital Status
Currently married 4.6 57.4 49.1 669
Widowed 1.4 42.5 39.7 560
Others (3.9) (59.6) (35.4) 46
Contd...

PAGE
82
BKPAI: West Bengal
CharacteristicsCurrent Health: Excellent/Very
Good
Current Health Compared to One Year Before: Better or Same
Current Health Compared to People of Same Age:
Better or Same
Number of Elderly
Education
None 1.6 43.6 37.9 604
1-4 years 0.9 44.4 50.5 172
5-7 years 1.8 59.1 46.2 153
8+ years 7.8 64.7 53.4 346
Employment
Never 2.4 46.3 39.7 563
Previously worked 3.6 47.1 41.3 409
Currently working 4.0 64.8 58.0 303
Religion
Hindu 3.8 53.1 46.2 1,037
Muslim 0.2 40.8 37.3 235
Others * * * 3
Caste/Tribe
SC/ST 2.0 45.8 41.8 377
OBC 1.7 48.3 47.3 97
Others 4.0 54.3 45.8 801
Wealth Quintile
Lowest 0.0 43.8 37.8 418
Second 3.1 45.4 42.0 299
Middle 3.6 59.2 54.8 231
Fourth 4.7 59.0 52.5 171
Highest 12.8 69.8 50.8 153
Living Arrangement
Living alone 0.0 39.2 35.1 86
Living with spouse 0.8 52.2 36.9 122
Living with all others 3.7 51.7 46.2 1,067
Total 3.2 51.0 44.6 1,275
Table A 5.3: Percentage of elderly needing full/partial assistance in ADL activities according to place of residence and sex, West Bengal 2011
Type of ADLRural Urban Total
Men Women Total Men Women Total Men Women Total
Bathing 7.1 12.2 9.8 4.1 8.5 6.4 6.1 11.0 8.7
Dressing 5.3 4.0 4.6 2.6 10.5 6.8 4.4 6.1 5.3
Toilet 3.0 6.2 4.7 1.9 5.7 3.9 2.6 6.0 4.4
Mobility 1.7 2.2 2.0 1.9 4.0 3.0 1.7 2.8 2.3
Continence 4.3 3.9 4.1 3.4 7.5 5.6 4.0 5.1 4.6
Feeding 0.4 1.1 0.8 0.4 1.7 1.1 0.4 1.3 0.9
Needs at least one assistance 11.1 14.0 12.7 7.3 13.5 10.6 9.9 13.8 12.0
Needs full assistance 0.3 0.5 0.4 0.4 1.4 0.9 0.3 0.8 0.6
Number of elderly 296 347 643 302 330 632 598 677 1,275

Appendices
PAGE
83
Table A 5.4: Percentage of elderly by IADL limitations according to place of residence and sex, West Bengal 2011
Type of ActivityRural Urban Total
Men Women Total Men Women Total Men Women Total
Use of Phone 34.6 52.5 44.1 13.5 28.6 21.5 27.6 44.7 36.7
Shopping 65.1 91.5 79.1 49.8 88.0 70.1 60.1 90.3 76.2
Preparation of meals 96.0 66.7 80.4 87.3 63.0 74.4 93.1 65.5 78.4
Housekeeping tasks 21.2 23.2 22.2 16.7 21.8 19.4 19.7 22.7 21.3
Laundry 61.9 34.1 47.1 57.5 38.1 47.2 60.5 35.4 47.2
Travel independently 31.6 48.0 40.3 20.7 39.9 30.9 28.0 45.3 37.2
Dispensing own medicines 49.7 67.6 59.2 33.8 41.4 37.9 44.5 59.0 52.2
Handling finances 18.9 56.0 38.6 11.2 44.6 28.9 16.4 52.3 35.4
Can perform none 5.4 9.8 7.8 1.9 8.4 5.4 4.3 9.4 7.0
1-3 28.3 35.7 32.3 18.6 25.3 22.2 25.1 32.3 28.9
4-5 37.1 35.0 36.0 30.3 31.0 30.7 34.8 33.7 34.2
6-7 26.7 16.8 21.4 43.2 28.2 35.2 32.1 20.5 26.0
Can perform all 2.5 2.7 2.6 6.0 7.2 6.6 3.6 4.2 3.9
Number of elderly 296 347 643 302 330 632 598 677 1,275
Table A 5.5: Percentage of elderly by ADL and IADL limitations according to background characteristics, West Bengal 2011
Background Characteristics
ADL IADL
Needs Assistance
in at Least One
Activity
Needs Assistance in at Least
Three Activities
Need Assistance
in All Activities
Can Perform
No Activity
Can Perform
All Activities
Can Perform
1-3 Activities
Can Perform
4-7 Activities
Number of
Elderly
Age Group
60-69 6.5 1.9 0.2 2.8 5.5 20.1 71.6 794
70-79 16.1 4.6 0.8 10.2 1.3 40.8 47.7 359
80+ 36.2 13.0 2.7 25.2 1.3 51.9 21.6 122
Sex
Men 9.9 2.4 0.3 4.3 3.6 25.1 67.0 598
Women 13.8 4.8 0.8 9.4 4.2 32.3 54.2 677
Residence
Rural 12.7 3.6 0.4 7.8 2.6 32.3 57.4 643
Urban 10.6 3.9 0.9 5.4 6.6 22.2 65.9 632
Marital Status
Currently married 9.4 2.6 0.3 4.7 3.8 21.6 69.9 669
Widowed 15.3 5.0 1.0 10.0 4.2 38.8 47.0 560
Others (9.5) (3.0) (0.0) (2.9) (2.1) (16.6) (78.5) 46
Contd...

PAGE
84
BKPAI: West Bengal
Background Characteristics
ADL IADL
Needs Assistance
in at Least One
Activity
Needs Assistance in at Least
Three Activities
Need Assistance
in All Activities
Can Perform
No Activity
Can Perform
All Activities
Can Perform
1-3 Activities
Can Perform
4-7 Activities
Number of
Elderly
Wealth Quintile
Lowest 14.6 3.9 0.2 7.6 2.4 35.4 54.6 418
Second 12.5 3.0 0.8 8.2 2.7 29.7 59.4 299
Middle 10.6 4.5 0.0 6.3 4.2 22.3 67.2 231
Fourth 6.1 4.5 1.9 7.0 4.1 19.9 69.1 171
Highest 9.8 2.2 0.8 2.6 12.6 23.9 60.9 153
Living Arrangement
Alone 10.0 0.9 0.0 0.7 12.0 19.4 67.9 86
Spouse only 9.8 5.1 0.6 1.2 5.7 20.0 73.1 122
Children and others 12.4 3.7 0.6 8.1 3.1 30.7 58.1 1,067
Total 12.0 3.7 0.6 7.0 3.9 28.9 60.2 1,275
Table A 5.6: Percentage of elderly by full/partial disability according to place of residence and sex, West Bengal 2011
Type of Disabilities
Rural Urban Total
Men Women Total Men Women Total Men Women Total
Vision
Full 12.9 15.2 14.1 17.2 22.7 20.2 14.4 17.7 16.1
Partial 65.0 65.5 65.3 61.8 53.2 57.3 64.0 61.5 62.6
Hearing
Full 3.7 4.0 3.9 3.5 2.3 2.9 3.7 3.5 3.6
Partial 27.4 34.0 30.9 26.3 19.5 22.7 27.0 29.2 28.2
Walking
Full 5.4 6.2 5.8 7.2 7.4 7.3 6.0 6.6 6.3
Partial 36.6 40.3 38.6 26.4 29.1 27.8 33.3 36.6 35.0
Chewing
Full 5.1 6.8 6.0 9.2 8.7 8.9 6.4 7.4 7.0
Partial 39.6 34.6 36.9 26.3 20.0 23.0 35.2 29.8 32.3
Speaking
Full 1.0 2.0 1.6 0.4 0.4 0.4 0.8 1.5 1.2
Partial 23.3 21.3 22.3 13.6 11.0 12.2 20.1 17.9 19.0
Memory
Full 3.9 3.1 3.5 0.9 2.3 1.7 2.9 2.8 2.9
Partial 45.8 39.0 42.2 21.3 22.2 21.8 37.7 33.5 35.5
Number of elderly 296 347 643 302 330 632 598 677 1,275

Appendices
PAGE
85
Table A 5.7: Percentage of elderly by full/partial locomotor disability according to background characteristics, West Bengal 2011
Background Characteristics Vision Hearing Walking Chewing Speaking Memory Number of
Elderly
Age Group
60-69 75.4 24.7 36.7 35.1 16.6 36.1 794
70-79 83.7 39.5 45.5 43.7 22.9 37.9 359
80+ 85.8 55.6 60.2 53.6 35.4 54.5 122
Sex
Men 78.3 30.7 39.3 41.6 21.0 40.7 598
Women 79.1 32.7 43.2 37.2 19.4 36.3 677
Residence
Rural 79.4 34.8 44.4 42.9 23.8 45.7 643
Urban 77.4 25.6 35.1 31.9 12.6 23.5 632
Marital Status
Currently married 77.1 27.4 39.6 38.2 19.8 36.7 669
Widowed 81.7 38.0 45.0 41.3 21.3 41.0 560
Others (65.3) (20.0) (20.7) (29.6) (8.9) (29.4) 46
Caste/Tribe
SC/ST 79.9 35.0 43.8 40.7 21.3 36.8 377
OBC 84.6 48.6 48.3 36.3 19.8 39.8 97
Others 77.3 27.7 39.0 38.9 19.5 39.0 801
Wealth Quintile
Lowest 78.6 31.3 43.9 40.1 21.3 43.3 418
Second 78.0 40.4 47.6 42.1 24.3 45.9 299
Middle 77.8 30.6 44.5 46.5 21.6 33.4 231
Fourth 79.8 30.0 32.2 33.0 16.1 28.3 171
Highest 81.9 16.2 21.3 24.0 7.3 20.4 153
Table A 5.8: Percentage of elderly using disability aids according to sex and place of residence, West Bengal 2011
Form of AssistanceSex Residence Number of
ElderlyMen Women Rural Urban Total
Spectacles/Lenses 39.9 37.8 33.0 50.7 38.8 1001
Hearing aids 0.9 0.8 0.6 1.4 0.9 390
Walking sticks 6.5 5.5 7.0 3.8 6.0 516
Denture 2.3 1.5 1.0 3.6 1.8 483

PAGE
86
BKPAI: West Bengal
Table A 5.9: Percentage of elderly classified based on General Health Questionnaire (GHQ-12) and 9 items Subjective Well-Being Inventory (SUBI) according to place of residence and sex, West Bengal 2011
Mental Health StatusRural Urban Total
Men Women Total Men Women Total Men Women Total
GHQ-12 (Score 0-36)
Scores below the threshold level of ≤12 25.3 24.4 24.8 38.2 31.3 34.5 29.5 26.7 28.0
Mean score 15.7 16.6 16.2 14.5 15.5 15.0 15.3 16.2 15.8
Number of elderly 296 347 643 302 330 632 598 677 1,275
SUBI-9 (Score 9-27)
Mean score 21.2 22.3 21.8 19.5 21.2 20.4 20.7 21.9 21.3
Number of elderly 296 347 643 302 330 632 598 677 1,275
Table A 5.10: Percentage of elderly classified based on 9 items of SUBI according to age and sex, West Bengal 2011
SUBI-9 Items (Well Being/ Ill Being)
Age Group
60-69 70-79 80 Years and Above
Men Women Total Men Women Total Men Women Total
At least one negative 73.9 82.6 78.3 83.8 84.1 84.0 (82.7) 93.7 89.1
All negative 2.7 7.0 4.9 2.0 8.3 5.5 (6.2) 4.2 5.1
All positive 0.3 0.3 0.3 0.0 0.0 0.0 (0.0) 0.0 0.0
Mean score 20.3 21.7 21.0 21.0 22.2 21.6 (22.0) 22.9 22.5
Number of elderly 386 408 794 164 195 359 48 74 122
Note: Category totals may not add up to entire sample of 1,275 elderly due to non-response.
Table A 5.11: Percentage of elderly by ability to immediate recall of words (out of ten words) according to place of residence and sex, West Bengal 2011
Number of Words
Rural Urban Total
Men Women Total Men Women Total Men Women Total
None to 2 19.1 31.9 25.9 20.6 34.8 28.2 19.6 32.9 26.6
3 to 5 72.1 65.0 68.3 68.1 62.0 64.8 70.8 64.0 67.2
6 to 8 8.9 3.1 5.8 10.9 3.3 6.8 9.5 3.2 6.1
More than 8 NA NA NA 0.4 0.0 0.2 0.1 0.0 0.1
Total 100.0 100.0 100.0 100.0 100.0 100.0 100.0 100.0 100.0
Mean number of immediately recalled words
3.6 3.1 3.3 3.7 3.1 3.4 3.6 3.1 3.3
Number of elderly 296 347 643 302 330 632 598 677 1,275

Appendices
PAGE
87
Table A 5.12: Percentage of elderly by personal health habits or risky health behaviours according to place of residence and sex, West Bengal 2011
Type of Substance
Rural Urban Total
Men Women Total Men Women Total Men Women Total
Current Use
Smoking 41.6 1.5 20.2 24.3 0.8 11.8 35.9 1.3 17.5
Alcohol consumption 1.7 0.0 0.8 1.9 0.0 0.9 1.8 0.0 0.8
Chewing tobacco 19.2 36.9 28.6 15.0 20.5 17.9 17.8 31.5 25.1
Any of the three risk behaviours
56.4 38.0 46.6 37.5 21.4 28.9 50.1 32.6 40.8
Ever Use
Smoking 49.4 1.5 23.9 32.4 0.8 15.6 43.8 1.3 21.2
Alcohol consumption 10.8 0.2 5.2 6.2 0.0 2.9 9.3 0.1 4.4
Chewing tobacco 24.3 40.4 32.8 16.7 23.3 20.2 21.8 34.8 28.7
Number of Elderly 296 347 643 302 330 632 598 677 1,275
Table A 5.13: Percentage of elderly undergoing routine medical check-ups with the frequency and presently under medical care, according to place of residence and sex, West Bengal 2011
Health Check-Ups
Rural Urban Total
Men Women Total Men Women Total Men Women Total
Undergoes Routine Check-Up
22.1 27.1 24.8 28.4 34.4 31.6 24.2 29.5 27.0
No. of elderly 296 347 643 302 330 632 598 677 1,275
Frequency for Medical Check-Ups
Weekly/ Fortnightly 27.0 17.9 21.7 16.4 10.1 12.8 22.9 14.9 18.2
Monthly 47.5 65.6 58.0 49.0 63.5 57.4 48.1 64.8 57.8
Half-Yearly and more 22.6 16.6 19.1 34.6 26.3 29.8 27.3 20.3 23.2
DK/NA 2.9 0.0 1.2 0.0 0.1 0.1 1.8 0.1 0.8
Total 100.0 100.0 100.0 100.0 100.0 100.0 100.0 100.0 100.0
No. of Elderly 67 87 154 78 106 184 145 193 338

PAGE
88
BKPAI: West Bengal
Table A 5.14: Percentage of elderly reporting any acute morbidity according to place of residence and sex, West Bengal 2011
Acute Morbidity
Rural Urban Total
Men Women Total Men Women Total Men Women Total
Prevalence rate 31.2 32.8 32.0 11.3 15.4 13.5 24.6 27.1 25.9
Number of elderly 296 347 643 302 330 632 598 677 1,275
Mean number of episode per sick person
1.1 1.2 1.1 1.2 1.0 1.1 1.1 1.1 1.1
Number of elderly reporting acute morbidity
88 111 199 34 53 87 122 164 286
Table A 5.15: Prevalence rate (per 1000) of the elderly reporting any acute morbidity according to select background characteristics, West Bengal 2011
Background Characteristics Prevalence Rate Number of Elderly
Age Group
60-69 242 794
70-79 270 359
80+ 339 122
Sex
Men 246 598
Women 271 677
Residence
Rural 320 643
Urban 135 632
Marital Status
Currently married 232 669
Widowed 297 560
Others (192) 46
Caste/Tribe
SC/ST 273 377
OBC 325 97
Others 243 801
Wealth Quintile
Lowest 360 418
Second 289 299
Middle 159 231
Fourth 149 171
Highest 90 153
Living Arrangement
Alone 330 86
Spouse only 231 122
Children and others 257 1,067
Total 259 1,275

Appendices
PAGE
89
Table A 5.16: Per cent distribution of last episode of acute morbidities pattern among elderly by sex and place of residence, West Bengal 2011
MorbiditiesSex Place of Residence
TotalMen Women Rural Urban
Fever 24.2 26.1 26.6 18.8 25.3
Cough & cold 12.8 9.7 2.3 5.1 11.1
Blood pressure 8.9 11.3 10.4 9.1 10.2
Diarrhoea 6.5 8.1 7.2 8.3 7.4
Sugar/Diabetes 5.9 2.8 4.6 2.1 4.2
Gastric 2.2 3.1 2.4 4.3 2.7
Headache 3.6 1.9 2.6 2.9 2.7
Arthritis 1.4 2.7 1.8 3.9 2.1
Asthma 2.5 1.8 2.2 1.5 2.1
Leg problem 0.8 1.2 1.2 0.1 1.0
Others 28.5 28.6 26.0 41.1 28.6
Don’t know/ No response 2.7 2.8 2.7 2.8 2.7
Number of elderly 122 164 199 87 286
Note: Others include body pain, cataract, typhoid, ulcer etc.
Table A 5.17: Percentage of acute morbidity episodes for which treatment was sought according to place of residence and sex, West Bengal 2011
Place of Residence Men Women Total Number of Episodes
Rural 92.5 89.0 90.6 199
Urban 99.7 78.3 86.7 87
Total 93.6 87.0 89.9 286
Number of episodes 122 164 286
Table A 5.18: Per cent distribution of elderly by source of treatment for the last episode of acute morbidity according to place of residence and sex, West Bengal 2011
Source of Treatment
Rural Urban Total
Men Women Total Men Women Total Men Women Total
Government health facilities 19.1 15.6 17.2 (15.7) (33.2) 25.3 18.6 18.5 18.5
Private physicians 19.5 25.1 22.5 (40.0) (49.9) 45.4 22.7 29.3 26.2
AYUSH hospital/Clinic 0.6 0.0 0.3 (0.0) (2.8) 1.6 0.5 0.5 0.5
Others 60.9 59.3 60.0 (44.4) (14.1) 27.8 58.2 51.8 54.8
Total 100.0 100.0 100.0 (100.0) (100.0) 100.0 100.0 100.0 100.0
Number of elderly who sought treatment
83 99 182 33 42 75 116 141 257

PAGE
90
BKPAI: West Bengal
Table A 5.19: Per cent distribution of elderly seeking treatment for last episode of acute morbidity according to select background characteristics, West Bengal 2011
Background Characteristics
Source of Treatment
Government Health
Facilities
Private Physicians
AYUSH Hospital/
ClinicOthers Total Number of
Elderly
Age Group
60-69 19.6 26.7 0.0 53.7 100.0 147
70-79 19.2 24.4 1.6 54.8 100.0 79
80+ (11.8) (28.6) (0.0) (59.6) (100.0) 31
Sex
Men 18.6 22.7 0.5 58.2 100.0 116
Women 18.5 29.3 0.5 51.8 100.0 141
Residence
Rural 17.2 22.5 0.3 60.0 100.0 182
Urban 25.3 45.4 1.6 27.8 100.0 75
Caste/Tribe
SC/ST 31.2 21.8 0.0 47.1 100.0 84
OBC (10.9) (26.7) (0.0) (62.4) (100.0) 28
Others 11.9 28.9 0.9 58.3 100.0 145
Wealth Quintile
Lowest 19.6 23.8 0.4 56.1 100.0 123
Second 15.3 22.7 0.9 61.2 100.0 72
Middle (16.9) (32.1) (0.0) (51.0) (100.0) 28
Fourth * * * * * 20
Highest * * * * * 13
No. of Elderly 18.6 26.1 0.5 54.9 100.0 257
Note: () Based on 25-49 unweighted cases * Percentage not shown; based on fewer than 25 unweighted cases.
Table A 5.20: Average expenditure made for treatment of acute morbidities according to major heads and source of treatment, West Bengal 2011
Average Expenditure by Major Heads:
For Last 15 Days Expenditure
Govt. Health Facility
Private Physicians Others Total No. of Episodes
Total Average Expenses 666 1,789 360 780 257
% Distribution by item of expenses (based on the valid cases for which component wise details were available)
Consultation 7.2 12.3 10.7 11.1 243
Medicines 45.0 38.5 59.9 44.3 243
Diagnostic tests 30.9 30.4 20.7 28.4 243
Transportation 11.4 9.2 6.1 8.9 243
Others 5.4 9.5 2.5 7.3 243
Note: Out of 286 episodes of acute morbidity, treatment was sought only for 257 cases. For item wise expenses, there were 243 valid cases, hence percentages have been worked only for these valid cases.

Appendices
PAGE
91
Table A 5.21: Per cent distribution of elderly by source of payment for last episode of acute morbidity according to sex, West Bengal 2011
Source of Payment Men Women Total
Self 43.9 15.4 28.4
Spouse 3.3 5.7 4.6
Children 38.2 59.3 49.7
Relatives/Friends/Insurance/Others 14.6 19.7 17.4
Total 100.0 100.0 100.0
Number of elderly who sought treatment 116 141 257
Table A 5.22: Prevalence rate (per 1,000) of chronic morbidities among elderly according to place of residence and sex, West Bengal 2011
Chronic AilmentsRural Urban Total
Men Women Total Men Women Total Men Women Total
High blood pressure 175 252 216 255 311 285 201 272 239
Arthritis 149 305 232 146 201 175 148 271 213
Cataract 162 163 163 148 170 160 157 165 162
Loss of all natural teeth 174 174 174 184 86 132 177 145 160
Heart disease 96 76 85 93 59 75 95 70 82
Diabetes 62 66 64 123 85 103 82 73 77
Injury due to fall 41 65 54 16 74 47 33 68 52
Asthma 61 12 35 58 38 47 60 21 39
Cerebral stroke 48 17 32 20 29 25 38 21 29
Liver diseases 32 19 25 35 38 37 33 25 29
Alzheimer's disease 25 39 33 4 13 8 18 30 25
Accidental injury 31 23 27 10 6 8 24 18 21
Depression 9 11 10 19 27 24 13 17 15
Paralysis 15 15 15 6 20 13 12 17 14
Osteoporosis 11 14 13 0 9 5 7 12 10
Skin disease 15 9 12 4 7 6 12 8 10
Renal diseases 2 11 7 4 3 4 3 9 6
Chronic lung disease 4 0 2 4 9 7 4 3 3
Dementia 3 1 2 0 10 6 2 4 3
Cancer 0 3 1 0 0 0 0 2 1
No chronic ailments 387 274 327 400 367 382 391 305 345
One or more chronic ailments 613 726 673 600 633 618 609 695 655
Average number of chronic ailments per elderly
1.1 1.3 1.2 1.1 1.2 1.2 1.1 1.3 1.2
Number of elderly 296 347 643 302 330 632 598 677 1,275

PAGE
92
BKPAI: West Bengal
Table A 5.23: Prevalence rate (per 1,000) of common chronic morbidities among the elderly according to selected background characteristics, West Bengal 2011
Background Characteristics
High Blood
PressureArthritis Cataract
Loss of All
Natural Teeth
Heart Disease Diabetes
Injury Due to
Fall
At Least One
Number of
Elderly
Age Group
60-69 206 218 120 127 78 73 52 609 794
70-79 279 212 225 200 104 86 48 730 359
80+ 333 188 246 261 39 74 62 732 122
Sex
Men 201 148 157 177 95 82 33 609 598
Women 272 271 165 145 70 73 68 695 677
Residence
Rural 216 232 163 174 85 64 54 673 643
Urban 285 175 160 132 75 103 47 618 632
Marital Status
Currently married 207 171 139 173 91 79 44 626 669
Widowed 284 270 187 150 71 76 62 702 560
Others (156) (157) (189) (79) (81) (64) (30) (490) 46
No. of Elderly 239 213 162 160 82 77 52 290 1,275
Table A 5.24: Percentage of elderly seeking treatment for common chronic ailments during last 3 months according to sex and place of residence, West Bengal 2011
Chronic MorbiditiesSex Residence
Total Number of ElderlyMen Women Rural Urban
High blood pressure 92.2 90.1 90.1 92.2 90.9 300
Arthritis 88.0 78.4 79.9 86.0 81.5 253
Cataract 52.7 45.8 45.7 55.6 48.9 198
Loss of all natural teeth 43.1 29.8 36.3 37.6 36.7 183
Heart disease 89.3 88.2 88.6 89.4 88.8 106
Diabetes 76.6 94.6 82.9 89.1 85.6 99
Injury due to fall 100.0 82.0 88.4 85.1 87.4 57

Appendices
PAGE
93
Table A 5.25: Per cent distribution of elderly by reason for not seeking any treatment for common chronic morbidities, West Bengal 2011
Chronic Morbidities
Reasons for Not Receiving Any Treatment
Condition Improved
No Medical Facility Available in Neighborhood
Facilities Available But Lack of Faith
Long Waiting
Time
Financial Reasons
Ailment not Considered
SeriousOthers Total
Number of
Elderly
High blood pressure (4.4) (3.2) (0.0) (4.1) (76.6) (11.7) (0.0) (100.0) 26
Arthritis (8.5) (4.6) (0.0) (0.0) (46.8) (40.2) (0.0) (100.0) 43
Cataract 37.2 0.6 1.1 0.8 49.7 7.3 3.3 100.0 101
Loss of all natural teeth 9.8 1.2 0.0 0.0 23.5 64.8 0.8 100.0 114
Heart disease * * * * * * * * 15
Diabetes * * * * * * * * 10
Injury due to fall
* * * * * * * * 7
Note: () Based on 25-49 unweighted cases * Percentage not shown; based on fewer than 25 unweighted cases.
Table A 5.26: Per cent distribution of elderly by source of payment for treatment of common chronic morbidities according to sex, West Bengal 2011
Source of Payment
High Blood Pressure Arthritis Cataract
Loss of All Natural Teeth
Heart Disease Diabetes Injury Due
to Fall
Men Women Men Women Men Women Men Women Men Women Men Women Men Women
Self 61.7 19.2 66.5 13.6 (46.5) (1.8) (58.2) * (51.3) (6.4) (80.7) (19.6) * (10.9)
Spouse 0.0 10.4 1.0 12.1 (4.3) (15.5) (0.0) * (0.0) (8.5) (0.0) (16.6) * (16.1)
Children 36.6 66.8 31.4 71.0 (48.0) (80.4) (39.0) * (46.4) (85.1) (17.9) (61.7) * (70.5)
Relatives/Friends/Insurance/Others
1.7 3.6 1.2 3.3 (1.3) (2.3) (2.8) * (2.3) (0.0) (1.5) (2.2) * (2.6)
Total 100.0 100.0 100.0 100.0 (100.0) (100.0) (100.0) * (100.0) (100.0) (100.0) (100.0) * (100.0)
Number of elderly 105 165 72 130 37 42 35 24 49 40 44 43 15 34
Note: () Based on 25-49 unweighted cases * Percentage not shown; based on fewer than 25 unweighted cases.

PAGE
94
BKPAI: West Bengal
Table A 5.27: Per cent distribution of diseases as the reason for hospitalization (last episode) among elderly according to sex and place of residence, West Bengal 2011
MorbiditiesSex Place of Residence
TotalMen Women Rural Urban
Diarrhoea 6.1 16.8 13.6 8.8 12.3
Cataract & other eye surgery 8.0 14.1 11.4 11.8 11.5
Accidental injury 19.7 4.8 13.7 4.6 11.1
Heart disease and chest pain 11.6 5.2 6.0 12.5 7.9
Typhoid, malaria and fever 6.3 8.3 9.4 2.4 7.4
Renal and kidney disease 9.3 4.1 4.9 9.8 6.3
Hypertension 1.6 7.5 4.4 6.5 5.0
Asthma 5.9 1.7 3.0 4.8 3.5
Hernia 4.5 1.3 0.0 9.2 2.6
Lung diseases 0.0 4.3 1.8 4.2 2.5
Liver disease 2.2 2.2 1.8 3.2 2.2
Paralysis, cerebral stroke and thrombus 0.0 3.8 3.0 0.2 2.2
Gastric 2.9 1.5 2.9 0.0 2.1
Cancer and tumour 2.1 1.6 2.5 0.0 1.8
Brain disease 0.0 3.1 0.0 6.1 1.8
Abdomen ailment 0.1 2.9 2.3 0.2 1.7
Arthritis 3.5 0.0 2.1 0.0 1.5
Spinal and neurological disorders 0.0 2.1 1.7 0.0 1.2
Piles 0.0 1.8 1.4 0.2 1.1
Diabetes 1.7 0.0 0.0 2.5 0.7
Others 7.8 5.7 7.6 4.1 6.6
Do not know/No response 7.0 7.3 6.5 8.9 7.2
Total 100.0 100.0 100.0 100.0 100.0
Number of elderly 53 67 63 57 120
Table A 5.28: Per cent distribution of elderly by source of hospitalization care (last episode) according to place of residence and sex, West Bengal 2011
Type of HospitalsRural Urban Total
Men Women Total Men Women Total Men Women Total
Government (60.3) (63.0) 61.9 (64.0) (67.0) 65.5 61.6 64.0 62.9
Private (28.4) (35.1) 32.5 (31.7) (33.0) 32.4 29.5 34.6 32.4
AYUSH hospital/Clinic (0.0) (1.9) 1.2 (0.0) (0.0) 0.0 0.0 1.4 0.8
Others* (11.3) (0.0) 4.5 (4.4) (0.0) 2.2 9.0 0.0 3.8
Total (100.0) (100.0) 100.0 (100.0) (100.0) 100.0 100.0 100.0 100.0
Mean length of stay (8.5) (10.1) 9.5 (19.3) (5.6) 12.4 12.1 9.0 10.3
Number of hospitalization cases 25 38 63 28 29 57 53 67 120
Note: () Based on 25-49 unweighted cases *Others include charitable/missionary, NGO-run hospital, and other health facilities

Appendices
PAGE
95
Table A 5.29: Per cent distribution of elderly by source of payment for last hospitalization episode according to place of residence and sex, West Bengal 2011
Source of Payment
Rural Urban Total
Men Women Total Men Women Total Men Women Total
Self (41.9) (9.3) 22.2 (36.6) (8.2) 22.3 40.1 9.0 22.3
Spouse (6.6) (14.9) 11.6 (4.4) (9.1) 6.8 5.9 13.4 10.2
Children (37.6) (67.8) 55.8 (46.3) (69.9) 58.2 40.5 68.3 56.5
Relatives/Friends/Insurance/Others (13.9) (8.1) 10.4 (12.7) (12.9) 12.8 13.5 9.3 11.1
Total (100.0) (100.0) 100.0 (100.0) (100.0) 100.0 100.0 100.0 100.0
Number of elderly 25 38 63 28 29 57 53 67 120
Table A 6.1: Per cent distribution of elderly aware of national social security schemes according to place of residence, sex and BPL and non-BPL households, West Bengal 2011
SchemesRural Urban Total
Men Women Total Men Women Total Men Women Total
Elderly Belonging to BPL Households
IGNOAPS 72.6 43.7 56.5 69.5 39.8 51.6 72.0 42.9 55.6
Annapurna scheme 31.9 20.2 25.4 36.2 13.9 22.8 32.7 18.9 24.9
IGNWPS 68.7 81.2 75.6 71.4 81.4 77.4 69.2 81.2 76.0
Number of Elderly 122 164 286 69 89 158 191 253 444
Elderly Belonging to APL Households
IGNOAPS 78.9 45.6 61.8 72.9 41.9 56.9 76.4 44.1 59.8
Annapurna Scheme 41.7 21.1 31.1 30.2 19.7 24.8 37.0 20.5 28.5
IGNWPS 78.8 69.2 73.9 75.1 66.7 70.8 77.3 68.2 72.6
Number of elderly 168 176 344 226 237 463 394 413 807
All
IGNOAPS 76.4 45.1 59.8 72.4 41.4 56.0 75.1 43.9 58.5
Annapurna scheme 37.8 21.1 29.0 32.1 18.5 24.9 35.9 20.3 27.6
IGNWPS 74.6 75.0 74.8 74.3 70.5 72.3 74.5 73.5 74.0
Number of elderly
296 347 643 302 330 632 598 677 1,275

PAGE
96
BKPAI: West Bengal
Table A 6.2: Per cent distribution of elderly utilizing national social security schemes according to place of residence, sex and BPL and non-BPL status, West Bengal 2011
SchemesRural Urban Total
Men Women Total Men Women Total Men Women Total
Elderly Belonging to BPL Households
IGNOAPS 20.7 10.1 14.8 28.6 4.7 14.2 22.0 9.0 14.6
Annapurna Scheme 15.9 6.8 10.8 4.4 0.1 1.8 13.9 5.4 9.1
Number of elderly 122 164 286 69 89 158 191 253 444
IGNWPS NA 25.6 25.6 NA 25.2 25.2 NA 25.5 25.5
Number of elderly - 132 132 - 68 68 - 200 200
Elderly Belonging to APL Households
IGNOAPS 4.0 0.3 2.1 2.1 2.9 2.5 3.2 1.3 2.3
Annapurna Scheme 0.0 1.7 0.9 0.0 0.0 0.0 0.0 1.0 0.5
Number of elderly 168 176 344 226 237 463 394 413 807
IGNWPS NA 7.2 7.2 NA 8.7 8.7 NA 7.8 7.8
Number of elderly - 122 122 - 161 161 - 283 283
All
IGNOAPS 11.4 5.0 8.0 6.9 3.3 5.0 9.9 4.5 7.0
Annapurna Scheme 6.6 4.0 5.2 0.8 0.0 0.4 4.7 2.7 3.6
Number of elderly 296 347 643 302 330 632 598 677 1,275
IGNWPS NA 15.9 15.9 NA 12.6 12.6 NA 14.8 14.8
Number of elderly
- 260 260 - 232 232 - 492 492

Appendices
PAGE
97
Table A 6.3: Per cent distribution of elderly by awareness and utilization of special government facilities/schemes according to place of residence and sex, West Bengal 2011
Special Government Facilities/Schemes
Rural Urban Total
Men Women Total Men Women Total Men Women Total
Awareness of Facilities/Schemes
Train ticket concession 26.4 14.1 19.9 55.8 34.7 44.6 36.1 20.9 28.0
Bus seat reservation 18.0 9.5 13.5 28.9 16.4 22.2 21.6 11.8 16.4
Preference for telephone connection
6.6 4.0 5.2 10.3 6.0 8.0 7.8 4.6 6.1
Higher interest for deposits in banks/Post offices
13.3 6.2 9.5 37.4 11.3 23.5 21.3 7.9 14.1
Income tax benefits 6.9 4.7 5.7 21.5 5.8 13.2 11.7 5.0 8.2
MGNREGA 16.0 6.8 11.1 9.4 6.2 7.7 13.8 6.6 10.0
Utilization of Facilities/Schemes
Train ticket concession 4.7 0.5 2.5 17.6 8.1 12.6 9.0 3.0 5.8
Bus seat reservation 2.5 0.7 1.5 8.2 3.9 5.9 4.3 1.7 3.0
Preference for telephone connection
0.0 0.0 0.0 0.0 0.0 0.0 0.0 0.0 0.0
Higher interest for deposits in banks/post offices
3.5 0.7 2.0 13.2 3.7 8.2 6.7 1.7 4.0
Income tax benefits 0.3 0.0 0.1 2.5 0.0 1.2 1.0 0.0 0.5
MGNREGA 8.8 1.5 4.9 0.0 0.0 0.0 5.9 1.0 3.3
Number of elderly 296 347 643 302 330 632 598 677 1,275
Table A 6.4: Performance of Indira Awas Yojana (IAY) in West Bengal
Financial Rs. (Crore)
1. Central allocation 751.29
2. Total availability of fund 812.75
3. Fund utilized 333.41
4. Percentage of fund utilization 41.02
Physical Rs. (Crore)
1. Target 2,19,553.00
2. Houses sanctioned 80,286.00
3. Percentage of houses completed 36.57
Source: Department of Panchayat and Rural Development, Government of West Bengal, 2013, Administrative Record
PAGE
98
ReferencesAlam, M., K.S. James, G. Gridhar, K.M. Sathyanarayana, S. Kumar, S. Siva Raju, T.S. Syamala, L. Subaiya,
D.W. Bansod, 2012. “Report on the Status of Elderly in Select States of India, 2011”, United Nations Population
Fund (India), http://india.unfpa.org/drive/AgeingReport_2012_F.pdf
Beteille Andre, 2007. “The Middle Class” FREEDOM, Sixty Years after Independence”, Art & Heritage
Foundationpp, pp 23–52.
Britanica Online Encyclopedia. “Vanga – History of West Bengal”, downloaded on 06th February 2014.
http://www.britanica.com
Chattopadhyay J., 2013. “Garib Briddhader Chikitsar Sujog Dite ‘Briddhashree” in Bengali. Anandabazar Patrika
(Bengali Daily News Paper), 19th October.
Calcutta Metropolitan Institute of Gerontology (CMIG), 2012. “Status of the Aged in Kolkata – Animated
through Interactive Reporting.” Funded by National Institute of Social Defence, Ministry of Social Justice &
Empowerment, Govt. of India, New Delhi.
_______________, 2011-13. “Dynamics of Elder Care” Funded by Indian Council of Social Science Research,
New Delhi.
_______________, 2011. “Consequence of Ageing in the District of Bankura and Burdwan, West Bengal”. Funded
by CMIG, Kolkata.
Chakravarty S.K., 2011. “Modelling of a Single Index to Measure the Well-being of the Elderly”Ageing & Society;
The Indian Journal of Gerontology, CMIG, Vol. XXI NO III & IV, pp. 59–65.
Chatterjee P., 2009. “The Coming Crisis in West Bengal”, Economic & Political Weekly, Vol. XLIV No. 09, pp 42-45.
Census 2011 C-Tables, electronic data. Downloaded from http://censusindia.gov.in/
Dignity Foundation, 2011. “Kolkata based Dignity Foundation as Savior for Aged and Infirmed” 8th May
http://www.dignityfoundation.com/Dignity-News.aspx
Dror D., S. Vellakkal, 2012. “Is RSBY India’s Platform to Implementing Universal Hospital Insurance?” The Indian
Journal of Medical Research, Vol 135, pp.56–63
Gavrilova, N.S and L.A. Gavrilov, 2009. “Rapidly Ageing Populations: Russia/Eastern Europe.” In Peter Uhlenberg
(Ed.), International Handbook of Population Ageing, USA, Chapel Hill: Springer.
Gavrilov, L.A. and P. Heuveline, 2003. “Ageing of Population.” In P. Demeny and G. McNnicoll, (Eds.).
The Encyclopedia of Population, Macmillan Reference USA, New York, pp. 32-37.
Goldberg, D.P., & B. Blackwell, 1970. ”Psychiatric Illness in General Practice: A Detailed Study Using a New Method
of Case Identification.” British Medical Journal, 1, pp. 439-443.

PAGE
99
References
Government of India, 2008. “Integrated Programme for Older Persons – A Central Sector Scheme to Improve the
Quality of Life of the Older Persons.” Ministry of Social Justice & Empowerment, Govt. of India, New Delhi.
________________ 2013, National Programme for the Health Care of the Elderly (NPHCE) – An approach
towards active and healthy ageing: Operational Guidelines. 2013. Directorate General of Health Services.
Ministry of Health & Family Welfare, New Delhi.
Government of West Bengal, 2013. Housing Department, www.wbhousing.gov.in, 2013.
Rashtriya Swastha Bima Yojana, Ministry of Labour and Department of Health & Family Welfare,.
www.rsbywb.gov.in/statewise.aspx
__________________, 2010. “Status Implementation of Food Schemes in West Bengal – A Report Based on Field
Survey in Four Districts”. Office of adviser to Supreme Court Commissioners, Kolkata, West Bengal.
__________________, 2010. Annual Report 2010-11. Department of Women and Child Development and
Social Welfare, Kolkata, West Bengal.
HelpAge India, 2012. “Project activity report for West Bengal State.” New Delhi, India
www.helpageindiaprogramme.
___________________, 2010. “Reverse mortgage – Opportunities: Social awareness programme” IIFT, Delhi.
www.reversemortgage.org
Hill K., W. Seltzer, J. Leaning, S.J. Malik, S.S. Rusell., 2004, “The Demographic Impact of Partition: Bengal in 1947”
Andrew W. Mellon Foundation and the Weatherhead Center for International Affairs, Harvard University,
USA, pp 1-25.
Kinsella K. and V.A. Velkoff, 2001. “An Ageing World: 2001.” US Government Printing Office, Washington, DC.
Kolkata Police, 2011. “PRONAM – A joint initiative of Kolkata Police, The Bengal & Dignity Foundation”.
www.kolkatapolice.gov.in .
Kumar A. and N. Anand, 2006. “Poverty Target Programs for the Elderly in India with Special Reference to
National Old Age Pension Scheme 1995” Chronic Poverty Research Centre (CPRC) and Indian Institute of Public
Administration (IIPA), New Delhi, pp 1-51.
Lamb S. 2009, “Ageing & Indian Diaspora”, Indiana University Press, Bloomberg, Indiana, USA.
Maulik S., A. Dasgupta, 2012. “Depression and Its Determinants in the Rural Elderly of West Bengal:
A Cross-Sectional Study,” International Journal of Biological & Medical Research,3(1), pp. 1299–1302.
Mukherjee, M., 2004. “A Situational Analysis of Women and Girls in West Bengal,” National Commission for
Women, New Delhi, pp. 144.
National Sample Survey Organisation (NSSO), 2003. “Morbidity, Health Care and the Condition of the Aged”:
NSS 60th Round (January-June 2004), Report No. 507 (60/25.0/1), National Sample Survey Organisation,
Department of Statistics, Ministry of Planning and Plan Implementation, Government of India.

PAGE
100
BKPAI: West Bengal
Planning Commission, 2010. “West Bengal Development Report,” published on behalf of the Planning
Commission (Government of India) by Academic foundation, New Delhi.
Rai U., 2007. “Spirituality, Poverty, Charity Brings Widows to Vrindavan” Survey conducted by Guild of Service;
supported by UNIFEM, New Delhi, India
SRS Bulletin, 2012. “Sample Registration System,” Registrar General, Government of India, Vol. 47(2), October,
2012, New Delhi.
SRS Analytical Studies 2012. “SRS based Abridged Life Tables 2003—07 to 2006-10” Registrar General,
Government of India New Delhi. http://www.censusindia.gov.in/vital_statistics/SRS_Based/Introduction.pdf
The Economic Times, Mumbai 2004. “PM to launch Varishtha Pension Bima Yojana on July 14” 10 July.
http://articles.economictimes.indiatimes.com/2003-07-10/news/27543440_1_upper-age-limit-varishtha-
pension-bima-yojana-lic-release
The Hindustan Times, Kolkata 2012. “Time for new age policing” 10th September http://www.hindustantimes.
com/india-news/kolkata/time-for-new-age-policing/article1-927347.aspx
The Times of India, Kolkata 2008 “Reverse mortgage finds few” 24th November http://articles.timesofindia.
indiatimes.com/2008-11-24/kolkata/27893126_1_loan-tenure-mortgage-income
The Tribune 2007. “Why widows go to Vrindavan” 9th September http://www.tribuneindia.com/2007/
20070909/spectrum/main1.htm

PAGE
101
Details of ContributorsMoneer Alam: Professor of Economics and Head, Population Research Centre, Institute of Economic Growth,
University of Delhi, Delhi – 110 007
Sumit Mazumdar: Fellow, Institute for Human Development, IIPA Campus, New Delhi –110002
Indrani Chakravarty: Director, Calcutta Metropolitan Institute of Gerontology, Dr. S.C. Banerjee Road,
Kolkata – 700 010
Pratima Yadav: Consultant, Population Research Centre, Institute of Economic Growth, University of Delhi,
Delhi – 110 007


PAGE
103
BKPAI Project CoordinatorsMoneer Alam: Professor of Economics and Head, Population Research Centre, Institute of Economic Growth,
University of Delhi, Delhi – 110 007
K.S. James: Professor and Head, Population Research Centre, Institute for Social and Economic Change,
Nagarbhavi, Bangalore – 560 072
G. Giridhar: Former Director, Country Support Team, Thailand and Country Representative, Thailand, Bangkok,
L&T South City, Arakare, Bangalore – 560 076
K.M. Sathyanarayana: Former National Programme Officer (Population and Development), United Nations
Population Fund, Chanakyapuri, New Delhi – 110 021
Sanjay Kumar: National Programme Officer (Monitoring and Evaluation), United Nations Population Fund,
Chanakyapuri, New Delhi – 110 021
S. Siva Raju: Professor and Dean, School of Development Studies, Tata Institute of Social Sciences, Deonar,
Mumbai – 400 088


The Status of Elderlyin West Bengal, 2011
The Status of Elderly in West Bengal, 2011