The State of Women in Academic Medicine: The Pipeline and Pathways to Leadership National results...
19
The State of Women in Academic Medicine: The Pipeline and Pathways to Leadership National results and benchmarking presentation
-
Upload
clarissa-sherman -
Category
Documents
-
view
218 -
download
3
Transcript of The State of Women in Academic Medicine: The Pipeline and Pathways to Leadership National results...

The State of Women in Academic Medicine: The Pipeline and Pathways to Leadership
National results and benchmarking presentation

How to Use This Presentation• This presentation contains editable charts you can use to compare and benchmark your
school with the average of all U.S. medical schools fully accredited by the LCME.• Currently all charts show national data. To edit the charts:
1. Click on the link at the bottom of the slide you want to edit to take you to the appropriate benchmarking table.
2. Find the data you’d like to display for your school.3. Right click on the chart for “My Institution” and select “Edit Data”4. Add the data for your school into the spreadsheet that pops up.5. Click on the title “My institution” to add the name of your medical school
• Error with older PowerPoint Versions: If your charts do not show the correct percentages, and instead show [value], follow these steps to fix:
1. Right click on the data labels “[value]”2. Select “Format data labels”3. Check “Value” and click the “Reset Label Text” button. This should show the values for the
national data.• This presentation is fully editable. Choose the data aspects that are most important for your
school or program.• We suggest you craft your presentation to include an introduction, overview of the data, and
end with action steps. We have included suggested slides in this presentation for your use. More information can be found in the full report at www.aamc.org/members/gwims/statistics
If you would like to reproduce any figures from the report for your presentation, please use the Permission to Reproduce AAMC Material request form.
• (Remove this slide before presenting)

About This Presentation
• This editable presentation template was created to assist schools in understanding “The State of Women in Academic Medicine: Understanding the Pipeline and Pathways to Leadership” report data and compare their progress in advancing women faculty with the national data.
• The presentation template was created by Claudia Raezer, Program Specialist, Women in Medicine and Science and Diana Lautenberger, M.A.T., Director, Women in Medicine and Science, Association of American Medical Colleges.
• Please send any feedback or suggestions about this presentation template to [email protected]
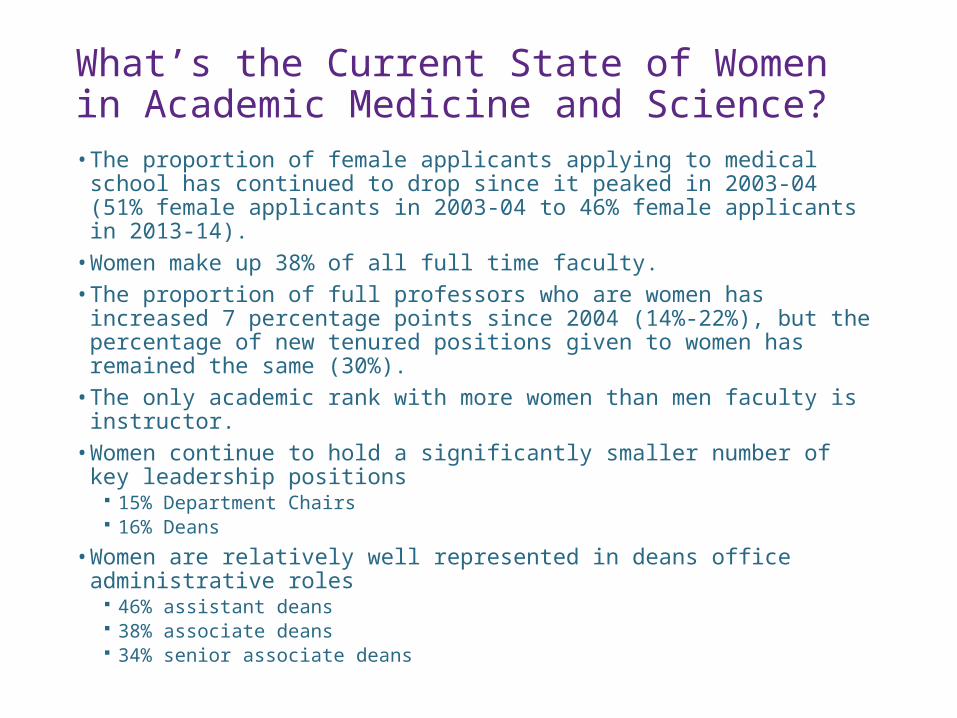
What’s the Current State of Women in Academic Medicine and Science?• The proportion of female applicants applying to medical school has
continued to drop since it peaked in 2003-04 (51% female applicants in 2003-04 to 46% female applicants in 2013-14).
• Women make up 38% of all full time faculty.• The proportion of full professors who are women has increased 7
percentage points since 2004 (14%-22%), but the percentage of new tenured positions given to women has remained the same (30%).
• The only academic rank with more women than men faculty is instructor.• Women continue to hold a significantly smaller number of key
leadership positions 15% Department Chairs 16% Deans
• Women are relatively well represented in deans office administrative roles
46% assistant deans 38% associate deans 34% senior associate deans

Where does the data come from?
• Data from this presentation is from the 2013-2014 Report “The State of Women in Academic Medicine: The Pipeline and Pathways to Leadership” and benchmarking tables published by the Association of American Medical Colleges.
• The report collects data from the biennial Women in medicine and Science (WIMS) Benchmarking Survey distributed to the Group on Women in Medicine (GWIMS) and Science and Faculty Roster Representative at all LCME fully accredited medical schools in the U.S.
• 117 out of 129 fully accredited U.S. medical schools completed this survey for a 91% response rate
• Data from non-respondent schools was pulled from the Faculty Roster.

How are we doing?

Definitions
•Full Time: Remunerated work greater than 0.75 FTE (12 month contract)
• National: Refers to the aggregate cohort of all LCME-accredited who completed the survey

Total Full Time Faculty
38%
62%
National
Women Men
Source: Women in Medicine and Science Benchmarking Tables, Table 7
38%
62%
My Institution
Women Men

Full-Time Full Professors and Tenured Faculty
Source: Women in Medicine and Science Benchmarking Tables, Table 7
22%
78%
My Institution – Full Professor Rank
Women Men
22%
78%
National – Full Professor Rank
Women Men
22%
78%
My Institution – Tenured
Women Men
22%
78%
National – Tenured
Women Men

Full-Time Full Professors by Gender
Source: Women in Medicine and Science Benchmarking Tables, Table 7
13%
87%
My Institution – % of Women who are Full Professors
Women Full Professors Women Other Ranks
29%
71%
National – % of Men who are Full Professors
Men Full Professors Men Other Ranks
13%
87%
National % of Women who are Full Pro-fessors
Women Full Professors Women Other Ranks
29%
71%
National – % of Men who are Tenured
Men Full Professors Men Other Ranks
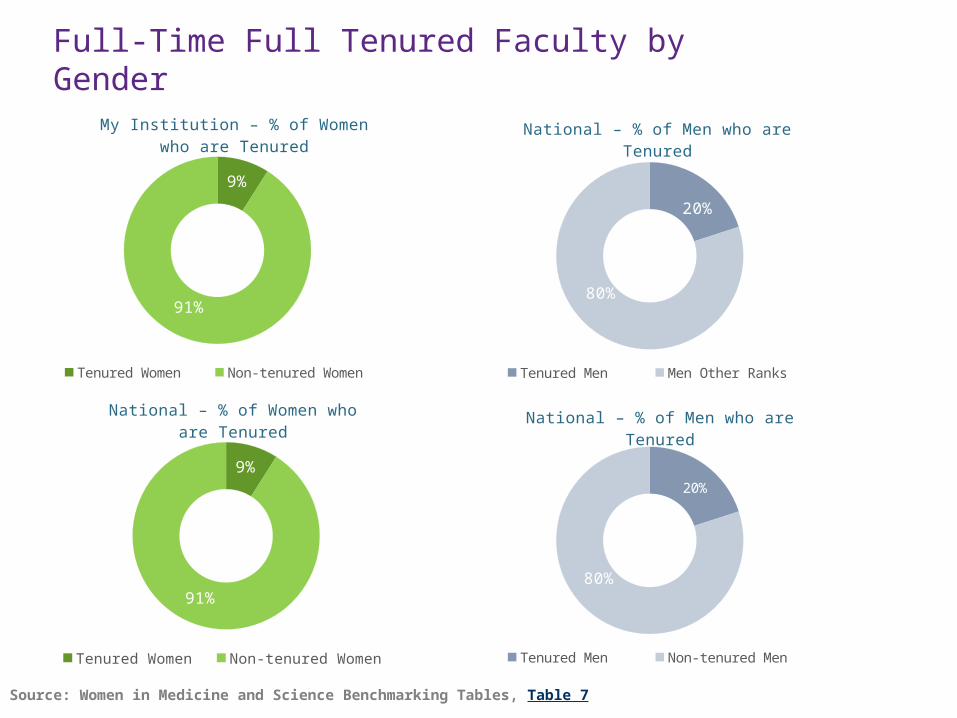
Full-Time Full Tenured Faculty by Gender
Source: Women in Medicine and Science Benchmarking Tables, Table 7
9%
91%
My Institution – % of Women who are Tenured
Tenured Women Non-tenured Women
20%
80%
National – % of Men who are Tenured
Tenured Men Men Other Ranks
9%
91%
National – % of Women who are Tenured
Tenured Women Non-tenured Women
20%
80%
National – % of Men who are Tenured
Tenured Men Non-tenured Men

Promotions and Tenure for Full-Time Faculty
New Tenured Positions
Promotions to Full Professor
Promotions to Associate Professor
0% 10% 20% 30% 40% 50% 60% 70% 80% 90% 100%
30%
31%
40%
70%
69%
60%
My Institution
Women Men
Source: Women in Medicine and Science Benchmarking Tables, Table 8
New Tenured Positions
Promotions to Full Professor
Promotions to Associate Professor
0% 10% 20% 30% 40% 50% 60% 70% 80% 90% 100%
30%
31%
40%
70%
69%
60%
National
Women Men

New Hires and Departures for Full-Time Faculty
Depar-tures
New Hires
0% 10% 20% 30% 40% 50% 60% 70% 80% 90% 100%
41%
47%
59%
53%
My Institution
Women Men
Source: Women in Medicine and Science Benchmarking Tables, Table 6a and 6b
Depar-tures
New Hires
0% 10% 20% 30% 40% 50% 60% 70% 80% 90% 100%
40%
47%
59%
53%
National
Women Men

Permanent Administrative Leadership Positions
Division Chief
Associate/Vice Chair
Department Chair
Assistant Dean
Associate Dean
Senior Associate/Vice Dean
0% 10% 20% 30% 40% 50% 60% 70% 80% 90% 100%
24%
24%
15%
46%
39%
33%
76%
76%
85%
54%
61%
67%
My Institution
Women Men
Source: Women in Medicine and Science Benchmarking Tables, Table 9a and 10a
Division Chief
Associate/Vice Chair
Department Chair
Assistant Dean
Associate Dean
Senior Associate/Vice Dean
0% 10% 20% 30% 40% 50% 60% 70% 80% 90% 100%
24%
24%
15%
46%
39%
33%
76%
76%
85%
54%
61%
67%
National
Women Men

Major findings for (Your School Name)
1. (use this space to pull out 3-4 findings unique to your school based on the data provided above. Are you above or below national averages? Do you have successes or opportunities in areas different than the national numbers?)
2. (Fill in here)3. (Fill in here)
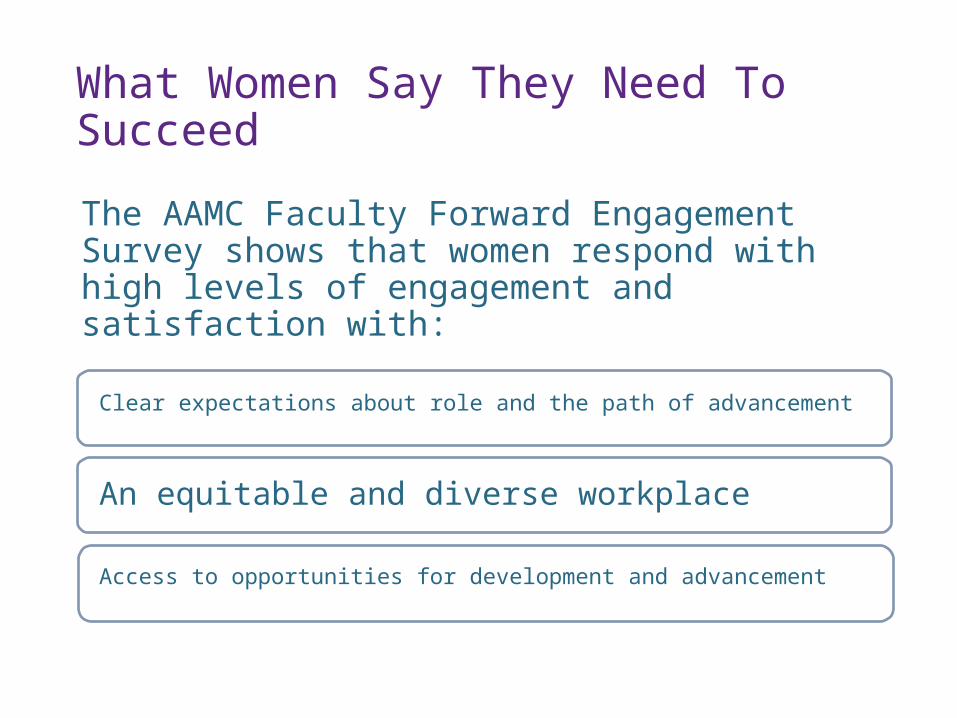
What Women Say They Need To Succeed
The AAMC Faculty Forward Engagement Survey shows that women respond with high levels of engagement and satisfaction with:
Clear expectations about role and the path of advancement
An equitable and diverse workplace
Access to opportunities for development and advancement

How can we take action?• Send aspiring women leaders to the AAMC Early and Mid-Career
Women Faculty Professional Development Seminar. Have alums conduct seminars locally to teach faculty who couldn’t attend.
• Support women faculty in national professional development opportunities throughout the career lifecycle.
• Provide unconscious bias training for search and P&T committees. Use standard processes for all searches to reduce biases.
• Train both male and female students and faculty to effectively mentor across genders.
• Start a sponsorship program for women.• Find out if your school has ever conducted a salary equity study.• Find out how your faculty perceive your institution’s culture and
climate. • Support your local WIMS Groups on campus and empower
women to support, mentor, and sponsor each other.
Our priorities and action steps• (Use this slide to include other action items or targeted next steps
based on your results. Consider linking these action items to your institution’s strategic plan and/or institutional goals)
• (These action steps should relate directly back to the major findings unique to your school in Slide 14)

The AAMC Can Help!
• Read the full report – provides detailed departmental information and longitudinal data over the past 10 and 5 years
• Send aspiring women leaders to the AAMC Early and Mid-Career Women Faculty Professional Development Seminar. Have alumni conduct seminars locally to teach faculty who couldn’t attend.
• Use the Faculty Forward Engagement Survey to learn more about how your faculty feel about the environment at your medical school and where perceived inequities exist.
• Attend an Unconscious Bias training lab for health professions• Don’t know where to start in developing a WIMS program at your
institution? Check out the Group on Women in Medicine and Science (GWIMS) Toolkit chapter on “How to Start and Maintain a WIMS Program.” The Toolkit also has a variety of resources for women faculty to develop skills needed to advance their career.
• Get involved in GWIMS! Visit our website at www.aamc.org/members/gwims or email [email protected] to join.