The State of Wildlife Trade in Japan (PDF, 2.25 MB) - Traffic
58
The State of Wildlife Trade in Japan Akiko Ishihara, Kahoru Kanari Tsugumi Saito, Soyo Takahashi A TRAFFIC EAST ASIA REPORT
Transcript of The State of Wildlife Trade in Japan (PDF, 2.25 MB) - Traffic
The State ofWildlife Trade in Japan
Akiko Ishihara, Kahoru KanariTsugumi Saito, Soyo Takahashi
A TRAFFIC EAST ASIA REPORT

Published by TRAFFIC East Asia-Japan,Tokyo, Japan
© 2010 TRAFFIC East Asia-JapanAll rights reserved.
All material appearing in this publication is copyrightedand may be reproduced with permission. Any reproduction in full or in part of this publication must credit TRAFFIC East Asia-Japan as the copyright owner.
The views of the authors expressed in this publication do not necessar-ily reflect those of the TRAFFIC network, WWF or IUCN.
The designations of geographical entities in this publication, and the presentation of the material, do not imply the expression of any opinion whatsoever on the part of TRAFFIC or its supporting organizations concerning the legal status of any country, territory, or area, or of its authorities, or concerning the delimitation of its frontiers or boundaries.
The TRAFFIC symbol copyright and RegisteredTrademark ownership is held by WWF. TRAFFIC is a joint programme of WWF and IUCN.
Suggested citation: Ishihara, A.; Kanari, K.; Saito, T.; Takahashi, S. (2010). The State of Wildlife Trade in Japan. TRAFFIC East Asia-Japan, Tokyo, Japan
ISBN: 978-4-915613-22-7
Front cover: from top to bottom, left to right©Martin Harvey / WWF-Canon©TRAFFIC©Nozomu Iwasaki©Shinichiro Ogi. This illustration is owned by Ehime Prefectural Library.©Hartmut Jungius / WWF-Canon©T. Saito / TRAFFIC©J. Compton / TRAFFIC©TRAFFIC©Martin Harvey / WWF-Canon©Frédéric BASSEMAYOUSSE / WWF Mediterranean
editor and compiler: Tsugumi Saitoart direction and design: Kenichi Yasuda
Takeshi FujimakiToshiki OsadaKohsuke Kobayashi
Printed on FSC certified paper.

The State of Wildlife Trade in Japan
Akiko Ishihara, Kahoru Kanari, Tsugumi Saito, Soyo Takahashi
TRAFFIC East Asia-Japan
October 2010

02
This report was made possible with financial
support from WWF Japan.
Many people provided support to this project. The
authors would like to express thanks to all those who
helped to make this series of articles possible by
providing advice as well as sharing their knowledge
on the subject.
The authors gratefully acknowledge Yasuo Shimada
(Mitsuboshi Pharmceutical Co. Ltd), Hiroshi Asama
(Japan Kampo Medicines Manufacturers Association),
Professor Hidetoshi Ota (University of Hyogo),
Hisako Kiyono (WWF Japan), Professor Nobuo Ishii
(Tokyo Woman’s Christian University) and Dr Mark
Auliya (herpetologist), for their review and advice on
the report draft, and Elizabeth White (UNEP World
Conservation Monitoring Centre) for providing infor-
mation and advice. Ai Suzuki and Miki Nakamura are
thanked for their ivory trade research, and Ryoko
Nishino for her organizational support.
The authors especially thank the reviewers from
TRAFFIC: Chris Shepherd, Joyce Wu, Stephanie von
Meibom, Tom Milliken, Xueyan Liu, Anastasiya
Timoshyna, Chen Hin Keong, Glenn Sant, James
Compton, Julie Gray, Sabri Zain, Richard Thomas and
Roland Melisch for their comments and advice on
improving draft versions of the articles contained
within The State of Wildlife Trade in Japan.
ACKNOWLEDGEMENTS
03
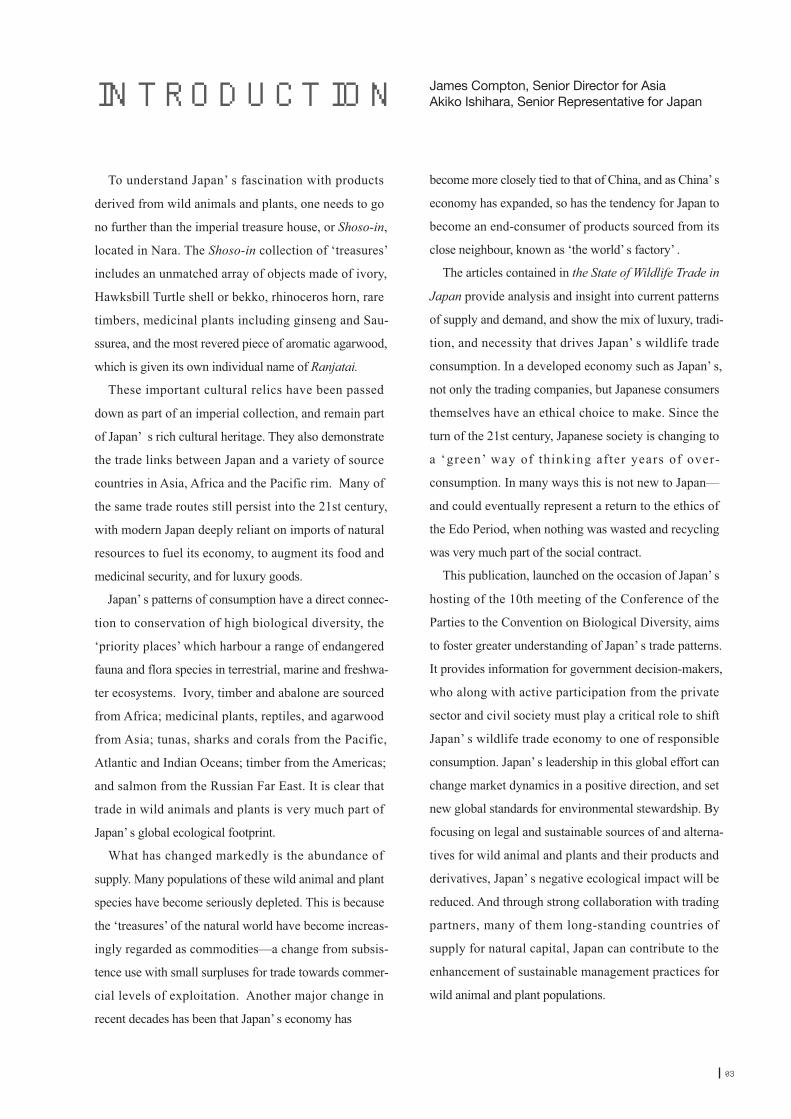
To understand Japan’ s fascination with products
derived from wild animals and plants, one needs to go
no further than the imperial treasure house, or Shoso-in,
located in Nara. The Shoso-in collection of ‘treasures’
includes an unmatched array of objects made of ivory,
Hawksbill Turtle shell or bekko, rhinoceros horn, rare
timbers, medicinal plants including ginseng and Sau-
ssurea, and the most revered piece of aromatic agarwood,
which is given its own individual name of Ranjatai.
These important cultural relics have been passed
down as part of an imperial collection, and remain part
of Japan’ s rich cultural heritage. They also demonstrate
the trade links between Japan and a variety of source
countries in Asia, Africa and the Pacific rim. Many of
the same trade routes still persist into the 21st century,
with modern Japan deeply reliant on imports of natural
resources to fuel its economy, to augment its food and
medicinal security, and for luxury goods.
Japan’ s patterns of consumption have a direct connec-
tion to conservation of high biological diversity, the
‘priority places’ which harbour a range of endangered
fauna and flora species in terrestrial, marine and freshwa-
ter ecosystems. Ivory, timber and abalone are sourced
from Africa; medicinal plants, reptiles, and agarwood
from Asia; tunas, sharks and corals from the Pacific,
Atlantic and Indian Oceans; timber from the Americas;
and salmon from the Russian Far East. It is clear that
trade in wild animals and plants is very much part of
Japan’ s global ecological footprint.
What has changed markedly is the abundance of
supply. Many populations of these wild animal and plant
species have become seriously depleted. This is because
the ‘treasures’ of the natural world have become increas-
ingly regarded as commodities—a change from subsis-
tence use with small surpluses for trade towards commer-
cial levels of exploitation. Another major change in
recent decades has been that Japan’ s economy has
INTRODUCTION James Compton, Senior Director for AsiaAkiko Ishihara, Senior Representative for Japan
become more closely tied to that of China, and as China’ s
economy has expanded, so has the tendency for Japan to
become an end-consumer of products sourced from its
close neighbour, known as ‘the world’ s factory’ .
The articles contained in the State of Wildlife Trade in
Japan provide analysis and insight into current patterns
of supply and demand, and show the mix of luxury, tradi-
tion, and necessity that drives Japan’ s wildlife trade
consumption. In a developed economy such as Japan’ s,
not only the trading companies, but Japanese consumers
themselves have an ethical choice to make. Since the
turn of the 21st century, Japanese society is changing to
a ‘green’ way of thinking after years of over-
consumption. In many ways this is not new to Japan—
and could eventually represent a return to the ethics of
the Edo Period, when nothing was wasted and recycling
was very much part of the social contract.
This publication, launched on the occasion of Japan’ s
hosting of the 10th meeting of the Conference of the
Parties to the Convention on Biological Diversity, aims
to foster greater understanding of Japan’ s trade patterns.
It provides information for government decision-makers,
who along with active participation from the private
sector and civil society must play a critical role to shift
Japan’ s wildlife trade economy to one of responsible
consumption. Japan’ s leadership in this global effort can
change market dynamics in a positive direction, and set
new global standards for environmental stewardship. By
focusing on legal and sustainable sources of and alterna-
tives for wild animal and plants and their products and
derivatives, Japan’ s negative ecological impact will be
reduced. And through strong collaboration with trading
partners, many of them long-standing countries of
supply for natural capital, Japan can contribute to the
enhancement of sustainable management practices for
wild animal and plant populations.

04
1999 USD1 = JPY 119.672005 USD1 = JPY 100.002007 USD1 = JPY 82.84
The following Japanese yen / US exchange rates sourced from the Bank of Japan were used in the report.2008 USD1 = JPY 89.202009 USD1 = JPY 100.32

05
輸
爬
林
薬
宝
鮪
卵
牙
取
061418
363024
4842
52
Japan’s Imports of CITES-listed Species Column : World imports of CITES-listed species and Japan
Column : Statistics and the role of Customs
Column : Sharks Conservation and Japan’s international role
Timber Trade of Japan
Column : FairWild Standard and global plant conservation measares Column : Field report: people and medicinal species in the Upper Yangtze River eco-region
Japan’s Trade in Medicinal Plants
International Trade and Resource Management ofPrecious Corals (Coralliidae) in Japan
Atlantic Bluefin Tuna and CITES
Sturgeon Conservation and the Role of Japan
East Asia as a Key Determinant in the African Elephant’s Future
Trade in Live Reptiles as Pets
Virtual Trade in Real Wildlife
TABLE OF CONTENTS

06 Japan’s imports of CITES-listed species
©TRAFFIC ©Martin Harvey / WWF-Canon ©Roger Leguen / WWF-Canon
Records of exports and
imports in species listed
in the Appendices of
CITES (the Convention
on International Trade in
Endangered Species of
Wild Fauna and Flora)
provide useful reference
information concerning the scale and characteristics of
Japan’ s international trade in wildlife. This report
analyses the status of such trade, using the most recent
data on import/export volumes of CITES-listed
species compiled by Japan’ s Ministry of Economy,
Trade and Industry, in 2007.
There is a great variety of wild plant and animal
species and it is impossible to envisage the entire
picture of international trade in these. Although Japan’
s Ministry of Finance compiles trade data by commod-
ity, it is often difficult to get a picture of the volumes
of trade by species. There are roughly 5000 CITES-
listed animal species and 28 000 plant species, and
each CITES Party compiles records of imports/exports
(including re-exports) of these species.
CITES regulations on species are based on the
degree of protection needed by the given flora or
fauna in trade, and species protected by CITES are
listed in one of three Appendices (Appendix I, Appen-
dix II, Appendix III). As a rule, all international trade
for primarily commercial purposes of species listed in
Appendix I is prohibited, and in the case of exceptions,
trading requires an export permit issued by the govern-
ment of the exporting country and an import permit
issued by the government of the importing country.
Commercial trade of species listed in Appendix II is
regulated by a permitting system and requires an
export permit issued by the government of the export-
ing country. In the case of Appendix III-species, listed
at the discretion of individual range Parties, an export
permit issued by the government of the exporting coun-
try, or a certificate of origin, is required.
The 2007 data on trade in CITES-listed species anal-
ysed in this report were the latest data available at the
time research was conducted, and are based on the
permits and certificates submitted to Customs on
import to Japan, or (re-)export from Japan, of CITES-
listed species. The units used to measure trade vary
and it is very difficult to make a consistent and inte-
grated analysis. For this reason, an individual incident
of trade activity is termed a ‘transaction’ for the
purposes of this analysis. Although this will not give a
measure of total import volume, it gives an indication
of frequency of transactions in different species of
animals and plants.
As is clear from Figure 1, import transactions to
Japan are far more numerous than (re-)exports from
Japan. There are some fluctuations, but the number of
import transactions peaked in 2005 and increased over-
all. Although the number of export transactions is
Japan’s imports of CITES-listed species
Tsugumi Saito, Project Staff

輸
07Japan’s imports of CITES-listed species
Trends in export/import transactions in CITES-listed species in Japan1Figure
Import transactions to Japan for 2007, by Appendix and taxon1Ta b l e
Note: Due to a difference in the method of compilation in 1998 and 1999, these two years cannot be compared to the others. Source: Ministry of Economy, Trade and Industry. CITES annual report 1981-2007 (compiled by TRAFFIC East Asia-Japan)
Note: Species figures in ( ) are spp., sp. – i.e. genus or family-level classification only. Figures outside ( ) are the number of different types of species, exclud-ing spp., sp.Source: Ministry of Economy, Trade and Industry. (2009). CITES annual report 2007 (compiled by TRAFFIC East Asia-Japan)
60 000
50 000
40 000
30 000
20 000
10 000
0
year
import
export
transaction number
Appendix I
MAMMALIAAVESREPTILIAAMPHIBIAPESCES
209773490
3370000
9722411213
13(3)11 5(1)0 4 0 0 0 0
33(4)54(2)87(6)
1187246225 587
73225217495
706436 91410 61947 533
43(1)170(1)172(4)25
14(2)3217
130(25)594(33)924(14)1518(47)
149480000
2520
3231
324
4 3
12(1)0 0 0 0 1 0
20(1)0(1)20(2)
CHORDATA
No. of transactions No. of Species No. of transactions No. of Species No. of transactions No. of SpeciesAppendix II Appendix III
ARTHROPODAANNELIDAMOLLUSCACNIDARIA
Animal TotalFlora (Plant) Total
Total
Fauna (Animal)
1981 20071983 1985 1987 1989 1991 1993 1995 1997 1999 2001 2003 2005
imported. (These figures are based on transaction
records at species-specific level.) There are cases of the
same species being classified under different Appendi-
ces owing to such anomalies as “split-listing” , usually
of geographically separate populations. Such data have
deliberately not been double-counted in the totals.
The species accounting for the largest number of
import transactions was the American Alligator
(Mississippi Alligator) Alligator mississippiensis
(8732 transactions, or about 17.8 % of the total). The
next-largest groups are Reticulated Python Python
reticulatus (3747 transactions) and Nile Crocodile Cro-
codylus niloticus (3192 transactions), with the remain-
der of the top 10 species also being reptiles. However,
among transactions in higher taxa without recorded
species names there is also a considerable number of
very small, the number has increased over the past five
years or so, and in the 10-year period from 1997 to
2007 the overall number of exports rose from less than
1500 to 3314. The total number of import transactions
for 2007 was 49 070 and total exports were 3314. Ap-
proximately 80% of the imports and 70% of the
exports were in animal specimens.
Imports
Table 1 shows that approximately 97% (47 533) of
transactions involved species listed in CITES Appendix
II. Of the Appendix II-listed species for both flora and
fauna, reptiles made up the largest group imported,
accounting for approximately 54% of all transactions
involving Appendix II-listed species. There were at
least 640 species of flora and 978 species of fauna

08 Japan’s imports of CITES-listed species
Top five exporters/points of origin for Japan imports2Ta b l e
1 exporters or re-exporters 2 Imports with no entry in the point of origin column are not countedSource: Ministry of Economy, Trade and Industry. (2009). CITES annual report 2007 (compiled by TRAFFIC East Asia-Japan)
exporters1 animals
1658
7570
6805
5639
3384
plants
6254
326
0
8
12
total
7912
7896
6805
5647
3396
%
16.1%
16.1%
13.9%
11.5%
6.9%
point of origin2 animals
9777
9064
1509
2314
2054
plants
383
378
6225
752
6
total
10 160
9442
7734
3066
2060
%
20.7%
19.2%
15.8%
6.2%
4.2%
Indonesia
USA
Taiwan
Malaysia
Colombia
Taiwan
Indonesia
Switzerland
Italy
France
imports of CNIDARIA, including stony corals
(SCLERACTINIA spp.) (440) and Acropora spp.
(400). In contrast to the case with fauna, imports of
flora are seldom recorded by species name. For
example, in 2007 there were 7150 import transactions
for species of the orchid family, which were simply
imported under the family name orchids (Orchidaceae
spp.), with the species name unknown. This makes
orchids the second-largest import group after the
American Alligator. Orchids, including transactions at
family and species level, account for approximately
85% of all flora imports. Of the flora imports for
which the species name is known, the largest number
of transactions involved Phalaenopsis amabilis (108).
Exporters and points of origin
In terms of numbers of exports, the five most signifi-
cant traders to Japan are Taiwan, Indonesia, Switzer-
land, Italy and France (Table 2). For the top exporter,
Taiwan, most of the transactions involve Orchidaceae,
and these account for 57.6% of all imports of CITES-
listed flora by Japan. In contrast, 95.9% of the exports
to Japan by the second-largest exporter, Indonesia,
involve fauna, and most of these are stony corals. The
imports from Switzerland, Italy and France comprise a
large number of transactions involving reptile leather
products.
The top five countries/territories listed as “country
of origin” for imports to Japan are Indonesia, USA,
Taiwan, Malaysia, and Colombia. In imports of flora,
there is a strong association with Taiwan, and it is high
on the list of recorded exporters and on the list of
recorded points of origin.
When the points of origin are viewed in terms of
region, by far the largest numbers of import transac-
tions are with countries/territories in Asia as seen in
Figure 2. The next-largest numbers of transactions
are with North America, followed by Africa. In com-
parison with other regions, Asia is the source of
imports for a far higher percentage of flora. This is
due to the presence of Taiwan, which is the point of
origin for such a large share of flora imports. Europe
and Asia account for the largest numbers of transac-
tions of live animals and corals, respectively, and in
four other regions reptile leather products account for
from 45-90% of regional totals of transactions
exported to Japan.
Wild or farmed? Sources of species imported
into Japan
In CITES annual reports, information is recorded on
whether imported specimens were reported as originat-
ing from the wild or from a captive-bred source
(fauna) or an artificially propagated source (flora). In
the 2007 statistics for Japan, 20 067 transactions
involved fauna imports reported to be sourced from

輸
09Japan’s imports of CITES-listed species
Numbers of import transactions by region of origin, 2007 2Figure
*Zonal classification refers to web page of United Nations. http://unstats.un.org/unsd/methods/m49/m49regin.htm. Viewed 31 August 2010.*Except for 600 cases where point of origin was unknown.*Total number of cases is proportional to area of a circle.Source: Ministry of Economy, Trade and Industry. (2009). CITES annual report 2007 (compiled by TRAFFIC East Asia-Japan)
3Ta b l e
Source: Ministry of Economy, Trade and Industry (2009). CITES annual report 2007 (compiled by TRAFFIC East Asia-Japan)
Imports by source type, 2007
wild
total
20 166
17 182
861
38 209
607
10 200
54
10 861
20 773
27 382
915
49 070
animals plants total
captive bred andranching
others and originunknown
Central and South America& Caribbean4602
Oceania1726
Northen America9538Asia
26 139Europe889
Africa5576 Animal
Animal Plant
Plant
the wild and 17 182 transactions were reported as
being from captive-bred sources (Table 3). In contrast,
very few transactions of flora were reported to be
taken from the wild, while more than 90% were
reported as from artificially propagated sources.
What descriptions are used for imported spe-
cies and their products?
The descriptions under which CITES-listed species
are imported can indicate how the CITES-listed
species are being used in Japan. According to CITES
procedures, the description of a species/product at the
time of transaction may be one of 73 types (as of
2007) for record-keeping (CITES, 2006).
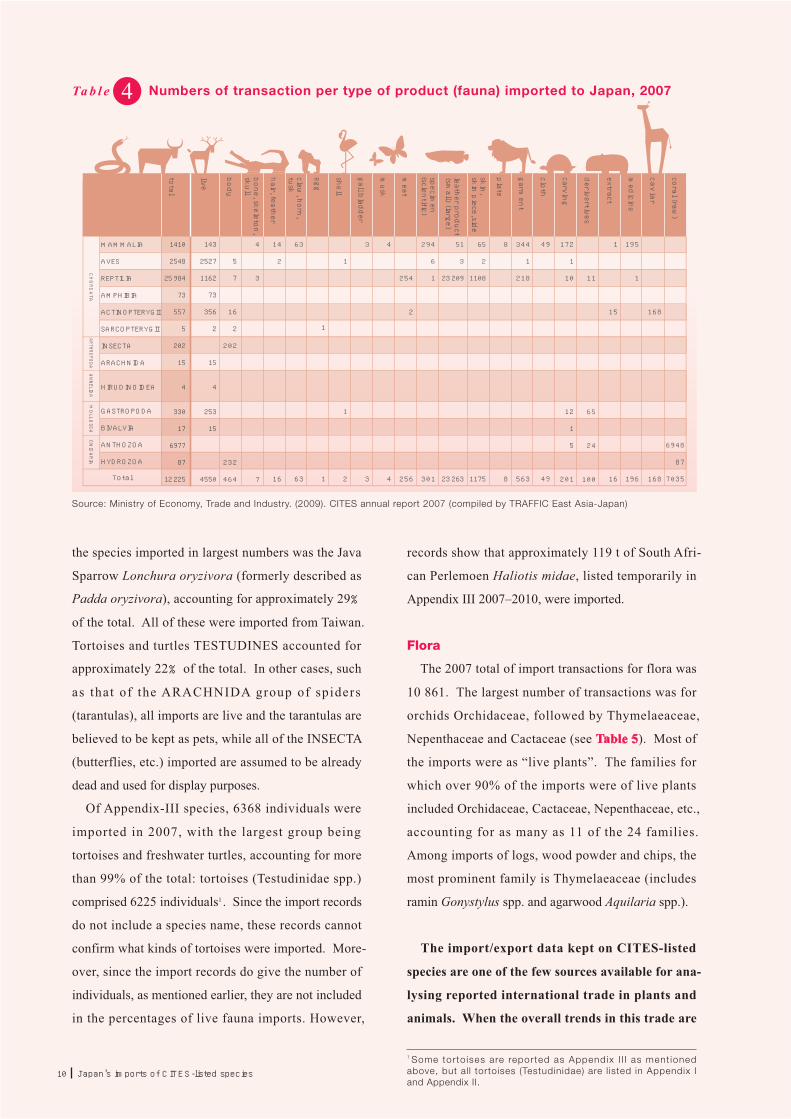
The most common form in which specimens of
fauna species are imported is skin, hide or as other
leather products (Table 4). Most of these products are
from reptiles, which constitute 99.5% of total skin
products. On the other hand, live imports come from a
wide variety of fauna categories. Mammal specimens
are imported in the widest range of forms, including
clothing, scientific specimens and carvings.
Skin/hide/leather products
Most of these products are from reptiles, as noted,
although a small number is from mammals and birds.
Because some of these imports are recorded in terms
of number of products/individuals and others by
weight, it is difficult to make comprehensive compari-
sons. At least 1.12 million reptile skins were recorded
imported in 2007, according to records of imports
noting the number of products/individuals. The
volume of imports was greatest from Hong Kong.
Live fauna
In 2007, live specimens of CITES-listed animals
imported to Japan totalled more than 120 000 individu-
als from over 400 species. Of these, 12 547 individu-
als were Appendix-I species, and Asian Arowana
Scleropages formosus accounted for approximately
97% of the Appendix-I imports.
Most of the live animals imported were Appendix-II
species, amounting to 102 034 individuals. Of these,
10 Japan’s imports of CITES-listed species
Numbers of transaction per type of product (fauna) imported to Japan, 20074Ta b l e
Source: Ministry of Economy, Trade and Industry. (2009). CITES annual report 2007 (compiled by TRAFFIC East Asia-Japan)
MAMMALIA
AVES
REPTILIA
AMPHIBIA
ACTINOPTERYGII
SARCOPTERYGII
INSECTA
ARACHNIDA
HIRUDINOIDEA
GASTROPODA
BIVALVIA
ANTHOZOA
HYDROZOA
1410
2548
25 984
73
557
5
202
15
4
330
17
6977
87
12 225
143
2527
1162
73
356
2
15
4
253
15
4550
5
7
16
2
202
232
464
49
49
CHORDATA
ARTHROPODAANNELIDA
MOLLUSCA
CNIDARIA
Total
4
3
7
14
2
16
63
63
1
1
1
1
2
3
3
4
4
254
2
256
294
6
1
301
51
3
23 209
23 263
65
2
1108
1175
8
8
344
1
218
563
172
1
10
12
1
5
201
11
65
24
100
1
15
16
168
168
195
1
196
6948
87
7035
total
live
body
bone, skeleton, skull
hair, feather
claw, horn,
tusk
egg
shell
gall bladder
musk
meat
specimen
(scientific)
leather product (small) (large)
skin, skin piece, side
plate
garment
cloth
carving
derivertives
extract
medicine
caviar
coral (raw)
the species imported in largest numbers was the Java
Sparrow Lonchura oryzivora (formerly described as
Padda oryzivora), accounting for approximately 29%
of the total. All of these were imported from Taiwan.
Tortoises and turtles TESTUDINES accounted for
approximately 22% of the total. In other cases, such
as that of the ARACHNIDA group of spiders
(tarantulas), all imports are live and the tarantulas are
believed to be kept as pets, while all of the INSECTA
(butterflies, etc.) imported are assumed to be already
dead and used for display purposes.
Of Appendix-III species, 6368 individuals were
imported in 2007, with the largest group being
tortoises and freshwater turtles, accounting for more
than 99% of the total: tortoises (Testudinidae spp.)
comprised 6225 individuals1 . Since the import records
do not include a species name, these records cannot
confirm what kinds of tortoises were imported. More-
over, since the import records do give the number of
individuals, as mentioned earlier, they are not included
in the percentages of live fauna imports. However,
records show that approximately 119 t of South Afri-
can Perlemoen Haliotis midae, listed temporarily in
Appendix III 2007–2010, were imported.
Flora
The 2007 total of import transactions for flora was
10 861. The largest number of transactions was for
orchids Orchidaceae, followed by Thymelaeaceae,
Nepenthaceae and Cactaceae (see Table 5). Most of
the imports were as “live plants”. The families for
which over 90% of the imports were of live plants
included Orchidaceae, Cactaceae, Nepenthaceae, etc.,
accounting for as many as 11 of the 24 families.
Among imports of logs, wood powder and chips, the
most prominent family is Thymelaeaceae (includes
ramin Gonystylus spp. and agarwood Aquilaria spp.).
The import/export data kept on CITES-listed
species are one of the few sources available for ana-
lysing reported international trade in plants and
animals. When the overall trends in this trade are
1 Some torto ises are reported as Appendix I I I as ment ioned above, but al l tortoises (Testudinidae) are l isted in Appendix I and Appendix II.

輸
11Japan’s imports of CITES-listed species
Types of products imported in 2007 (descriptions used for plant imports)viewed by flora family (number of transactions) 5Ta b l e
Source: Ministry of Economy, Trade and Industry. (2009) CITES annual report 2007 (compiled by TRAFFIC East Asia-Japan)
©Martin Harvey / WWF-Canon
©Wolfgang Von Schmieder / WWF-Canon
OrchidaceaeThymelaeaceaeNepenthaceaeCactaceaeSarraceniaceaeLeguminosaeCyatheaceaeLiliaceaeCompositaeBromeliaceaeApocynaceaeCycadaceaePrimulaceaeEuphorbiaceaeZamiaceaeDroseraceaeAmaryllidaceaeMeliaceaeAraliaceaePalmaeRosaceaeDicksoniaceaeAgavaceaeZygophyllaceaeTaxaceaeTotal
9237427359244100966558433128262626242219165321111
10861
9162
359237100
2840
3118265262420
3
1
10080
68
25
21
19
4
137
2
2
23
3
10
7
43
15
2
4
1
13
1
18
1
2
2
24
5
7
1
114
12
1
2
4
19
85
15
100
1
1
276
137
3
299
4
1
6
1
12
21
80
7
108
1
1
1
4
7
1
1
1
1
leather product(sm
all)
coral
derivertives
carving
sawn wood
timber
log
chips
powder
medicine
extract
dried plant
seed
stem
root
live
total
REFERENCESCITES. (2006). Guidelines for the preparation and submission of CITES annual report, annex of CITES Notification No.2006/030. Available at: http://www.cites.org/eng/notif/2006/E-ARguide.pdf. Viewed on 17 May 2010.
Ministry of Economy, Trade and Industry Japan. 1981-2007 CITES Annual Report of Japan.
analysed on the basis of these data, a picture is gen-
erated regarding the variety of wild flora and
fauna species Japan imports, from where they are
imported, and in what form. Furthermore, these
data are a starting point in getting a more detailed
picture of the volumes of this trade and points of
origin, which in turn can show to what degree
Japan’ s consumption may actually be impacting
flora and fauna in foreign habitats. This depiction
of the connections between Japan and the rest of
the world can enable Japanese citizens to become
more aware of the degree of responsibility each
person has for the conservation of wild animals and
plants in foreign countries and territories.

C O L U M N
12 Column:World imports of CITES-listed species and Japan
51%USA
13%UK
7%Netherland
3%France
20%Others
6%Japan
Singapore
38%Others
7%
United Arab Emirates
13%Japan
8%Bahrain
27%Mexico
7%
7%Netherland
3%Germany
21%USA
9%Others
12%Japan
48%
Republic of Korea
World imports of stony corals SCLERACTINIAby major importers (2007)
World imports of CITES listed live birdsby major importers (2007)
World imports of live orchid Orchidaceaeby major importers (2007)
World imports of stony corals SCLERACTINIA
All species of stony coral SCLERACTINIA spp. are listed in
CITES Appendix II. Due to the fact that a considerable amount
of reported coral trade was recorded in weight units such as
kilogrammes (not included in these statistics), it is difficult to
grasp the actual trade volumes from these numbers of pieces
alone. However, in 2007, the global trade in stony coral was 3.98
million pieces; of these, more than 2.51 million were traded live.
Source: CITES trade statistics derived from the CITES Trade Database, managed by UNEP-WCMC, received from E. White, UNEP-WCMC, in litt., 24 June 2010.
World imports of live orchids (Orchidaceae)
Over 119 million orchid plants were recorded in international
trade worldwide in 2007.
*There are statistics recorded by weight: China: 2650 t; Hong Kong: 1446 kg; Singapore: 300 kg, Brazil: 50 kg, USA: 12.702 kg and some in small weight units that are not counted.Source: CITES trade statistics derived from the CITES Trade Database, managed by UNEP-WCMC, received from E. White, UNEP-WCMC, in litt., 24 June 2010.
World imports of live CITES-listed birds
In 2007, some 320 000 live birds of about 460 CITES-listed
species were traded internationally worldwide. The three spe-
cies with the largest trade volumes were Java Sparrow Lon-
chura oryzivora, Black-masked Lovebird Agapornis personatus
and Grey-breasted Parakeet Myiopsitta monachus, accounting
for about 40% of all live CITES-listed bird in 2007.
*Compiled from all forms reported (body, carving, coral (raw), derivatives, live, specimens (scientific)) for which the unit is piece or number. *Other units such as weight (approximately 2696 t) exist, but have been excluded here because they are not comparable.Source: CITES trade statistics derived from the CITES Trade Database, managed by UNEP-WCMC, received from E. White, UNEP-WCMC, in litt., 24 June 2010.
輸
13Column:World imports of CITES-listed species and Japan
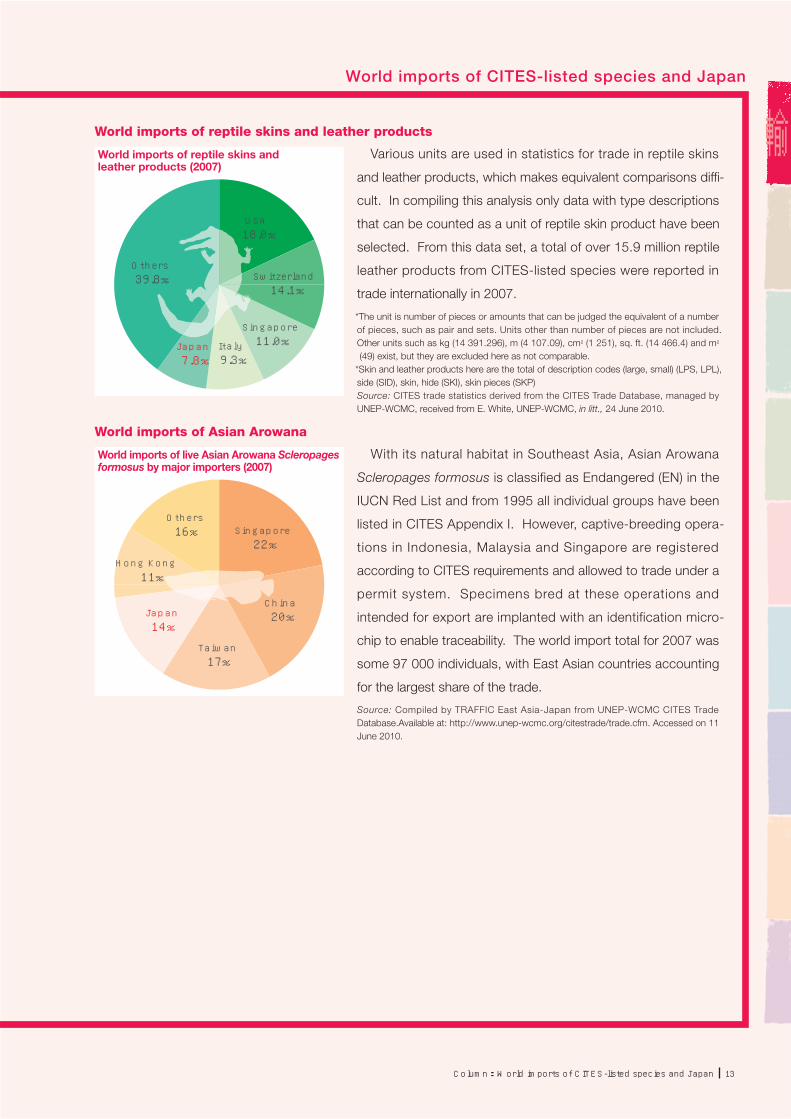
18.0%USA
39.8%Others
11.0%Singapore
14.1%Switzerland
7.8%Japan
9.3%Italy
22%Singapore
20%China
17%Taiwan
11%Hong Kong
16%Others
14%Japan
World imports of reptile skins andleather products (2007)
World imports of live Asian Arowana Scleropagesformosus by major importers (2007)
World imports of reptile skins and leather products
Various units are used in statistics for trade in reptile skins
and leather products, which makes equivalent comparisons diffi-
cult. In compiling this analysis only data with type descriptions
that can be counted as a unit of reptile skin product have been
selected. From this data set, a total of over 15.9 million reptile
leather products from CITES-listed species were reported in
trade internationally in 2007.
*The unit is number of pieces or amounts that can be judged the equivalent of a number of pieces, such as pair and sets. Units other than number of pieces are not included. Other units such as kg (14 391.296), m (4 107.09), cm2 (1 251), sq. ft. (14 466.4) and m2
(49) exist, but they are excluded here as not comparable. *Skin and leather products here are the total of description codes (large, small) (LPS, LPL), side (SID), skin, hide (SKI), skin pieces (SKP)Source: CITES trade statistics derived from the CITES Trade Database, managed by UNEP-WCMC, received from E. White, UNEP-WCMC, in litt., 24 June 2010.
World imports of Asian Arowana
With its natural habitat in Southeast Asia, Asian Arowana
Scleropages formosus is classified as Endangered (EN) in the
IUCN Red List and from 1995 all individual groups have been
listed in CITES Appendix I. However, captive-breeding opera-
tions in Indonesia, Malaysia and Singapore are registered
according to CITES requirements and allowed to trade under a
permit system. Specimens bred at these operations and
intended for export are implanted with an identification micro-
chip to enable traceability. The world import total for 2007 was
some 97 000 individuals, with East Asian countries accounting
for the largest share of the trade.
Source: Compiled by TRAFFIC East Asia-Japan from UNEP-WCMC CITES Trade Database.Available at: http://www.unep-wcmc.org/citestrade/trade.cfm. Accessed on 11 June 2010.
World imports of CITES-listed species and Japan

14 Trade in Live Reptiles as Pets
©TRAFFIC
©TRAFFIC
©Martin Harvey / WWF-Canon
Japan – a major
importer of live reptiles
Japan’s imports of live
repti les in 2007 were
valued at JPY470 million,
approximately USD 5.67
million, making it the
third-largest importer of
reptiles in the world (Ministry of Finance, 2010;
UNSD Comtrade, 2009). According to the Trade
Statistics of Japan, the number of reptiles imported has
been decreasing gradually since 2005, with annual
imports in the range of 300 000 individuals by 2008
(see Figure 1). For CITES-listed live reptile imports,
Japan has continued to be among the top 10 countries
since becoming a CITES Party in 1980 (CITES, 2010).
Of the 2007 world import total of two million indi-
vidual CITES-listed reptiles, Japan accounted for 64
000 (E. White, UNEP-WCMC, in litt., 24 June 2010).
In contrast, according to trade statistics, Japan’s
exports (including re-exports) of reptiles for 2007
were valued at two million Japanese yen (USD 24
143) (Ministry of Finance, 2010), a small value in com-
parison with that of its reptile imports, clearly position-
ing Japan as a significant consumer market with
regard to the reptile trade.
According to the CITES Trade Database compiled
by UNEP-WCMC, there were 323 species of CITES-
listed reptiles involved in international trade in 2007
and Japan imported 188 of these species, equivalent to
approximately 58% of the total number of species in
trade. Japan was the top importer in the world for the
Indian Star Tortoise Geochelone elegans and the Spur-
thighed Tortoise Testudo graeca in 2007. For Testudini-
dae spp. as a whole (i.e. all species of tortoises), Japan
was second only to the USA in terms of import
volumes in 2007 (see Figure 2). Prior to 2007, first
and second places were occupied by Japan and the
USA most years, making Japan one of the top global
importers for Testudinidae spp.
From 1981 to the late 1990s, Japan’s imports of
CITES-listed reptiles increased (see Figure 3). Ac-
cording to specialist magazines and books on reptiles,
a concurrent upsurge in exotic animals began during
Japan’s “economic boom” from the late 1980s into the
early 1990s. In the early stages of the boom, lizards
such as iguanas and chameleons were popular (Sugano,
2008), and later, from the latter half of the 1990s, the
ratio of tortoises and freshwater turtles grew. From
CITES Trade Database information for 2007, the
species with the largest number of live imports was
Spur-thighed Tortoise, (11 147 individuals), followed
by Central Asian Tortoise Testudo horsfieldii (6704
individuals). Among snakes, Ball Python Python
regius was the most-imported species (5113 individu-
als), while among lizards the largest number of
imports was of the Green Iguana Iguana iguana (2811
Trade in Live Reptiles as Pets
Kahoru Kanari, Programme Officer

爬
15Trade in Live Reptiles as Pets
Number of live reptiles imported by Japan, according to trade statistics, 2002-20081Figure
Source: Trade Statistics of Japan, Ministry of Finance, 2009Notes: Description of classifications follows Japanese HS classification.Since Japan established the import/export classification codes for collecting Customs trade statistics for live reptiles in 2002, ‘turtles and tortoises’ have accounted for a significant proportion of total Japanese live reptile imports, far exceeding those for snakes, lizards and crocodilians.
Source: CITES trade statistics derived from the CITES Trade Database, managed by UNEP-WCMC, received from E. White, UNEP-WCMC, in litt., 24 June 2010.
Numbers of CITES-listed live reptiles reported as imported intoJapan during the period from 1981 to 20053Figure
Source: UNEP-WCMC CITES Trade Database: data by request.*Data exclude records in kilogrammes. (TESTUDINE spp. 1454kg in 1981, Naja naja 350kg in 1990 and Pelodiscus sinensis 17056.75kg in 2005)*The Chinese Softshell Turtle Pelodiscus sinensis was listed in CITES Appendix III (CITES) by China between 17 February and 23 June 2005. A total of 27 100 individuals of this species were reported as imports to Japan during this period. This can be considered as one reason for the sudden increase in import numbers for TESTUDINES in 2005.
World imports of live tortoises(family Testudinidae), 20072Figure
©Anthony B. Rath / WWF-Canon
1 000 000
900 000
800 000
700 000
600 000
500 000
400 000
300 000
200 000
100 000
02002 2003 2004 2005 2006 2007 2008
classification was changed
USA20%
Japan16%
Spain8%UK
7%
Hong Kong
6%
Other43%
100 000
80 000
60 000
40 000
20 000
1981 1982 1983 1984 1985 1986 1987 1988 1989 1990 1991 1992 1993 1994 1995 1996 1997 1998 1999 2000 2001 2002 2003 2004 2005
SERPENTES CROCODYLIASAURIATESTUDINES
Turtles and tortoisesReptiles other then Turtles and tortoises
Turtles and tortoises Crocodile and alligatorsLizards Squamata, other then Lizards others

16 Trade in Live Reptiles as Pets
Distribution of wild populations per continent/region corresponding tospecies observed in Japanese pet shops, 2007.4Figure
Note: Species with habitats in multiple regions are counted in duplicate to include each region
75
3322
44
27
25
20
105
72
79
Europe
Africa
South AsiaSoutheast Asia
Oceania
North America
Central America
South America
East Asia
(unit: no. of species)
individuals) (CITES trade statistics derived from the
CITES Trade Database, managed by UNEP-WCMC,
received from E. White, UNEP WCMC, in litt., 24
June 2010).
Pet shop survey results
In 2007, TRAFFIC conducted a survey of 40 pet
shops that deal in reptiles in the east, west and centre
of Honshu, the main island of Japan. The survey
revealed 410 species of reptile on sale. In terms of
numbers of species, lizards SAURIA spp. were the
most numerous, accounting for 40% of the total
number of species. As for tortoises and freshwater
turtles, TESTUDINES spp., the survey found that
more than half of all known species of were being sold.
In this market survey, the most frequently sold reptile
was found to be the Ball Python (CITES App. II).
Among the tortoises and freshwater turtles, the species
most often sold was the Spur-thighed Tortoise (CITES
App. II). The survey revealed that the species in trade
were most often those native to Southeast Asia,
followed in regularity of occurrence by those native to
Africa and Oceania (see Figure 4).
Among the species found in the pet shop survey
were 15 species listed in the IUCN Red List (2007) as
Critically Endangered (CR). Regardless of whether or
not these Critically Endangered species are being
traded legally, there remains a concern about the nega-
tive impact of this trade on the preservation of these
species in their countries of origin.
Furthermore, the survey revealed that species
protected under Japan’ s Cultural Properties Protec-
tion Law, including the Japanese Yellow-margined
Box Turtle Cuora flavomarginata evelynae and the
Ryukyu Black-breasted Leaf Turtle Geoemyda
japonica, were also being sold. Because these are
protected species (designated as National Natural
Monuments), and their sale is banned by the Cultural
Properties Protection Law, these species were being
sold illegally.
Legal regulation concerning live reptiles
In addition to the Foreign Exchange and Foreign
Trade Law and the Customs Law that regulate the
import/export of CITES Appendix I-listed species at
the nation’s ports and watersides, Japan also has the
Law for the Conservation of Endangered Species of
Wild Fauna and Flora (LCES) regulating the trade of

爬
17Trade in Live Reptiles as Pets
Live animals and carcassesconfiscated by Japanese Customsfrom 2007 to 2008 (except corals)(unit: no. of Individuals)
5Figure
Source: Ministry of Finance, Customs and Tariff Bureau, 2007Note: One case (three specimens) consisted of reptiles and corals. If this case is included as one reptile individual, the total is 397; if it included two reptiles, the total is 398.
Reptile, 397(+1)
Mammal, 171
Insect, 6Amphibian, 2Fish, 2Bird, 27
CITES Appendix I-listed species and other rare wild-
life species once they enter Japan, and the capture of
these species in Japan. LCES applies only to CITES
Appendix I-listed species and not to Appendix-II or
Appendix-III species. Therefore, once CITES
Appendix-II or Appendix-III species have entered
Japan there is no regulation concerning their trade
within the domestic market.
Illegal trade
Reptiles are the most frequent targets of activities
involving illegal imports of any fauna into Japan. In
2007 and 2008, 397 live reptiles or reptile bodies were
seized by Japanese Customs officials (see Figure 5).
Most of these reptiles were tortoises and freshwater
turtles.
According to information analysed by TRAFFIC
regarding incidents of illegal trade and Customs
seizures within Japan between 1995 and 2008, the
most frequent targets of this illegal trade are species
including the Indian Star Tortoise Geochelone elegans,
Radiated Tortoise Astrochelys radiata, Burmese Star
Tortoise Geochelone platynota, and the Pancake
Tortoise Malacochersus tornieri.
Conclusion
Japan is a major importer of live reptiles. Most
of the reptiles sold in Japan are individuals that
have been imported from foreign countries. Some
of these are of species whose export is restricted in
the countries of origin, or species on the IUCN Red
List of Threatened Species. Although there are
laws in place to regulate the trade of reptiles in line
with the import/export regulations of CITES and
Japan’s domestic regulations such as LCES, those
domestic regulations do not apply to all species of
reptile. The most of illegal animal seizures (except
corals) at Japan’ s borders by Customs involve
reptile species, but domestic trade infractions can
only be enforced for Appendix I-listed species.
Among the reasons that TRAFFIC has identified
for these illegal activities are the lack of severity in
the penalties for illegal trading under LCES, the
management system shortfalls for traders and ven-
dors dealing in rare animals, and the need to
review the system for registering individual live
animals. TRAFFIC believes that Japan, as an end-
consumer of the world’s wildlife resources, must
amend its current national wildlife trade laws to
ensure that the trade occurring in Japan is not
threatening the populations of wild reptiles around
the world, thereby reducing the negative impact of
Japan’ s ecological footprint.
REFERENCESCITES. (2010). Trade Data Dashboard. Available at: http://www.cites.org/eng/news/sundry/2010/dashboards.shtml, accessed on August 4, 2010
Kanari, K. and Auliya, M. (In prep.). Pet Reptile Trade of Japan. Unpublished report.Ministry of Economy, Trade and Industry. (2009). CITES annual report 2007. Ministry of Finance. (2010). Trade Statistics of Japan. http://www.customs.go.jp/toukei/info/tsdl.htm. Accessed on 4 Augugst 2010 Sugano, H. (2008). [revised edition of medical care, food, shelter]. (In Japanese) 株式会社どうぶつ出版, Tokyo, Japan, 160 pp.
UNSD Comtrade. (2009). United Nations UNSD Comtrade Database viewed on 11 May 2009. Trade data is compiled by UN Statistics Depart-ment according to the report submitted by each country.
WWF Japan. (1999). [Research of dynamics of trade in CITES-listed species]. (In Japanese). Japan Economic Foundation, Tokyo, Japan. 134 pp.
改訂版ヘビの医・食・住
ワシントン条約対象動植物の取引動向に関する調査研究

18 Timber Trade of Japan
©K. Kanari / TRAFFIC
China: window to
the world.
Japan has been and
remains one of the largest
importers of forest prod-
ucts in the world. In 1996,
Japan was the number one
timber importer in the
world in volume. As the volume of demand for wood
products in Japan has decreased in recent years, the
USA and China replaced Japan as the largest importers,
but based on 2006 data Japan remained the third-largest
importer in the world (FAO, 1999; FAO, 2009). The
country’s self-supply ratio for wood products remains
low at 27.8% (Japan Forestry Agency, 2010) and there
is still a big dependency on imports as the supply source
(see Figure 1).
Looking at the global dynamics of timber trade over
the past decade, both the import and export volumes of
China have increased along with its share of the trade,
in a manner that befits the country’s reputation today
as ‘the world’s factory’ . Japan’ s timber imports have
also been influenced by this emergence of China’s
trade in this sector as a neighbouring country. In 1999,
Japan imported the largest share of its forestry prod-
ucts from the USA on a monetary basis, while China
was only the fifthlargest supplier to Japan, with an
amount accounting for just seven per cent of the total.
Ten years later in 2009, however, China had become
the largest supplier of forestry products to Japan,
accounting for 15% of the total (Figure 2) (Ministry
of Agriculture, Forestry and Fishery, 2010). In China,
the flooding that occurred in the Yangtze watershed in
1998 led the Chinese government to implement limita-
tions and bans of logging in the country’s natural
forest. As a result, much of the wood products Japan
imports from China today are made up of timber that
has been imported by China from other countries. In
this way, Japan’ s wood market is now affected by
forestry products that have been logged in China’ s
trading partners, such as Russia and Southeast Asian
and African countries, and then imported to Japan via
China.
An important question is: Where do the wood prod-
ucts imported by Japan from China actually originate
from? Wood is a product that can be obtained from a
variety of trees and knowing the species of the product
involved can be a clue for revealing the trade route by
which it has been supplied. Japan generally does not
capture the species-specific trade statistic codes under
the Customs "Harmonized Commodity Description
and Coding System" (hereafter HS) for tariff classifica-
tion of commodities. Even though there are statistical
and identification limitations to identifying each
species, and only large categories such as conifers and
certain species of tropical timber are shown in the HS
classification, it can reveal some information. For
Timber Trade of Japan
Kahoru Kanari, Programme Officer

林
19Timber Trade of Japan
World timber import (Unit: 1000m3)1Figure
Total for industrial roundwood, sawnwood and wood-based panels.Source: FAO, 1996; FAO, 2006, calculation by TRAFFIC East Asia-Japan
Supply structure for forestry products imported by Japan (monetary basis)2Figure
Source: Ministry of Agriculture, Forestry and Fishery, 2010
Breakdown of sawn wood imports by Japan from China (HS4407)(volume percentage)3Figure
Source: Ministry of Finance Japan (2010). Trade Statistics of Japan
200 000
180 000
160 000
140 000
120 000
100 000
80 000
60 000
40 000
20 000
0
66 092 54 052
14 465 11 871 11 744
118 170
Japan USA China Rep.of Korea Italy Others
1996
USA China Japan Finland Italy Others
200 000
180 000
160 000
140 000
120 000
100 000
80 000
60 000
40 000
20 000
0
63 435
46 294
24 737 15 595 14 358
179 736
2006
USA
1999
1
2
3
MalaysiaChina
Others
45
2009
115%
19%
16%
14%12%7%
12%
10%
2
345
Malaysia
Canada
Indonesia
China
Others
Australia
Indonesia
Canada46%
8% 9%
32%
73.6%
25.6%
0.8% conifer
tropical timber
Others
73.3%
26.6%
0.1%
conifer
Others
1997 2009
cally, with conifers now constituting 73.6% and tropi-
cal wood 0.8% of the total (Figure 3) (Ministry of
Finance, 2010).
In March 2010, TRAFFIC East Asia-Japan con-
ducted a market survey of wood products sold on the
general market in Japan that had been processed and
example, the breakdown of commodities under desig-
nated HS code 4407 wood (sawn wood with a thick-
ness of over six millimetres) imported by Japan from
China in 1997 was 26.6% conifers, 0.1% tropical
wood and the remainder was “other species” (wood of
temperate zone forests, etc., such as Paulownia spp.).
By 2009, however, that breakdown had changed drasti-
20 Timber Trade of Japan
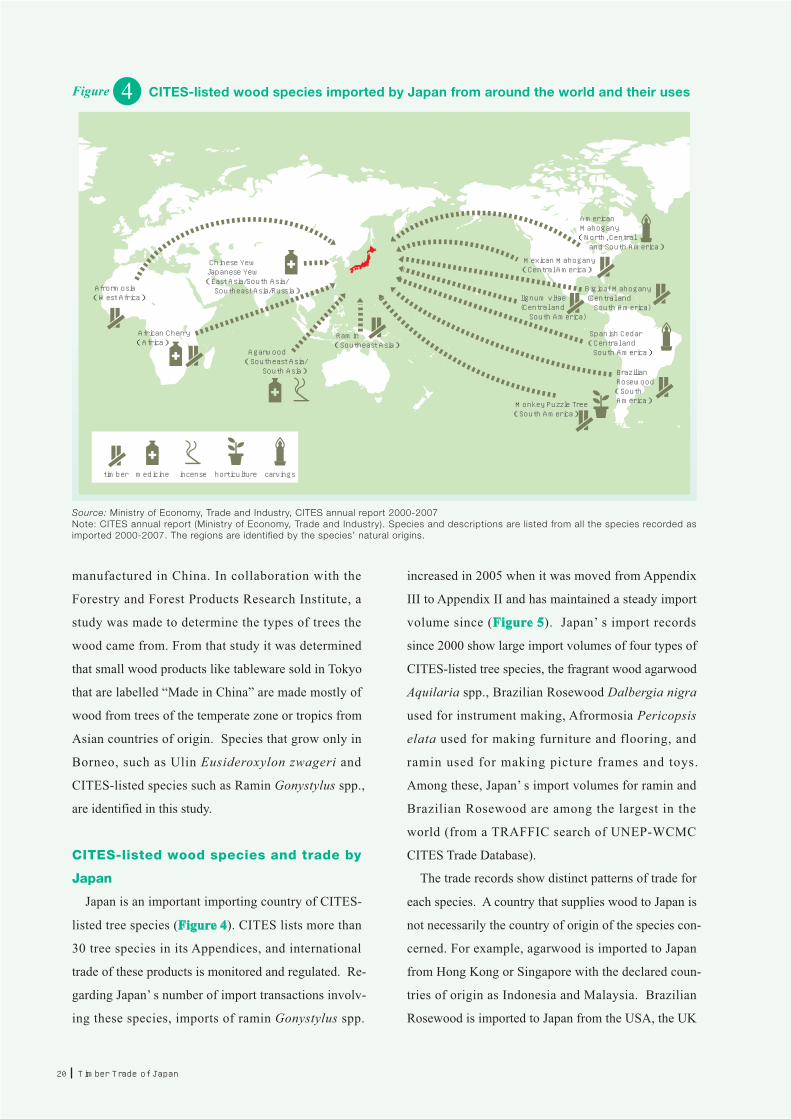
CITES-listed wood species imported by Japan from around the world and their uses4Figure
Source: Ministry of Economy, Trade and Industry, CITES annual report 2000-2007Note: CITES annual report (Ministry of Economy, Trade and Industry). Species and descriptions are listed from all the species recorded as imported 2000-2007. The regions are identified by the species’ natural origins.
American Mahogany(North, Central and South America)
Mexican Mahogany(Central America)
Bigleaf Mahogany (Central and South America)
lignum vitae(Central and South America)
Spanish Cedar(Central and South America)
BrazilianRosewood(SouthAmerica)
Ramin(Southeast Asia)
Agarwood(Southeast Asia/ South Asia)
African Cherry(Africa)
Chinese YewJapanese Yew(East Asia/South Asia/ Southeast Asia/Russia)Afrormosia
(West Africa)
timber medicine incense horticulture carvings
Monkey Puzzle Tree(South America)
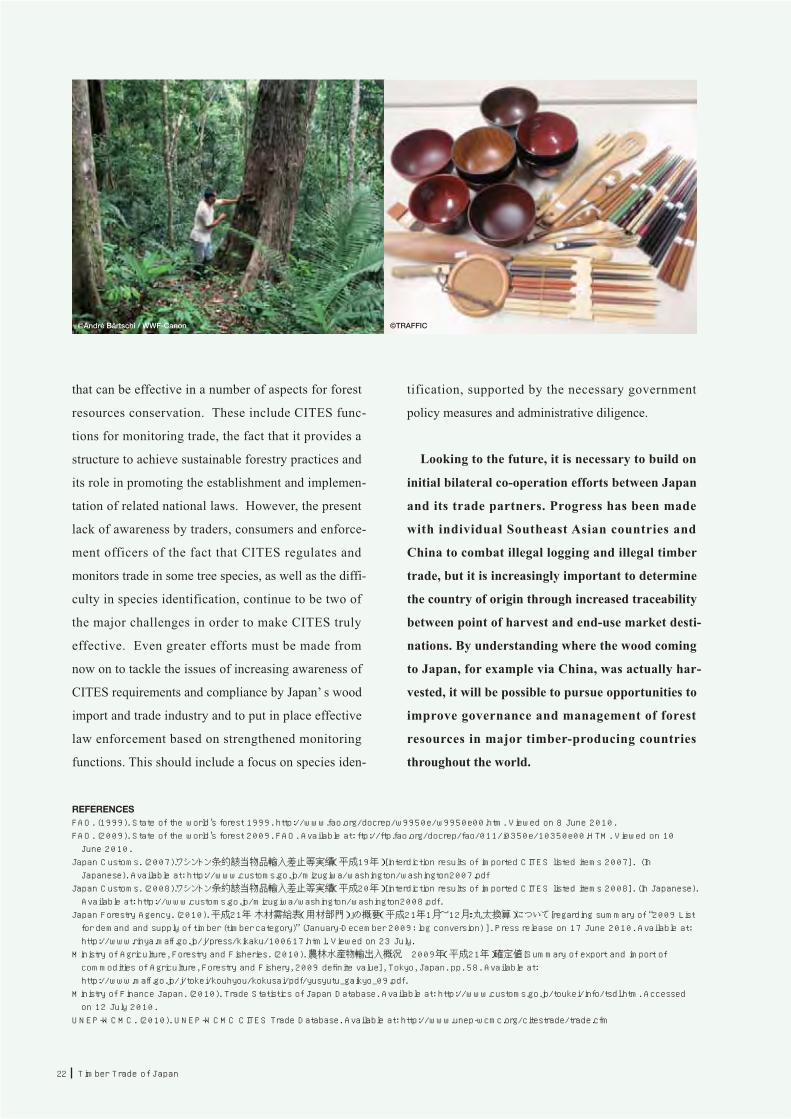
manufactured in China. In collaboration with the
Forestry and Forest Products Research Institute, a
study was made to determine the types of trees the
wood came from. From that study it was determined
that small wood products like tableware sold in Tokyo
that are labelled “Made in China” are made mostly of
wood from trees of the temperate zone or tropics from
Asian countries of origin. Species that grow only in
Borneo, such as Ulin Eusideroxylon zwageri and
CITES-listed species such as Ramin Gonystylus spp.,
are identified in this study.
CITES-listed wood species and trade by
Japan
Japan is an important importing country of CITES-
listed tree species (Figure 4). CITES lists more than
30 tree species in its Appendices, and international
trade of these products is monitored and regulated. Re-
garding Japan’ s number of import transactions involv-
ing these species, imports of ramin Gonystylus spp.
increased in 2005 when it was moved from Appendix
III to Appendix II and has maintained a steady import
volume since (Figure 5). Japan’ s import records
since 2000 show large import volumes of four types of
CITES-listed tree species, the fragrant wood agarwood
Aquilaria spp., Brazilian Rosewood Dalbergia nigra
used for instrument making, Afrormosia Pericopsis
elata used for making furniture and flooring, and
ramin used for making picture frames and toys.
Among these, Japan’ s import volumes for ramin and
Brazilian Rosewood are among the largest in the
world (from a TRAFFIC search of UNEP-WCMC
CITES Trade Database).
The trade records show distinct patterns of trade for
each species. A country that supplies wood to Japan is
not necessarily the country of origin of the species con-
cerned. For example, agarwood is imported to Japan
from Hong Kong or Singapore with the declared coun-
tries of origin as Indonesia and Malaysia. Brazilian
Rosewood is imported to Japan from the USA, the UK

林
21Timber Trade of Japan
Numbers of Japan’s import transactions (numbers of permits)involving CITES-listed tree species5Figure
Source: Ministry of Economy, Trade and Industry, CITES annual report
Types of wood interdicted by Japan Customs 1Ta b l e
Source: Japan Customs, 2007; Japan Customs, 2008
date of interdiction carried on
2007/May/07
2007/Nov./12
2007/Nov./13
2008/Sept./5
2008/Sept./5
2008/Nov./6
agarwood
agarwood
agarwood
agarwood
agarwood
agarwood
pieces
pieces
pieces
pieces
pieces
pieces
Taiwan
Viet Nam
Taiwan
Thailand
Thailand
China
II
II
II
II
II
II
13
1
1
1
1
90
type of transportation
baggage transported by air incense
medicine
pouch
incense wood
incense wood
jewellery and accessory
no CITES export/re-export permitno CITES export/re-export permit
no CITES export/re-export permitno CITES export/re-export permitno CITES export/re-export permitno CITES export/re-export permit
form type number unit reason for interdiction CITES App. exporting
country / territory
20001117010545
2002171913910946
200192919654
7006005004003002001000 2003
9155314350
20051110401103125
20041017419853
2006281632383117
200720429782130
178
252330
270219
650567 533
OthersPericopsis elataGonystylus spp.Dalbergia nigraAquilaria spp.
or Germany with the declared country of origin as
Brazil. Afrormosia is declared as originating from the
Congo and Cameroon, but the wood is imported to
Japan from Taiwan.
While much of the trade is done legally in accor-
dance with CITES procedures, there are also cases
where Japanese Customs has stopped illegal transac-
tions in these species (Japan Customs, 2007; Japan
Customs, 2008). Among CITES-listed species,
attempted smuggling of import shipments of agarwood,
primarily in postal packages from Thailand, Taiwan,
China and Viet Nam have been stopped at Japanese
Customs in 2007 and 2008 (see Table 1).
In terms of CITES (re-) exports from Japan, the
number of export transactions of products derived
from CITES-listed tree species from Japan amounts to
only about one-fifth the number of import transactions,
even in the years of high export frequency. In some
years there has been only one such export transaction
recorded.
Forestry products imported to Japan as the final
consumption destination are sold on the Japanese
market in a number of forms. There are specialized
stores dealing in unprocessed timber and specialized
stores selling processed wood products (instruments,
incense). There are no statistics or studies available by
species or which give a whole picture of the scale of
Japan’ s market for CITES-listed tree species.
In the ongoing efforts of countries around the world
to protect forest resources from over-exploitation and
put in place measures to prevent illegal logging and
trade in illegal timber, CITES provides a framework
22 Timber Trade of Japan
©André Bärtschi / WWF-Canon ©TRAFFIC
that can be effective in a number of aspects for forest
resources conservation. These include CITES func-
tions for monitoring trade, the fact that it provides a
structure to achieve sustainable forestry practices and
its role in promoting the establishment and implemen-
tation of related national laws. However, the present
lack of awareness by traders, consumers and enforce-
ment officers of the fact that CITES regulates and
monitors trade in some tree species, as well as the diffi-
culty in species identification, continue to be two of
the major challenges in order to make CITES truly
effective. Even greater efforts must be made from
now on to tackle the issues of increasing awareness of
CITES requirements and compliance by Japan’ s wood
import and trade industry and to put in place effective
law enforcement based on strengthened monitoring
functions. This should include a focus on species iden-
tification, supported by the necessary government
policy measures and administrative diligence.
Looking to the future, it is necessary to build on
initial bilateral co-operation efforts between Japan
and its trade partners. Progress has been made
with individual Southeast Asian countries and
China to combat illegal logging and illegal timber
trade, but it is increasingly important to determine
the country of origin through increased traceability
between point of harvest and end-use market desti-
nations. By understanding where the wood coming
to Japan, for example via China, was actually har-
vested, it will be possible to pursue opportunities to
improve governance and management of forest
resources in major timber-producing countries
throughout the world.
REFERENCESFAO. (1999). State of the world’s forest 1999. http://www.fao.org/docrep/w9950e/w9950e00.htm. Viewed on 8 June 2010.FAO. (2009). State of the world’s forest 2009. FAO. Available at: ftp://ftp.fao.org/docrep/fao/011/i0350e/10350e00.HTM. Viewed on 10 June 2010.
Japan Customs. (2007).ワシントン条約該当物品輸入差止等実績(平成19年)[interdiction results of imported CITES listed items 2007]. (In Japanese). Available at: http://www.customs.go.jp/mizugiwa/washington/washington2007.pdf
Japan Customs. (2008).ワシントン条約該当物品輸入差止等実績(平成20年)[interdiction results of imported CITES listed items 2008]. (In Japanese). Available at: http://www.customs.go.jp/mizugiwa/washington/washington2008.pdf.
Japan Forestry Agency. (2010). 平成21年 木材需給表(用材部門)」の概要(平成21年1月~12月:丸太換算)について[regarding summary of “2009 List for demand and supply of timber (timber category)” (January-December 2009: log conversion) ]. Press release on 17 June 2010. Available at: http://www.rinya.maff.go.jp/j/press/kikaku/100617.html. Viewed on 23 July.
Ministry of Agriculture, Forestry and Fisheries. (2010). 農林水産物輸出入概況 2009年(平成21年)確定値[Summary of export and import of commodities of Agriculture, Forestry and Fishery, 2009 definite value], Tokyo, Japan. pp. 58. Available at: http://www.maff.go.jp/j/tokei/kouhyou/kokusai/pdf/yusyutu_gaikyo_09.pdf.
Ministry of Finance Japan. (2010). Trade Statistics of Japan Database. Available at: http://www.customs.go.jp/toukei/info/tsdl.htm. Accessed on 12 July 2010.
UNEP-WCMC. (2010). UNEP-WCMC CITES Trade Database. Available at: http://www.unep-wcmc.org/citestrade/trade.cfm

Statistics and the Role of CustomsC O L U M N
林
23Column : Statistics and the Role of Customs
Note: Orange bars show Japan’s Customs figures (imports), light green bars show China’s Customs figures (exports). From 2000 to 2002 Japan’s figures were higher, but since 2003 China’s figures have been far higher than Japan’s. Sources: Japan Finance Ministry, China Customs Agency
©K. Kanari / TRAFFIC
2000
2001
2002
2003
2004
2005
2006
500 100 150 200 250 300 350(1,000m3)
400 450
Example:Figures for HS4407 (processed wood) trade from China to Japan (1000m3)
Example of discrepancies between reported JapaneseCustoms import data and reported Chinese Customs export data
Figure
One of the problems with trade statistics in
particular is the discrepancies in volume and price
figures between the export country and import
country records for the same shipments. TRAFFIC
has noted these discrepancies and proposed
measures such as having the export country and
import country co-operate in comparing Customs
declaration documents, to identify and eliminate
these discrepancies in trade statistics and thus
achieve greater transparency in international trade.
In Japan, the statistics available to provide
insight into the status of international trade in wood
are the Ministry of Finance’s Japan Trade Statistics
and the CITES annual report of the Ministry of
Economy, Trade and Industry. The Trade Statistics
provide data on shipments valued at more than
JPY 200 000 (USD 1994) per case but do not
contain statistics concerning species. On the
other hand, the CITES annual report l ists al l
transactions by species, but only for species listed
in the CITES Appendices.

24 Japan’s Trade in Medicinal Plants
©Nautilusfilm / TRAFFIC
©Eanghourt KhouJ. Compton / TRAFFIC
People use wild flora
in a variety of ways. For
direct or indirect inges-
tion, the plants are used
as food, oil, drink, spice,
fodder, medicine, poison
and as aromatics (Hotta
et al . , 1989). Among
these uses, the greatest number of plant species has
been used for medicinal purposes – with a variety of
plant-based pharmacopoeias and medicinal systems
throughout the world. Even today, there are many
countries that continue to depend on traditional medi-
cine practices using medicinal plants as a primary
means to maintain the health of their people. The
medicinal plants are not only used domestically but
also appear in international trade in large quantities.
The industry has a huge commercial value – for
example, in 2005, China sold medicinal plants equiva-
lent to USD 14 billion (WHO, 2010), making it one
of the world’ s leading producers. Of China’ s total
medicinal plant production, the equivalent of USD 4
billion was exported to international markets and
trade continues to grow at the rate of about 10% annu-
ally (TRAFFIC East Asia China Programme, 2008).
Japan also has a long history using flora for medici-
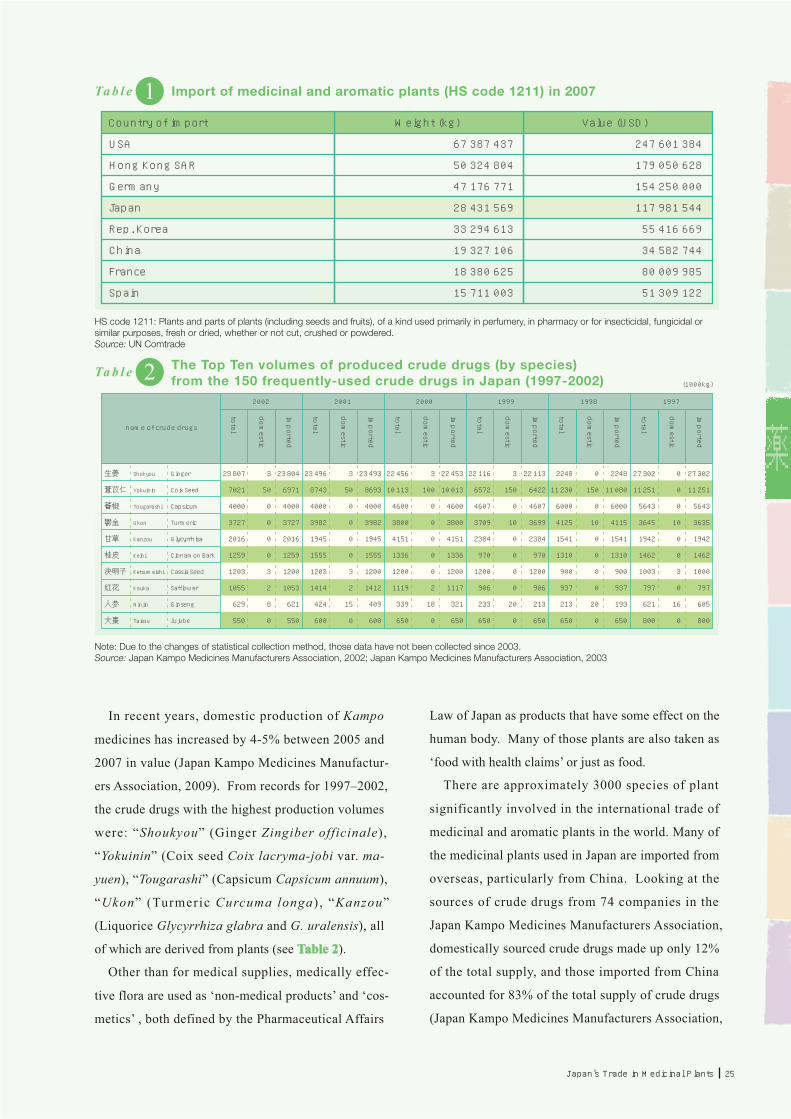
nal and aromatic purposes. In 2007 Japan imported
30 000 t of medicinal and aromatic plants and deriva-
tives, valued at more than USD100 million in a single
year, and ranked fourth globally only after USA,
Hong Kong, and Germany in 2007 (Table 1). Those
imported plants are used as components of Japan’ s
traditional medicine, as well as in developing modern
pharmaceuticals. Japan has a traditional medicine
system called Kampo that derives from the long rela-
tionship of exchange with its neighbour, China.
Kampo in Japan today is considered a unique Japa-
nese derivation of medicine that has evolved from Chi-
nese traditional practices. In this tradition, each
“crude drug” , which has a number of active ingredi-
ents, is mixed according to a special recipe to form
Kampo medicines. Kampo medicine comprised 1.8%
(JPY126 billion) of the total Japanese medical drug
production in 2008 (JPY6 620 billion) (Ministry of
Health, Labour and Welfare, 2008). Japan does not
separate traditional Kampo from modern medicine,
therefore all Japanese doctors can prescribe Kampo
medicines as well as other drugs to their patients. In
addition to the medicines prescribed by doctors,
Kampo medicine is familiar to Japanese people as
Over-the-Counter (OTC) drugs (those that do not
require a prescription) or household stock medicines.
The latest Japanese pharmacopoeia defines medical
supplies with officially recognized effects in Japan,
and lists 158 types of crude drug derived from flora,
fauna and minerals in its ‘crude drug’ section
(Ministry of Health, Labor and Welfare, 2007). The
large majority of these are derived from plants.
Japan’s Trade in Medicinal Plants
Kahoru Kanari, Programme Officer
薬
25Japan’s Trade in Medicinal Plants
Import of medicinal and aromatic plants (HS code 1211) in 20071Ta b l e
HS code 1211: Plants and parts of plants (including seeds and fruits), of a kind used primarily in perfumery, in pharmacy or for insecticidal, fungicidal or similar purposes, fresh or dried, whether or not cut, crushed or powdered.Source: UN Comtrade
The Top Ten volumes of produced crude drugs (by species)from the 150 frequently-used crude drugs in Japan (1997-2002)2Ta b l e
Note: Due to the changes of statistical collection method, those data have not been collected since 2003.Source: Japan Kampo Medicines Manufacturers Association, 2002; Japan Kampo Medicines Manufacturers Association, 2003
USA
Hong Kong SAR
Germany
Japan
Rep. Korea
China
France
Spain
67 387 437
50 324 804
47 176 771
28 431 569
33 294 613
19 327 106
18 380 625
15 711 003
247 601 384
179 050 628
154 250 000
117 981 544
55 416 669
34 582 744
80 009 985
51 309 122
Country of import Weight (kg) Value (USD)
生姜
薏苡仁
蕃椒
鬱金
甘草
桂皮
決明子
紅花
人参
大棗
name of crude drugs
2002
total
imported
domestic
total
imported
domestic
total
imported
domestic
total
imported
domestic
total
imported
domestic
total
imported
domestic
2001 2000 1999 1998 1997
(1000kg)
Shokyou
Yokuinin
Tougarashi
Ukon
Kanzou
Keihi
Ketsumeishi
Kouka
Ninjin
Taisou
Ginger
Coix Seed
Capsicum
Turmeric
Glycyrrhisa
Cinnamon Bark
Cassia Seed
Safflower
Ginseng
Jujube
23 807
7021
4000
3727
2016
1259
1203
1055
629
550
3
50
0
0
0
0
3
2
8
0
23 804
6971
4000
3727
2016
1259
1200
1053
621
550
23 496
8743
4000
3982
1945
1555
1203
1414
424
600
3
50
0
0
0
0
3
2
15
0
23 493
8693
4000
3982
1945
1555
1200
1412
409
600
22 456
10 113
4600
3800
4151
1336
1200
1119
339
650
3
100
0
0
0
0
0
2
18
0
22 453
10 013
4600
3800
4151
1336
1200
1117
321
650
22 116
6572
4607
3709
2384
970
1200
906
233
650
3
150
0
10
0
0
0
0
20
0
22 113
6422
4607
3699
2384
970
1200
906
213
650
2248
11 230
6000
4125
1541
1310
900
937
213
650
0
150
0
10
0
0
0
0
20
0
2248
11 080
6000
4115
1541
1310
900
937
193
650
27 302
11 251
5643
3645
1942
1462
1003
797
621
800
0
0
0
10
0
0
3
0
16
0
27 302
11 251
5643
3635
1942
1462
1000
797
605
800
Law of Japan as products that have some effect on the
human body. Many of those plants are also taken as
‘food with health claims’ or just as food.
There are approximately 3000 species of plant
significantly involved in the international trade of
medicinal and aromatic plants in the world. Many of
the medicinal plants used in Japan are imported from
overseas, particularly from China. Looking at the
sources of crude drugs from 74 companies in the
Japan Kampo Medicines Manufacturers Association,
domestically sourced crude drugs made up only 12%
of the total supply, and those imported from China
accounted for 83% of the total supply of crude drugs
(Japan Kampo Medicines Manufacturers Association,
In recent years, domestic production of Kampo
medicines has increased by 4-5% between 2005 and
2007 in value (Japan Kampo Medicines Manufactur-
ers Association, 2009). From records for 1997–2002,
the crude drugs with the highest production volumes
were: “Shoukyou” (Ginger Zingiber officinale),
“Yokuinin” (Coix seed Coix lacryma-jobi var. ma-
yuen), “Tougarashi” (Capsicum Capsicum annuum),
“Ukon” (Turmeric Curcuma longa) , “Kanzou”
(Liquorice Glycyrrhiza glabra and G. uralensis), all
of which are derived from plants (see Table 2).
Other than for medical supplies, medically effec-
tive flora are used as ‘non-medical products’ and ‘cos-
metics’ , both defined by the Pharmaceutical Affairs

26 Japan’s Trade in Medicinal Plants
Estimation of wild supply component ofmedicinal plants for crude drugs3Ta b l e
Source: Asama, Japan Kampo Medicines Manufacturers Association, In litt., to TRAFFIC East Asia-Japan in August 2010
All from wild sources
Type of crude drugs
Estimated weight (t)
Wild2800
Wild4800
Wild2000
Cultivation1800
Cultivation12 200
Cultivation10 400
From both wild and cultivated sources All from cultivated sources
9 types: e.g.
“Kanzou” , (Liquorice Glycyrrhiza glabra and G. uralensis)
“Kakkon”(Kudzu Pueraria lobata),
“Chorei”(Polyporus umbellata)
30 types: e.g.
“Syakuyaku” (Paeonia lactiflora)
“Keihi” (Cinnamomum cassia)
“Bukuryou” (Poria cocos)
11 types: e.g.
“Hange”(Pinellia ternata),
“Maou”(Ephedra sinica, E. intermedia, E. equisetina),
“Soujyutsu”(Atractylodes lancea, A. chinensis)
2010). By species, the average imported proportion
of the 150 most-used crude drugs was 85.5% of the
supply in 2002 (Japan Kampo Medicines Manufactur-
ers Association, 2003). Of the 150 species, there were
only 20 species for which domestic production
accounted for more than half of the supply, including
“Kumazasa” (Sasa veitchii), “Sansyou” (Zanthoxylum
piperitum) and “Gajyutsu” (Curcuma zedoaria), while
there were 80 species—more than half of the total—
for which 100% of the supply came from imports
(Japan Kampo Medicines Manufacturers Association,
2003).
According to the Japan Kampo Medicines Manufac-
turers Association, 50 types of crude drug produce
90% of Japanese Kampo production; 30% of the total
supply of those 50 types of crude drug in weight are
estimated to be from the wild (Table 3) (Asama,
Japan Kampo Medicines Manufacturers Association
in litt., to TRAFFIC East Asia-Japan, August 2010).
Since Japan depends heavily on foreign imports,
the use of these medicinal plants in Japan has an
impact on the population status of wild plants in
the countries of origin.
REFERENCESJapan Kampo Medicines Manufacturers Association. (2002; 2003; 2009). [Production state of medicines manufactures as]. http://www.nikkankyo.org/publication/movement.html. Accessed on 26 July 2010.
Japan Kampo Medicines Manufacturers Association. (2010). 生薬・薬用植物の生産・流通の現状 [The condition of Production and Distribution for Crude drug and medicinal plants] presented by Asama, H. In: 薬用植物フォーラム2010講演要旨集[Abstract of The Forum on Medicinal Plants, 2010. 13th July 2010]. Pp. 9-12
Hotta, M., Ogata, K., Nitta, A., Hoshikawa, K., Yanagi, M. and Yamazaki, K. (Ed.) (1989). Useful Plants of the World. Heibonsha Ltd., Tokyo Japan. page iii-xii
Ministry of Health, Labour and Welfare. (2007). The Japanese Pharmacopoeia Fifteenth edition. 180pp. Abailable at: http://jpdb.nihs.go.jp/jp15/. Ministry of Health, Labor and Welfare. (2008). [Pharmaceutical industry production state statistics annual report 2008]. Abailable at:http://www.mhlw.go.jp/topics/yakuji/2008/nenpo/index.html.
TRAFFIC East Asia China Programme. (2008). The State of Wildlife Trade in China: Information on the trade in wild animals and plants in China 2007.
The United Nations Statistics Division. (2008). UN Comtrade Database. http://comtrade.un.org/db/WHO. (2010). Fact Sheet No.134: Traditional Medicine. http://www.who.int/mediacentre/factsheets/fs134/en/. Viewed on 28 June 2010.
漢方製剤等の生産動態
平成20年 薬事工業生産動態統計年報
C O L U M N
薬
27Column:FairWild Standard and global plant conservation measares / Field report: people and medicinal species in the Upper Yangtze River eco-region
©Sladjana Bundalo
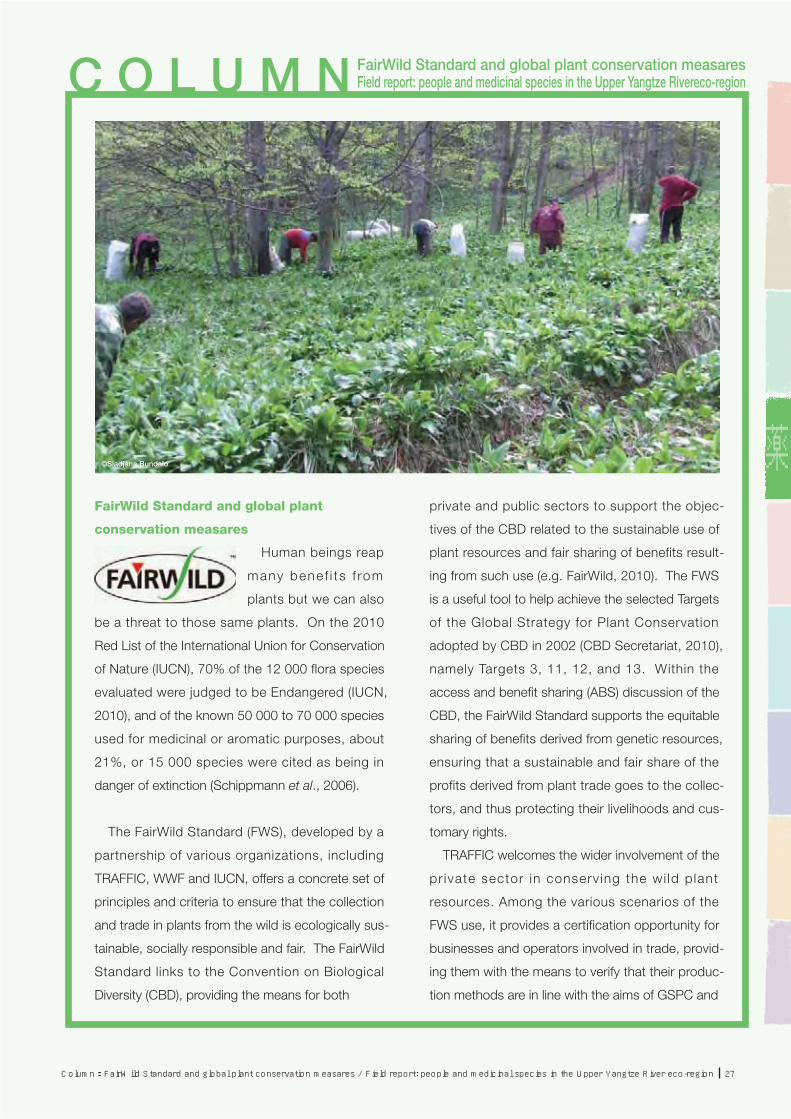
FairWild Standard and global plant
conservation measares
Human beings reap
many bene f i t s f rom
plants but we can also
be a threat to those same plants. On the 2010
Red List of the International Union for Conservation
of Nature (IUCN), 70% of the 12 000 flora species
evaluated were judged to be Endangered (IUCN,
2010), and of the known 50 000 to 70 000 species
used for medicinal or aromatic purposes, about
21%, or 15 000 species were cited as being in
danger of extinction (Schippmann et al., 2006).
The FairWild Standard (FWS), developed by a
partnership of various organizations, including
TRAFFIC, WWF and IUCN, offers a concrete set of
principles and criteria to ensure that the collection
and trade in plants from the wild is ecologically sus-
tainable, socially responsible and fair. The FairWild
Standard links to the Convention on Biological
Diversity (CBD), providing the means for both
private and public sectors to support the objec-
tives of the CBD related to the sustainable use of
plant resources and fair sharing of benefits result-
ing from such use (e.g. FairWild, 2010). The FWS
is a useful tool to help achieve the selected Targets
of the Global Strategy for Plant Conservation
adopted by CBD in 2002 (CBD Secretariat, 2010),
namely Targets 3, 11, 12, and 13. Within the
access and benefit sharing (ABS) discussion of the
CBD, the FairWild Standard supports the equitable
sharing of benefits derived from genetic resources,
ensuring that a sustainable and fair share of the
profits derived from plant trade goes to the collec-
tors, and thus protecting their livelihoods and cus-
tomary rights.
TRAFFIC welcomes the wider involvement of the
pr ivate sector in conserv ing the wi ld p lant
resources. Among the various scenarios of the
FWS use, it provides a certification opportunity for
businesses and operators involved in trade, provid-
ing them with the means to verify that their produc-
tion methods are in line with the aims of GSPC and
FairWild Standard and global plant conservation measaresField report: people and medicinal species in the Upper Yangtze Rivereco-region

C O L U M N
28 Column:FairWild Standard and global plant conservation measares / Field report: people and medicinal species in the Upper Yangtze River eco-region
©TRAFFIC
the ABS regime.
Several demonstration projects around the world
tested the application of the standards, and pro-
moted the spread of the FairWild Standard, includ-
ing connecting local producers to markets. The
most effective factor in persuading the producers
to adhere to the FairWild Standard is through direct
establishment of producer-buyer relationships. In
order to promote global use of the FairWild Stan-
dard, TRAFFIC is working in Japan, as a major con-
sumer region for medicinal and aromatic plants, to
develop Japan’ s consumer market in line with the
FairWild principles.
Field report: people and medicinal species
in the Upper Yangtze River eco-region
One of the harvesting sites of medicinel species
is there in China, which is the most important
source country of medicinal plants to Japan. The
region of the upper watershed of the Yangtze River
in China is an eco-region with one of the world’ s
richest biodiversity. Even within China, with its
large production of medicinal plants, this region is
especially well known as one important area for
medicinal plants harvested from the wild. A project
in which medicinal plants are gathered and traded
according to the sustainable standards has been
introduced in several sites, including Ningshan
County in Shaanxi Province, where medicinal
plants such as “Nangomishi” (Schisandra sphenan-
thera), Polyporus spp. the genus including “Chorei”
(Polyporus umbellatus), “Tenma” (Gastrodia elata)
and “Jyurou” (Paris polyphylla) are produced
(Figure). Most of those are exported to end-
consumer countries, such as Japan, as well as con-
sumed inside China.
From the interview with local harvesters, some
of them have existing sources of income from rais-
ing mushrooms, which still only earns them the
equivalent of a few 100 000 yen annually. An-
other important 20% or so of their income comes
from harvesting medicinal plants from the wild.
There are also some areas where 100% of the
people’ s income comes from medicinal plants.
Until now, however, little attention was paid to
how these medicinal plants were collected. For
example, there were some cases, in which very
damaging harvest methods were used, such as
pulling a plant out by its roots to obtain fruits. Also,
the amounts harvested and the amounts traded
tended to be small and unstable from year to year.
To establish a system of sustanable harvesting in
this region, the collectors of medicinal plants were
given detailed training before harvesting season,
focusing on sustainable collection methods and
quantities.
From the local harvesters comments, one of the

薬
29Column:FairWild Standard and global plant conservation measares / Field report: people and medicinal species in the Upper Yangtze River eco-region
Left: Fruit of Schisandra sphenanthera ©Liu Xueyan/TRAFFICRight: Sclerotium of Polyporus spp. ©Liu Xueyan/TRAFFIC
Map of the project area and wild medicinal plants of the areaFigure
Sichuan Province
Gansu Province
upper ⇔ downYangtze River
Beijing
CHINA
Shaanxi Province
Ningshan
Shaanxi Province
Qin LingXian
mountains
Yangtze River
biggest perceived benefit of introducing the sustan-
able harvesting standard was that it brought
buyers to purchase their produce on a regular
basis. For people whose livelihood is closely tied
to wild plants, the presence of buyers who will con-
sistently purchase the plants they have harvested
is very important.
To promote FairWild, securing reliable markets is
important and expanding demand for FairWild certi-
fied products in destination markets provides the
prime motivation for producer communities and
regions to adopt the FairWild Standard.
For a large consuming and importing nation of
medicinal plants like Japan, increasing awareness
of the FairWild Standard by the private sector in
the marketplace can have a direct influence on the
production (growth and supply) of medicinal plants,
and therefore benefit not only the sustainability of
wild plant populations but also the livelihood of the
people in the producing regions.
REFERENCESCBD Secretariat. (2010). Global Strategy for Plant Conservation and Private Sector Engagement. In: square brackets. Issue 3:CBD Newsletter for Civil Society: 8.
FairWild (2010). FairWild and CBD. http://www.fairwild.org/international-legal-agreements/ . Viewed on 7 September 2010.IUCN. (2010). The IUCN Red List of Threatened Species. http://www.iucnredlist.org/. Accessed on 26 July 2010Kijima, M., Shibata, S., Shimomura, H. and Higashi, T. (Ed.). (1993). [Hirokawa Medicinal plants encyclopedia]. Hirokawa Publishing Co. Tokyo. Japan. 468 pp.
Schippmann, U., Leaman, D. andCunningham, A.B. (2006). Chapter 6. A comparison of cultivation and wild collection of medicinal and aromatic plants under sustainability aspects. In: Bogers, R.J., Craker, L.E. and Lange, D., Medicinal and Aromatic Plants.Wegeningen UR Frontis Book Series, 17:75-95. Springer, Dordrecht. Abailable at: http://library.wur.nl/frontis/.
廣川 薬用植物大事典

30 International Trade and Resource Management of Precious Corals (Coralliidae) in Japan
©Shinichiro OgiThis illustration is owned by Ehime Prefectural Library ©Nozomu Iwasaki
Introduction
T h e r e a r e a p p r o x i -
mately 31 species in the
family Coralliidae spp.
found throughout the
world in tropical, subtropi-
cal and temperate oceans.
Among these species, Sar-
dinia Coral Corallium rubrum of the Mediterranean Sea
has a particularly long history of use dating back to the
Roman Empire, with records of beads made of this coral
being traded to India and North Africa (Torntore, 2002).
The start of precious coral harvesting in Japan in the
latter half of the 19th century brought foreign buyers to
Japan, primarily from Italy, and Pacific precious corals
subsequently came to be traded on the European market
(Torntore, 2002). Presently, there is a growing interna-
tional demand particularly for the precious corals Aka
Coral Paracorallium japonicum and Momo Coral Coral-
lium elatius from the Pacific, not only due to their inher-
ent beauty but also due to the decline in populations and
capture production of Sardinia coral (Tsounis, 2009).
According to a Food and Agriculture Organization
(FAO) report, approximately 70% of the precious corals
used in Torre del Greco in southern Italy, in the world
center of the precious coral-processing industry are
harvested in Japan or Taiwan (FAO, 2007)1.
The concern about a decline in populations of
precious corals made it a subject of discussion at the
14th and 15th meetings of the Conference of Parties to
the Convention on International Trade in Endangered
Species of Wild Fauna and Flora (CITES CoP14 and
CoP15). This article focuses on Japan as one of the
major harvesting and processing countries for precious
corals, to clarify the status of Japan’ s international trade
and resource management.
Precious Coral Production Volumes and Japan
FAO compiles statistics on world precious coral
capture production, based on information from the gov-
ernments of the harvesting countries. Figure 1 shows
world capture production volumes for Aka coral and
Momo coral harvested in the Pacific, according to FAO
statistics. Figure 1 shows that Aka Coral capture produc-
tion dropped to 1.9 t in 2006, representing just 20% of
the 1983 production of 9.7 t. This means that production
dropped by 80% during this 23-year period. In contrast,
the approximately 5.5 t of Momo coral recorded as
produced in 1983 dropped by approximately 70% in just
four years, to a level of 1.9 t in 1987. Since then, the
trend has been towards an overall increase in production.
However the production levels are unstable, with drastic
increases or decreases recorded in some years. In the
period from 1992 to 2006 there were three recurring
cases of rapid increases and decreases in production, and
these fluctuations are thought to be the result of several
factors, including the discovery of new harvesting
grounds and subsequent intense harvesting, and price
International Trade and Resource Management of
Precious Corals (Coralliidae) in JapanSoyo Takahashi, Fisheries Officer
1 FAO materials are used as the reference for English names. Search Aquatic Species Fact Sheetshttp://www.fao.org/fishery/species/search/en
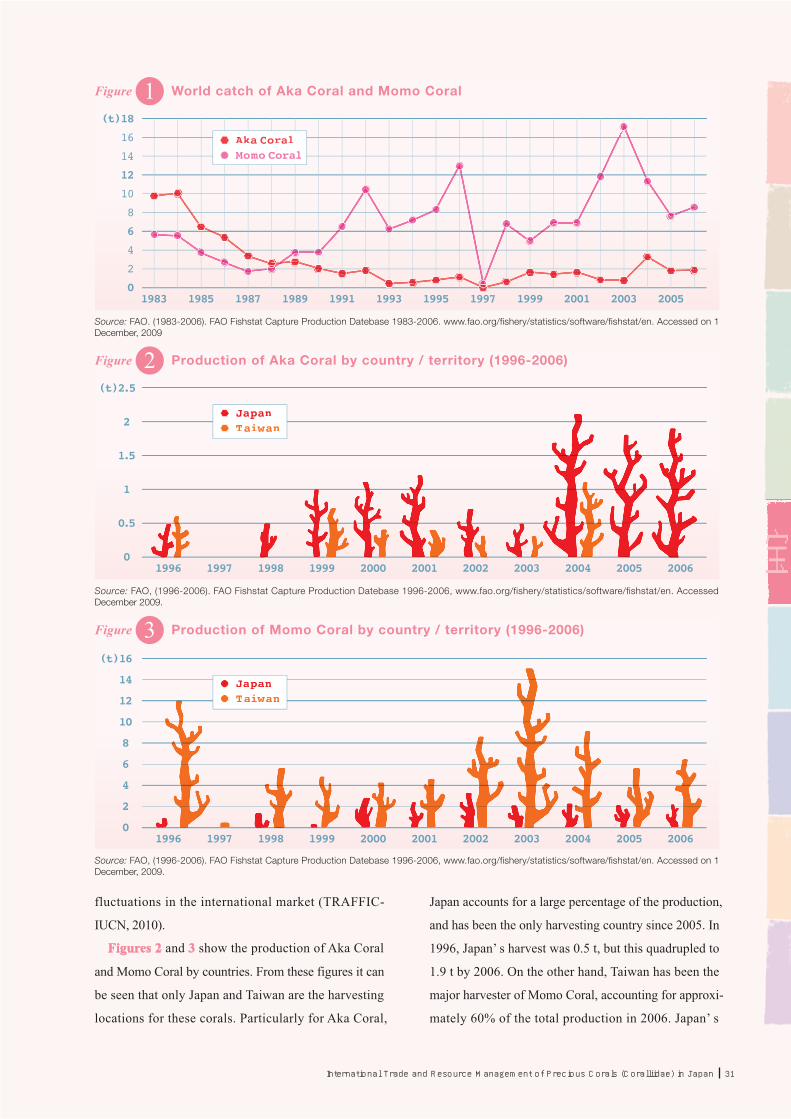
宝
31International Trade and Resource Management of Precious Corals (Coralliidae) in Japan
World catch of Aka Coral and Momo Coral1Figure
Source: FAO. (1983-2006). FAO Fishstat Capture Production Datebase 1983-2006. www.fao.org/fishery/statistics/software/fishstat/en. Accessed on 1 December, 2009
Production of Aka Coral by country / territory (1996-2006)2Figure
Source: FAO, (1996-2006). FAO Fishstat Capture Production Datebase 1996-2006, www.fao.org/fishery/statistics/software/fishstat/en. Accessed December 2009.
Production of Momo Coral by country / territory (1996-2006)3Figure
Source: FAO, (1996-2006). FAO Fishstat Capture Production Datebase 1996-2006, www.fao.org/fishery/statistics/software/fishstat/en. Accessed on 1 December, 2009.
(t)18
(t)2.5
1983 1985 1987 1989 1991 1993 1995 1997 1999 2001 2003 2005
(t)16
14
12
10
8
6
4
2
1996 1997 1998 1999 2000 2001 2002 2003 2004 2005 20060
JapanTaiwan
2
1.5
1
1996 1997 1998 1999 2000 2001 2002 2003 2004 2005 2006
0.5
0
JapanTaiwan
16
14
12
10
8
6
4
2
0
Aka CoralMomo Coral
Japan accounts for a large percentage of the production,
and has been the only harvesting country since 2005. In
1996, Japan’ s harvest was 0.5 t, but this quadrupled to
1.9 t by 2006. On the other hand, Taiwan has been the
major harvester of Momo Coral, accounting for approxi-
mately 60% of the total production in 2006. Japan’ s
fluctuations in the international market (TRAFFIC-
IUCN, 2010).
Figures 2 and 3 show the production of Aka Coral
and Momo Coral by countries. From these figures it can
be seen that only Japan and Taiwan are the harvesting
locations for these corals. Particularly for Aka Coral,

32 International Trade and Resource Management of Precious Corals (Coralliidae) in Japan
World share of total exports of coral (unworked)from Japan, by monetary value (1999-2008) 4Figure
Source: Ministry of Finance. (2009). Japan Trade Statistics (1999-2008). Available at; http://www.customs.go.jp/toukei/srch/index.htm. Accessed on 15 December 2009.
3812 %%Hong Kong
37%Taiwan
China
2%Rep.ofKorea
1%Italy1%Others
8USA
%
1%Germany
3812%
wan
a
annual production of Momo coral has stayed around two
tonnes since 2000.
International Trade
As of July 2010, there was no HS Code specifically
for precious corals in Japan’s trade statistics. Because
the data for unprocessed precious corals are grouped
together in the general category “corals” , along with
reef corals, it is difficult to get an overall picture of the
international trade in precious corals. Furthermore,
because the export HS Code for coral products is a
category that also includes such products as bekko
(marine turtle shell) and water buffalo horn, it is not
possible to get export figures for precious corals exclu-
sively.
Despite these data limitations, it is worth examining
the countries to which unprocessed corals from Japan
are exported. Figure 4 shows the shares by country of
the total value of coral exports for the 10-year period
from 1999 to 2008. Hong Kong, Taiwan and mainland
China are the recipients of about 87% of Japan’ s coral
exports. It can thus be estimated that these three trading
partners constitute the major international markets for
Japan’ s coral production.
Figure 5 shows Taiwan’s coral product export
volumes to Japan, and Japan’s import volumes from
Taiwan2 . The figures for 2004 and 2006 show minor
differences in these trade figures, but 2002, 2005 and
2007 show big discrepancies in the corresponding
figures. According to Japan’ s trade statistics for 2005,
Japan supposedly imported only nine kilogrammes of
coral products from Taiwan, but Taiwan’ s trade figures
show exports of 4313 kg to Japan. The reasons for these
types of statistical discrepancies cannot be determined
from simply analysing the trade statistics alone. Japan’ s
Ministry of Finance statistical protocols exclude figures
for transactions of under JPY200 000 (USD 1994). Even
considering this factor, however, it is still possible to
conclude that the Customs procedures between these
two countries are not being conducted appropriately
(Wu and Takahashi, 2009).
Management Measures
As of July 2010, harvesting of precious corals from
international waters is not regulated from a fisheries man-
agement perspective by any international organization
[e.g. Regional Fishery Management Organizations
(RFMOs)]. In East Asia, China listed precious corals as
national fauna in category I of the Law of the People's
Republic of China on the Protection of Wildlife in 1988
and banned all coral fisheries in their waters. Also, in
July 2008, four species of Coralliidae spp. were listed in
CITES Appendix III, effectively alerting China’s trading
partners that assistance was needed to manage interna-
tional trade in these species.
Taiwan placed new regulations on the harvesting and
export of precious corals in January 2009. All fishing
boats involved in the coral fishery are now required to
be licensed and fitted with VMS (vessel monitoring
2 Among the countries of East Asia that are the main destination for exports of corals produced in Japan, Taiwan is the only producer that has an HS Code for this trade. Coral imports from Japan fall under Taiwan’s HS Code 9601.90.100, which includes “worked bekko and coral, and articles of bekko or coral.” The Hawksbill Turtle Eretmochelys imbricata used for making turtle shell products is a species listed in CITES Appendix I and therefore banned as the object of international trade for commercial purposes. However, international trade for use in scientific research or joint preservation projects is permitted, in which case CITES parties are required to submit reports of such trade transactions to the United Nations Environment Programme World Conservation Monitoring Center (UNEP-WCMC). According to the current UNEP-WCMC database, no imports [of hawksbill] to Japan from Taiwan have been reported since 2000 (UNEP-WCMC, 2009). As a result, it is assumed that only coral products and processed coral are shown in Japan’s HS Code records since 2000.

宝
33International Trade and Resource Management of Precious Corals (Coralliidae) in Japan
Trade volumes of coral products between Japan and Taiwan5Figure
Source: Ministry of Finance (2009), Japan Trade Statistics(2002-2008). Available at: http://www.customs.go.jp/toukei/info/index.htm, Taiwan Customs Statistics. Available at: http://tcs.taiwantrade.com.tw/stap/main.asp?lang=1. Accessed on 15 December 2009.
Prefectures operatinga coral fishery in Japan6Figure
Japan’s Coral Fishery Regulations and Fisheries Management Regulations(Kochi, Kagoshima, Nagasaki, Okinawa prefectures)1Ta b l e
FCA = Fisheries Cooperative AssociationSources: Based on interview and questionnaires answers from the Fisheries Divisions of the four prefectures (TRAFFIC East Asia-Japan survey)
(kg)7000
6000
5000
4000
3000
2000
1000
02002 2003 2004 2005 2006 2007 2008
3642
25232848
9 20
14431665
4084
4105
5886
2559 2450
3329
4313
TW export to JPJP import from TW
KochiNagasaki
Okinawa
Kagoshima
None
Yes (All waters besides those operating water area)
Yes (off Muroto Cape, Ashizuri Cape, Sukumo Bay)
Yes, two months per year (1 Jan. ‒ end of Feb. off Muroto Cape)
Yes
Coral net only, bottom seine prohibited
3 years (Renewals: Muroto FCA July 9; Ashizuri, Sukumo FCA : Oct. 1)
None
Yes (All waters besides those operating water area)
Yes
None
None
None
1 year (Jan. 1 ‒ Dec. 31)
None
Yes (Including some areas within the approved operating areas
Yes
None
None
Only the fishing method approved by application
1 year (Apr. 1 ‒ Mar. 31)
None
None
None (Approved in all waters off Okinawa prefecture coasts)
None
None
Only fishing methods such as submarine vessel and gear that make coral selection possible. Bottom seine prohibited
3 years
OkinawaKagoshimaNagasakiKochi Regulation
Total allowable catch set
Prohibited fishing waters set
Operating water area set
Fishery prohibited period set
Fishing net size restriction
Fishing method restrictions
Licence period
system) devices in order to monitor if the licensed coral-
fishing boats harvest from the five designated areas. Fur-
thermore, a limit of total allowable catch (TAC) for
boats harvesting precious corals was set at 200 kg per
year and a limit of 120 kg per year was set on exports
per vessel (Wu and Takahashi, 2009).
In Japan, precious coral fisheries are regulated at the
prefecture level, using the Fishery Adjustment Rule and
the regional fishery adjustment commission of each
prefecture, based on the national Fisheries Law and the
Fisheries Resources Protection Law. TRAFFIC
conducted a questionnaire survey regarding fishery man-
agement regulation and reporting requirements for the
coral fishery, with the co-operation of the Fisheries Divi-
sions of the four major producing prefectures for
precious corals, Kochi, Kagoshima, Nagasaki and Oki-
nawa (Table 1 and Figure 6).
The survey results revealed big gaps and inconsisten-
cies between regulations in the four prefectures. For
example, none of them has established a TAC per vessel,
but one prefecture, Kochi, has established a closed
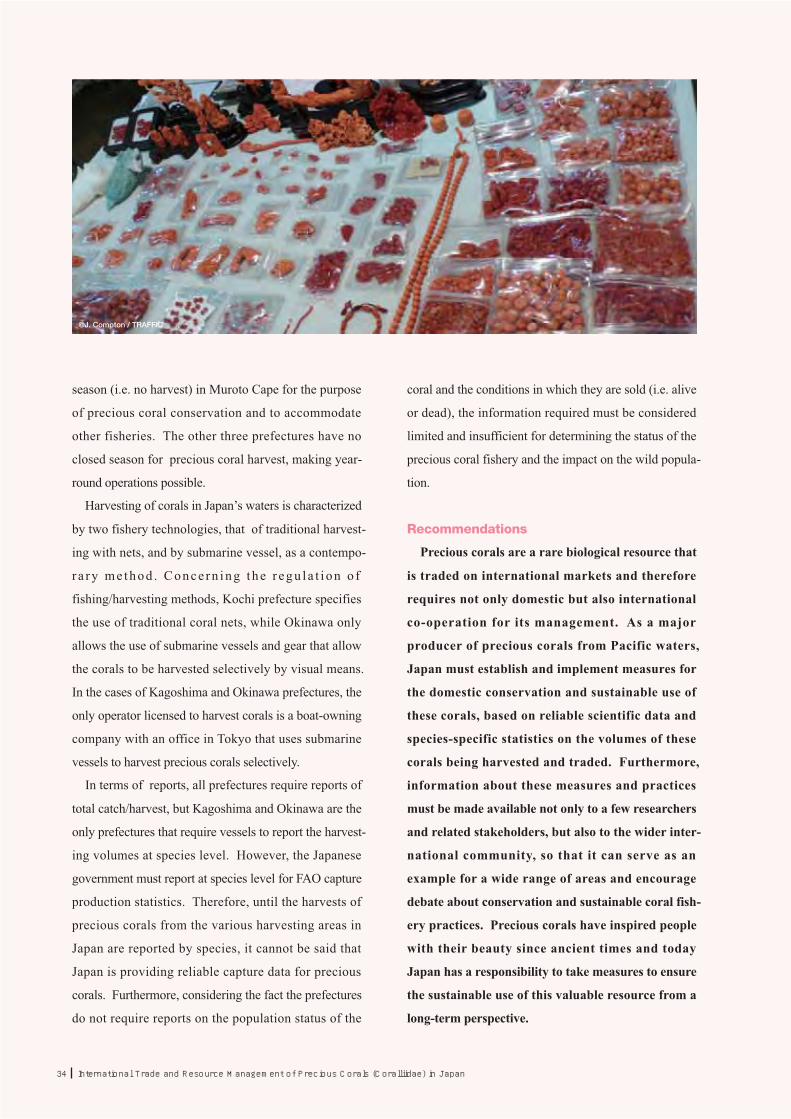
34 International Trade and Resource Management of Precious Corals (Coralliidae) in Japan
©J. Compton / TRAFFIC
coral and the conditions in which they are sold (i.e. alive
or dead), the information required must be considered
limited and insufficient for determining the status of the
precious coral fishery and the impact on the wild popula-
tion.
Recommendations
Precious corals are a rare biological resource that
is traded on international markets and therefore
requires not only domestic but also international
co-operation for its management. As a major
producer of precious corals from Pacific waters,
Japan must establish and implement measures for
the domestic conservation and sustainable use of
these corals, based on reliable scientific data and
species-specific statistics on the volumes of these
corals being harvested and traded. Furthermore,
information about these measures and practices
must be made available not only to a few researchers
and related stakeholders, but also to the wider inter-
national community, so that it can serve as an
example for a wide range of areas and encourage
debate about conservation and sustainable coral fish-
ery practices. Precious corals have inspired people
with their beauty since ancient times and today
Japan has a responsibility to take measures to ensure
the sustainable use of this valuable resource from a
long-term perspective.
season (i.e. no harvest) in Muroto Cape for the purpose
of precious coral conservation and to accommodate
other fisheries. The other three prefectures have no
closed season for precious coral harvest, making year-
round operations possible.
Harvesting of corals in Japan’s waters is characterized
by two fishery technologies, that of traditional harvest-
ing with nets, and by submarine vessel, as a contempo-
r a ry me thod . Conce rn ing t he r egu l a t i on o f
fishing/harvesting methods, Kochi prefecture specifies
the use of traditional coral nets, while Okinawa only
allows the use of submarine vessels and gear that allow
the corals to be harvested selectively by visual means.
In the cases of Kagoshima and Okinawa prefectures, the
only operator licensed to harvest corals is a boat-owning
company with an office in Tokyo that uses submarine
vessels to harvest precious corals selectively.
In terms of reports, all prefectures require reports of
total catch/harvest, but Kagoshima and Okinawa are the
only prefectures that require vessels to report the harvest-
ing volumes at species level. However, the Japanese
government must report at species level for FAO capture
production statistics. Therefore, until the harvests of
precious corals from the various harvesting areas in
Japan are reported by species, it cannot be said that
Japan is providing reliable capture data for precious
corals. Furthermore, considering the fact the prefectures
do not require reports on the population status of the

宝
35International Trade and Resource Management of Precious Corals (Coralliidae) in Japan
©Nozomu Iwasaki
REFERENCESFAO. (2009). FAO Fishstat Capture Production Datebase 1983-2006. http://www.fao.org/fishery/statistics/global-capture-production/en. Accessed on 1 December 2010.
FAO. (2007). FAO Fisheries Report No.833: Report of the second FAO ad hoc expert advisory panel for the assessment of proposals to amend Appendices I and II of CITES concerning commercially-exploited aquatic species. FAO, Rome, Italy. Pp133. Available at: http://www.fao.org/docrep/010/a1143e/a1143e00.htm.
Iwasaki, N. (d.) (2008). A Biohistory of Precious Corals: Scientific Cultural and Historical Perspectives. Tokai University Press, Kanagawa, TokyoTorntore, S.J. (2002). PhD dissertation, Italian Coral Beads: Characterizing their Value and Role in Global Trade and Cross-Cultural Exchange. PhD dissertation, St. Paul: University of Minesota
TRAFFIC-IUCN. (2010). IUCN/TRAFFIC Analyses of the Proposals to Amend the CITES Appendices at the 15th Meeting of the Conference of the Parties. 267pp. http://www.traffic.org/cop15. Viewed on 15 January 2010.
Tsounis, G. (2009). Jewel of the Deep: Are the modern incarnations of age-old traditions -coral diving and craftsmanship- selling Mediterranean red coral out?. Natural History. 118 (3):30-35.
UNEP-WCMC. (2009). CITES Trade database. http://www.unep-wcmc.org/citestrade/trade.cfm. Accessed 15 December.Wu, J. and Takahashi, S. (2009). The Fishery and Trade of Corallium of East Asia. In: Bruckner, A.W. and G.G. Roberts (Ed.), Proceedings of the First International Workshop on Corallium Science, Management, and Trade. NOAA, Technical Memorandum NMFS-OPR-43 and CRCP-8, Silver Spring, MD, USA. Pp.54-61.
Taiwan Customs Statistics. Available at: http://tcs.taiwantrade.com.tw/stap/main.asp?lang=1. Accessed on 15 December 2009.Ministry of Finance (2009), Japan Trade Statistics(2002-2008). Available at: http://www.customs.go.jp/toukei/info/index.htm. Accessed on 15 December 2009.

36 Atlantic Bluefin Tuna and CITES
©Frédéric BASSEMAYOUSSE / WWF Mediterranean ©K. Kanari / TRAFFIC
At the 15th meeting of
the Conference of Parties
to the Convention on
International Trade in
Endangered Species of
Wild Fauna and Flora
(CITES CoP15) held in
Doha, Qatar, in March
2010, the Principality of Monaco submitted a
proposal to list Atlantic Bluefin Tuna Thunnus thyn-
nus in CITES Appendix I, which would have meant a
ban on international commercial trading of the
species. Some Parties, such as the 27 Member States
of the European Union (EU) [which include some
Parties to the International Commission for the Con-
servation of Atlantic Tunas (ICCAT), which is respon-
sible for managing Atlantic Bluefin Tuna stocks] and
the USA, stated their support of the proposal, but
several other CITES Parties involved in the T. thynnus
fishery, such as Japan and Libya, opposed the
proposal, arguing that fisheries resources should be
administered within the specialized framework of a
Regional Fishery Management Organization (RFMO),
rather than by CITES. A majority on the FAO Expert
Advisory Panel for Assessment of Listing Proposals
to CITES for Commercially-Exploited Aquatic Spe-
cies concluded that T. thynnus satisfied the CITES
biological criteria for a CITES Appendix I-listing.
However, the result of the vote at CITES CoP15 on
the listing proposal was for it to be rejected. Despite
this result, it is important to review once again the
background behind the problem that led to this debate
on Atlantic Bluefin Tuna at the CITES conference.
A 2009 survey of Japanese households revealed
that in monthly purchases of fresh fish, spending on
tuna averaged JPY4631, making it the leading fish
purchased, followed by salmon and shrimp (Ministry
of Internal Affairs and Communications figures,
2010). It is clear how popular tuna is for the Japanese
diet. However, a number of fish species are managed
by RFMOs. Among these are the bluefin tunas:
Pacific Bluefin Tuna Thunnus orientalis and Atlantic
Bluefin Tuna T. thynnus, Southern Bluefin Tuna T.
maccoyii and the Bigeye Tuna T. obesus, all of which
have high percentages of fatty meat, preferred for raw
consumption as sashimi (toro). Also managed by
RFMOs are the Yellowfin Tuna T. albacares and Alba-
core T. alalunga that are used for red-meat sashimi
and as the material for canned tuna fish (Nakano,
2010). The total supply of Japanese fishery catch and
imports of tunas (except Skipjack) to the Japanese
market for 2008 was 410 000 t, which represents
approximately 24% of the 2007 world catch of tunas
except Skipjack (Ministry of Agriculture, Forestry
and Fisheries, 2010; FAO, 2010). Atlantic Bluefin
Tuna represents only about 3.5% of the total world
tuna catch, not including Skipjack (FAO 2010b, FAO
2010c). That leads to the question of why it was
Atlantic Bluefin Tuna and CITES
Soyo Takahashi, Fisheries Officer

鮪
37Atlantic Bluefin Tuna and CITES
Volume of imports of ranched AtlanticBluefin Tuna to Japan (1998-2008)1Figure
Source: Japan Fisheries Agency figures, 2010 (compiled by TRAFFIC)
(1000t)
5
10
15
20
25
1998 1999 2000 2001 2002 2003 2004 2005 2006 2007 2008
2008 represent approximately 38.8% of the total
supply of Atlantic Bluefin Tuna to the Japanese
market from Japanese catch and imports combined
(Japan Fisheries Agency, 2010).
The development of this Atlantic Bluefin Tuna
ranching industry and increase of ranched production
have damaged the wild Atlantic Bluefin Tuna popula-
tion. Farmed Atlantic Bluefin Tuna has relied on
offtake from spawning populations, and when the
juvenile tuna to be raised are caught by the purse
seine fishery, almost the whole population is caught
just as they gather to spawn. According to ICCAT
statistics, there has been a sharp increase in the purse
seine catch since the mid-1990s, and it can be
assumed that one of the reasons for this increase is the
rise in demand for juvenile bluefin tuna to supply the
rapidly developing Atlantic Bluefin Tuna ranching
industry. In 2009, the Standing Committee of
Research and Statistics (SCRS) of ICCAT considered
that there was a greater than 90% probability that
both East and West stocks had declined to less than
15% of their unexploited population sizes. Further-
more, over the past 10 years it was reported that there
have been catch levels 60% over the Total Allowable
Catch (TAC) by ICCAT members (ICCAT, 2009). The
existence of overfishing and IUU (Illegal, Unreported
and Unregulated,) fishing is having a serious effect on
Atlantic Bluefin Tuna population size and is prevent-
ing its recovery. As a result, the ineffectiveness of the
ICCAT fishery management capability came into
focus at CITES CoP15 and the proposal was made to
institute a ban on commercial international trade of
Atlantic Bluefin Tuna.
As a measure to combat IUU fishing, ICCAT intro-
duced a Catch Documentation Scheme (CDS) for
Atlantic Bluefin Tuna in June of 2008, requiring the
export country to issue letters of certification identify-
ing the boat of catch and production and the circum-
stances of trade transactions for all exports. However,
due to the fact that the purse seine fishery operators
often put the catches directly into store with no verifi-
singled out for international conference debate and
attracted so much attention.
A few decades ago, bluefin tuna was an expensive
delicacy that few Japanese could afford. However,
since the late 1990s, the ranching of Atlantic Bluefin
tuna has grown rapidly in the coastal regions of the
Mediterranean Sea in particular, leading to the impor-
tation into Japan of relatively inexpensive bluefin
tuna that could be sold at affordable prices in super-
markets and popular “conveyor” sushi restaurants
throughout.
The Atlantic Bluefin Tuna ranching industry is an
aquaculture method that involves catching popula-
tions of juvenile fish in the purse seine fishery and
feeding them high-nutrient feed in holding pens for
several months or years. This process, also known as
ranching, produces tuna with a large portion of “toro”
meat with a high fat content that Japanese prefer in
sushi. For this reason, some Japanese tunatrading com-
panies have invested actively in the development of
this industry in the Mediterranean coastal countries
(Ono, 2008).
Figure 1 shows the volumes of this ranched Atlan-
tic Bluefin Tuna imported to Japan. From the figure it
can be seen that there has been a general increase in
the volumes of this ranched Atlantic Bluefin Tuna
imported to Japan. Particularly notable is the roughly
four-fold increase in these imports from 5700 t in
1998 to 22 600 t in 2006. The 16 700 t imported in

38 Atlantic Bluefin Tuna and CITES
cation of numbers of catch, it is difficult to evaluate
the size of catches and the numbers of fish going into
the holding pen. Evaluating the state of compliance
with regulations is difficult therefore and, as a result,
implementing this management measure is incom-
plete. At the end of February 2010, just prior to the
holding of CITES CoP15, the Japanese government
announced that it had halted the import of 2300 t of
ranched Atlantic Bluefin Tuna between November
2009 and February 2010 due to reasons such as the
failure of traders to produce proper catch documenta-
tion, including certification dates of the catches
involved. If tuna enters the domestic market without
the CDS being properly enforced, consumers cannot
verify if the tuna is of IUU fishing origin, because as
of 2010, there is no traceability system for Atlantic
Bluefin Tuna from point of production to the final
point of retail.
Japan’ s Act on Standardization and Proper Label-
ling of Agricultural and Forest Products (JAS law)
sets quality labelling standards and requires that
producers and retailers of fish and other seafood prod-
ucts display the name of the product, where it was
produced and whether it was wild-caught or a product
of aquaculture. However, from this labelling alone, it
is not possible to tell the countries of the fishing boats
that caught the juvenile bluefin tuna harvested for
ranching by the Atlantic Bluefin Tuna ranching indus-
try at the initial stage of production.
As one of the major tuna importers and consumer
countries in the world, Japan should improve effec-
tiveness of import procedures based on CDS and send
a clear message not to allow any imports of IUU fish-
ing product.
Until now, TRAFFIC has recommended to
ICCAT and other RFMOs involved in the regula-
tion of tuna fisheries to set a TAC and implement
resource recovery plans based on scientific advice;
to introduce an international registration system
for fishing boats; to reduce fishing effort; and to
improve data-gathering systems through means
such as rapid reports of catch by fishery operators.
The 17th Special Meeting of ICCAT will be held in
Paris in November 2010. Can ICCAT restore its
fishery management measures as Japan and the
other fishing countries promised the international
community it would at CITES CoP15? TRAFFIC
will continue to monitor Atlantic Bluefin Tuna con-
servation and the implementation of fishery man-
agement measures and hopes that it will not see
the same lack of progress by ICCAT as there has
been since the last attempt was made to list Atlan-
tic Bluefin Tuna at CITES CoP8 in 1992, held in
Kyoto. The proposal was withdrawn amid commit-
ments to ensure better management by ICCAT
members, but they failed to translate into the same.
REFERENCESFAO. (2010a). The Fisheries Commodities production and trade 2007. http://www.fao.org/fishery/statistics/software/fishstat/en. Accessed on 28 July.FAO. (2010b). FAO Fishstat The Fisheries Capture production and trade 2007. http://www.fao.org/fishery/statistics/software/fishstat/en. Accessed on 28 July.
FAO(2010c). The Fisheries Aquaculture production 2007. http://www.fao.org/fishery/statistics/software/fishstat/en. Accessed on 28 July.ICCAT SCRS. (2009). Extension of the 2009 SCRS Meeting to Consider the Status of Atlantic Bluefin Tuna Populations with Respect to CITES Biological Listing Criteria. Meeting report, Madrid, Spain, October21-23, 2009.
Japan Fisheries Agency. (2010). Table 5-3 Japan’s import of farmed Tuna (1998-2007) http://www.jfa.maff.go.jp/j/tuna/pdf/km2010.pdf. Viewed on 28 July 2010.
Ministry of Internal Affairs and Communications. (2010).「1世帯当たり品目別支出金額 総世帯 - 総世帯・勤労者世帯」. In:「家計調査」[The expenditure by items per household, Total of household & Workers’ household. In: Survey of family finances]. (In Japanese) http://www.e-stat.go.jp/SG1/estat/List.do?lid=000001061916. Viewed on 28 July 2010.
Ministry of Agriculture, Forestry and Fisheries. (2010). [Japan Statistics of fishery and aquaculture productions in 2009]. (In Japanese). http://www.maff.go.jp/j/tokei/kouhyou/kaimen_gyosei/index.html#y. Accessed 28 July.
Nakano, H. and Oka, M. (2010). [The book for read a riddle of the tuna’s mystery]. (In Japanese) Tsukiji-Shokan, Tokyo, Japan. 280 pp..
Ono, S. (2008). [Business for Tuna Farming of the economic analysis: The Approach with Food & Business theories]. (In Japanese). Seizando-Shoten, Tokyo, Japan. Pp.246.
平成21年度漁業・養殖生産統計
マグロのふしぎがわかる本
養殖マグロビジネスの経済分析-フードシステム論によるアプローチ
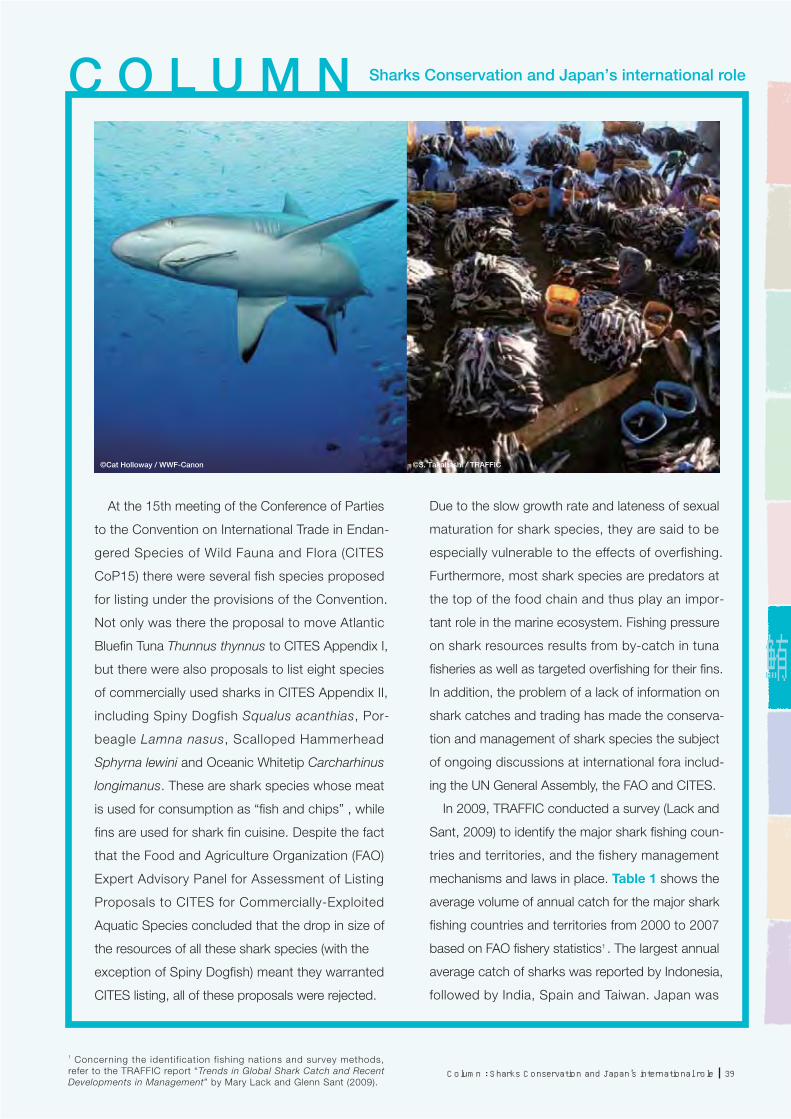
Sharks Conservation and Japan’s international roleC O L U M N
鮪
39Column : Sharks Conservation and Japan’s international role
©Cat Holloway / WWF-Canon ©S. Takahashi / TRAFFIC
Due to the slow growth rate and lateness of sexual
maturation for shark species, they are said to be
especially vulnerable to the effects of overfishing.
Furthermore, most shark species are predators at
the top of the food chain and thus play an impor-
tant role in the marine ecosystem. Fishing pressure
on shark resources results from by-catch in tuna
fisheries as well as targeted overfishing for their fins.
In addition, the problem of a lack of information on
shark catches and trading has made the conserva-
tion and management of shark species the subject
of ongoing discussions at international fora includ-
ing the UN General Assembly, the FAO and CITES.
In 2009, TRAFFIC conducted a survey (Lack and
Sant, 2009) to identify the major shark fishing coun-
tries and territories, and the fishery management
mechanisms and laws in place. Table 1 shows the
average volume of annual catch for the major shark
fishing countries and territories from 2000 to 2007
based on FAO fishery statistics1 . The largest annual
average catch of sharks was reported by Indonesia,
followed by India, Spain and Taiwan. Japan was
At the 15th meeting of the Conference of Parties
to the Convention on International Trade in Endan-
gered Species of Wild Fauna and Flora (CITES
CoP15) there were several fish species proposed
for listing under the provisions of the Convention.
Not only was there the proposal to move Atlantic
Bluefin Tuna Thunnus thynnus to CITES Appendix I,
but there were also proposals to list eight species
of commercially used sharks in CITES Appendix II,
including Spiny Dogfish Squalus acanthias, Por-
beagle Lamna nasus, Scalloped Hammerhead
Sphyrna lewini and Oceanic Whitetip Carcharhinus
longimanus. These are shark species whose meat
is used for consumption as “fish and chips” , while
fins are used for shark fin cuisine. Despite the fact
that the Food and Agriculture Organization (FAO)
Expert Advisory Panel for Assessment of Listing
Proposals to CITES for Commercially-Exploited
Aquatic Species concluded that the drop in size of
the resources of all these shark species (with the
exception of Spiny Dogfish) meant they warranted
CITES listing, all of these proposals were rejected.
1 Concerning the identif ication f ishing nations and survey methods, refer to the TRAFFIC report “Trends in Global Shark Catch and Recent Developments in Management” by Mary Lack and Glenn Sant (2009).

C O L U M N
40 Column : Sharks Conservation and Japan’s international role
Major shark fishing countries and territories andaverage annual catch volumes 2000–2007 (t)1
Source: Compiled by TRAFFIC using FAO Fishstat Capture Production Datebase 2000-2007. ( Lack and Sant, 2009)
Ta b l e
rank contry / territory average catch volume
1 Indonesia 110 528
2 India 70 758
3 Spain 57 685
4 Taiwan 48 493
5 Mexico 34 535
6 Pakistan 34 270
7 Argentine 33 639
8 USA 29 909
9 Japan 25 930
rank contry / territory average catch volume
10 Malaysia 24 500
11 Thailand 24 156
12 France 22 328
13 Sri Lanka 22 029
14 Brazil 20 498
15 New Zealand 18 260
16 Portugal 15 137
17 UK 14 301
found to be the ninthlargest shark-fishing country.
The FAO statistics record catches with regard to
100 shark species and 30 generic groups. This
survey revealed that Japan and the other main
shark-fishing countries and territories report their
catches in terms of the generic groups. Lack and
Sant (2009) also found that they do not report
catches by species and that they only include
retained sharks in their catch records and do not
count those that are dumped back into the sea. In
order to determine the effect of fishing on shark
populations, it is important that these record-
keeping practices be improved.
Japan has a long history of using sharks as a
biological resource. In the late 17th century, dried
shark’ s fin was one of the three prize export prod-
ucts for trade with China along with dried sea
cucumber and dried abalone. In the Meiji Period
(1867-1912) the shark fishery was designated a
valuable industry for strengthening the national
economy and the sharks were used for their meat
and cartilage, liver oil and fins (TRAFFIC East Asia-
Japan, 1998). Although sharks have long been an
important resource for the Japanese, today there
are statistics only for shark fin, due to its high prod-
uct value, and otherwise there are no import
records kept. As a result, it is not possible to rank
Japan accurately among the countries of the world
in terms of volumes of imports or national con-
sumption of shark products. Table 2 shows export
volumes for dried shark fin. Japan’s largest export
volumes during the period from 2000 to 2009 were
to Hong Kong, accounting for 82% of the total.
Hong Kong is followed by Singapore, China, South
Africa, Indonesia and Viet Nam as the most signifi-
cant export destinations for shark fin exports from
Japan. Exports to South Africa grew four-fold in
2009. Also, although the volumes are not large,
Spain, Taiwan and Guam (USA) can be considered
important export destinations, and Japanese
exports of dried shark fin are destined not only for
Asia, but also for markets around the world.
Since the mid-1990s, TRAFFIC has encouraged
the FAO, CITES and RFMOs to adopt manage-

鮪
41Column : Sharks Conservation and Japan’s international role
Japan’s export volumes for dried shark fin (2000-2009)2
Source: Customs data from Ministry of Finance Japan, 2010
Ta b l e
Hong KongSingaporeChinaSouth AfricaIndonesiaViet NamCanary Islands (West) SpainMalaysiaUruguayTaiwanGuam (USA) Northern Mariana Islands (USA) Republic of CongoAustraliaCanadaThailandNorth KoreaTotal
203 11322 40114 808
500
260215
400175
241 872
188 40813 46325 389
2897
172
120
230 449
146 01029 17231 491
411
13529740
5020
207 626
158 85118 54441 421
78812125
219 741
173 52918 18011 558
290
570
186184177
204 674
144 418256212 906
5445
1309800
15012681
167 797
161 99013 146600214
1776
2376
25016141
180 554
175 13519 369270
1638
188
196 600
134 56513 0973800431323493141984407
162
162 818
112 00916 307
18 0348096194141191500
1840
92
163 938
1 598 028166 241142 24322 56116 18084966823565333971840176916094644001751205020
1 976 069
country / territoryyear
2000 2001 2002 2003 2004 2005 2006 2007 2008 2009subtotal
(Unit: kg.)
(2000-2009)
ment mechanisms including requirements that
shark catches be landed as whole individuals with
fins intact to enable identification of species, and
management mechanisms to enable international
trade monitoring as a means to provide the neces-
sary information to reduce IUU (Illegal, Unreported
and Unregulated) fishing and evaluate resource
status. At the joint tuna RFMOs workshop on
improvement, harmonization and compatibility of
monitoring, control and surveillance measures held
in Barcelona (Spain) in June 2010, three months
after CITES CoP15, the Japanese government
made a proposal that a Catch Documentation
Scheme (CDS) be put in place not only for tuna
species but also for shark species, in order to
prevent catches that did not comply with tuna
RFMO conservation management regulations from
entering the legal market. This and other proposals
will be debated at RFMO meetings scheduled to
be held later in 2010 and beyond. Japan and the
other RFMO signatory nations must recognize that
shark resource management and conservation are
not only problems of sovereign fishing fleets but
also an issue of marine ecology that must be dealt
with urgently. A holistic approach, including sys-
tems to ensure traceability from catch to distribu-
tion and all the way to retail and end-consumers, is
needed so that IUU shark products can be elimi-
nated from the marketplace.
REFERENCESFAO. (2009). FAO Fishstat Capture Production Datebase 2000-2007. http://www.fao.org/fishery/statistics/global-capture-production/en. Accessed on 5 August 2010.
Lack, M. and Sant, G. (2009). Trends in Global Shark Catch and Recent Developments in Management. 29pp.Ministry of Finance Japan. (2010). Trade statistics of Japan Database 2000-2009. Available at: http://www.customs.go.jp/toukei/srch/index.htm. Accessed on 5 August 2010.
TRAFFIC East Asia-Japan. (1997). Shark catch and Trade. In: TRAFFIC JAPAN NEWSLETTER Vol.12 No.2/3: 2-13.

42 Sturgeon Conservation and the Role of Japan
©TRAFFIC©Thomas Neumann / WWF-Canon
Introduction
Since 1998 , all species
of sturgeon Acipenseri-
formes spp. are listed
either in CITES Appen-
dix I or Appendix II and
their international trade is
regulated. The order
including sturgeons is a group of some of the largest
freshwater fishes and also some of the oldest, said to
date back to the Jurassic period. There are 25 species
of sturgeon and two paddlefish species. The habitats
for sturgeon species range through the cold-water
areas of the Northern Hemisphere in North America,
Europe and Asia. Salted sturgeon roe, known as
caviar, is famous as one of the three great delicacies of
the world along with truffles and foie gras. Sturgeon
stocks have decreased rapidly in the 20th century due
to factors including overfishing and poaching for the
high-valued caviar, and the decreasing habitat and
spawning grounds as a result of dam construction and
water pollution (CITES, 1997).
When CITES took effect in 1975, two species,
including Shortnose Sturgeon Acipenser brevirostrum,
were listed in Appendix I and after several amend-
ments of the listing, all sturgeon species were CITES-
listed by the time of the 10th meeting of the Confer-
ence of the Parties (CoP10) in 1997. From the time
the CoP10 amendments came into effect, in April
1998, CITES permits issued by the governments of the
export countries were necessary for all international
trade of the 25 sturgeon species listed in CITES Appen-
dix II.
Sturgeon catch production and aquaculture
production
Figure 1 shows the Food and Agriculture Organiza-
tion (FAO) figures for catches from wild sturgeon fish-
eries and for aquaculture production, based on reports
from the countries. The total capture production of 18
192 t in 1990 had decreased to just 835 t 17 years later,
in 2007, a mere 4.5% of the 1990 level. In contrast,
aquaculture production has increased rapidly since
2003. From a level of 323 t in 1990, aquaculture
production grew approximately ten-fold to 3158 t in
the 10-year period to 2000, at which point it surpassed
the fishery catch from the wild for the first time. By
2007, aquaculture1 production was reported at 25 705 t,
representing approximately 79 times the level of 1990.
Rises and falls in catch production are not necessar-
ily a reflection of changes in the amount of the fishery
resource, however. This is because it is difficult to
determine whether catch production decreases are due
to decreases in the wild population or, for example, a
result of decreased fishing quotas due to strengthened
regulation of sturgeon fisheries in range States. Fur-
ther, with regard to aquaculture production, not all
countries report their production, so reported figures
Sturgeon Conservation and the Role of Japan
Soyo Takahashi, Fisheries Officer
1 There are two types of sturgeon aquaculture: ranching, inwhich fry are born and caught in the wild, and closed-cycle aquaculture, in which fry are born from adult fish ranched in the farm.

卵
43Sturgeon Conservation and the Role of Japan
World’s capture production and aquaculture production of sturgeon (1990-2007)1Figure
Source: FAO Fishstat capture production 1990-2007, FAO Fishstat aquaculture production 1990-2007. (Accessed on 29 June 2010.)
Reported annual global caviar imports, wild vs. aquaculture, 1998-20062Figure
Source: Compiled by TRAFFIC using UNEP-WCMC CITES Trade Database figures (TRAFFIC Europe, 2008)
Global share of caviar imports,1998-20063Figure
Source: Compiled by TRAFFIC using UNEP-WCMC CITES Trade Datebase (1998-2006) (TRAFFIC Europe, 2008)
48%619t
22%291t
11%149t
10%131t
9%123t
EU
USA
Switzerland
JapanOthers
30 000
25 000
20 000
15 000
10 000
5000
0
(t)
1990 1992 1994 1996 1998 2000 2002 2004 2006
aquaculture
capture
300
250
200
150
100
50
0
(t)
AQUACULTURE
WILD
1998
0
202
2000
1
217
2004
8
89
2005
26
71
2006
20
24
1999
1
262
2001
1
178
2003
4
95
2002
2
112
century in exporting countries. In 2006, imports of
caviar from aquaculture reached 20 t, while caviar
imports from capture production stood at a nearly
equivalent 24 t.
Figure 3 shows the global shares of world caviar
imports by country from 1998 to 2006. The European
cannot be considered an accurate reflection of the
actual world production (FAO, 2010). In Japan, stur-
geon ranching (aquaculture) has been conducted since
the late-1980s, but Japan’ s production is not counted
in the FAO statistics for aquaculture production.
Japan and International Trade in Sturgeon
Figure 2 shows world import volumes for caviar,
based on trade data reported by CITES Parties, since
all species of Acipenseriformes became CITES-listed
in 1998. Compared to the 263 t of world import
volumes of caviar in 1999, imports had dropped to a
level equivalent to about 16.7% of that amount by
2006. It is noteworthy that import volumes of caviar
from aquaculture production have been on the increase
since 2002. A major factor in this increase in caviar
from aquaculture is the previously mentioned increase
in sturgeon aquaculture production during the 21st
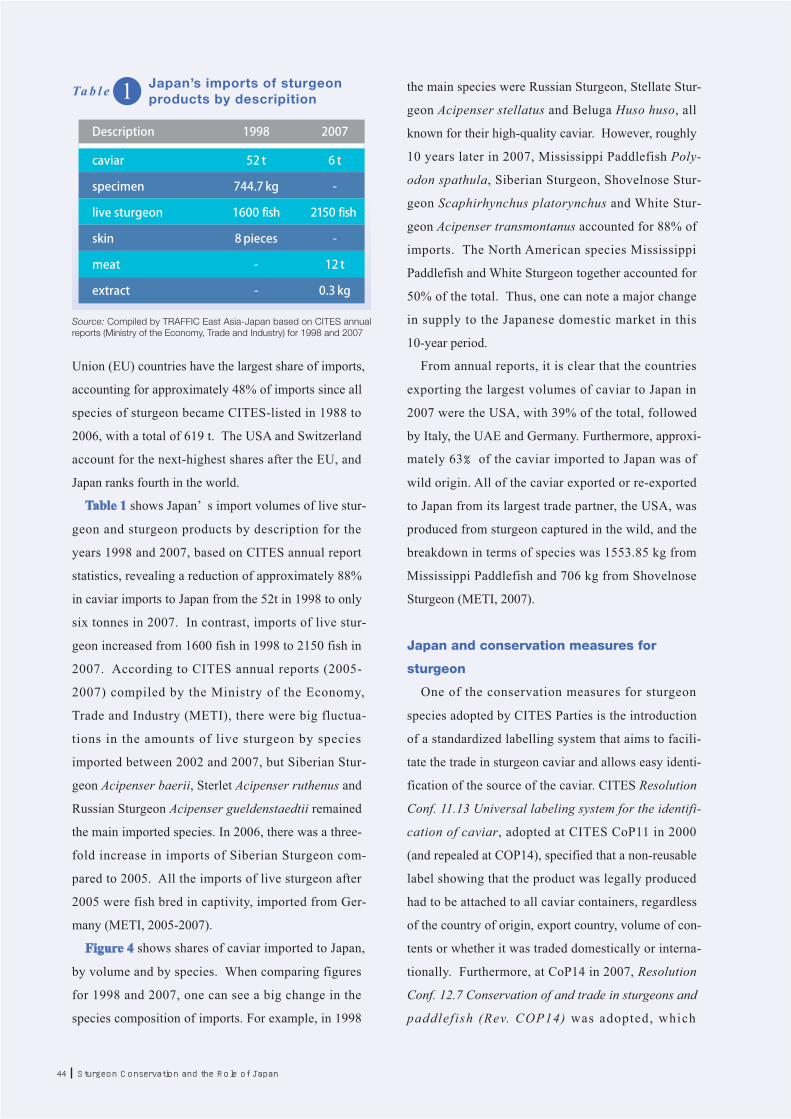
44 Sturgeon Conservation and the Role of Japan
Japan’s imports of sturgeonproducts by descripition1Ta b l e
Source: Compiled by TRAFFIC East Asia-Japan based on CITES annual reports (Ministry of the Economy, Trade and Industry) for 1998 and 2007
Union (EU) countries have the largest share of imports,
accounting for approximately 48% of imports since all
species of sturgeon became CITES-listed in 1988 to
2006, with a total of 619 t. The USA and Switzerland
account for the next-highest shares after the EU, and
Japan ranks fourth in the world.
Table 1 shows Japan’ s import volumes of live stur-
geon and sturgeon products by description for the
years 1998 and 2007, based on CITES annual report
statistics, revealing a reduction of approximately 88%
in caviar imports to Japan from the 52t in 1998 to only
six tonnes in 2007. In contrast, imports of live stur-
geon increased from 1600 fish in 1998 to 2150 fish in
2007. According to CITES annual reports (2005-
2007) compiled by the Ministry of the Economy,
Trade and Industry (METI), there were big fluctua-
tions in the amounts of live sturgeon by species
imported between 2002 and 2007, but Siberian Stur-
geon Acipenser baerii, Sterlet Acipenser ruthenus and
Russian Sturgeon Acipenser gueldenstaedtii remained
the main imported species. In 2006, there was a three-
fold increase in imports of Siberian Sturgeon com-
pared to 2005. All the imports of live sturgeon after
2005 were fish bred in captivity, imported from Ger-
many (METI, 2005-2007).
Figure 4 shows shares of caviar imported to Japan,
by volume and by species. When comparing figures
for 1998 and 2007, one can see a big change in the
species composition of imports. For example, in 1998
the main species were Russian Sturgeon, Stellate Stur-
geon Acipenser stellatus and Beluga Huso huso, all
known for their high-quality caviar. However, roughly
10 years later in 2007, Mississippi Paddlefish Poly-
odon spathula, Siberian Sturgeon, Shovelnose Stur-
geon Scaphirhynchus platorynchus and White Stur-
geon Acipenser transmontanus accounted for 88% of
imports. The North American species Mississippi
Paddlefish and White Sturgeon together accounted for
50% of the total. Thus, one can note a major change
in supply to the Japanese domestic market in this
10-year period.
From annual reports, it is clear that the countries
exporting the largest volumes of caviar to Japan in
2007 were the USA, with 39% of the total, followed
by Italy, the UAE and Germany. Furthermore, approxi-
mately 63% of the caviar imported to Japan was of
wild origin. All of the caviar exported or re-exported
to Japan from its largest trade partner, the USA, was
produced from sturgeon captured in the wild, and the
breakdown in terms of species was 1553.85 kg from
Mississippi Paddlefish and 706 kg from Shovelnose
Sturgeon (METI, 2007).
Japan and conservation measures for
sturgeon
One of the conservation measures for sturgeon
species adopted by CITES Parties is the introduction
of a standardized labelling system that aims to facili-
tate the trade in sturgeon caviar and allows easy identi-
fication of the source of the caviar. CITES Resolution
Conf. 11.13 Universal labeling system for the identifi-
cation of caviar, adopted at CITES CoP11 in 2000
(and repealed at COP14), specified that a non-reusable
label showing that the product was legally produced
had to be attached to all caviar containers, regardless
of the country of origin, export country, volume of con-
tents or whether it was traded domestically or interna-
tionally. Furthermore, at CoP14 in 2007, Resolution
Conf. 12.7 Conservation of and trade in sturgeons and
paddlefish (Rev. COP14) was adopted, which

卵
45Sturgeon Conservation and the Role of Japan
Shares of caviar import volume to Japan by species for 1998, 20074Figure
Source : CITES annual reports (METI) for 1998, 2007
43% 41%
24%
12%
11%
26%
22%
9% 5%
3%
52t 6 t
2% 2%
20071998
RussianSturgeon43%
MississippiPaddlefish
SiberianSturgeon
ShovelnoseSturgeon
WhiteSturgeon
StellateSturgeon
Beluga
Other PersianSturgeon
KalugaSturgeon
AmurSturgeon Other
approx. approx.
expanded requirements for labelling among Parties
and added amendments requiring that information
about species name, codes identifying species hybrid,
country of origin and year of harvest, and an official
registered code of the processing factory, be posted on
all caviar containers, regardless of whether they were
for import, export/re-export or domestic market trade.
This Resolution also specified that all Parties
involved in import, export or re-export had to revise
their domestic laws to create a registration system for
caviar-processing factories, including aquaculture
operations and re-packaging operations, and required
that this information be reported to the CITES Secre-
tariat.
This labelling system assists enforcement officers in
controlling trade in caviar and also enables consumers
to determine if a product is legally produced and
traded, and to make informed choices about the caviar
to purchase. However, as of 2010, Japan has not intro-
duced the registration system for aquaculture facilities
and processing factories, nor the universal labelling
system specified in CITES Resolution Conf. 12.7. As a
result, it is rare to see caviar products bearing the
CITES label on the domestic Japanese market, irre-
spective of whether the product has been imported or
domestically produced.
According to an interview with Japan’s Fisheries
Agency conducted by TRAFFIC, there is no system
that requires sturgeon aquaculture operations in Japan
to be registered or to report on their production. For
this reason, there are no official statistics on sturgeon
aquaculture operations and caviar production in Japan,
which makes it difficult to reveal the overall picture of
domestic sturgeon aquaculture operations. According
to interviews with sturgeon aquaculture operators con-
ducted by TRAFFIC, as of 2010 there are at least three
operations in Japan producing sturgeon fry for aquacul-
ture and there are at least seven aquaculture operators
raising sturgeon for caviar commercially. Of these,
some use domestically produced fry and some use fry
from imported live sturgeon. The aquaculture opera-
tors interviewed said that stable production of stur-
geon raised in captivity domestically achieved in the
last few years has allowed plans to increase the
number of roe-bearing sturgeon in the next five years
to a level where export to foreign markets may be
viable. However, according to a telephone interview
conducted by TRAFFIC with METI in June 2010,
because Japan has not so far complied with the require-
ments of CITES Resolution Conf. 12.7, the govern-
ment will not be able to issue CITES export permits
for Appendix II-listed species of sturgeon reared in
captivity in Japan. In short, under the present system,
caviar produced and processed in Japan cannot be
exported abroad.
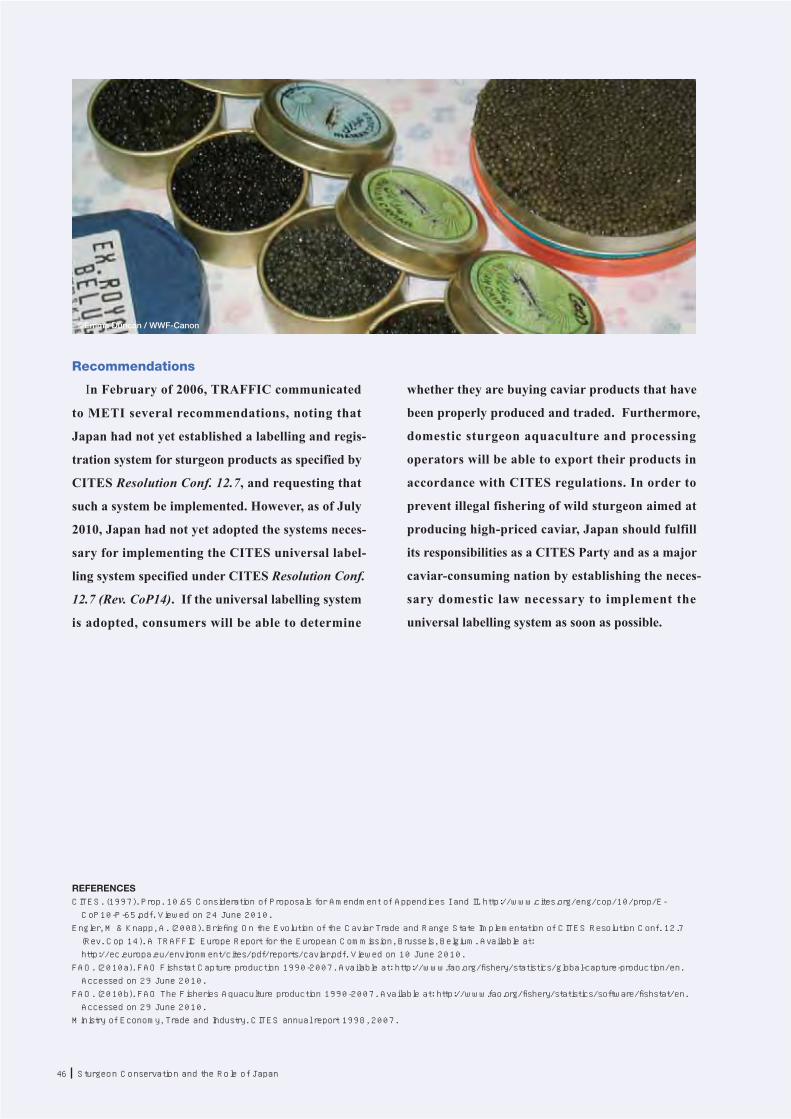
46 Sturgeon Conservation and the Role of Japan
©Emma Duncan / WWF-Canon
whether they are buying caviar products that have
been properly produced and traded. Furthermore,
domestic sturgeon aquaculture and processing
operators will be able to export their products in
accordance with CITES regulations. In order to
prevent illegal fishering of wild sturgeon aimed at
producing high-priced caviar, Japan should fulfill
its responsibilities as a CITES Party and as a major
caviar-consuming nation by establishing the neces-
sary domestic law necessary to implement the
universal labelling system as soon as possible.
Recommendations
In February of 2006, TRAFFIC communicated
to METI several recommendations, noting that
Japan had not yet established a labelling and regis-
tration system for sturgeon products as specified by
CITES Resolution Conf. 12.7, and requesting that
such a system be implemented. However, as of July
2010, Japan had not yet adopted the systems neces-
sary for implementing the CITES universal label-
ling system specified under CITES Resolution Conf.
12.7 (Rev. CoP14). If the universal labelling system
is adopted, consumers will be able to determine
REFERENCESCITES. (1997). Prop. 10.65 Consideration of Proposals for Amendment of Appendices I and II. http://www.cites.org/eng/cop/10/prop/E-CoP10-P-65.pdf. Viewed on 24 June 2010.
Engler, M & Knapp, A. (2008). Briefing On the Evolution of the Caviar Trade and Range State Implementation of CITES Resolution Conf. 12.7 (Rev. Cop 14). A TRAFFIC Europe Report for the European Commission, Brussels, Belgium. Available at: http://ec.europa.eu/environment/cites/pdf/reports/caviar.pdf. Viewed on 10 June 2010.
FAO. (2010a). FAO Fishstat Capture production 1990-2007. Available at: http://www.fao.org/fishery/statistics/global-capture-production/en. Accessed on 29 June 2010.
FAO. (2010b). FAO The Fisheries Aquaculture production 1990-2007. Available at: http://www.fao.org/fishery/statistics/software/fishstat/en. Accessed on 29 June 2010.
Ministry of Economy, Trade and Industry. CITES annual report 1998, 2007.
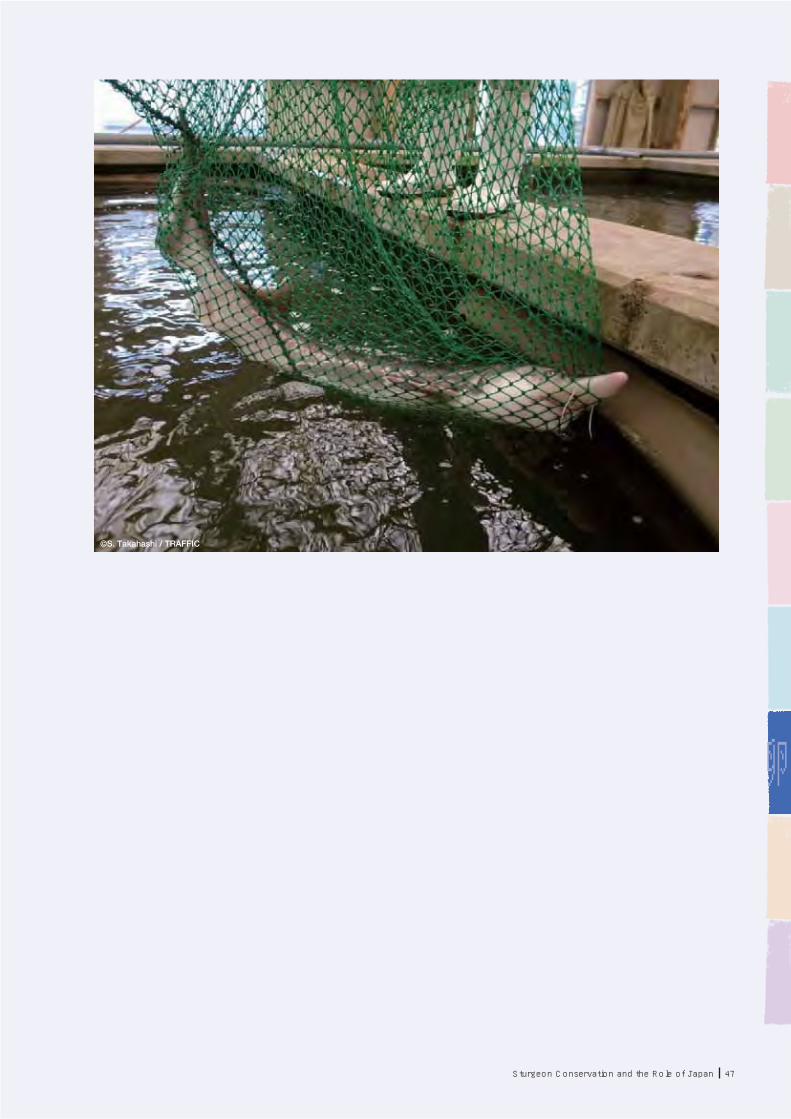
卵
47Sturgeon Conservation and the Role of Japan
©S. Takahashi / TRAFFIC

48 East Asia as a Key Determinant in the African Elephant’ s Future
©Martin Harvey / WWF-Canon
©Jo Benn / WWF-Canon ©TRAFFIC
For many Japanese,
ivory is still a familiar
presence in their lives in
t h e f o r m o f h a n k o
(personal name seals) or
o ther ar t s and craf ts .
Many people now under-
stand that ivory is no
longer a commodity that can be used without limitation,
even though controlled legal trade is permitted in Japan.
Twenty years have passed since the enactment of the
1989 ban on trade in African Elephants or their ivory
and other parts and derivatives. At the Seventh meeting
of the Conference of Parties to the Convention on Inter-
national Trade in Endangered Species of Wild Fauna
and Flora (CITES CoP7) in 1989, the African Elephant
Loxodonta africana was transferred to Appendix I of
CITES, joining the Asian Elephant Elephas maximus as
a species strictly protected from international commer-
cial trade.
Over the last two decades, Japan has been the only
country that has been approved by the CITES Parties to
import two legal shipments of ivory, totalling approxi-
mately 90 t.
How to deal with ivory trade and elephant conserva-
tion is a complex challenge. The two legal shipments
since 1989 have been conducted pursuant to specific
guidelines. Of primary conservation significance is the
specification that the financial proceeds of the strictly
controlled legal trade are used exclusively for elephant
conservation, and community conservation and develop-
ment programmes, within or adjacent to the elephant
range. The use of revenue from this controlled ivory
trade for the conservation of African Elephants sets out
a new paradigm to achieve effective and sustainable
coexistence between humans and African Elephants in
four important range countries in southern Africa.
African elephant numbers were roughly estimated to
be 1.34 million in 1979, but by 1989 the population
estimate had fallen to 620 000. Currently the best
estimate suggests between 470 000 and 690 000
elephants on the African continent (Blank, J.J. et al.,
2007).
As an ivory-consuming nation, Japan has a responsi-
bility to contribute to the conservation of elephants.
And, because responsible consumption on the part of
consumers is a key element to the success ivory trade
control systems in Japan, the Japanese public also plays
a direct role in the conservation of elephants.
Use of Ivory in Japan
In the Shoso-in imperial treasure repository, estab-
lished in the middle of Japan’ s Nara Period (715-806),
numerous items made of ivory are found, such as rulers,
knife scabbards, plectrums for musical instruments and
“Go” pieces, indicating that ivory was already a trea-
sured material in Japan over 1000 years ago. Today,
East Asia as a Key Determinant in
the African Elephant’s FutureAkiko Ishihara, Senior Representative

牙
49East Asia as a Key Determinant in the African Elephant’ s Future
Japan’s import of raw ivory1Figure
Japan’s Control System2Figure
1979 1980 1981 1982 1983 1984 1985 1986 1987 1988
(kg) 500 000450 000400 000350 000300 000250 000200 000150 000100 00050 000
0
(year)
mandatorywhole
Cut piece
Products-register dealers to METI
-record the ledger book
register to MOE
manegement document
attach certification seal
mandatory voluntary
voluntary
hanko accessory Japaneseinstrument
IVORY
tions of African Elephant were down-listed to CITES
Appendix II in 1997. Subsequently, Japan was allowed
to import CITES-sanctioned government-held ivory
stocks in 1999 after meeting strict qualifications regard-
ing domestic ivory market controls. About 50 t of ivory
(5,446 tusks) were imported in the first one-off sale
agreement with Botswana, Namibia and Zimbabwe,
fetching an export price of USD 4.18 million (approx.
JPY500 million).
In 2009, as the result of a second one-off sale agree-
ment approved by the Parties to CITES, Japan together
with China was allowed to import a combined total of
107.8 t of ivory from Botswana, Namibia, South Africa
and Zimbabwe. Approximately 40t (worth approx.
JPY600 million (USD 5.98 million )) of this total was
imported to Japan.
Trade Control System
Japan became a Party to CITES in 1981. Since then,
Japan has abided by CITES regulations governing inter-
national wildlife trade, even the decision to ban commer-
cial trade in all elephants species, including their parts
and derivatives, in 1989.
Domestic stockpiles, beginning with accumulated
pre-1989 stocks of ivory in Japan, have made it possible
for the domestic sale of ivory in Japan to continue. This
internal trade is regulated under the provisions of
Japan’ s Law for the Conservation of Endangered
Species of Wild Fauna and Flora (LCES). Domestic
trade in ivory that was legally imported in the two “one-
off sales” of 1999 and 2009 is also regulated under
LCES.
Status of the Ivory Stock
Under LCES, the Ministry of the Environment
(MOE) and the Ministry of the Economy, Trade and
Industry (METI) have compiled records concerning the
domestic volume of registered raw ivory tusks, and
scraps, cut pieces and numbers of ivory products held in
stock. It is also required that all dealers handling ivory
be registered.
ivory is most commonly used as personal name seals
known in Japan as hanko, for plectrums for Japanese
instruments like the shamisen, for artistic craft items
such as figurines known as netsuke and as fashion acces-
sories like broaches. Among these uses, the greatest
volume of ivory is believed to be for the production of
hanko name seals.
Ivory Imports to Japan
During Japan’ s Meiji Period (1868-1912), available
records show that about eight tonnes of ivory was
imported annually from Southeast Asia between the
years 1882 to 1888. Ivory imports to Japan soared from
the 1970s to the mid-1980s. The 285 t imported to
Japan in 1982 represented 61% of the entire world trade
in ivory at the time, and in 1985 increased to 474t
which clearly made Japan the world’ s largest importer
of ivory year-on-year. After that importation decreased
in accordance with the CITES regulations (Figure 1).
After protracted international debate, certain popula-

50 East Asia as a Key Determinant in the African Elephant’ s Future
According to the data compiled under the law, 13 800
whole tusks were registered between 1995 and 2008.
When the 7125 tusks that are recorded as having been
removed from the stock for processing are subtracted, a
net stock of 6,675 tusks was registered as of 2008.
In addition, the stock of all of ivory (scraps, cut
pieces) in the possession of manufacturers and wholesal-
ers of ivory products totalled 51.1 t at the end of March
2006 (MOE, in litt., August 2009; METI, in litt., Sep-
tember 2009). This represents a 48% reduction in the
stock compared to the 98 t registered in 1995 when
Japan’ s domestic control system was first implemented.
During the five-year period from 2002 to 2006, the
registered stock decreased at an annual rate of two
tonnes per year. The largest numbers of ivory products
in stock are accessories/jewellry such as beads and
earrings, followed by hanko seals.
Japan’ s recorded stock consists only of whole tusk
intended for transfer of location or ownership. For
example, if a person has an ivory tusk in their home
with no intention to move its physical location or
change ownership, that tusk does not require registra-
tion in the stock control system. If the intent to sell
arises on a later occasion, only then does it become
necessary to register the ivory in question. For that
reason new items can come into the registered stock
without being newly imported. Such cases result in a
continuing increase of registered ivory in Japan.
Status of Enforcement
In addition to ivory stock management and the regis-
tration for ivory dealers, the LCES also contains mecha-
nisms that seek to improve control by providing the
consumers with a means to choose certified products. A
government-issued certification seal can be attached to
individual products by retailers on a voluntary basis.
This is a system by which a manufacture can apply to
the government authority and receive certification seals
with a separate number for each product, allowing for
the traceability from individual raw ivory tusks to end
products. The underlying principle is to make this seal
a brand (i.e. environmental labelling) that consumers
can look for when purchasing a product and, thus create
an incentive for retail dealers to offer products with
such seals. The seals provide information that enables
tracing to the origin of the raw ivory from which the
product was made, guaranteeing its legality, and with
the intention of preventing illegal items from entering
the market. In a survey TRAFFIC conducted in 2008, it
was found that 52 of the 80 ivory-handling shops
surveyed (65%) sold products bearing these seals. This
represented an increase in seal-bearing products com-
pared to an earlier survey. A survey was also conducted
of ivory-selling e-commerce sites and Web auctions,
which revealed that 28 of the 70 sites (40%) handled
products with the seals. This was a lower rate than off-
line retail shops.
The seal system is meaningless, however, if the seals
are not applied properly to the registered products and
is thus a system based on trust in the manufacturers and
retailers. Therefore, it is important that the system oper-
ates to an optimum level of participation by the private
sector.
Japan’ s Ivory Trade Characteristics
The Elephant Trade Information System (ETIS) is a
system for monitoring the illegal trade of elephant prod-
ucts by investigating and analyzing trends in illegal
trade in ivory and elephant products. According to the
latest ETIS report released in October 2009, in general,
Japan is identified as a positive example of effective
ivory trade law enforcement in the ETIS analysis. How-
ever, Japan can still be classified as one of the countries
in which cases of illegal ivory trade continues to be an
issue.: The fact that Japan is home to one of the world’ s
major ivory processing industries and consuming mar-
kets means there continues to be a need for vigilance
against any illegal ivory trading.
Because it is one of the ivory importing nations
recognized by CITES, Japan’s market has a direct
responsibility for protection and conservation of
wild elephant populations. The domestic market is

牙
51East Asia as a Key Determinant in the African Elephant’ s Future
controlled to enable consumers to choose legal prod-
ucts bearing seals that are a form of environmental
labeling to ensure products are in compliance with
international regulations. Providing consumers with
the means to avoid purchasing products that may be
illegal, and to verify the legality of products they
wish to buy, is a key method for excluding illegal
activity that would have negative consequences for
the conservation of elephants in the wild.
TRAFFIC has had a long history of working in Japan
with the goal of eliminating illegal ivory trade and
providing recommendations to help improve the man-
agement of any permitted legal trade. For Japan’s ivory
trade management system to operate at an optimal level
of effectiveness, thorough implementation of regula-
tions governing ivory trader registration is needed. This
would ensure that consumers can see clearly whether a
trader is licensed or not. The process depends greatly on
METI to effectively communicate with all ivory traders
regarding their legal obligation to register with the
authorities. Active monitoring of points of sale, includ-
ing on-the-spot inspections, will also help to increase
compliance. The public listing of all registered ivory
traders would also help ensure good linkages between
METI and MOE, as responsible government agencies,
with the private sector. It would thus enable end-
consumers to confirm, via a quick internet check,
whether a trader is registered before making a purchase.
The current trust-based system in Japan means that
registered traders also have a responsibility to clearly
display their registration details at their place of busi-
ness (whether a ‘physical’ bricks-and-mortar shop or an
internet-based opertion) so that consumers can verify
that they are registered traders.
To improve the reliability of the certified seal
(sticker) system for ivory products in Japan, TRAFFIC
believes that improvements should be made in the seal
application method and the seal attachment method.
The certified seal application form should be improved
so that the precise raw material (individual tusk) can be
identified. As a result, the responsible government agen-
cies of METI and MOE need to conduct further
outreach activities aimed at retailers, and consider doing
so in collaboration with the manufacturers and wholesal-
ers. In addition, the role and importance of certified
seals for ivory products should also be explained clearly
to end-consumers as well. This is particularly important
to ensure, for example, that consumers understand that
when retailers sell so-called certified products, the
appropriate certified seal should be physically attached
to the product.
To ensure the overall ivory trade management system
is working effectively in Japan, the current status of the
volume of ivory stocks should be actively monitored. In
order to exert effective control over ivory in Japan, it it
important to expand the LCES registration requirement
to all members of the public who possess whole ivory
tusks, even in cases where they remain personal effects.
Also, if METI and MOE have up-to-date integrated
tracking of stock control (number of tusks, pieces) of
ivory held by each trader, the overall system will benefit.
As a result of these improvements, Japan’ s ability to
contribute to responsible international trade partner-
ships with ivory range countries would be enhanced by
having more robust and transparent market controls.
REFERENCEBlank, J.J., Barnes, R.F.W., Craig, G. C., Dublin, H.T., Thouless, C.R., Douglas-Hamilton, I. and Hart, J.A. (2007). African Elephant Status Report 2007: an update from the African Elephant Database. Occasional Paper Series of the IUCN Species Survival Commission, No. 33. IUCN/SSC African Elephant Specialist Group. IUCN, Gland, Switzerland. Vi + 276 pp.
CITES. (2007). CoP14 Doc.53.2 Monitoring of illegal trade in ivory and other elephant specimens. CITES. Available at: http://www.cites.org/eng/cop/14/doc/E14-53-2.pdf.
Ivory Trade Review Group. (1989). Ivory Trade and the Future of the African Elephant.TRAFFIC East Asia-Japan. (2008). Executive Summary of the Monitoring of illegal trade in ivory and other elephant specimens.(In Japanese) (translated version of CoP14 Doc.53.2 submitted by TRAFFIC to CoP.14). Available at: http://www.trafficj.org/publication/cites/cop14_doc_53_2_etisj.html.
T. Milliken, R.W. Burn and L. Sangalakula. (2009). CoP15 Doc. 44.1 Annex The Elephant Trade Information System (ETIS) and The Illicit Trade in Ivory. Available at: http://www.cites.org/common/cop/15/doc/E15-44-01A.pdf.
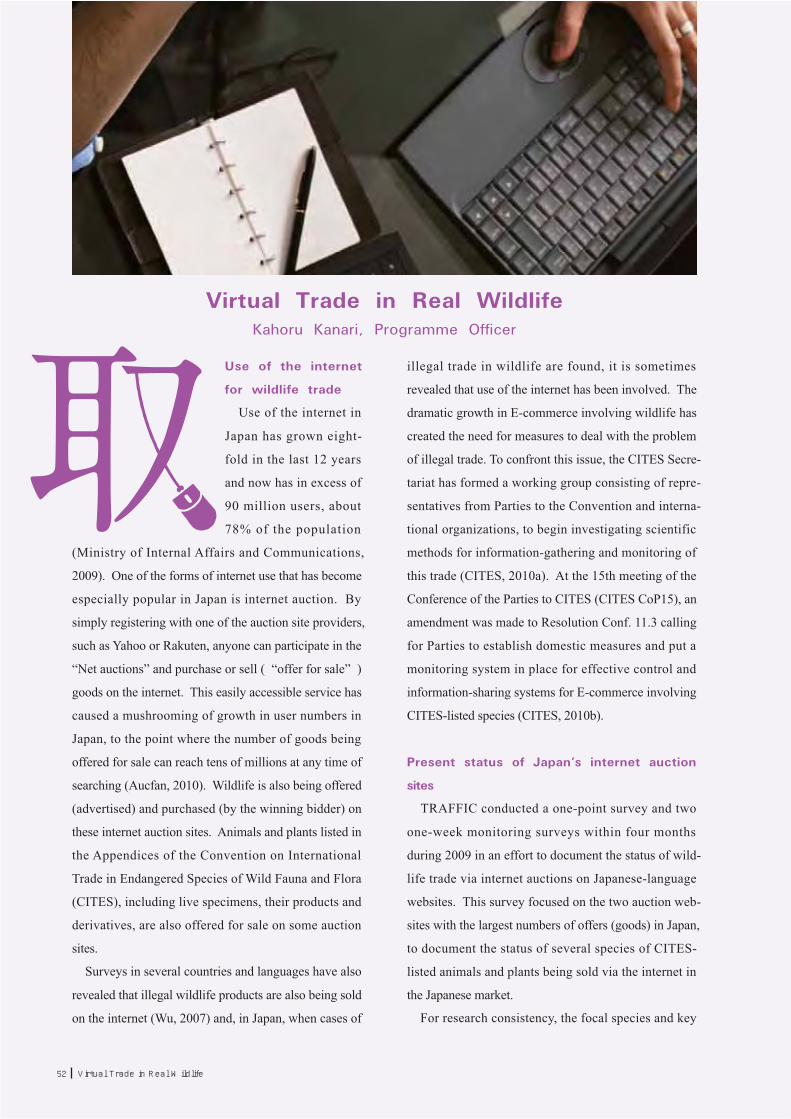
52 Virtual Trade in Real Wildlife
Use of the internet
for wildlife trade
Use of the internet in
Japan has grown eight-
fold in the last 12 years
and now has in excess of
90 million users, about
78% of the population
(Ministry of Internal Affairs and Communications,
2009). One of the forms of internet use that has become
especially popular in Japan is internet auction. By
simply registering with one of the auction site providers,
such as Yahoo or Rakuten, anyone can participate in the
“Net auctions” and purchase or sell ( “offer for sale” )
goods on the internet. This easily accessible service has
caused a mushrooming of growth in user numbers in
Japan, to the point where the number of goods being
offered for sale can reach tens of millions at any time of
searching (Aucfan, 2010). Wildlife is also being offered
(advertised) and purchased (by the winning bidder) on
these internet auction sites. Animals and plants listed in
the Appendices of the Convention on International
Trade in Endangered Species of Wild Fauna and Flora
(CITES), including live specimens, their products and
derivatives, are also offered for sale on some auction
sites.
Surveys in several countries and languages have also
revealed that illegal wildlife products are also being sold
on the internet (Wu, 2007) and, in Japan, when cases of
illegal trade in wildlife are found, it is sometimes
revealed that use of the internet has been involved. The
dramatic growth in E-commerce involving wildlife has
created the need for measures to deal with the problem
of illegal trade. To confront this issue, the CITES Secre-
tariat has formed a working group consisting of repre-
sentatives from Parties to the Convention and interna-
tional organizations, to begin investigating scientific
methods for information-gathering and monitoring of
this trade (CITES, 2010a). At the 15th meeting of the
Conference of the Parties to CITES (CITES CoP15), an
amendment was made to Resolution Conf. 11.3 calling
for Parties to establish domestic measures and put a
monitoring system in place for effective control and
information-sharing systems for E-commerce involving
CITES-listed species (CITES, 2010b).
Present status of Japan’s internet auction
sites
TRAFFIC conducted a one-point survey and two
one-week monitoring surveys within four months
during 2009 in an effort to document the status of wild-
life trade via internet auctions on Japanese-language
websites. This survey focused on the two auction web-
sites with the largest numbers of offers (goods) in Japan,
to document the status of several species of CITES-
listed animals and plants being sold via the internet in
the Japanese market.
For research consistency, the focal species and key
Virtual Trade in Real Wildlife
Kahoru Kanari, Programme Officer

取
53Virtual Trade in Real Wildlife
Bids of CITES-listed fauna and flora on two auction websites(excluding live fauna) (Survey period: Mar. – June 2009) 1Figure
Hit count: the number of search results produced at any given time for a given keyword Result counts: the number (count) of results (hits) determined to have a high possibility of relevance with regard to CITES-listed species/products based on an independently devised set of criteria. Average offers per week means the number of new offers in a week determined to be relevant results. The following products are excluded from results due to identification difficulties: cosmetics which include ‘caviar’ in the name or description; perfume which includes ‘musk’ scent; perfume which includes ‘Brazilian rosewood’ scent.※including live sturgeon for pet
象牙、ぞうげ、ゾウゲ
鼈甲、べっ甲、ベッコウ、べっこう
ワニ、鰐、わに/革、皮
キャビア、 チョウザメ
麝香、じゃ香、じゃこう、ジャコウ
アロワナ
虎骨、 虎肉
虎、トラ、とら/毛皮、剥製
ヒョウ、豹/毛皮
豹 骨
ビクーニャ、ビクーナ、ビキューナ
ブラジリアンローズウッド
トリバネアゲハ
犀角
スローロリス
(ivory)
(bekko)
(crocodile/skin)
(caviar) (sturgeon)
(musk)
(arowana)
(tiger bone) (tiger meat)
(tiger / fur, stuffed specimen)
(leopard / fur)
(leopard) (bone)
(vicuna)
(Brazilian Rosewood)
(birdwing butterfly)
(rhino horn)
(slow loris)
3650
2710
1344
1674
79
138
1
39
32
6
8
5
7
5
0
143
110
92
64
59
68
4
3
2
6
0
0
4
0
1
1306
543
278
11
3
18
1
6
9
0
5
5
4
2
0
41
10
14
0
0
17
0
0
0
0
0
0
4
0
1
177.5
49
52
43.5
0
1
0
0.5
0
0
1.5
3.5
0
0
0
1.5
1
19.5
0.5※
0
24.5
0
0
0
0
1
0
6.5
0
0
Hit counts Result (counted) Average new offersper weekname of items
(keyword)Site 1 Site 2 Site 1 Site 2 Site 1 Site 2
tisement of trade in live reptiles and birds.
The origins and destinations of wildlife traded
Many of the CITES-listed fauna and flora being
offered via internet auctions with Japan as the final
consumption destination are originally imported from
other countries. Although in general it is rare to find
information about the country of origin or export coun-
try for items offered via internet auctions, one exception
is offers of live fauna, in which case 36% of the adver-
tisements mentioned the country of origin or export
country when details were investigated. TRAFFIC’ s
survey results found 27 countries and six regions around
the world listed as the country of origin or point of
export for reptiles and birds offered via internet auctions.
Furthermore, the survey revealed that 10% (11 adver-
tisements) of the sampled ivory offerings (109 advertise-
ments) from one auction website (site 1) provided a
service for delivery of the shipment to customers in
words for searching the availability of species and their
products were first decided and then used in research
across different internet auction websites (Figure 1).
These searches produced a large number of offers of
products related to wildlife. Among these were ivory,
bekko (marine turtle shell), alligator/crocodile skin prod-
ucts and caviar, offered with high frequency. The
survey showed that, on average, more than 20 new offer-
ings of ivory products could be found every day and
nearly 50 new offerings of caviar and bekko could be
found every week. These data show that, in particular,
ivory and bekko products are being offered on these
Japanese-language sites at higher levels compared to the
case in previous surveys for auction sites operating in
other languages (e.g. Chinese: Wu, 2007 and English:
IFAW, 2008; Williamson, 2004). In terms of live
animals, at least 56 CITES-listed species of live reptiles
and birds were found from one of two studied websites
(site 2), while the other website did not allow the adver-

54 Virtual Trade in Real Wildlife
Japan and abroad. This suggests that Japan’ s internet
auctions are also being used for international trade. Inter-
national trade of ivory is regulated by CITES and
re-exporting from Japan is prohibited for certain speci-
mens of ivory. It is unclear to what degree the sellers
and consumers on the internet auction sites are aware of
national or international regulations. Insufficient knowl-
edge of the regulations by sellers and consumers could
be part of the reason behind any illegal shipments if
they have occurred.
The need for amending the laws involved
It is under discussion whether sales conducted on the
internet are more conducive to illegal trade than sales
conducted in real “bricks and mortar” stores. The
CITES Secretariat has called for scientific research to
examine the correlations between the use of the internet
and the rate of illegal trade in wildlife (CITES, 2010c).
One of the important factors that can be noted in the
case of Japan is that the country’ s laws are not yet
updated to deal effectively with the new style of trade
that is taking place over the internet. To address the
characteristics of internet trade, the laws governing wild-
life trade in Japan, especially the Law for the Conserva-
tion of Endangered Species of Wild Fauna and Flora
(LCES), needs to be amended to provide appropriate
regulation. While LCES was first adopted in 1993, and
has been through few major amendments, Japan’ s inter-
net user population has increased eight-fold in 12 years,
as mentioned above (Ministry of Internal Affairs, 2009),
and modes for purchase and sale of wildlife have
changed greatly.
It needs to be understood that wildlife products
offered for sale on the internet only come with limited
information provided by sellers. It should be a require-
ment for sellers to provide sufficient information, includ-
ing that relating to the legality of products on offer and
details of any documents needed to validate legality
(such as legal import documents or registration docu-
ments), when posting offers of wildlife and wildlife
products, to prevent illegal trading.
At the same time, because internet auctions are plat-
forms for trade not only for business operators but also
for private individuals, comprehensive measures must
be developed, and included in LCES. The responsibility
of government regulators should also include a require-
ment to ensure that the necessary knowledge concerning
international conventions and domestic laws is dissemi-
nated to a broader audience, including internet users.
The government and the providers of internet auction
sites must co-operate to strengthen the effective distribu-
tion of this knowledge.
It is vital that efforts be made to take advantage of
the ability of the internet to reach a larger number of
people over a broader range than real “bricks and
mortar” stores and use it to disseminate and increase
awareness of CITES regulations and national laws.
Protection of endangered species from unscrupulous
internet business transactions is necessary to create a
strong deterrent against illegal internet E-commerce,
and this can be achieved through public awareness
outreach, diligent monitoring and law.
REFERENCESAucfan. (2010). Statistics data from Aucfan http://aucfan.com/site_count.html. Viewed on 26 July 2010.CITES. (2010a). CoP15 Doc.32- Interpretation and implementation of the Convention Trade control and marking. Available at: http://www.cites.org/eng/cop/15/doc/E15-32.pdf. Viewed on 3 August.
CITES. (2010b). CITES Resolution Conf.11.3 Compliance and enforcement (Rev. Cop15). Available at: http://www.cites.org/eng/res/all/11/E11-03R15.pdf. Viewed on 4 August.
CITES (2010c). PRESS KIT E-commerce of CITES-listed species. Available at: http://www.cites.org/eng/news/press/2010/20100316_e-commerce_kit.pdf. Viewed on 8 June.
IFAW (2008). Killing with Keystrokes: Wildlife trade on the Internet. London: IFAW.Ministry of Internal Affairs and Communications. (2010).平成21年「通信利用動向調査」の結果 [Results of the survey for the trend with telecom use]. Press release 27 April 2010. (In Japanese.) http://www.soumu.go.jp/main_content/000064217.pdf. Viewed on 8 June.
Miniwatts Marketing Group. (2010). Internet World Stats. http://www.Internetworldstats.com/stats.htm. Viewed on June.Williamson, D.F. (2004). Tackling the Ivories: The Status of the US Trade in Elephant and Hippo Ivory. TRAFFIC North America. Washington, DC: World Wildlife Fund.
Wu, J. (2007). World Without Borders: Wildlife Trade on the Chinese-language Internet. TRAFFIC Bulletin 21(2):75-84.

取
55Virtual Trade in Real Wildlife

TRAFFIC, the wildlife trade monitoring network, works to ensurethat trade in wild plants and animals is not a threat to the conservation of nature.
TRAFFIC East Asia-Japanc/o WWF JapanNihonseimei Akabanebashi Bldg. 6F3-1-14 Shiba, Minato-ku, Tokyo 105-0014, JapanTe l +81-3-3769-1716Fax +81-3-3769-1304
TRAFFIC International219a Huntingdon RoadCambridge CB3 0DLUKTe l 44-1223-277427Fax 44-1223-277237E-mail: [email protected]
Oct
ob
er 2
010