
THE STATE OF THE ECONOMY - pdx.edu Economy... · Economists remain hopeful for 2014 as the...
14
■ Angela Guo is a Master of Real Estate Development candidate and has been awarded the Center for Real Estate Fellowship. Any errors or omissions are the au- thor’s responsibility. Any opinions expressed are those of the author solely and do not represent the opinions of any other person or entity. Center for Real Estate Quarterly Report, vol. 8, no. 2. Spring 2014 12 THE STATE OF THE ECONOMY ANGELA GUO Portland State University The United States economy barely grew in the first quarter of 2014 due to declining exports to the weakening economies in Europe and Asia as well as inclement weath- er in the northern United States. The Commerce Department reports that the gross domestic product grew at an annual rate of 0.1 percent for the first quarter. The Economist Intelligence Unit forecasts GDP growth for 2014 to be 3 percent, up from 1.9 percent of 2013. Steady growth is to be expected, but no boom is anticipat- ed. Overall, the housing market has softened, as market interest rates are higher than they were a year ago and will continue to rise. Economists remain hopeful for 2014 as the unemployment rate remains steady and job growth continues. U.S. companies have added enough jobs to replace the 8.8 mil- lion jobs that were lost due to the financial crisis. In early April, the Federal Reserve, the Federal Deposit Insurance Corp. and the Of- fice of the Comptroller of the Currency approved a new leverage ratio rule, requiring an increase in capital of the largest U.S. banks. This rule necessitates the eight ma- jor US banks to have as much as $68 billion in capital to allow companies to “weath- er losses during periods of market stress,” according to the Wall Street Journal. Lenders that are affected include JPMorgan Chase, Citibank, Bank of America,
Transcript of THE STATE OF THE ECONOMY - pdx.edu Economy... · Economists remain hopeful for 2014 as the...

■ Angela Guo is a Master of Real Estate Development candidate and has been awarded the Center for Real Estate Fellowship. Any errors or omissions are the au-thor’s responsibility. Any opinions expressed are those of the author solely and do not represent the opinions of any other person or entity. Center for Real Estate Quarterly Report, vol. 8, no. 2. Spring 2014 12
THE STATE OF THE ECONOMY
ANGELA GUO
Portland State University
The United States economy barely grew in the first quarter of 2014 due to declining exports to the weakening economies in Europe and Asia as well as inclement weath-er in the northern United States. The Commerce Department reports that the gross domestic product grew at an annual rate of 0.1 percent for the first quarter.
The Economist Intelligence Unit forecasts GDP growth for 2014 to be 3 percent, up from 1.9 percent of 2013. Steady growth is to be expected, but no boom is anticipat-ed. Overall, the housing market has softened, as market interest rates are higher than they were a year ago and will continue to rise.
Economists remain hopeful for 2014 as the unemployment rate remains steady and job growth continues. U.S. companies have added enough jobs to replace the 8.8 mil-lion jobs that were lost due to the financial crisis.
In early April, the Federal Reserve, the Federal Deposit Insurance Corp. and the Of-fice of the Comptroller of the Currency approved a new leverage ratio rule, requiring an increase in capital of the largest U.S. banks. This rule necessitates the eight ma-jor US banks to have as much as $68 billion in capital to allow companies to “weath-er losses during periods of market stress,” according to the Wall Street Journal. Lenders that are affected include JPMorgan Chase, Citibank, Bank of America,

STATE OF THE ECONOMY GUO 13
Wells Fargo, Goldman Sachs, and Morgan Stanley. The rule will take effect on Jan 1, 2018.
While banking regulations are becoming more stringent, mortgage lenders have be-gun to ease their lending standards. The effects of the recent global crisis are not completely forgotten as standards are still more restrictive than historically ob-served, but lenders have begun to allow lower credit scores and down-payment re-quirements to chase new business. Economists remain optimistic that lenders will not return to the destructive underwriting standards that contributed to the Great Recession.
THE WORLD ECONOMY The International Monetary Fund (IMF)’s April report states that although global recovery remains fragile, overall global activity has strengthened and is anticipated to improve. The world economy is estimated to grow by 3.6% in 2014 and 3.9% in 2015.
Most of global economic growth comes from emerging markets, which are facing con-tinued downside risks due to lower-than-expected growth in advanced economies and a variety of geopolitical concerns. Because this volatility in emerging markets is happening at the same time as increasing interest rates in advanced economies, in-vestors will be more inclined to draw capital out of emerging economies to advanced countries in search of higher returns.
In China, the IMF reports that growth will decelerate from 7.5 percent in 2014 to 7.3 percent in 2015. (Figure 2) Recently, the IMF has urged the Chinese central bank to liberalize interest rates and improve banking regulation, among other measures to relieve some of the country’s debt burden and reduce financial risk.
Since late February 2014, the Russian economy has suffered due to the conflict be-tween Ukraine and Russia. A crisis centered on the secession of the Crimean Penin-sula has instigated the U.S. and the European Union to initiate sanctions against a select group of Russian citizens, a prelude to possible sweeping economic sanctions that may be implemented should Russia continue its current secession agenda. Ac-cording to the Wall Street Journal, central bank figures show $51 billion in capital left Russia in the first quarter of 2014, which is the largest outflow of capital since the global recession in 2008. Furthermore, Russia’s stock market saw its largest ab-solute drop since the global financial crisis, as well. Russia’s growth projection is es-timated to be zero with the ruble falling more than 10% to the dollar.

STATE OF THE ECONOMY GUO 14
Figure 2: IMF World Growth Projections, April 2014
Projections
Difference from Jan '14 WEO Projec-
tions
2012 2013 2014 2015 2014 2015
World Output
3.2 3.0 3.6 3.9 -0.1 -0.1
Advanced Economies 1.4 1.3 2.2 2.3 0.0 0.0
United States
2.8 1.9 2.8 3.0 0.0 0.0
Euro Area -0.7 -0.5 1.2 1.5 0.1 0.1
Germany
0.9 0.5 1.7 1.6 0.2 0.1
France 0.0 0.3 1.0 1.5 0.1 0.0
Italy
-2.4 -1.9 0.6 1.1 0.0 0.1
Spain -1.6 -1.2 0.9 1.0 0.3 0.2
Japan
1.4 1.5 1.4 1.0 -0.3 0.0
United Kingdom 0.3 1.8 2.9 2.5 0.4 0.3
Canada
1.7 2.0 2.3 2.4 0.1 0.0
Other Advanced Economies 1.9 2.3 3.0 3.2 0.1 0.0
Emerging and Developing Economies 5.0 4.7 4.9 5.3 -0.2 -0.1
Central and Eastern Europe 1.4 2.8 2.8 2.9 -0.5 -0.2
Commonwealth of Independent States 3.4 2.1 2.3 3.1 -0.3 0.1
Russia 3.4 1.3 1.3 2.3 -0.6 -0.2
Excluding Russia 3.3 3.9 5.3 5.7 1.2 1.4
Developing Asia 6.7 6.5 6.7 6.8 0.0 0.0
China
7.7 7.7 7.5 7.3 0.0 0.0
India 4.7 4.4 5.4 6.4 0.0 0.0
ASEAN-5*
6.2 5.2 4.9 5.4 -0.2 -0.2
Latin America and the Caribbean 3.1 2.7 2.5 3.0 -0.4 -0.3
Brazil
1.0 2.3 1.8 2.7 -0.5 -0.2
Mexico 3.9 1.1 3.0 3.5 0.0 0.0
Middle East, North Africa,
Afghanistan, and Pakistan 4.1 2.2 3.2 4.5 -0.1 -0.5
Sub-Saharan Africa 4.9 4.9 5.4 5.5 -0.7 -0.3
South Africa 2.5 1.9 2.3 2.7 -0.5 -0.6 Source: International Monetary Fund, World Economic Outlook, January 2014 *Indonesia, Malaysia, Philippines, Thailand, and Vietnam.

STATE OF THE ECONOMY GUO 15
THE UNITED STATES ECONOMY The United States Bureau of Economic Analysis (BEA) reports positive but slow economic growth for the past five years. In 2012, the US economy grew by 2.8 per-cent and in 2013, GDP grew from 1.9 percent. And as previously discussed, the US economy was at a near standstill, growing by only 0.1 percent GDP growth in the first quarter of 2014 due to poor weather and international geopolitical instability. The 0.1 percent growth rate matches the second-weakest quarterly reading of the nearly five-year-old economic recovery. However, as shown in the table below, eco-nomic forecasters are projecting a revival of growth as 2014 progresses.
Figure 3: United States Annual Economic Growth, Actual and Forecasts, 2013–2018
% 2013a 2014b 2015b 2016b 2017b 2018b GDP 1.9 3.0 2.6 2.5 2.4 2.6 Private consumption 2.0 2.6 2.4 2.3 2.3 2.0 Government consumption -2.2 0.0 0.8 0.7 0.7 0.8 Gross fixed investment 4.5 8.0 7.2 6.5 6.4 6.8 Exports of goods & services 2.7 2.7 3.0 3.4 3.2 3.8 Imports of goods & services 1.4 2.3 3.9 4.3 5.1 4.0 Domestic demand 1.7 2.9 2.8 2.7 2.7 2.7 Agriculture 2.1 2.0 2.5 2.9 2.9 2.9 Industry 2.5 2.8 3.0 2.5 2.4 2.4 Services 1.7 3.0 2.5 2.5 2.4 2.7
a Actual; b Forecasted Source: Economist Intelligence Unit, April 2014
In particular, forecasters are projecting consumer spending to pick up. The Econo-mist Intelligence Unit forecasts that real GDP will growth by an average of 2.6 per-cent over 2014-18. Although positive throughout the forecast period, the growth forecast is still below the period from 1992-2000, when real GDP growth averaged 3.9 percent.
STATE OF THE ECONOMY GUO 16
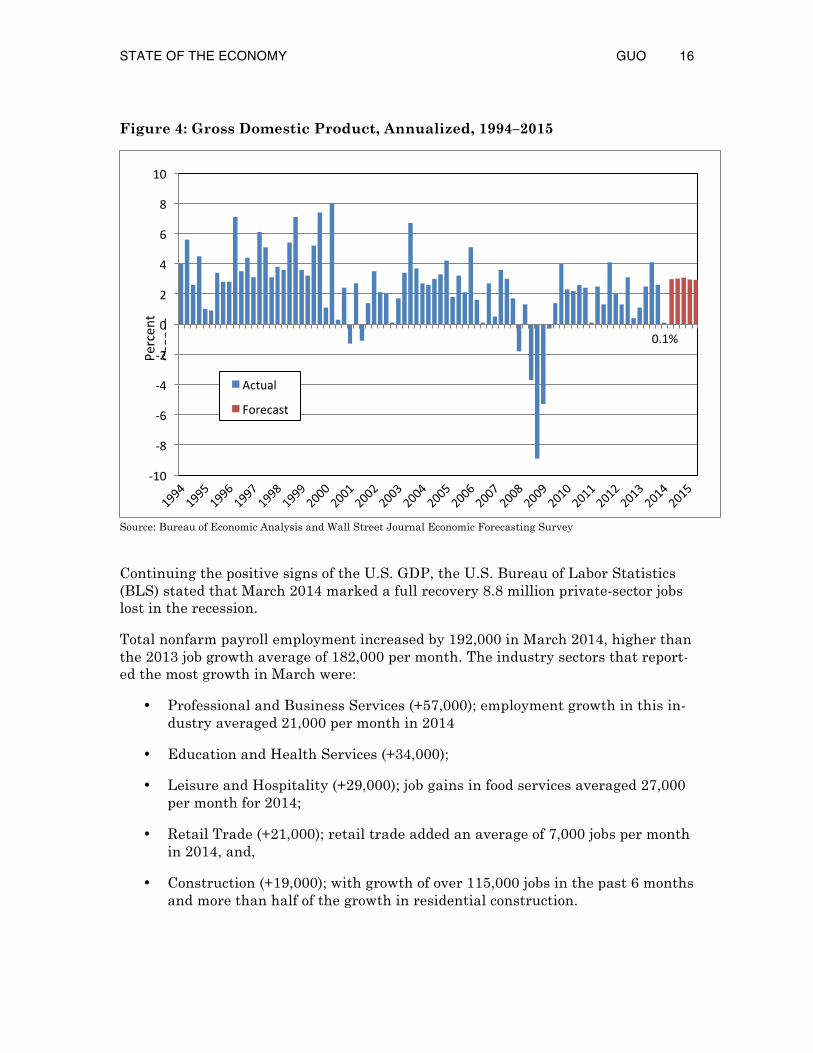
Figure 4: Gross Domestic Product, Annualized, 1994–2015
Source: Bureau of Economic Analysis and Wall Street Journal Economic Forecasting Survey
Continuing the positive signs of the U.S. GDP, the U.S. Bureau of Labor Statistics (BLS) stated that March 2014 marked a full recovery 8.8 million private-sector jobs lost in the recession.
Total nonfarm payroll employment increased by 192,000 in March 2014, higher than the 2013 job growth average of 182,000 per month. The industry sectors that report-ed the most growth in March were:
• Professional and Business Services (+57,000); employment growth in this in-dustry averaged 21,000 per month in 2014
• Education and Health Services (+34,000);
• Leisure and Hospitality (+29,000); job gains in food services averaged 27,000 per month for 2014;
• Retail Trade (+21,000); retail trade added an average of 7,000 jobs per month in 2014, and,
• Construction (+19,000); with growth of over 115,000 jobs in the past 6 months and more than half of the growth in residential construction.
0.1%
-‐10
-‐8
-‐6
-‐4
-‐2
0
2
4
6
8
10
Actual
Forecast
Percen
t Ch
ange
STATE OF THE ECONOMY GUO 17
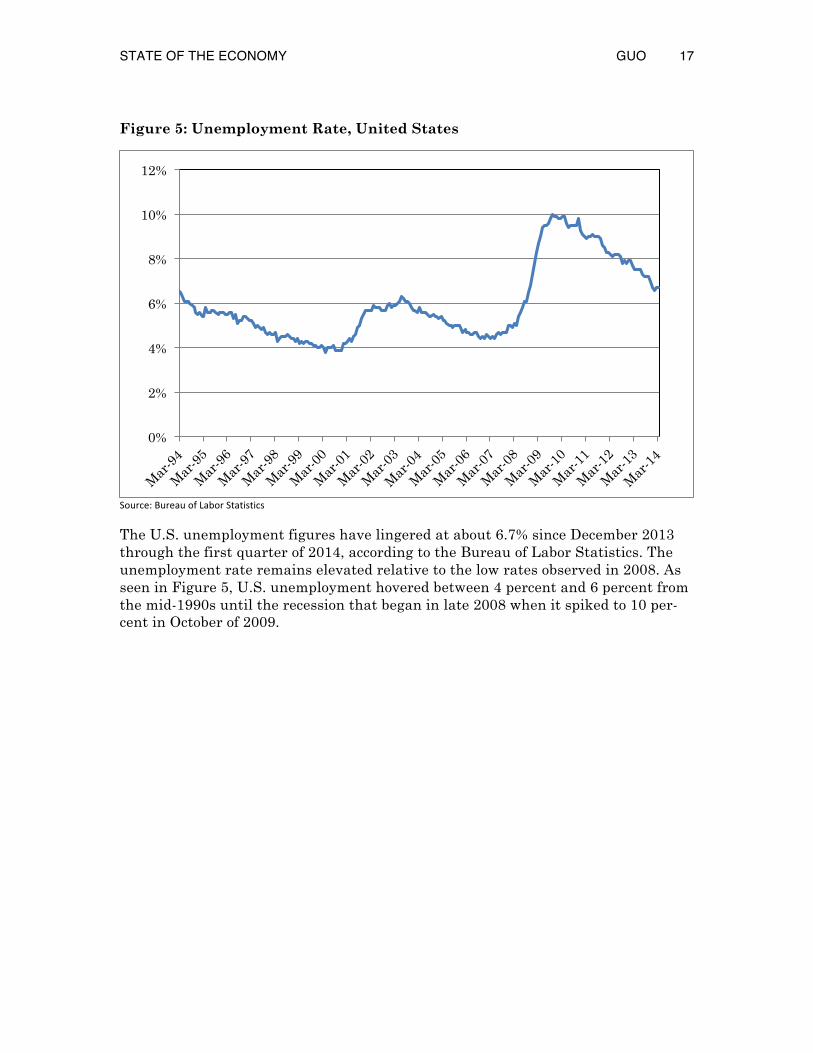
Figure 5: Unemployment Rate, United States
Source: Bureau of Labor Statistics
The U.S. unemployment figures have lingered at about 6.7% since December 2013 through the first quarter of 2014, according to the Bureau of Labor Statistics. The unemployment rate remains elevated relative to the low rates observed in 2008. As seen in Figure 5, U.S. unemployment hovered between 4 percent and 6 percent from the mid-1990s until the recession that began in late 2008 when it spiked to 10 per-cent in October of 2009.
0%
2%
4%
6%
8%
10%
12%
STATE OF THE ECONOMY GUO 18
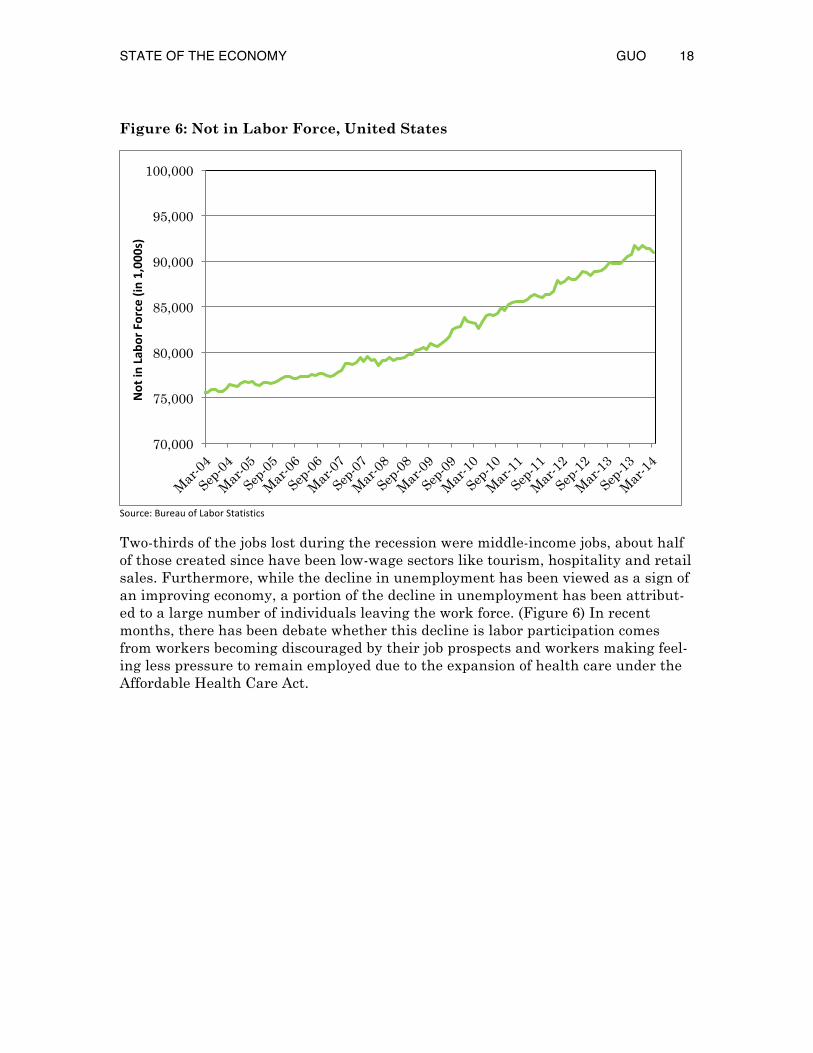
Figure 6: Not in Labor Force, United States
Source: Bureau of Labor Statistics
Two-thirds of the jobs lost during the recession were middle-income jobs, about half of those created since have been low-wage sectors like tourism, hospitality and retail sales. Furthermore, while the decline in unemployment has been viewed as a sign of an improving economy, a portion of the decline in unemployment has been attribut-ed to a large number of individuals leaving the work force. (Figure 6) In recent months, there has been debate whether this decline is labor participation comes from workers becoming discouraged by their job prospects and workers making feel-ing less pressure to remain employed due to the expansion of health care under the Affordable Health Care Act.
70,000
75,000
80,000
85,000
90,000
95,000
100,000
Not in Lab
or Force (in 1,000s)

STATE OF THE ECONOMY GUO 19
Figure 7: United States Inflation Trend, Annual Change in Consumer Price Index
Source: United States Bureau of Labor Statistics and Wall Street Journal Economic Forecasting Survey
There are very few indicators suggesting higher inflation in the near future. The BLS reports that the Consumer Price Index for All Urban Consumers increased 0.2 percent in March 2014 on a seasonally adjusted basis. The last 12 months saw infla-tion of 1.42 percent (Figure 7). The Wall Street Journal forecasts that inflation rates will stay below 2.5 percent through 2016.

STATE OF THE ECONOMY GUO 20
Figure 8: Standard & Poor’s 500 stock index, 5-years
Source: S & P Dow Jones Indices, McGraw Hill Financial
US Stock markets finished the first quarter of 2014 inching toward at record highs. Uncertainties related to the Ukrainian crisis has contributed to some pressure in prices, but overall stock prices remain within 1.5 percent of where they started in 2014. (Figure 7).
For the past seven years Federal Reserve has been buying Treasury bonds and mortgage bonds in an effort known as “quantitative easing” to drive down long-term interest rates and spur spending, hiring and investment. However, former Federal Reserve Chairman Ben Bernanke announced that the Federal Reserve would “taper” the purchase of securities should certain economic targets be met. Under its newly appointed chair, Janet Yellen , the Federal Reserve has continued a policy of taper-ing its buying of bonds, even though economic indicators have not shown unemploy-ment rates that are below the previously announced target of 6.5 percent. In Decem-ber 2013, the Fed decided to reduce the $85 billion bond-buying program and this month will be reduced to $45 billion.
500
1000
1500
2000
2500
3000
3500
4000
Apr 2009 Apr 2010 Apr 2011 Apr 2012 Apr 2013 Apr 2014
S&P 500 (TR)
S&P 500

STATE OF THE ECONOMY GUO 21
Figure 9: 10-year U.S. Treasuries vs. Conventional 30-year Mortgage Trends, 1994–2014
Source: Federal Reserve Bank
The shift toward a policy of tapering has caused interest rates to rise and bond pric-es to fall as shown in Figure 9. 10-year Treasury yields, which influence, mortgage rates, began climbing in the second quarter of 2013. More recently, yields for the 10-year Treasury note decreased from 2.9 percent in December 2013 to 2.72 percent in March 2014. In turn, this led to a decline in mortgage rates. Conventional 30-year fixed rate mortgages fell from 4.46 percent in December 2013 to 4.34 percent in March 2014. This drop in rates is projected to be a temporary by most economists, and interest rates will begin on its upward trajectory within the next quarter.
0
1
2
3
4
5
6
7
8
9
10
Yie
ld R
ate
Conventional Mortgage, Fixed Rate (30 years)
STATE OF THE ECONOMY GUO 22
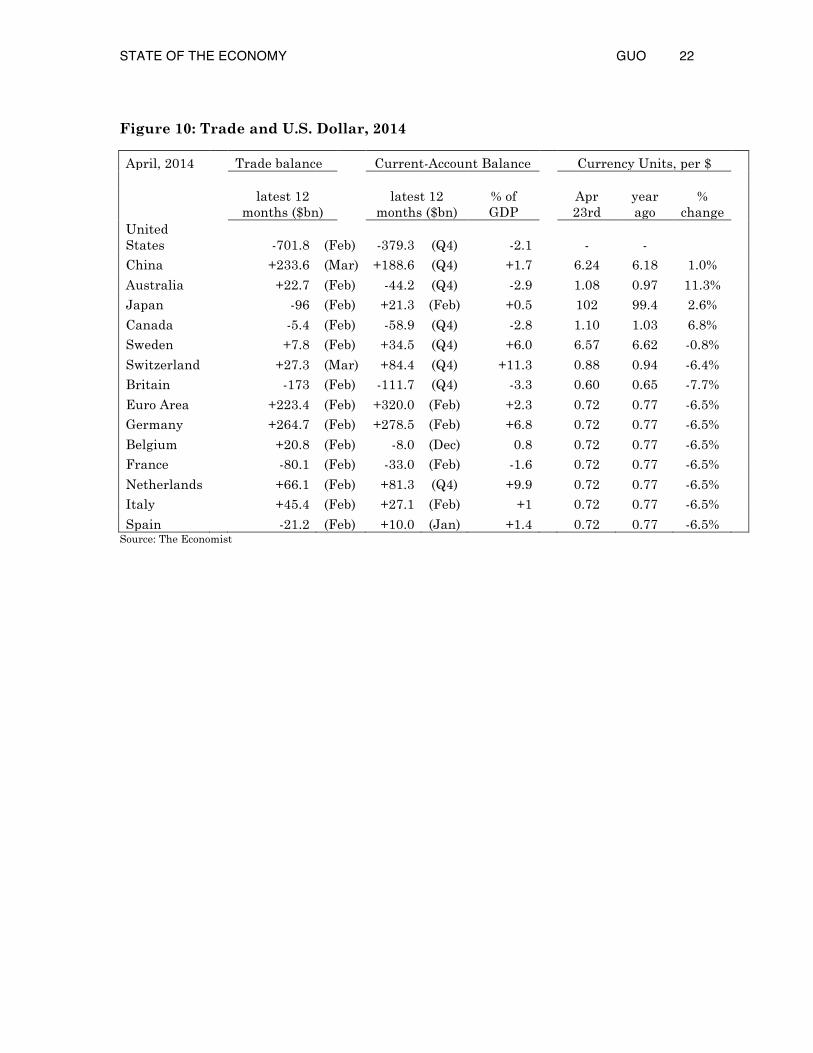
Figure 10: Trade and U.S. Dollar, 2014
April, 2014 Trade balance Current-Account Balance Currency Units, per $
latest 12 months ($bn)
latest 12 months ($bn)
% of GDP
Apr 23rd
year ago
% change
United States
-701.8 (Feb) -379.3 (Q4) -2.1
- -
China
+233.6 (Mar) +188.6 (Q4) +1.7
6.24 6.18 1.0%
Australia
+22.7 (Feb) -44.2 (Q4) -2.9
1.08 0.97 11.3%
Japan
-96 (Feb) +21.3 (Feb) +0.5
102 99.4 2.6%
Canada
-5.4 (Feb) -58.9 (Q4) -2.8
1.10 1.03 6.8%
Sweden
+7.8 (Feb) +34.5 (Q4) +6.0
6.57 6.62 -0.8%
Switzerland
+27.3 (Mar) +84.4 (Q4) +11.3
0.88 0.94 -6.4%
Britain
-173 (Feb) -111.7 (Q4) -3.3
0.60 0.65 -7.7%
Euro Area
+223.4 (Feb) +320.0 (Feb) +2.3
0.72 0.77 -6.5%
Germany
+264.7 (Feb) +278.5 (Feb) +6.8
0.72 0.77 -6.5%
Belgium
+20.8 (Feb) -8.0 (Dec) 0.8
0.72 0.77 -6.5%
France
-80.1 (Feb) -33.0 (Feb) -1.6
0.72 0.77 -6.5%
Netherlands
+66.1 (Feb) +81.3 (Q4) +9.9
0.72 0.77 -6.5%
Italy
+45.4 (Feb) +27.1 (Feb) +1
0.72 0.77 -6.5%
Spain -21.2 (Feb) +10.0 (Jan) +1.4 0.72 0.77 -6.5% Source: The Economist
STATE OF THE ECONOMY GUO 23
OREGON AND THE PORTLAND AREA Oregon’s economy continues to improve in 2014. The growth in the state’s economy is attributed to the improvement in the housing sector, which has added jobs. As re-covery continues, the Oregon Office of Economic Analysis (OEA) expects the rate of growth of Oregon to continue on its increasing trend stating that one of Oregon’s economic strengths is the fact that, “in good times and in bad, people want to live in the state and move here.”
Oregon’s job growth has the highest pace in eight years and with seasonally adjust-ed monthly job gains of 7,500 in March being the largest since November 2005 when 9,300 jobs were added.
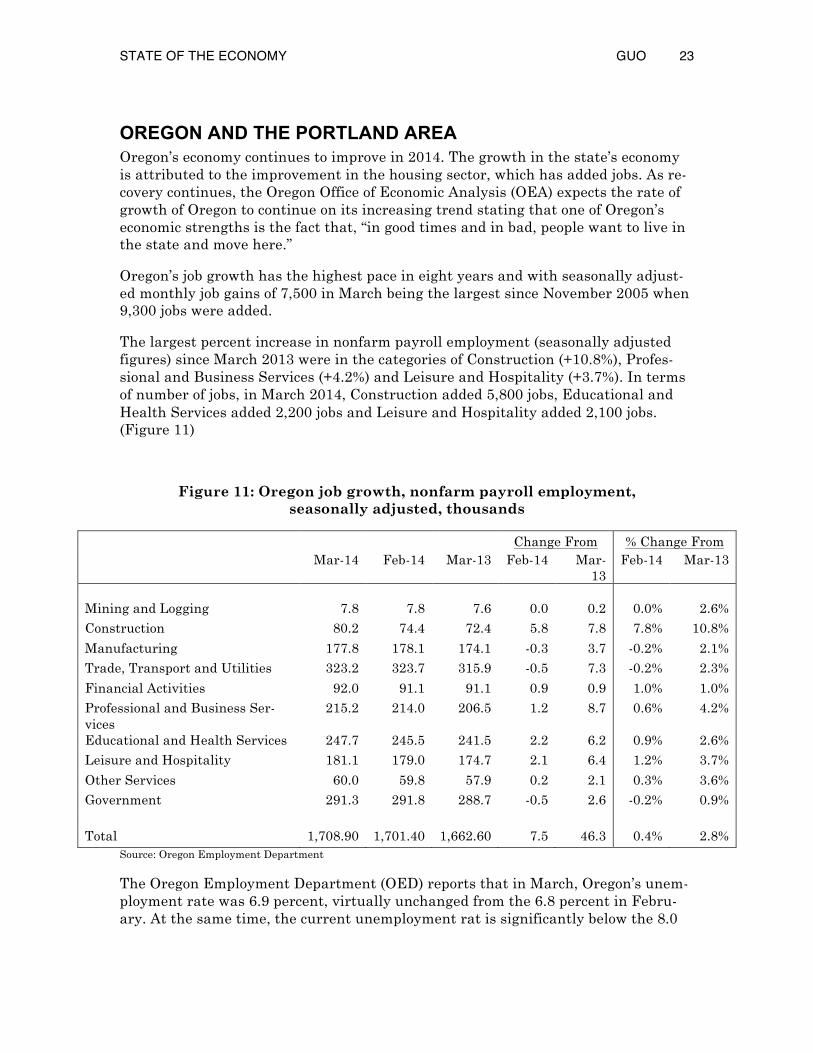
The largest percent increase in nonfarm payroll employment (seasonally adjusted figures) since March 2013 were in the categories of Construction (+10.8%), Profes-sional and Business Services (+4.2%) and Leisure and Hospitality (+3.7%). In terms of number of jobs, in March 2014, Construction added 5,800 jobs, Educational and Health Services added 2,200 jobs and Leisure and Hospitality added 2,100 jobs. (Figure 11)
Figure 11: Oregon job growth, nonfarm payroll employment, seasonally adjusted, thousands
Change From % Change From Mar-14 Feb-14 Mar-13 Feb-14 Mar-
13 Feb-14 Mar-13
Mining and Logging 7.8 7.8 7.6 0.0 0.2 0.0% 2.6%
Construction 80.2 74.4 72.4 5.8 7.8 7.8% 10.8%
Manufacturing 177.8 178.1 174.1 -0.3 3.7 -0.2% 2.1%
Trade, Transport and Utilities 323.2 323.7 315.9 -0.5 7.3 -0.2% 2.3%
Financial Activities 92.0 91.1 91.1 0.9 0.9 1.0% 1.0%
Professional and Business Ser-vices
215.2 214.0 206.5 1.2 8.7 0.6% 4.2%
Educational and Health Services 247.7 245.5 241.5 2.2 6.2 0.9% 2.6%
Leisure and Hospitality 181.1 179.0 174.7 2.1 6.4 1.2% 3.7%
Other Services 60.0 59.8 57.9 0.2 2.1 0.3% 3.6%
Government 291.3 291.8 288.7 -0.5 2.6 -0.2% 0.9%
Total 1,708.90 1,701.40 1,662.60 7.5 46.3 0.4% 2.8%
Source: Oregon Employment Department
The Oregon Employment Department (OED) reports that in March, Oregon’s unem-ployment rate was 6.9 percent, virtually unchanged from the 6.8 percent in Febru-ary. At the same time, the current unemployment rat is significantly below the 8.0

STATE OF THE ECONOMY GUO 24
percent figure from March 2013. Furthermore, Oregon’s labor force increased for the fifth consecutive month in March 2014, which was proceeded two years of monthly declines.
Figure 12: Portland-Vancouver-Hillsboro MSA, nonfarm payroll employment, not adjusted for seasonality
Nov 2013 Dec 2013 Jan 2014 Feb 2014 March 2014
Total Non-farm Employment 1,040,700 1,039,400 1,037,900 1,043,000 1,049,700
Unemployment rate 6.8% 6.8% 6.6% 6.4% 6.4%
Mining and Logging 900 0.0% 900 0.0% 900 0.0% 900 0.0% 900 0.0%
Construction 52,700 -
2.9% 51,700 -
1.9% 50,900 -
1.5% 50,800 -
0.2% 52,000 2.4%
Manufacturing 116,500 -
0.2% 115,900 -
0.5% 115,399 -
0.4% 116,000 0.5% 116,600 0.5% Trade, Transportation, & Utili-ties 202,900 2.2% 204,500 0.8% 195,800
-4.3% 194,900
-0.5% 194,300
-0.3%
Information 23,300 1.7% 23,600 1.3% 22,800 -
3.4% 22,700 -
0.4% 22,900 0.9%
Financial Activities 61,600 -
1.0% 62,000 0.6% 62,200 0.3% 62,600 0.6% 63,100 0.8% Professional & Business Ser-vices 146,100
-0.3% 145,600
-0.3% 152,500 4.7% 153,100 0.4% 154,000 0.6%
Educational & Health Services 150,500 0.3% 150,100 -
0.3% 151,000 0.6% 154,200 2.1% 155,900 1.1%
Leisure and Hospitality 101,800 0.2% 101,500 -
0.3% 103,600 2.1% 103,200 -
0.4% 105,000 1.7%
Other Services 37,800 -
0.5% 38,200 1.1% 36,900 -
3.4% 37,700 2.2% 37,600 -
0.3%
Government 146,600 1.5% 145,400 -
0.8% 146,000 0.4% 146,900 0.6% 147,400 0.3% Source: Oregon Employment Department
Locally, between January to March 2014, the industries with the majority of Port-land-Vancouver-Hillsboro MSA employment growth were in Education & Health Services (+4,900), Professional and Business Services (+1,500), Leisure and Hospi-tality (+1,400) and Government (+1,400), as seen in Figure 11.
In March alone, job gains were concentrated in three of the 11 major industries: Lei-sure and Hospitality (+1,800), Education & Healthy Services (+1,700), and Construc-tion (+1,200). Jones Lang LaSalle Research analyzed the BLS data to discover that while Portland had lost nearly 82,000 jobs between March 2008 and November 2009, as of February 2014, the Portland region has added back 86,200 jobs, which is 4,400 jobs above the pre-recession peak.

STATE OF THE ECONOMY GUO 25
Figure 12: Unemployment rate, National and Local
Source: Bureau of Labor Statistics and Oregon Office of Economic Analysis
Oregon’s unemployment rate typically treads above the national rate and in March 2014 was 6.9 percent, slightly above the national rate of 6.7 percent for the same month (Figure 12). Portland-Vancouver-Hillsboro MSA has observed persistent growth in employment in recent year and appears poised to fall below the national average for the first time in 15 years. n
0%
2%
4%
6%
8%
10%
12% United States Oregon Portland-Vancouver-Hillsboro MSA


