The State Of Strategic Marketing In Kenya's Sugar Companies
79
THE STATE OF STRATEGIC MARKETING IN KENYA'S SUGAR COMPANIES ^ BY HERBERT AJ KASSAMANI • iwverstty of Nairobi library *• O. Box 50197 NAIROBI A PROJECT SUBMITTED IN PARTIAL FULFILMENT OF THE REQUIREMENTS FOR THE DEGREE OF MASTER OF BUSINESS ADMINISTRATION, UNIVERSITY OF NAIROBI NOVEMBER, 1999
Transcript of The State Of Strategic Marketing In Kenya's Sugar Companies

THE STATE OF STRATEGIC MARKETING IN KENYA'S SUGAR
COMPANIES ^
BY
HERBERT AJ KASSAMANI
• iw verstty o f Na ir o b i library
*• O. Box 50197 NAIROBI
A PROJECT SUBMITTED IN PARTIAL FULFILMENT OF THE
REQUIREMENTS FOR THE DEGREE OF MASTER OF BUSINESS
ADMINISTRATION, UNIVERSITY OF NAIROBI
NOVEMBER, 1999

This project is my original work and has not been submitted for a degree in any other
University
This project has been submitted for examination with my approval as the University
Supervisor
Signed:
Prof. F. N. Kibera
i

DEDICATION
To my daughter, Flavia; and sons, Collins and Victor.
In their innocence,
They thought school was for children
And often wondered
How daddy could be going to school
In old age.
u

TABLE OF CONTENTS PAGE
List of tab les................................................................................................................................... v
Aknowledgement.........................................................................................................................vii
Abstract............................................................................................................................................ix
CHAPTER 1: INTRODUCTION
1.1 Background to the Study..........................................................................................................1
1.2 Statement of the Problem........................................................................................................ 6
1.3 Objectives o f the Study........................................................................................................... 6
1.4 Importance of study.................................................................................................................. 7
CHAPTER 2: LITERATURE REVIEW
2.1 Theoretical Literature............................................................................................................... 8
2.2 Empirical Literature................................................................................................................12
CHAPTER 3: RESEARCH DESIGN
3.1 Population of Study................................................................................................................15
3.2 Data collection........................................................................................................................15
3.3 Data analysis........................................................................................................................... 16
3.3.1 Measurement of Results..................................................................................................... 16
3.3.2 Operational Definitions of Variables............................................................................... 17
CHAPTER 4: DATA ANALYSIS AND INTERPRETATION
4.1 The marketing environment................................................................................................. 19
in

4.1.2 Competitor Analysis.......................................................................................................... 23
4.1.3 Internal Analysis............................................................................................................... 26
4.1.3.1 Mission Statement............................................................................................................ 26
4.1.3.2 Portfolio Analysis............................................................................................................. 28
4.1.3.3 Marketing Objectives.......................................................................................................28
4.2 Marketing strategy................................................................................................................30
4.2.1 Marketing Planning............................................................................................................. 30
4.2.2 Marketing Research............................................................................................................ 31
4.2.3 Market Segmentation.......................................................................................................... 32
4.2.4 Product Strategy....... ...........................................................................................................33
4.2.5 Pricing Strategy................................................................................................................. 35
4.2.6 Promotional Strategy........................................................................................................... 35
4.2.7 Distribution Strategy........................................................................................................... 41
4.3 Strategy Evaluation.................................................................................................................44
4.4 Constraints to the establishment o f Strategic marketing practices...................................44
5 SUMMARY, CONCLUSIONS AND RECOMMENDATIONS
5.1 Summary of results.................................................................................................................48
5.2 Limitations of study and recommendations for future research.........................................50
6. Select Bibliography................................................................................................................... 52
7. Appendix.....................................................................................................................................57
iv

LIST OF TABLES
Table 4.1: Perceived effect of political variables..................................................................... 20
Table 4.2: Perceived effect of economic Factors....................................................................... 21
Figure 4.3: Perceived effect of Socio-cultural.......................................................................... 21
Table 4.4: Perceived effect o f technological factors.................................................................22
Table 4.5: Percentage weighting of environmental factors.......................................................23
Table 4.6: Competitor knowledge by various dimensions........................................................24
Table 4.7: Existence of mission statement................................................................................27
Table 4.8: Existence of marketing objectives............................................................................29
Table 4.9: Existence of written marketing plans....................................................................... 30
Table 4.10: Responses on consumer research............................................................................ 31
Table 4.11: Estent of market segmentation................................................................................ 32
Table 4.12: Rating of segmentation variables............................................................................33
Table 4.13: Importance attached to product decisions.............................................................34
Table 4.14: Pricing objectives o f sugar firms.............................................................................35
Table 15: Use of advertising tools...............................................................................................36
Table 4.16: Use of public relations tools....................................................................................37
Table 4.17: Use of sales promotion............................................................................................ 38
Table 4.18: Use of personal selling.............................................................................................39
Table 4.19: Extent o f use of direct marketing............................................................................40
Table 4.20: Emphasis on different elements of promotional mix........................................... 41
Table 4.21: Factors considered important in the establishment of distribution channels...... 42

Table 4.22: Importance attached to marketing mix elements..................................................43
Table 4.23: Constraints in the establishment of marketing strategy....................................47
VI

acknowledgement
I feel indebted for this work to more people than I can ever mention. They were the critics
who helped mould the work. They gave their time and personal interest. I feel humbled by
their genuine concern.
My greatest tribute is to all my friends in the MBA programme. They were my greatest
inspiration and my greatest benefit. We shared numerous nights of 'trans-knighting' to
enable us beat the academic feat in view of the pressure imposed on us by office work.
There were many times we had to console each other but hard work carried the day at the
end of it all. I benefited tremendously from their insights.
I have a debt of gratitude to my supervisor, Professor F. N. Kibera, whom I can only
describe as "selfless". He had to bear reading through chunks of raw literature for the
umpteenth time. At unusual hours he was willing to sacrifice his time because he refused to
sacrifice quality. It gave me pride to be part of such a rigorous exercise.
I wish to single out Ms Margaret Ombok for special mention for the time she afforded. I
thoroughly benefited from her very strong views on the marketing discipline. I will always
remember her for the longest telephone call in my life. It lasted one and a half hours
because she had very very strong views on my proposal.
I wish to thank all the lecturers who congregated at the initial session for the presentation of
my proposal, and numerous others who taught me at various levels in the Programme. You
Vll

bore my stubbornness without offence. But it is in darkness, always, that the impact o f light
is fully felt. You were the light. Out o f your support, this work was bom and nurtured.
For whatever I am today, and whatever I seek to be, I will always remember you, dear
colleagues, for the moulding. I am not be able to thank you all individually, but please take
this as my appreciation.
Herbert A. Kassamani
November, 1999
viii

ABSTRACT
This study set to explore the state of strategic marketing in Kenya's sugar companies. The
study was founded on the premise that the sugar industry was going through turbulence in
face o f liberalisation but there was no conscious effort on the part of the industry to counter
this or to initiate strategies that would protect it against such eventuality in future. This
paradox led to the second objective of the study which was to explore the impediments that
hampered companies from initiating aggressive marketing in face of a scenario that had
seen other enterprises collapse.
The study confirmed the postulation that there was no serious marketing in most of the sugar
industries. Since strategy if about positioning oneself ahead of competitors, conclusions
derived were basically looked at from a competitive angle. Specifically, the following
findings were derived:
1. While the sugar industry was facing competition notably from imports, domestic players
did not regard themselves as real competitors fighting for similar markets as their production
was often below the required consumption. Thus, many did not see the point of spending
money and energy on marketing strategy.
2. The industry was still heavily regulated by government forces and decisions on, say,
going abroad, were still pegged on government authority. Thus, the companies could not
explore alternative markets at will even as their domestic markets were saturated.
3. All the sugar companies regarded their products as being qualitative and were therefore
confident that there was no differential advantage from the product o f competitors.
IX

Packaging was a new aspect one of the companies was exploring and it was felt that this
would give the company a major differential advantage once it is launched.
4. As a marketing tool, pricing was not available for manipulation in the marketing mix
because pricing decisions were taken at a Chief Executives forum that compelled the entire
industry to maintain a uniform pricing structure. These factors blocked the flexibility
required in competitive markets. Where the playing field is not level, the implementation of
marketing strategy becomes hard.
5. It was established that virtually no advertising was carried out by the industry. The
objectives o f advertising are to inform, persuade and remind consumers to buy. These
objectives would only thrive in markets that are characterised by numerous products.
Where consumption is higher than production, however, these objectives may not hold.
6. Distribution was perhaps the only variable that received emphasis but even for this, the4
amount of effort was limited as customers were often required to collect sugar from the
millers. But there was remarkable effort in choosing locations with many companies
keeping off the their competitors' zones.
The second objective of the study was to find out impediments to the establishment of
strategic marketing practices in sugar companies. The following factors were identified:
1. Deficiencies in production did not create cause to compete and consequently there was no
need for marketing strategy.
2. Government regulation of the industry did.not permit aggressive marketing. In fact there
were internal systems in companies that regulated the amount of sugar that could be sold to

a single customer. The purpose o f this regulation was to avoid hoarding and the
development of cartels who could buy entire consignments and hold the industry at ransom.
3. Lack of management support was detected in the development of the marketing function.
There were no budgets allocated to the function because many of them saw no good cause to
spend. They argued that they could after all sell their entire consignments without spending.
In view of these findings, the following would be the recommendations for management
consideration:
1. If the industry has to survive, there will be need to reduce the level of government control.
While this could be done through the proposed liberalisation, there is need to lobby for
urgent measures like the freedom to leave market forces to control the industry.
2. The local sugar industry appears unique in the sense of having local production higher
than consumption. Because of this, the industry has remained largely production focused.
There is need for managers to look at the fate that has befallen other enterprises in Kenya
and collect the ammunition before the actual war starts. The war is inevitable as more sugar
companies plan to enter the race giving consumers a wider choice.
3. There is need for the establishment of marketing departments in sugar companies. These
departments should be put at the start of the marketing chain and not as appendages o f other
departments.
XI

CHAPTER 1
INTRODUCTION
1.1 Background to the Study
Before independence, the sugar industry was predominantly a private sector enterprise, which
started with the establishment of Miwani and Ramisi Sugar Companies in 1922 and 1927
respectively. After independence, the Government of Kenya (GOK) started playing a central
role in the ownership of sugar companies. This led to the establishment of five more sugar
companies, namely, Muhoroni (1966), Chemelil (1968), Mumias (1973), Nzoia (1978) and
South Nyanza Sugar Company (Sony) in 1979. The West Kenya Sugar Company was later
established as a private enterprise in 1981 while Ramisi closed down in 1988.
The sugar industry has grown to be a significant player in the Country's economy, producing
two thirds of the domestic sugar requirements. In the earlier years of its establishment, the
sugar industry made substantial contributions to the Country's import substitution requirements.
With 336,439 metric tonnes of sugar produced locally in 1978, the Country saved about Kshs
49,652,190 (Obiero, 1980). In 1997, sugar sales recorded Ksh 6.64 billion at prevailing market
prices, making it the third largest agricultural commodity after tea and coffee. It is also
estimated that the industry supports 2 million people, representing 6 per cent of the Country's
population. Mumias, which is the lead player in the industry with a production of 900 tonnes of
sugar a day supports 43,000 farmers and 20,000 employees.
The industry contributes to the national economy and to rural development in several ways.
Besides generating employment and incomes for the rural population, it earns revenue to the
government through taxation (Odhiambo, 1986).
1

For many years, sugar marketing in Kenya was done under the ambit of the Ministry of
Commerce. "Every month, the Ministry used to send out directives (Sic) to sugar mills
instructing them how much to ship to each station on the rail line" (Frank, 1964). This situation
did not change much even with the establishment of the Kenya National Trading Corporation
(KNTC) in 1965 largely because the government continued to regard sugar as an "essential
commodity" and determined who got what quantities and at what price. The industry thus
became entrenched in a serious flux with production, importation, and marketing o f sugar
revealing serious policy contradictions and lack of co-ordination by government departments
and agencies charged with these responsibilities (Odhiambo, 1986).
Though KNTC was a monopolistic buyer, it was supposed to be a non-profit making
organisation with the sole purpose of ensuring equitable distribution of sugar and other essential
commodities (Odada, 1982). With KNTC's role reduced to that of distribution, hardly any
marketing could be said to have been taking place as both product, place and price were
manipulated. Promotion was almost non-existent.
Several bottlenecks stood in the way of individual efforts to market sugar. Getting a license for
distribution from KNTC was regarded as a license to make money (Gem, 1999). Problems
resulted from "inefficiencies arising from the system of appointment and remuneration o f sugar
wholesalers and retailers...(where) influence rather than efficiency was the basis for selection"
(Bayer, 1976). Despite the anomalies, the sugar companies were not allowed to sell directly to
distributors or retail outlets. Thus, they never developed their own marketing strategies.
2

In 1986, GOK through Sessional Paper No.l initiated far reaching economic reform measures
aimed at improving the performance of public enterprises. The measures entailed a reduction in
government spending, an abolition of price and market controls, selective withdrawal of
subsidies, privatization of state enterprises, tax reforms, and reforms of the financial sector.
Under the Structural Adjustment Programmes, (SAPS) some public enterprises were to be
restructured to make them more efficient while non-strategic ones were to be privatised. In
1992, the government issued another policy paper on public enterprise reform and privatization
in which it listed enterprises to be restructured or privatized. The list included, among others,
public enterprises in the sugar industry. The removal of controls and subsidies liberalised
markets with the result that massive sugar imports started entering the Country threatening to
cripple the sugar industry.
In a report titled "Finding the way out of the Sugar market crisis", presented at the 15th
International Sugar Council Session in Brussels (May, 1999), the International Sugar
Organisation (ISO) says that the sugar pile-up in factories in the world is expected to hit a
record level of 15 billion tonnes in 1999. These stocks represent 46 per cent of the annual
consumption as compared to 22 per cent in 1990.
As at mid-1999, a gloomy situation prevailed over the local industry with Mumias holding
73,000 tonnes of sugar worth Ksh 2.7 billion, while South Nyanza Sugar Company had 4,000
tonnes worth Ksh 152 million. According to Kenya Sugar Authority (KSA), the stock levels
for the entire industry at the end of 1998 was 80,173 tonnes (KSA, 1999: 6). The high stock
levels led to a situation where the sugar companies could neither pay their farmers not meet
their maturing bank loan obligations.
3

The stock piling in sugar companies can be attributed to economic recession and foreign trade:
"The current economic recession has deprived and eroded the purchasing power of consumers
who have mainly been in the lower and middle class. This has resulted into a change in
consumer preferences. The purchasing power is projected to have declined by about 30 per
cent since 1977 (KSA, 1999: 6-7). This situation is worsened by foreign imports where a total
of 186, 516 tonnes o f sugar were imported into the Country in 1998 as compared to 52,371
tonnes and 65,826 tonnes in 1997 and 1996 respectively.
For a long time, GOK has also been planning to build more sugar factories including one in
Busia and another one in Kericho. Should these factories become a reality, they will compound
the prevailing problem by making the marketplace more competitive. To survive in such an
environment, sugar companies must strategise. To be able to stand on their own, they need to
evolve and embrace strategic marketing practices. They have to dedicate themselves to sensing,
serving and satisfying the needs of customers in a well understood target market (Albrecht and
Zemke,1985).
Strategic marketing is crucial to an organisation because it takes into consideration fundamental
changes in the environment thus making firms proactive rather than reactive (Bett, 1995).
According to some authors, it is strategy that determines whether a firm excels, survives or dies
(Okutoyi, 1988).
Porter (1980) stressed that strategy had an important role in helping businesses position
themselves in industry. Effective strategy can enable a business influence its environment in its
favour, and even be able to defend itself against competition. Aaker (1992:72) also avers that
4

given the current strategic focus in business, there is need to understand competitor strengths in
the market and then position one's own offerings to take advantage of the weaknesses and avoid
head-to-head clashes against strengths.
With the increasing competition companies are facing today, rewards will go to those who can
best read customer wants by continuously scanning the marketing environment and delivering
greatest value to target customers. Therefore in the market place, marketing skills will separate
amateurs from professionals (Kipkorir, 1995).
Unfortunately for many sugar companies, marketing departments are still in their infancy. In
Mumias, for example, a formal Marketing Department was only established in June this year.
In the other Companies, there are either only sales departments or no formal marketing
departments at all. Marketing functions are therefore performed in a less formal way. For
instance, while sugar companies were reeling with large stocks in 1998, there were totally no
sugar exports realised for the whole of that year ( KSA, 1999:7).
There have been numerous studies on the sugar industry just as there have been on strategic
practices within various other industries. Those that have studied the sugar industry include
Obiero (1980), Obara (1976), Oduol (1974), Odada (1979), and Barclay 1974). These studies
are, however, done from a geographical, social or economic perspective. In fact many of them
are production-oriented studies in an era where the marketing concept is emphasised. Thus,
there is no study that has looked at Kenya's sugar industry from a marketing perspective.
5

In a study of the banking industry, Okutoyi (1988) found that there was a positive correlation
between strategic marketing and bank performance. The study concluded that the use of
strategic marketing was vital in adopting banks to changing conditions in the market and could
strengthen a bank's competitive position. Though the study emphasises the importance of
strategic marketing, it focuses on the financial sector of the service industry. His findings may
therefore not be generalisable to the entire physical product domain. It is this gap that the
current study seeks to fill.
1.2 Statement of the problem
Against a background of increasing competition and in view of marketing being a fairly new
phenomenon in the sugar industry, companies need to develop strategies that will make them
more competitive. This study examines the extent to which strategic marketing is practised by
sugar companies with a view to making recommendations that will enable them increase their
market share.
1.3 Objectives of the Study
The study has two objectives:
a) To assess the nature and extent of strategic marketing in Kenya's Sugar Companies.
b) To identify constraints Sugar Companies face in applying different strategic marketing tools.
6

1 4 Importance of the study
The Sugar Industry is an important sector in our economy. It is therefore expected that this
study will be beneficial to the following:
a) Marketers
Since marketing functions in the Sugar Companies are still evolving, it is hoped that the
knowledge generated by this study will enable the companies to improve their marketing
practices and sharpen their competitiveness.
b) Consumers
Sugar is currently in fourth position after maize, meat and milk in the budget of the average
Kenyan household ( Odhiambo, 1986). This study is expected to reveal strategic marketing
factors that Sugar Companies can embrace to serve their customers better. Thus, consumers are
expected to benefit from an improved customer service of an important household product.
c) Other stakeholders
If the study contributes to the improvement of marketing practices of sugar companies as
expected, then the level o f profitability will improve. This will in turn enable the companies to
meet their obligations to various stakeholders including farmers and employees.
d) The Country
If strategic marketing leads to a profitable sugar industry, then it is hoped that the entire Country
will be able to benefit from this through increased taxation and generation of employment
opportunities for its population.
e) Academicians
It is hoped that the study will, in its unique way, be a contribution to marketing knowledge and
will provide a basis for future research.
7

CHAPTER 2
LITERATURE REVIEW
2.1 Theoretical Literature
Marketing is a social and managerial process by which individuals and groups obtain what they
need and want through creating, offering and exchanging products of value with others (Kotler
1997:9). It consists of all activities designed to generate and facilitate any exchange intended to
satisfy human needs or wants ( Stanton 1987: 4).
As a management process, marketing has the role of influencing the level, timing and
composition of demand in a way that will help an organisation achieve its objectives. It is
responsible for identifying, anticipating and ensuring customer satisfaction profitably./
On the other hand, a strategy is a programme of goals and activities that help an organisation
achieve success. It is a plan, today, of what to do tomorrow. As a game plan, strategy describes
how objectives will be achieved.
Strategic marketing is crucial to an organisation because it takes into consideration fundamental
changes in the environment thus making organisations proactive rather than reactive (Bett,
1995). It is strategy that determines whether a firm excels, survives or dies ( Okutoyi, 1988).
Many companies face increasingly stiff competition and rewards normally go to those who can
best read customer wants by continuously scanning the marketing environment and delivering
greatest value to target customers. In the market place, marketing skills will separate amateurs
from professionals (Kipkorir, 1995).
8

The strategic marketing process involves conducting a situational analysis, determining
marketing objectives, selecting target markets, designing a marketing mix, preparing a
marketing plan, implementing the plan and controlling it.
Analysis is the critical starting point for strategic thinking. The purpose of a situation analysis is
to determine the features in a company's environment that will most directly determine the
strategic options and opportunities. The analysis is mainly concerned with identifying trends,
opportunities, threats, strengths and weaknesses, and questions that will influence strategy and
choice. The analysis seeks to establish where an organisation has come from, its present
circumstances, and how these are likely to bear on its future (Thompsonl972 :55). It provides
knowledge that will help the organisation build on past' successes and correct past failures.
Businesses undertake this analysis at two levels: external and internal.
External analysis entails an examination o f environmental forces that surround an organisation's
marketing programme. The information generated by this analysis is important because it
constitutes the opportunities a business may exploit and the threats it must shun. Key areas of
concern here are:
(i) Customer analysis: This is carried out to identify customer segments (needs, size, growth,
profitability) so that products can be matched with consumer needs.
(ii) Competitor analysis: The issue o f concern here is identifying who an organisation's
competitors are, their strengths, their weaknesses and their reaction patterns.
iii) Environmental analysis: This entails a review of political, economic, technological and
socio-cultural forces and their influence on a company's marketing practices.
9

The self or internal analysis identifies an organisation's strengths and weakness so that strategies
can be developed to exploit the strengths and to address weaknesses. This analysis involves a
detailed review of company's present marketing mix to identify unique distinctive
competencies.
Marketing objectives derive from the larger organisational goals enshrined in the mission
statement. It is the mission statement that defines the overall purpose for the existence of an
organisation. It clarifies the scope of the business, its product-market segments, the nature of
existing products, markets, and the functions a firm presently provides.
In market targeting, consumers who are likely to respond to the same marketing mix are
identified. This becomes the focal group to which the business will tailor its marketing effort.
An effective strategy should consider the size of target markets and the number of competitors
already in the market, and evaluate how entering the market will affect the firm's sales, costs,
and profits. Selected target markets must therefore be responsive, accessible, and profitable.
Once a specific segment has been identified, a marketing mix can be developed to target it. The
marketing mix comprises what has traditionally been known as the 4 Ps. These are product,
price, promotion, and place. These marketing mix elements are strategic weapons a firm can
use against its competitors. Porter (1980) suggests that low cost and differentiation represent
the two basic strategies available to firms and all successful strategies will involve one or both
of these thrusts.
10

Product, which is a key element in the marketing mix, is anything that can be offered to a
market for attention, acquisition, use or consumption that might satisfy a want or need
(Kotler, 1988). Products are important to marketers because they relate directly to the«
satisfaction of consumer needs. Product strategy should focus on quality, packaging, styling,
and branding.
A unique feature of sugar as a product is that in Kenya, it has largely not been differentiated.
Besides colour where there is brown and white sugar, there is little in form of product
differentiation. It is this undifferentiated aspect that could pose challenges to sugar marketing in
a competitive environment. In developed countries however, branding has led to differentiation.
If maize and wheat flours have been differentiated, then there must be ways the same can be
done to sugar.
Price, the second element of the mix, is the value placed on goods and services (Stanton, 1987:
260). It is what consumers (are willing to) pay for a product or service ( Kibera & Waruingi,
1988). Pricing is important in marketing strategy because it is the only variable that directly
generates revenues and which can easily be altered. It can therefore be an effective competitive
tool. In formulating pricing strategy, the marketer may choose from penetration, skimming,
vanable pricing strategies (discounts and allowances) and promotional strategies such as loss
leader pricing, special event pricing and psychological discounting (Is/was, odd/even).
Prior to trade and market liberalisation, sugar prices used to be regulated by GOK. This had
greatly influenced the degree to which pricing could be used as a promotional strategy in many
sugar companies. Mwebesa and Owiti (undated) argued that if price was left to fluctuate with
market conditions, low prices on world markets would lead to cheap sugar flooding local
11

markets at the detriment of the local industry. This became true with liberalisation but what the
study failed to project were the strategies that the industry would require should this scenario
arise.
The third element of the marketing mix is promotion, which is used to inform and persuade the
market regarding an organisation's products or services. The Promotional mix comprises
advertising, personal selling, sales promotion and public relations. Even the most
want-satisfying product will be a failure if no one knows it is available ( Stanton, 1987: 418).
There is little one gets to hear of regarding this element in the sugar industry.
Distribution, the fourth element of the marketing mix, has an enormous impact on consumer
acceptance and overall economic performance. Channel design must consider the markets to be
served and the specific needs of consumers within those markets. Firms should analyse
consumer needs for product outputs, establish channel objectives, and set channel strategies in
terms of coverage, exposure and support required for the channel. Firms must determine which
channel is best for use given the degree of control sought, the cost of operating the channel, the
possibility of gaining a competitive advantage and the degree of integration desired. Once these
strategies have been identified, a marketing plan may be prepared and implemented.
2.2 Empirical Literature
There have been numerous studies on the sugar industry just as there have been on strategic
practices within various other industries. However, no known study has looked at Kenya's
sugar industry from a marketing strategy perspective.
12

A lot of the existing literature on the sugar industry can be classified as "impact studies". In a
study of the West Kenya Sugar Industry, Obiero (1980) analysed the impact of the company's
establishment on national development. Other studies that have taken a geographical
perspective of the industry include Obara (1976) and Oduol (1974). Odada (1979) took an
economic perspective to examine the role of the sugar industry on the Kenyan economy while
Barclay ( 1974) examined the social impact of Mumias Sugar Company's establishment.
1There have also been a number of studies of the industry from a policy perspective. Mwebesa
and Owiti (undated) studied policy issues relating to the production and marketing of sugar and
the implications such policies suggest for the future of the sugar industry. Coughlin et al (1986)
looked at issues relating to ownership, employment, and production practices of the sugar
companies. Frank (undated) analysed policy questions relating to the expansion of the industry
in developing economies.
Odhiambo (1978) took a more general perspective studying the organisational structure of
Kenya's sugar industry and how this affects performance at farm, factory and consumer levels.
The study recommends a structural re-organisation to ensure more links between the sugar
factories and the farmers so that the latter can improve their yields for adequate cane supply.
The underlying assumption in production-oriented studies is that sugar sells itself. They
propagate the production concept where focus is on improvement of production efficiency. In
liberalised markets, however, competition tends to increase. As such, this emphasis on
production can no longer hold. Thus, the sugar Companies are expected to adopt effective
marketing strategies to survive.
13

In a study of the banking industry, Okutoyi (1988) found that there was a positive correlation
between strategic marketing and bank performance. The study concluded that the use of
strategic marketing was vital in adopting banks to changing conditions in the market.
The studies cited do not touch on the marketing o f sugar. As earlier mentioned, many of them
are also production-oriented studies in an era where the marketing concept is emphasised. This
study therefore tries to fill the gap created by the absence of strategic marketing literature on the
sugar industry.
14

CHAPTER 3
RESEARCH DESIGN
3.1 Population of the Study
The population of interest included all Sugar Companies currently operational in Kenya. Kenya
Sugar Authority’s publication Yearbook of Sugar Statistics (1998) indicated that there are seven
I such companies. Since the population was small, the study covered all the seven companies.
! No sampling was therefore required. The census approach used in this study has also been used
j successfully by Bett (1995) in the study of strategic marketing of dairy products in Kenya;
Okutoyi ( 1988) in the study of strategic marketing in the banking industry, and by Bii (1992) in
the study of promotional mix elements by Kenya's commercial banks.
3.2 Data Collection
The relevant primary data was collected using a semi-structured questionnaire (appendix 1). The
questionnaire carried questions on whether the subjects carried out any form of environmental
analysis as a first step in the establishment of strategic marketing plans. Data was then
collected on the existence of marketing plans, mission statements and marketing objectives. A
bigger part of the questionnaire however focused on marketing strategy, where attention was
focused the extent to which the companies emphasised the various elements of the marketing
mix namely product, price, promotion, and place. Data on the second objective of establishing
obstacles in the implementation of strategic marketing activities was collected through non-
structured questions to allow the researcher to pick out unexpected information as well.
I The ui,ae s tegic marketing activities investigated were derived from a model by skinner, which
zs slightly modified to include the component of strategy evaluation. The model formed the
15

yardstick that measured the existence of marketing strategy in the subjects.
The questionnaire was administered personally to Sales and Marketing managers or other
officers in charge of marketing activities in each sugar company. This method of interview was
; c ho sen for its flexibility. It enabled the researcher to explain and clarify certain concepts that
may have not been clear particularly in smaller companies where the education level of a bulk
of the workforce was low. The method was also suitable for its low costs and high rate of
response. In fact a response rate of one hundred per cent was realised. This was crucial in view
of the small number of the subjects involved.
3.3 Data Analysis
Once the data was collected, it was analysed using descriptive statistics. This was deemed
suitable in view of the study’s objectives.
3.3.1 Measurement of results
Pertinent questions and/or statements were used to test the existence or otherwise of a
phenomenon. A phenomenon or activity was only said to exist if more than half the sample
responded affirmatively. For instance, to draw conclusions on whether firms undertook
competitor analysis, it was required that they be able to identify their competitors by name,
demonstrate knowledge of competitor’s objectives, market share, profit levels, strengths and
weaknesses. These factors would then constitute the parameters for analysis so that if a firm
undertook more than half of them, then it was said to be undertaking competitor analysis.
Similarly, if more than half the firms in the industry stated that they undertook any particular
activity, then the response was generalised to apply to the entire industry.
16

3 3.2 Operational Definitions of Variables
A. Situational Analysis
The study explored the degree to which sugar companies undertook customer, competitive,
market, environmental analysis, and self-analysis. Customer analysis is done through market
research . The questionnaire asked respondents to indicate whether their companies undertook
any form of consumer research as a basis for their programmes.
External Analysis
The study explored the degree to which firms undertook customer analysis, competitor analysis
market analysis.
17

Customer Analysis- Measured in terms of degree of segmentation carried out by the firms. .
Competitive Analysis- Measured in terms of ability to identify competitors, their objectives,
strengths and weaknesses, strategies, and levels of performance.
Environmental analysis- Here, the study was concerned with the impact of political,
economic, socio-cultural, and technological factors in the marketing of sugar.
C. Self-Analysis
This was measured in terms of whether companies understood their strengths and weaknesses,
whether they had mission statements, whether they had written marketing objectives, and
whether the objectives derived from the mission statement.
Marketing Strategy
The study looked at the factors emphasised in the product, price, promotion and distribution
decisions of the companies.
Product- This was defined in terms of quality, brand name, packaging and services.
Respondents were asked to rate the importance their firms attached to each of these attributes.
Price-The study explored the pricing methods used.
Promotion- The study explored the extent to which sugar companies used the tools o f sales
promotion, advertising, personal selling, public relations, and direct marketing.
Place- The study sought to establish the channels of distribution used, and the factors
considered important in channel selection.
D- Strategy Implementation and Evaluation'T 'l
e study sought to establish whether marketing plans existed and whether the plans were
evaluated to determine success and how often this evaluation was carried out.
18

CHAPTER 4
DATA ANALYSIS AND INTERPRETATION
■fhe analysis of data was done in relation to the objectives the study sought to establish namely
identifying the nature of strategic marketing practises in Kenya's sugar companies and the 1 *
constraints the sugar companies faced in applying strategic marketing tools. Findings on these
I two objectives are discussed below:
A. The nature and extent of strategic marketing practices
Strategic marketing management encompasses:-
1. Understanding of the marketing environment
2. Formulation o f marketing objectives
3. Development of the marketing programme
4. Implementation of programme
5. Evaluation of programme
4.1 The Marketing Environment
Strategy tries to relate an organisation to its external environment. This environment includes
political, economic, socio-cultural and technological forces. Data on how companies were
affected by the external environment are listed in table 4.1 below:
19

Table 4.1 Perceived effect of Political Variables
Variable Very Much A little Not at all Total
N % N % n % N %
Laws 3 43 4 57 0 0 7 100
Political
Interference
3 43 3 43 1 14 7 100
Uncertainty/
Strife
3 43 3 43 1 14 7 100
Corruption 6 86 1 14 0 0 7 100
KSA 4 57 3 43 0 0 7 100
Total number
of mentions
19 54% 14 40% 2 6% 35 100
Nineteen out of a possible number of 35 responses indicated that businesses were affected “very
much” by a combination of political factors. This represents 54 per cent of the population.
Fourteen (40 per cent) of the total number of responses indicated that businesses were affected
just “a little” by political factors. Only 6 per cent of the total number of responses indicated that
businesses were not affected at all by two of the political variables listed. Corruption was
singled out as the key culprit that affected sugar marketing. No Company indicated that it was
free from the effects of corruption.
The economic environment determines the power consumers have to buy a product. Table 4.2
below illustrates the extent of influence economic factors have on sugar marketing.
20

table 4.2: Perceived effect of economic factors
Very much A little Not at all Total
N % N % N % N %
Tnflarion 5 71.4 2 28.5 “ “ 7 100
Interest rates 6 86 1 14 - 7 100
’Monetary policies 5 71 2 29 - 7 100
Income 5 71 2 29 - “ 7 100
Total number of mentions 21 75% 7 25% 0 0 28 100
t
Out of a possible 28 responses, 21 (75 per cent) indicated that their operations were affected
“very much” by a combined force of economic factors. General interest rates were perceived to
affect business with 6 companies (86 %) saying they were affected “very much”. Only two (29
%) companies said they were affected “a little” by inflation. All the companies were affected at
least in some way by a combination of the economic variables that were tested.
The table below illustrates how socio-cultural factors were perceived to affect sugar marketing:
Table 4.3: Perceived effect of Socio-cultural factors
Very Much A little Not at All TotalN % n % n % N %
Lifestyle 1 14 2 28 4 57 7 100
PressureJjfoups
“ 1 14 6 86 7 100
Religion “ - 1 14 6 86 7 100
beliefs/.Attitudes
1 14.3 1 14.3 5 71.4 7 100
Total 2 7% 5 18% 21 75% 28 100
21

Socio-cultural factors were perceived to affect sugar marketing least with 21 out of a possible
28 (75%) responses indicating "No effect at all". Only 7 per cent of the mentions indicated that
two of the four socio-cultural variables listed affected their business “very much”. Eighteen per
cent indicated they were affected just “a little” by the variables.
A large number of respondents identified technological factors as having a major effect on their
businesses. These findings are contained in table 4.4 below:
Table 4.4: Perceived effect of technological factors
Very Much A little Not at All Total
N % N % N % N %
New Technology 4 57 2 29 1 14 7 100
Cost of 5 71 - - 2 29 7 100
Technology
Total 9 64% 2 14% 3 21% 14 100
Nine out of 14 (64%) responses indicated that technological variables affected their businesses
“very much”. Twenty one per cent of the responses indicated technology as being insignificant
in sugar marketing. Four of the companies ( 57%) indicated that technological innovation was a
very important variable in sugar marketing with those that lacked it standing chances of
business loss. Despite this acknowledgement, 71 per cent of the companies saw the cost of
technology as being prohibitive to the extent of affecting their marketing operations. These
findings could be interpreted in the context of Mumias acquisition of a diffuser cane milling
facility, which had put the company ahead of its counterparts both in the quantity and quality of
22

sUgar the company can produce. Being the only company with the diffuser technology, the
company was seen to enjoy a competitive advantage.
Overall, a majority of the Sugar companies were aware of the manner in which external
environmental factors influenced their businesses. A summary of each of the variables studied is
presented in table 4.5 .
Table 4.5 Percentage weighting of environmental factors
Very Much A little Not at all Total
Political 54 40 6 100
Economic 75 25 “ 100
Socio Cultural 8 20 72 100
Technological 70 15 15 100
The table shows that economic factors weighed more heavily on businesses with a tally of 75
per cent in the affirmative, followed by technological factors with a tally of 70 per cent. Socio
cultural factors had the least impact on businesses with a tally of 8 per cent.
4.1.2 Competitor Analysis
Unless a firm pays attention to what competitors are doing, it ends up 'flying blind' into battle
(Thompson 1980:56). A firm cannot outmanoeuvre its rivals without monitoring their actions
and anticipating what moves they are likely to make next. The strategies rivals are using and
the actions they are likely to take next have direct bearing on what a company's own best
strategic moves are - whether it will need to defend against rivals’ actions or whether rivals’
^oves provide an opening for a new offensive thrust.
23

The research questionnaire sought to find out whether the Sugar Companies knew who their
competitors were, what their competitors’ strengths and weaknesses were, and what the
companies own strengths and weaknesses were. Table 4.6 below illustrates the findings.
Table 4.6 : Competitor knowledge by various dimensions
Competitor Competitor Competitor Competitor Total
Name % Objectives % Market
Sales
% Market
Share
%
Yes 7 100 2 29 2 29 2 29 13
No 5 71 5 71 5 71 15
Total/
7 100 7 100 7 100 7 100 28
These findings indicate that in general all the Sugar Companies knew who their competitors
were perhaps because of the smallness of the industry. Over 72 per cent did not however, know
the objectives of their competitors, what their strategies were and market share commanded. It
is therefore plausible to conclude that many did not carry out any form of competitor analysis.
An interesting dimension was that the sugar industry was one among those industries where
'competitors' meet in workshops to discuss the marketing activities they intend to initiate. Firms
in the industry still operated as a cartel where the various players met to agree on common
pricing and other matters of interest. In some cases, sugar was produced as customers waited
and so there were no stocks carried over to the following day. Liaisons were detected between
24

various personnel handling marketing functions particularly in the smaller companies and
customers could be exchanged at will whenever there were queues in one factory and the other
did not have. Managers interviewed in these firms felt there was no need spending money on
intelligence systems or other marketing activities like advertising.
Only between the two lead players, Mumias and Nzoia, was a sense of competition detected. In
fact there was evidence that marketing intelligence activities existed between the two with
intelligence information gathered sometimes on a daily basis.
When it came to analysis of competitor strengths, Mumias was generally viewed by other
manufacturers as the market leader with a competitive advantage in advertising, distribution,
and pricing. The study revealed that it was the only company that had a substantial marketing
budget and was engaged in various promotions. Because of its size, it was seen to enjoy
economies of scale that enabled it to offer discounts and credit sales.
While its distribution network was viewed by some as a strength, others viewed it as a weakness
as it was able to hold large inventories in warehouses thus concentrating the costs and risks on
itself. Competitors holding this view felt that lack of a distribution network was a strength for
themselves as they were able to pass title of goods immediately on production.
This notwithstanding, it was obvious that no purposeful competitor analysis was earned out and
even where some information on competitors existed, it was brief, scanty and therefore
inadequate for guiding purposeful strategy.
25

4.1.3 Internal Analysis
Internal analysis is a systematic identification of organizational strengths and weaknesses.
Effective strategy maximises a firm's strengths and opportunities and minimises its weaknesses
and threats. Strengths are distinctive competencies that can be matched with projected market
opportunities, while weaknesses are limitations that impede a firm's effective performance.
Results of this study indicated that the Sugar Companies employed a measure of internal
analysis with conscious efforts to track their sales and level of profitability, sometimes on a
daily basis. Six o f the firms, (86 %) associated their product with quality, and consequently a
measure of strength in the market. One firm, representing (14 % of the population) thought it
had no strength in either quality, price, promotion or distribution.
The ability to have appointed distributors or agents was seen as a strength in the industry. Five
of the firms (71 %) said they had such distributors. One firm (14 %) had depots in selected
towns in the country and viewed this as its own strength. Other strengths included flexibility in
pricing and an ability to engage in promotion, which gave Mumias a differential advantage.
The study revealed that only two firms (29 per cent) were aware of how the internal
environment impacted on performance of their products in the market. No formal effort at
internal analysis could be detected beyond profitability analysis on the part of the other firms.
4.1.3.1 Mission statement
A mission statement defines the business a firm wishes to pursue, the markets it wishes to enter,
the products it wishes to sell, the customers it wishes to serve, and the manner the firm would
26

wish to deliver this service (Pearce and Robinson, 1991). The relevant responses for the study
are contained in table 4.7
Table 4.7: Existence of mission statement
| Response Response Percentage
Yes 2 29
No 5 71
Total 7 100%
n=7
Only two (29%) of the companies surveyed mentioned that they had a mission statement. One
statement read in part:
/
"To be the leading white sugar producer (sic) with the highest returns to shareholders and
farmers in the sector. We will endeavour to be the most efficient producer (sic) of sugar using
the best technology available in the sugar industry..."
The other company alluded to the existence of a statement that is "used in Agricultural Shows" .
It read: "Assist in enabling smooth Kenyan farmers’ (sic) lives."
These statements identify production as the core-business for the respective Sugar Companies.
Since they do not allude to marketing dimensions, they may not serve as relevant instruments
for deriving marketing objectives. They therefore provide a weak basis for the foundation of
marketing strategy.
27

The total absence of written mission statements in the rest of the companies suggests that these
companies have no initiative nor the commitment required for strategic marketing practices.
4.1.3.2 Portfolio analysis
Portfolio strategy examines the small business units (SBUs) an organisation is involved in, and
determining how each SBU will compete in given markets. Besides trading in sugar, all the
Companies studied were involved in at least one other business, namely, sugar cane farming in
the nucleus estates and trade in Molasses. These businesses were, however, seen as part and
parcel of the sugar business as farming was aimed at generating raw materials for sugar
production while molasses came in as a by-product of sugar processing. The two were therefore
not treated as important business units for which a different marketing mix could be formulated.
4.1.3.3 Marketing Objectives
Objectives represent a managerial commitment to producing specified results in a specified time
frame. They provide a basis for the what, how and when of performance and as a consequence
convert a company's mission into performance measures and outcomes.
The current study sought to determine the extent to which the Sugar Companies formulate
objectives for their marketing functions and whether these objectives were consistent with the
mission statement. Companies were asked to rank a set of objectives in terms of their relative
importance. A score sheet was developed where an objective that was ranked first scored 4
points while the last scored 1 point. Since the objectives were 5, the maximum score was 20
points. The points were totalled to give the tally below:
28
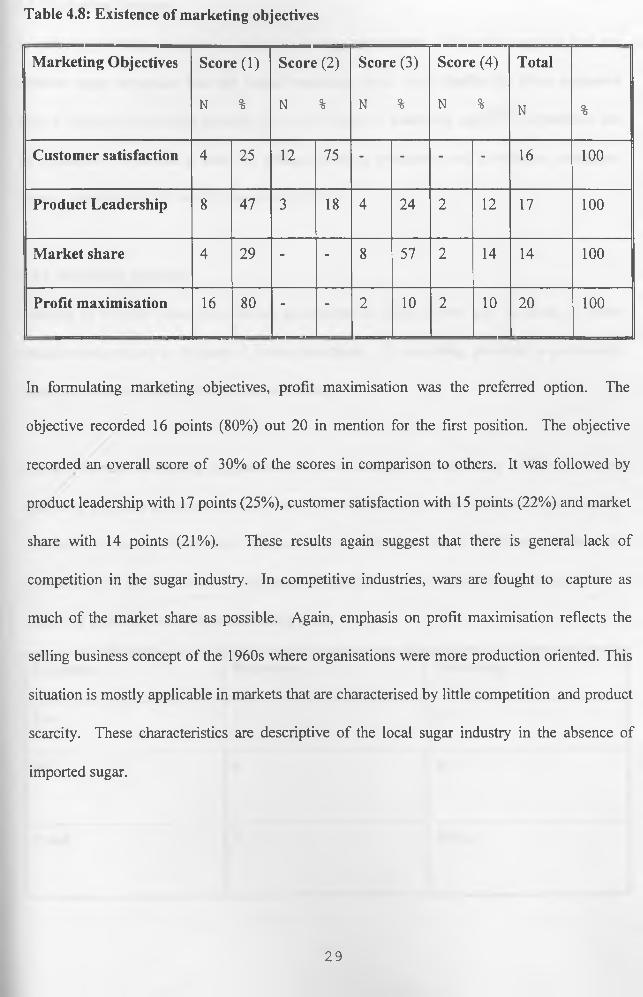
Table 4.8: Existence of marketing objectives
Marketing Objectives Score (1)
N %
Score(2)
N %
Score (3)
N %
Score(4)
N %
Total
N %
Customer satisfaction 4 25 12 75 - - - - 16 100
Product Leadership 8 47 3 18 4 24 2 12 17 100
Market share 4 29 - - 8 57 2 14 14 100
Profit maximisation 16 80 - - 2 10 2 10 20 100
In formulating marketing objectives, profit maximisation was the preferred option. The
objective recorded 16 points (80%) out 20 in mention for the first position. The objective
recorded an overall score of 30% of the scores in comparison to others. It was followed by
product leadership with 17 points (25%), customer satisfaction with 15 points (22%) and market
share with 14 points (21%). These results again suggest that there is general lack of
competition in the sugar industry. In competitive industries, wars are fought to capture as
much of the market share as possible. Again, emphasis on profit maximisation reflects the
selling business concept of the 1960s where organisations were more production oriented. This
situation is mostly applicable in markets that are characterised by little competition and product
scarcity. These characteristics are descriptive of the local sugar industry in the absence of
imported sugar.
29

A marketing strategy is a plan of action to outstage competitors. This study sought to find out
whether sugar companies had any formal marketing plans and whether the plans emanated
from a systematic marketing research. It is on the basis of marketing research that markets can
be segmented to provide a basis for product, pricing, promotion and distribution strategies.
These variables were all tested by the questionnaire.
4.2.1 Marketing planning
Planning is a major basis upon which predictions of future events can be made. It helps
organisations prepare in the face of future uncertainty. In marketing, planning is particularly
important because market demands are not static.
In order to make marketing programmes forward looking, it is necessary to have a written
marketing plan that anticipates future needs so that resources can be mobilised to address the
dynamism of market requirements. Respondents were therefore asked to indicate whether their
Companies had any written marketing plans. The relevant data are contained in the table4.9
4.2 Marketing Strategy
Table 4.9 Existence of written marketing plans
Response Responses Percentage
Yes 1 14
No 6 86
Total 7 100%
30

Despite the importance of planning in today's business, only one company (14%) had a formal
marketing plan. Six companies (86%) did not have any written marketing plans. But even in
the one company, the plan was not written and its marketing department was said to be in the
process of compiling one. This represents ad hoc marketing in the sugar industry. Given this
position, Marketing programmes are likely to be erratic, less efficient, and therefore less cost-
effective.
4.2.2 Marketing Research
In the 21st Century, consumers are at the beginning of the marketing chain. Their needs and
wants are paramount to any marketing effort. Businesses must therefore find out what
consumers need and want through marketing research. The current study sought to find out
whether Sugar Companies make an effort to understand these needs through marketing
research. The research findings are contained in table 4.10
Table 4.10 Responses on consumer research
Type of response Number Percentage
Yes 3 43
No 4 57
Total 7 100%
N=7
Only 43 per cent of the population indicated that they undertake some research before
formulating their marketing programmes. Some 57 per cent of the Companies waited for
31

consumers to go to them and did not worry about consumer needs. This again is characteristic
o f industries operating in sellers markets.
The Companies which said they conducted some form of marketing research reported that
consumer needs revolved around factors such as quality of sugar, convenient packaging,
suitable pricing and fast service.
4.2.3 Market Segmentation
Consumers are generally heterogeneous and if they are not segmented into specific groups to
target, a lot of wastage will be realised in the marketing effort. Marketers who try to satisfy
everybody may end up satisfying nobody as more effort may be spent addressing the wrong
group.
/
The study sought to explore whether the Sugar Companies carry any forms of market
segmentation. The relevant results are presented in table 4.11.
Table 4.11 Extent of market segmentation
Response Frequency Percentage
Yes 3 43
No 4 57
Total 7 100%
32

Forty three percent (43%) of the respondents answered in the affirmative while 57% gave a
negative answer. Over 70 per cent of the firms said that geographical location was the most
important basis for their segmentation. Table 4.12 contains pertinent data for the other
segmentation variables.
Table 4.12 Rating of segmentation variables
Segmentation Variables No of mentions Percentage
Geographical location. 5 62.5
Income 1 12.5
Social Class 1 12.5
Volume 1 12.5
Total 8 100
N=7
4.2.4 Product strategy
The study yielded the data below (Table 4.13) on the kind of emphasis product decisions
received.
33

Table 4.13 Importance attached to product decisions
Very
Important
n %
Important
n %
Indifferent
n %
A little
Important
n %
Not
Important
N %
Total
N %
Quality 6 86 1 14 “ " “ - - 7 100
Variety 2 28.5 2 28.5 “ " “ • 3 43 7 100
Packaging 4 57 2 29 1 14 - “ “ - 7 100
Branding 3 43 1 14 1 14 1 14 1 14 7 100
Service 1 71 2 29 • “ - “ 7 100
Total 16 53% 8 27% 2 7% 1 3% 3 10% 30
Quality was ranked as the most important attribute (86% of sample) in the product decisions of
the firms studied. This was followed by service (71% ). The least ranked attribute was variety
(43%).
Packaging
The appearance of a product is of vital importance to a vast range of fast consumer goods,
which are generally sold through self-service outlets. The package provides a critical visual
cue at the point of sale, acting both as a reminder and a distinguishing feature (Baker,
1992:350). The package must also provide the user with information concerning its contents.
The study data revealed that 57 per cent of the consumers regarded packaging as extremely
important. Therefore, Mumias was planning to pack its sugar in smaller packages to facilitate
branding o f the commodity.
34

4.2.5 Pricing strategy
A majority o f the Companies (57%) said that they set their prices to recover costs, compete, and
survive in their markets. The other relevant responses on this variable are presented in table
4.14.
Table 4.14 Pricing objectives of sugar firms079418̂ °
N u m b e r o f M en tio n s P er c e n ta g e
(n ) (% )
P ro fit m a x im isa tio n 3 16.6
C o m p e tit iv e p r ic in g 4 22.2
V a lu e -b a se d p r ic in g 1 5.5
P r ic in g b e lo w c o m p etitio n
y2 11.1
F r e q u e n c y o f c o n su m p tio n - -
S u r v iv a l 4 22.2
C o st r e c o v e r y 4 22.2
T o ta l 18 100%
Pricing was cited as the main factor behind the slack in sugar markets as prices for Kenya's
sugar tended to be higher than those of other world markets.
4.2.6 Promotional strategy
Promotion plays a major role in creating awareness, conditioning perception of facts, suggesting
subjective associations and benefits which are important when there is apparent objective parity
U N IV E R S IT Y O F N A IR O B I L IB R A R Y
35

between two or more competing alternatives ( Baker 1992:422). Thus the current study sought
to establish the extent to which the Sugar Companies employ promotional mix elements of
advertising, public relations, sales promotion, personal selling and direct marketing.
Findings of the study, illustrated in table 4.15 below, showed that advertising did not receive
much emphasis in the sugar industry. This means that the industry was losing on the objectives
of advertising namely informing, convincing, and reminding. These findings concur with the
earlier observation that competitive marketing was not a major feature in the industry.
Responses indicating that certain tools are not used at all dominated the findings. Except for
newspapers and directories, all the other advertising tools were not used at all.
Table 4.15 Use of advertising tools
Always Sometimes Not at all Total
n % n % n % N %
Radio “ “ 1 14 6 86 7 100
Television “ “ 1 14 6 86 7 100
Newspapers “ “ 4 57 3 43 7 100
Magazines “ “ 3 43 4 57 7 100
Brochures - “ 2 28 5 71 7 100
Billboards " " 1 14 6 86 7 100
Shop signage • “ 1 14 6 86 7 100
Directories 1 14 3 43 3 43 7 100
Transit media 1 “ ” “ 7 100 7 100
Total 2 4% 16 30% 36 67% 54 100%
36
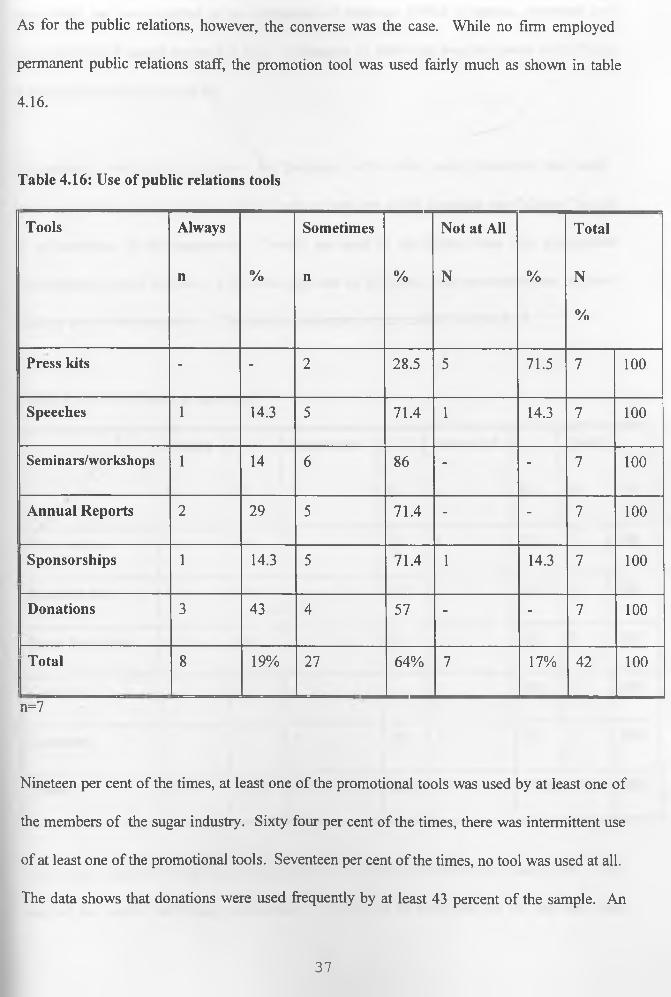
As for the public relations, however, the converse was the case. While no firm employed
permanent public relations staff, the promotion tool was used fairly much as shown in table
4.16.
Table 4.16: Use of public relations tools
Tools Always
n %
Sometimes
n %
Not at All
N %
Total
N
%
Press kits - - 2 28.5 5 71.5 7 100
Speeches 1 14.3 5 71.4 1 14.3 7 100
Seminars/workshops 1 14 6 86 - - 7 100
Annual Reports 2 29 5 71.4 - - 7 100
Sponsorships 1 14.3 5 71.4 1 14.3 7 100
Donations 3 43 4 57 - - 7 100
Total 8 19% 27 64% 7 17% 42 100
n=7
Nineteen per cent of the times, at least one of the promotional tools was used by at least one of
the members of the sugar industry. Sixty four per cent of the times, there was intermittent use
of at least one of the promotional tools. Seventeen per cent o f the times, no tool was used at all.
The data shows that donations were used frequently by at least 43 percent o f the sample. An
37

intermittent use was reported in the utilization of seminars (86%) of sample, speeches and
sponsorships and annual reports (71.4%). Utilization of press kits was the lowest with 71.4%
of sample indicating no use at all.
Respondents were asked to indicate the frequency with which sales promotion was used.
Findings indicate that 23 per cent of the times, at least one of the elements was “always” in use
by at least one of the companies. Twenty per cent of the times, there was intermittent
(‘sometimes’) use of the tools. Fifty seven per cent of the times, sales promotion was not used
at all by any of the companies.. The relevant responses are contained in table 4.18.
Table 4.17: Use of sales promotion
Always Sometimes Not at All Total
N % n % n % N %
Give-aways 2 29 1 14 4 57 7 100
Trade shows 5 71.4 1 14.3 1 14.3 7 100
Price discounts 1 14 3 43 3 43 7 100
Coupons - - 7 100 7 100
Contests - - 2 29 5 71 7 100
Total 8 23% 7 20% 20 57% 35 100
Trade shows appeared to be the main promotional tool the Companies were using with 71 per
cent of the sample indicating participation. This could be explained by the fact that these
38

companies have normally exhibited under the umbrella o f the Kenya Sugar Authority. Given
the nature of government share holding in the Companies, and the way Shows are regarded as
government initiatives, the Companies may have felt obliged or forced to participate.
Personal selling was defined to include forms of contact with customers, which required
interpersonal communication at point of sale. The degree o f utilization of this tool is illustrated
below.
Table 4.18: Use of personal selling
Always
n %
Sometimes
n %
Not at all
n %
Total
N %
Sales Reps 2 29 “ " 5 71 7 100
Agents 3 43 2 29 2 29 7 100
T o ta l n u m b e r o f
m en tio n s
5 36% 2 14% 7 50% 14 100
Personal selling was less utilised perhaps because sugar is not a technical product that would
require the explanation of a sales force . Similarly, Sugar Companies did not have their own
retail outlets where they could control the personal selling effort. The Study revealed that over
71 per cent of the Companies did not use personal selling at all. Twenty nine percent used
sales representatives while 43 per cent used agents. Thirty six per cent of the sample used at
least one of the personal selling tools “always”. Fourteen per cent used them “sometimes”
while 50 per cent never used the personal selling at all. The study also asked respondents to
indicate the degree to which direct marketing was used in their businesses.
39

Table 4.19 below indicates the findings.
Table 4.19 Use of direct marketing
Always
N %
Sometimes
n %
Not at all
N %
Total
n %
Mail 3 43 “ “ 4 57 7 100
Telephone 5 71 2 29 - “ 7 100
Brochures “ " 1 14 6 86 7 100
E-Mail “ • “ • 7 100 7 100
Total no of
responses
8 29% 3 11% 17 61% 28 100
Telephone was the most frequently used tool (71 percent of sample), followed by mail (43 per
cent). A hundred per cent of the sample indicated that Electronic mail (E-mail) was not used at
all in their marketing. Taken together, direct marketing tools were used 29% “always”, 17%
“sometimes” while 61% of the responses indicated that direct marketing is never in use any
time.
To sum up, a comparison of the elements in the promotional mix showed that public relations
(57%), personal selling (29%), and packaging (43%) were rated more important than
advertising and sales promotion. Advertising was rated least important (57%) followed by
personal selling (43%) (Table 4.20).
40

Table 4.20 Emphasis on elements of promotional mix
Very
Important
n %
Important
n %
Indifferent
n %
A little
Important
n %
Not
Important
n %
Total
N %
Advertising 1 14.3 “ 1 1 14.3 4 57 7 100
Sales
Promotion
1 14 1 14 1 2 29 2 29 7 100
PR 4 57 1 14 “ - “ - 2 29 7 100
Personal
selling
2 28 1 14 1 14 3 43 7 100
Packaging 3 43 1 14 “ “ 2 29 1 14 7 100
Total number
Of responses
11 31% 4 11% 3 9% 5 14% 12 34% 35 100
Taken together, 31% of promotional elements were regarded as being very important, 11% as
being a little important, 34% as not important while 9 per cent of the responses were indifferent.
Companies studied did not have any programmes to evaluate their promotional effort, so they
could not establish the effectiveness of whatever little promotion they undertook.
4.2.7 Distribution strategy
Distribution entails making products available to consumers when and wherever they want
them. Distribution management involves employing intermediaries to facilitate movement of
products from points of production to points of consumption. All the companies in the study
41

said that they employed a four step distribution network. The flow of goods was generally from
the producer to a wholesaler to a retailer and finally to the consumer.
The factors which are considered in selecting the intermediaries are summarised in, table 4.21
Table 4. 21 Factors in the Establishment of Distribution Channels
V e r y
Im p o rta nt
S o m e w h a t
Im p o rta n t
In d ifferen t
(n eu tra l)
S o m e w h a t
u n im p o rta n t
N o t
Im p o r ta n t
T o ta l
N % n % n % n % n % N %
A c c e ss ib ility 3 43 1 14 1 14.3 - - 2 29 7 100
M a r k e t
c o v e r a g e
4 57 1 14.3 1 14.3 1 14.3 7 100
G eographical
Dispersion
5 71.4
'
1 14.3 1 14.3 7 100
C o st o f
ch a n n e ls
2 29 1 14 1 14.3 1 14 2 29 7 100
C o m p e tit iv e
a c tiv it ie s
2 29 1 14.3 1 14.3
'
3 43 100
T o ta l
n u m b e r o f
r esp o n ses
16 46% 3 9% 4 11% 3 9% 9 26% 35 100
42

When the various factors that determine channel selection were considered together, 46% of
responses said they were very important, nine per cent said they were somewhat important, 26
per cent indicated they were not important while 11 per cent were neutral. Both market coverage
(57%) and geographical dispersion (71%) were considered important factors in selecting a
distribution channels. Competitive activities were considered least important by 43 per cent of
the sample.
When the marketing mix elements were considered together, responses were biased in favour of
pricing and distribution strategies. These two factors received a greater scores of 57 per cent
(table 4.22) which rates them as being “very important”.
Table4.22 Importance attached to various marketing mix elements
Very
Important
Important Indifferent A little
Important
Not
Important
TOTAL
N % n % n % n % n % N %
Product
innovation
1 14.3 1 14.3 1 14.3 1 14.3 3 43 7 100
Pricing 4 57 2 - - 1 14 - - 7 100
Advertising
1 14.3 1 14.3 1 14.3 3 43 1 14.3 7 100
Distribution 4 57 2 29 1 14.3 - - - - 7 100
43

4.3 Strategy Evaluation
The evaluation of strategy is a step that tries to compare results and objectives to determine the
extent to which the latter are being met. This study sought to establish whether marketing
strategies, in whatever form they existed, were evaluated at all and if they did, the methods and
frequency of use.
The study revealed that only 29 per cent of the Companies had formal ways of evaluating their
marketing objectives (plans) and strategies. Half of these indicated the evaluation was done
monthly while the other half indicated it was done on a continuous basis.
4.4 Constraints to the establishment of strategic marketing practices
The process of operationalising strategy requires that there be management support. This
support can be realised through the creation of an organisational culture and the development of
policies that will support the plan. Resources should also be allocated in accordance with the
priorities spelt out in the strategic plan. Finally, it is important that the company’s energies and
efforts flow in the direction of strategy execution.
According to McDonald (1984) Sources of resistance to strategic marketing are numerous.
They include the reasoning that companies have made goods without it, the feeling that
planning is time consuming and prevents people from doing their real job, and that plans never
come true, so valuable time should never be wasted in writing them. There is also the argument
that companies know their businesses well, and therefore there is no point writing them down.
Even where there are plans no one reads them. As such plans become constraining, preventing
initiative and creating inflexibility to rapid change. Some industries also argue that they are
44

different and do not need plans. They look at long-range plans as meaningless prepared,
without hard market information and are therefore based on unrealistic objectives.
As stated earlier, this study sought to establish whether Sugar Companies had existing
marketing plans to guide a purposeful implementation exercise. It also sought to explore the
level of budgets allocated to marketing effort and whether there was general goodwill from
management towards growth of marketing functions.
In 57% of the Companies surveyed, there was total absence of a marketing department. The
marketing functions were variously handled by a General Manager, Finance Manager and Chief
Accountant. The dominance of finance people in handling marketing functions is indicative of
the fact that companies considered revenue collection as the more important role.
Where a marketing department existed, (57% of sample) it was relegated to a secondary role as
function in Accounts or Stores Departments. This lack of clear reporting structures was an
obstacle to the evolution of the marketing discipline within the companies as the system was
often characterised by conflicts and power games. According to the marketing concept,
consumer needs are at the start of the business chain and the marketing department must play
the single most important role in business.
There were stiff limitations imposed on sugar marketing by the political environment. As
mentioned earlier 54% of the sample indicated that they were affected “very much” by a
combination of political factors including corruption, political interference, legal bottlenecks
and political uncertainty.
45

The industry nursed fears having sugar sold in large volumes as this could make it fall in the
hands of barons who would in turn start controlling the sugar trade. Sugar barons were said to
have their tentacles ready to hoard sugar in a move that could hold the industry at ransom. The
industry therefore still operated under some controls. This was not conducive for the
development of strategic marketing practices.
A third limitation emanated from the fact that one of the key variables of the marketing mix
(pricing) could not be manipulated at will to give a competitive advantage. Pricing was not
dictated by market conditions but rather by a consensus from a meeting of players in the
industry who are supposed to be competitors.
Markets for the industry were also regulated by the government such that to export sugar, one
required to obtain permission from the Ministry o f Agriculture. This type of bureaucracy is not
conducive for the development of strategic marketing.
The main impediments to the establishment o f strategic marketing were listed as lack of
management support (30 %), corruption and environment constraints (30%), poor infrastructure
(20%), low-income levels (10%) and the geographical location of enterprises (10%).
46

Data on factors constraining the establishment of marketing strategy is indicated in the table
below:
Table 4.23 Constraints in the establishment of marketing strategy
Number of mentions Percentage
Corruption/Environmental 3 30
Constraints
Management support 3 30
Geographical location 1 10
Income levels 1 10
Infrastructure 2 20
47

CHAPTER 5:
SUMMARY, CONCLUSIONS AND IMPLICATIONS
5.1 Summary of Results
The results reported in this study were guided by two objectives namely exploration of the
nature and state of strategic marketing practices and of the obstacles that impaired the rooting of
marketing strategy in sugar companies.
Data was collected by use of semi-structured questionnaires. The questionnaire was self-
administered to facilitate inter-personal communication so that concepts could be explained and
to generate a high response rate. Indeed a response rate of 100 per cent was realised.
Findings of this study indicate that competition, which is the main trigger for strategy
formulation was mild within the local sugar industry itself, except and until when imports were
introduced in the markets. The local industry was however still producing below market
requirements and left on their own, they did not put much regard to marketing practices. The
steps of strategic marketing planning were therefore not prominent in the companies studied.
The absence of mission statements meant that sugar companies lacked the vision that could
direct their strategy.
Marketing activities were conducted adhoc without the guidance of marketing plans. Marketing
objectives were production-focused with profit maximisation taking the lead and competitive
activities receiving little regard. Since strategy is about outstaging competitors, lack o f regard
for competitive activities means the companies could not have conscious strategies for survival.
48

iviainv^iiiig p iug ia iiu iics w ere no t consum er-rue uscu. ii iu u g n uic cm iic p u p u iau u u u i m e siuuy
believed they were making a quality product, efforts stopped at that, leaving consumers to look
out for the producer.
Pricing decisions were stifled by environmental factors that did not allow for flexibility. Prices
were thus not responsive to market conditions. This left sugar industries vulnerable to
importers. Respondents listed political factors as constituting key environmental constraints.
Other environmental factors were equally constraining.
Hardly any promotion was done by the sugar industry. Players felt that sugar sells itself and did
not see cause to spend on marketing activities. While distribution received some emphasis, this
was more out of necessity than by plan.
Several constraints were established as affecting sugar marketing in line with the second
objective of the study.
Government controls did not allow for the free operation of the industry and consumers were at
times discouraged from purchasing in bulk for fear that this could lead to hoarding, which, in
turn could jeopardise the industry. This meant that the industry was not fully open to aggressive
marketing.
The greatest impediment to the establishment of marketing strategy was lack of management
support. Management in most companies still held on to the belief that sugar sells itself.
49

Lack of management support was detected in the development of the marketing function. There
were no budgets allocated to the function because many of them saw no good cause to spend.
They argued that they could after all sell their entire consignments without spending.
In view of these findings, the following would be the recommendations for management
consideration:
1. If the industry has to survive, there will be need to reduce the level of government control.
While this could be done through the proposed liberalisation, there is need to lobby for urgent
measures like the freedom to leave market forces to control the industry.
2. The local sugar industry appears unique in the sense of having local production higher than
consumption. Because of this, the industry has remained largely production focused. There is
need for managers to look at the fate that has befallen other enterprises in Kenya and collect the
ammunition before the actual war starts. The war is inevitable as more sugar companies plan to
enter the race.
5.2 Limitations of study and recommendations for future research
Given that the questionnaire was administered mostly to non-marketing personnel, problems in
understanding certain concepts were noted. Limitation in understanding certain variables, is
possible. This was however addressed by personal interviews, which facilitated explanation and
clarification.
This study sought to evaluate marketing functions in an industry that hardly practices any
marketing. An interesting dimension would be to find out whether marketing functions are
really required in markets that have scarcity.
50

The population of my study was restrictively small. This posed the problem of wide statistical
margins when percentages were computed. A tally of one and two may not be statistically
different yet when these are computed as percentages of my population, such a wide difference
is revealed between 14 per cent and 29 per cent which the two figures respectively represent.
There were severe time limitations imposed on the study. This restricted both the scope and the
depth o f the work. Given ample time, this study could be replicated in a wider scope that could
go beyond manufacturers to look at perceptions among consumers and members of the trade
channel.
51

6 SELECT BIBLIOGRAPHY
Aaker D Strategic Market Management. New York: John Wiley and Sons Inc., 1992
Albrecht K. and Zemke R Service America. Homewood, Illinois: Richard D. Irwin inc.,
1985
Aosa E An Empirical Investigation of Aspects of Strategy Formulation and Implementation
within Large. Private Manufacturing Companies in Kenya: Unpublished PhD
Dissertation, University of Strathclyde ( Scotland), 1992
Back P The future World Sugar Market and Australia's Role as a major Exporter. North
Queensland: James Cook University, 1977
Baker, J Marketing Strategy and Management. Hong Kong: McMillan, 1992
Barclays Bank: Sugar. London: Barclays Bank 1965.
Bett, S Strategic Marketing of Dairy Products in Kenya. Unpublished MBA Project.
University o f Nairobi, 1995
Bii, J The Extent to which Commercial Banks in Kenya use the Promotional Mix elements to
market their Services. Unpublished MBA project, University of Nairobi, 1992.
Frank, C "The production and Distribution of Sugar in East Africa: Proceedings of the East
African Institute of Social Research Conference" Kampala, 1964.
*
52

Frank, C "Analysis and Projection of the Demand for Sugar in East Africa": Paper presented
to the East African Institute of Social Research Conference, Kampala, 1964
Frank, C The Sugar Industry in East Africa. Nairobi: East African Publishing House,
(Undated)
Gem, Argwings-Kodhek "The Sugar Bill Should Legislate Protection for Producers",
Executive Magazine SpaceSellers, June, 1999.
Guiltinan J and Gordon P Marketing Management: Strategies and Programs.
Toronto: McGraw-Hill, Inc. 1994
Gupta, C Producers' Response to Changes in Prices and Marketing Policies: A Case Study
of Sugarcane and Paddy in Eastern Uttar Pradesh. London: Asia Publishing
House, 1965
International Sugar Organisation: The World Sugar Economy: Structure and Policies (no
details)
Kenya Sugar Authority Year Book of Sugar Statistics 1998
Kibera, F and B.C Waruingi Fundamentals of Marketing; An African Perspective.
Kenya Literature Bureau, 1998
53

Kipkorir, L The State of Marketing Intelligence Activities in Kenya's Retailing Sector:
The case of Supermarkets in Nairobi. Kenya, Unpublished MBA project,
University of Nairobi, 1992
Kotler, P Marketing Management: Analysis. Planning and Control New Delhi: Prentice Hall,
1997
Muchai, E "Which is to Blame: Sugar Dumping or Sugar companies Inefficiencies"
Executive Magazine, SpaceSellers, June 1999.
Mwebesa F and Owiti H; "Sugar Industry in East Africa: Project Paper for the Department
of Economics, UoN ( Undated)
Nyaga, K Adoption of the Marketing Concept: The case of Financial Institutions in Kenya.
Unpublished MBA Project, University of Nairobi, 1986.
Obara, D Environmental problems of smallholder sugar cane Production in the Nyanza Sugar
Belt, Unpublished Msc Thesis,University of Nairobi, 1976.
Obiero, J The Western Kenya Sugar Industry with Specific Reference to Nyanza and Western
Kenya. Unpublished M. A Thesis, University of Nairobi, 1980.
Odada, J Capital Labour Substitution, Returns to Scale and Farm Size in the Kenyan Sugar
Industry, PhD Dissertation, University of Nairobi, 1982.
54

Odada, J "The role of the Sugar Industry in the Kenyan Economy; a case study for Lake
Victoria Basin". IDS paper No 4, University of Nairobi, 1979
Odhiambo, L The Importance attached to the Sugar Industry and Sugarcane Outgrowers
Organisations in the District and Local Level Planning Strategies; Summary of a
Seminar held from 7- 10th September. 1986 at Webuve. Kenya (Friedrich Ebert
Foundation), 1986
Odhiambo, M The Structure and Performance of Kenya's Sugar Industry. With Special
Emphasis on the Nyanza Sugar Belt; Unpublished Msc Thesis, University of
Nairobi, 1978
Oduol, L: Chemelil Sugarcane Hinterland: A Geographical Analysis; Bachelor of Arts
Dissertation, 1974
Okutoyi, P The Relationship Between the use of Strategic Marketing and Bank Performance
in Kenya. Unpublished MBA Project, University of Nairobi, 1992
Pearce J, and Robinson R Strategic Management. Formulation. Implementation, and Control,
Boston: Irwin Inc., 1991
Porter, M Competitive Strategy, New York: The Free Press, 1980
Stanton, J and Futrel C: Fundamentals of Marketing. Toronto: McGraw Hill,1987
55
Thompson A & Strictland A: Strategic Management: Concepts and Cases: Boston, Irwin, 1989
Wilson R et al Strategic Marketing Management. Toronto: Buttemworth-Heinemann Ltd,
1995
56

7. APPENDIX
INTRODUCTORY LETTER TO RESPONDENTS
Dear Sir/Madam,
RE: STUDY OF KENYA'S SUGAR INDUSTRY
I am a post-graduate student in the Faculty of Commerce pursuing a Masters in Business
Administration (MBA) degree course in Marketing.
In partial fulfilment of the requirements of the course, I am carrying out a research project
entitled " The state of strategic marketing in Kenya's sugar companies". Your firm has been
selected to participate in this study. I would like to request you to provide the required
information to the best of your knowledge by filling the questionnaire attached.
This exercise is strictly for academic purposes and any information obtained will be treated with
the strictest confidence. A copy of the final research report will be availed to you upon request.
Yours faithfully,
Herbert A. Kassamani
57

QUESTIONNAIRE
This questionnaire is divided into two parts. The first part requires you to fill information about
your organisation. It will be used for classifying the results of the study. The second part is
meant to highlight the various aspects of marketing strategy as they are applied in your
organisation.
PART A
Name of the company.................................................................................................................
Year of establishment.................................................
Production this year(Jan-Oct 1999) ..................................................tonnes
Sales this year (Jan-Oct 1999)................................................. tonnes
Current sugar stocks........................................tonnes
Date at which marketing function was established..........................................
Number of employees in marketing department .........................................
Budget allocated to marketing activities (1999) Ksh.........................................
PART B
1. Does your company have a mission statement? Yes ( ) No ( )
2. If yes, please indicate the mission statement of your company below:
3. Does the company have a formal marketing department?
Yes ( ) NO ( )
58

4. Please give the official title of the person who is in-charge of the marketing function
5. Does your company have a written marketing plan?
Yes ( ) NO ( )
6. Do you research into the needs of your customers before developing products for them?
Yes ( ) NO ( )
7. If yes, please give the type of customer needs your company tries to address.
a) ............................................................................................................
b) ............................................................................................................................................
c) ...........................................................................................................
8. Do you segment your markets before you develop your products?
Yes ( ) NO ( )
8. If yes, please tick the variables below to indicate the basis on which the segmentation is done.
a) Geographical location ( )
b) Income ( )
c) Social Class ( )
d) Volume ( )
Others (Please specify ) ........................................................................
59

9. Please fill the following information about your competitors where it is known to you. If the
information is not known, please indicate " Not known".
Name o f competitor Annual Sales volume Market share
A .................................................................... .................................
b .................................................................... .................................
c ........................... ................................ .................................
10. Do you know the business objectives of your competitors? Y es( ) No ( )
11. If yes, please state these objectives below:
a) .........................................................................................................
b) .................... .....................................................................................................................
12. What strengths do your think your competitors have in the following areas?
a) Product............................................. ..............................................................................
b) Price................................................................................................................................
c) Promotion......................................................................................................................
d) Distribution.......................................................................................................................
13. What weaknesses do you think they have in the following areas:
a) Product...........................................................................................................................
b) Price..................................................................................................................................
c) Promotion................... ......................................................................................................
d) Distribution......................................................................................................................
60

14. Please indicate the extent to which the operations of your business are affected by the
following factors.
Very Not
Much A little At all
POLITICAL
a) Laws ( ) ( ) ( )
b) Political interference ( ) ( ) ( )
c) Political uncertainty/strife ( ) ( ) ( )
d) Corruption ( ) ( ) ( )
e) Activities of Kenya Sugar Authority ( ) ( ) ( )
Others ( Please specify )
ECONOMIC
f) Inflation ( ) ( ) ( )
g) Interest rates ( ) ( ) ( )
h) monetary policies ( ) ( ) ( )
i) Income/Expenditure patterns ( ) ( ) ( )
Others ( Please specify)
SOCIO-CULTURAL
j) Lifestyle ( ) ( ) ( )
k) Consumer/pressure groups ( ) ( ) ( )
1) Religion ( ) ( ) ( )
m) Beliefs/Attitudes ( ) ( ) ( )
61

TECHNOLOGICAL
n) New technology ( ) ( ) ( )
o) Cost of technology ( ) ( ) ( )
15. What strengths do your think your company has in the following areas?
(Where it is not known, indicate "Not Known".)
a) Product...................................................................................................................................
b) Price................................................................................................... ...................................
c) Promotion.............................................................................................................................
d) Distribution............................................................................................................................
16. What weaknesses do you think your company has in the following areas:
a) Product...................................................................................................................................
b) Price.......................................................................................................................................
c) Promotion..............................................................................................................................
d) Distribution............................................................................................................................
17. Rank the following marketing objectives in order of importance to your organisation. ( Fill 1
for the most important and 5 for the least important)
a) Customer satisfaction ( )
b) Product leadership ( )
c) Market share ( )
d) Profit maximisation ( )
Others ( Please specify )..................................................................
62

18. Please indicate the importance your firm attaches to the following marketing processes.
Very A little Not
Important Important Indifferent Important Important
(a) Product innovation ( ) ( ) ( ) ( ) ( )
(b) Pricing ( ) ( ) ( ) ( ) ( )
(c) Advertising and Promotions ( ) ( ) ( ) ( ) ( )
(d) Distribution ( ) ( ) ( ) ( ) ( )
19. What is the relative importance of the following attributes in the product decisions o f your
firm?
Very A little Not
Important Important Indifferent Important Important
a) Quality ( ) ( ) ( ) ( ) ( )
b) Variety ( ) ( ) ( ) ( ) ( )
c) Packaging ( ) ( ) ( ) ( ) ( )
d) Brand name ( ) ( ) ( ) ( ) ( )
e) Service ( ) ( ) ( ) ( ) ( )
20. Your company sets prices to: (Tick whichever is applicable)
a) Get maximum profits ( )
b) Meet competition ( )
c) Offer better value than competing products ( )
d) Undercut competition ( )
e) Increase frequency of consumption ( )
f) Survive in the markets ( )
( )g) Recover costs
Others ( Please specify )
63

21. Rank the following promotional elements in terms of the prominence your company
attaches to their use.
Very A little Not
Important Important Indifferent Important Important
a) Advertising ( ) ( ) ( ) ( ) ( )
b) Sales promotion ( ) ( ) ( ) ( ) ( )
c) Public Relations ( ) ( ) ( ) ( ) ( )
d) Personal selling ( ) ( ) ( ) ( ) ( )
e) Packaging ( ) ( ) ( ) ( ) ( )
22. Indicate how often your company uses the following promotional tools.
Advertising
Always Sometimes Not at all
a) Radio ( ) ( ) ( )
b) Television ( ) ( ) ( )
c) Newspapers ( ) ( ) ( )
d) Magazines ( ) ( ) ( )
e) Brochures ( ) ( ) ( )
f) Billboards ( ) ( ) ( )
g) Shop/bus stop paintings ( ) ( ) ( )
Always Sometimes Not at all
h) Directories ( ) ( ) ( )
i) Transit media (buses etc) ( ) ( ) ( )
64

Public Relations
a) Press kits ( ) ( ) ( )
b) Speeches ( ) ( ) ( )
c) Seminars/Workshops ( ) ( ) ( )
d) Annual reports ( ) ( ) ( )
e) Sponsorships ( ) ( ) ( )
f) Donations ( ) ( ) ( )
Sales Promotion
a) Give-aways ( ) ( ) ( )
b) Trade Shows/Exhibitions ( ) ( ) ( )
c) Price discounts ( ) ( ) ( )
d) Coupons ( ) ( ) ( )
e) Contests ( ) ( ) ( )
Personal selling
a) Sales representatives ( ) ( ) ( )
b) Agents ( ) ( ) ( )
Direct marketing
c) Mail ( ) ( ) ( )
d) Telephone ( ) ( ) ( )
e) Brochures ( ) ( ) ( )
f) E-Mail ( ) ( ) ( )
65

23. How are you able know the effectiveness of your promotions?
24. Please indicate the type of middlemen (Agents, wholesalers, retailers etc) your goods go
through from production to the end-consumer.
25. In determining your distribution channels, how important are the following factors?
Very A little Not
Important Important Indifferent Important Important
a) Accessibility ( ) ( ) ( ) ( ) ( )
b) Market coverage ( ) ( ) ( ) ( ) ( )
c) Geographical dispersion ( ) ( ) ( ) ( ) ( )
d) Availability of channels ( ) ( ) ( ) ( ) ( )
e) Cost of channels ( ) ( ) ( ) ( ) ( )
f) Competitive activities ( ) ( ) ( ) ( ) ( )
g) Others ( Please specify)
26. Do you have a formal way of evaluating your marketing plans?
Yes ( ) No ( )
27. Briefly explain how the evaluation is done.
28. How often is this evaluation done?
U N IV E R S IT Y O F N A IR O B I L IB R A R Y
6 6

29. What major hindrances do you find in setting up of effective strategic marketing activities?
a ) ............................................................................................................................................
b ) ............................................................................................................................................
c) ...........................................................................................................................................................
d) ..........................................................................................
THANK YOU FOR YOUR CO-OPERATION.
67