The State of Pakistan’s Dairy Sector: An Assessment
31
CMER Working Paper Series CMER Working Paper No. 05-34 The State of Pakistan’s Dairy Sector: An Assessment Abid A. Burki Mushtaq A. Khan & Faisal Bari February 2, 2005 CENTRE FOR MANAGEMENT AND ECONOMIC RESEARCH Lahore University of Management Sciences Opp. Sector ‘U’, DHA, Lahore Cantt. 54792, Lahore, Pakistan Tel.: 92-42-5722670-79, x4222, 4201 Fax: 92-42-5722591 Website: www.lums.edu.pk/cmer brought to you by CORE View metadata, citation and similar papers at core.ac.uk provided by Research Papers in Economics
Transcript of The State of Pakistan’s Dairy Sector: An Assessment

CMER Working Paper Series
CMER Working Paper No. 05-34
The State of Pakistan’s Dairy Sector: An Assessment
Abid A. Burki
Mushtaq A. Khan
&
Faisal Bari
February 2, 2005
CENTRE FOR MANAGEMENT AND ECONOMIC RESEARCH Lahore University of Management Sciences
Opp. Sector ‘U’, DHA, Lahore Cantt. 54792, Lahore, Pakistan Tel.: 92-42-5722670-79, x4222, 4201 Fax: 92-42-5722591
Website: www.lums.edu.pk/cmer
brought to you by COREView metadata, citation and similar papers at core.ac.uk
provided by Research Papers in Economics

The State of Pakistan’s Dairy Sector: An Assessment
Abid A. Burki* Department of Economics
Lahore University of Management Sciences Lahore, Pakistan
Mushtaq A. Khan Department of Economics
Lahore University of Management Sciences Lahore, Pakistan
Faisal Bari Mahbub-ul- Haq Human Development Centre
Islamabad [email protected]
February 2, 2005
Abstract:
While there is a plethora of research documenting a multitude of dimensions of the crop sector of Pakistan, there is virtual absence of meaningful economic analysis of the dairy economy that is surprising. No serious attempt has been made in the past to clarify the micro-level potential of this sector in creating an impact on rural economy. This paper is a pioneering attempt to provide an objective assessment of the state of Pakistan’s dairy and to point out areas of further research. The paper analyzes some core issues and highlights the potentials, and recommends measures that could be adopted.
1
The State of Pakistan’s Dairy Sector: An Assessment
ABID A. BURKI, MUSHTAQ A. KHAN and FAISAL BARI*
1. Introduction
The macroeconomic importance of the dairy sector for Pakistan’s economy, in general, and
for the rural economy, in particular, cannot be overemphasized. While the contribution of
agriculture to Pakistan’s gross domestic product (GDP) is declining over time, it still stands at 23
percent. Of that, the livestock sector contributes 49 percent of the value addition in the
agriculture sector, and about 11.4 percent to Pakistan’s GDP, which is higher than the
contribution made by the entire crops sector (10.9 percent) of the country. Net foreign exchange
earnings from livestock were to the tune of Rs.53 billion in 2000-01, which is about 12 percent
of the export earning for that year.
The role of livestock sector in the rural economy of Pakistan can also be gauged from the fact
that 30 – 35 million rural population of the country engaged in raising livestock (small herds)
derives 30 – 40% of their income from this sector. Within the livestock sector, milk is the largest
and the most important single commodity. Despite the fact that the dairy sector in Pakistan faces
major problems, and is not performing even close to its potential, Pakistan is the 6th largest
producer of milk in the world. In terms of market value, milk production contributes more to the
GDP of the country than any single major crop.
Yet, despite its clear importance the dairy sector in Pakistan has failed to attract its due
importance from the policy makers. Pakistan not only has very low milk yield per animal but
also has poor animal stock. Its dairy sector mostly operates on non-commercial basis in the
unorganized sector while the organized sector processes only a small fraction of total milk
production of the country. Despite being one of the largest producers of milk in the world,
Pakistan still imports powdered milk to meet the domestic demand.1
* We thank Syed Babar Ali for his thoughtful criticism and suggestions on an earlier draft of this paper; Lars Normann and Frederich Mahler for support in providing background information about the UHT Processing industry in Pakistan; an anonymous referee for helpful comments and suggestions; and Adeel Faheem for providing research assistance on the study. The usual caveat applies, however. 1 Pakistan’s annual imports of powdered milk are about 25,000 tonnes, which costs around USD380 millions. Importing powdered milk becomes more lucrative when prices fall in the international market, which naturally influences the volume of imports.
2

While there is a plethora of research documenting a multitude of dimensions of the crop
sector of Pakistan, there is virtual absence of meaningful economic analysis of the dairy
economy that is surprising. For example, no serious attempt has been made to clarify the micro-
level potential of this sector in creating an impact on rural economy ranging from increasing
indigenous milk production and its efficient distribution, economies of scale and scope of
dairying, income generating capacities of the dairying households, to questions concerning
objectives related to poverty alleviation.
This paper aims at providing an objective assessment of the state of Pakistan’s dairy in the
light of available evidence and points out areas where more detailed research work is needed.
This review revolves around a key question: can the current status quo be helpful in bringing
about a marked change in increasing indigenous milk production and its efficient distribution?
The paper analyzes some core issues and highlights the potentials, and recommends measures
that could be adopted.
In Section 2, we provide a brief overview of the historical policy context of the dairy sector
in Pakistan. Section 3 characterizes milk production systems in Pakistan while Section 4 gives
trends and projection on prices, production and consumption of fresh and ultra-high temperature
(UHT) milk. Section 5 discusses implications of industry projections for the dairy economy as
well as the outlook for this sector in the near future while the last section concludes the study and
makes recommendations.
2. Dairy Policies, Market Forces, and Impact on Dairy Development
It comes out clearly from an historical review of the past dairy policies in Pakistan that policy
makers never had faith in the development of the dairy sector. For example, a cursory look at the
Five-Year Plans shows that the policy interventions for dairy development were very few and far
between, which also reflects in the poor showing of milk yields per animal, and in the way milk
supply channels are currently organized. In this section, we present a preliminary review of
Pakistan’s dairy development policies in an historical perspective, and highlight the role played
by the market forces in creating incentives for higher milk production by subsistence and market
oriented milk farmers in the country. This review is organized around two basic questions:
o Were past policy interventions successful in turning around the dairy sector?
o What role, if any, did market forces play in dairy sector development in the past?
3

Dairy Sector in the Policy Context:
The planners in Pakistan have always been more concerned about development of the crop
sector than dairying in the agriculture economy of the country. After independence, the livestock
population in Pakistan significantly deteriorated due to a) good stock was taken away by
evacuees, b) indiscriminate slaughter of animals by incoming refugees, c) dry cows and
buffaloes brought from rural areas by milk dealers for supply of milk in urban areas were
slaughtered at the end of lactation period, and d) increased demand for meat due to growth of
population and incomes. Urban areas faced acute shortages of milk and dairy products. The
planners faced a policy dilemma of how to increase draught power and milk production
simultaneously. Efforts were made to improve stock of cattle by breeding of indigenous animals,
but output of improved stocks was inadequate to make a dent on the dwindling supplies of
improved cattle and buffaloes in the country.
The First Five Year Plan (1955-60) recognizes the importance of improving breeding centers,
operating more hospitals, dispensaries and mobile dispensaries to check spread of contagious
diseases for animals, in addition to providing for research on increasing supplies of feed and
fodder, and starting pilot schemes for artificial insemination for improvement of cattle
[Government of Pakistan (1957)]. The First Plan was very specific in removing gujar (a cast of
milkmen) colonies from cities like Lahore to outskirts and in recommending milk supply
schemes for Karachi and Lahore on a pilot basis. Under the scheme government was to buy milk
from gawalas (milkmen) residing in gujar colonies and supply pasteurized milk in sealed bottles
through registered milk depots. To reduce adulteration in milk, the Plan recommended testing of
milk for purity. The Plan also suggested that most of the milk would be produced in villages near
the cities where small farmers would specialize in dairying by keeping half dozen or more cows,
produce their own feed and organize themselves in to cooperatives for assembling, transport and
even processing of milk.
Soon it became clear that the First Plan, which articulated the problems at hand quite well
proved to be too ambitious in their implementation as compared to the Plan target. The question
of how to improve milk production capacity remained un-addressed even in the Second Five
Year Plan (1960-65), which experienced major policy shift toward development of the large-
scale manufacturing sector. Hence there was very little planned effort, if any, for the
4

development of the dairy sector.2 In the Third Five Year Plan (1965-70) there was a renewed
emphasis on agriculture development with the help of the seed-fertilizer-water technologies (the
Green Revolution technologies) for higher yields in the crop sector. However, the dairying sector
went into oblivion. The milk supply schemes envisaged in the First Plan for Karachi and Lahore
first became operational in Karachi in 1965. With the support from UNICEF (United Nations
Children’s Fund), in later part of sixties, subsidized milk was made available in Karachi to low-
income families and school children. This plant had to be shut down in 1980 after running in
deficit for fifteen consecutive years. Similarly, the Pilot Milk Supply Project in Lahore also went
into production in 1967, but like the project in Karachi this project also failed to receive the
patronage of successive governments and hence was abandoned.3
Milk processing industry got a boost as part of the development of the manufacturing sector
in the country somewhere between sixties and seventies, when the private sector established 23
milk pasteurization and sterilization plants around three big cities, e.g., Karachi, Lahore, and
twin cities of Rawalpindi and Islamabad [Anjum et al. (1989)]. These plants relied on supplies of
skim milk powder coming under the auspices of the World Food Program, which was
recombined and pasteurized before being sold to consumers. These plants failed mainly due to
weak acceptance of the recombined milk by consumers and its short shelf life [Anjum et al.
(1989)]. In other words, inadequate supplies of fresh milk to milk processing industry proved to
be the major hurdle in their success.
There was a renewed interest in the milk processing industry in late-seventies and early-
eighties when policy support was provided by the government in the form of exemptions in
income tax, duty free import of machinery and equipment, and availability of domestic and
foreign currency financing [Government of Pakistan (1990)]. The success of Packages Limited
in ultra-high temperature (UHT) treated milk in late seventies also attracted other players into the
field. Moreover, the UHT treated milk received a successful introduction in this period when the
Tetra Pak Pakistan Limited started producing aseptic packaging material for the UHT treated
milk. Several UHT plants were set up in eighties while many others were sanctioned leading to
2 This can be verified from the planning documents such as Government of Pakistan (1966). 3 Lahore Milk Plan has been revived after it was taken over by the Idara-i-Kissan, a farmer’s organization, and currently it has a processing capacity of 300,000 liters a day of pasteurized milk. Similarly, Karachi Milk Plant was also revived when the Idara-i-Kisan took over its control in November 2002.
5
growth in the capacity. However, the growth in demand for processed milk was not forthcoming
at least in the short run. Hence, due to operating below their variable costs, most of these plants
were shut or could not get started. In effect, these developments could not make headway in
creating productive capacity of milk in the country or its distribution through the organized
sector. As SMEDA (2000) notes, “milk production at the farm level remains the weakest link of
the dairy industry in Pakistan” due to which steady supply of fresh milk at economical prices
could not be ensured.
In the late eighties, the policy focus envisaged increasing production of livestock products by
establishing large scale private corporate enterprises while the role of government was reduced
to research on animal breeding, nutrition and creating conducive environment for encouraging
private investment in this sector [Government of Pakistan (1990)]. However, despite numerous
incentives the same could not make headway. Other than making claims, successive
governments in the period of nineties have not initiated any tangible policy for the improvement
of the dairy sector.
Role of Market Forces in Dairy Sector Development:
Historically, the milk economy of Pakistan cannot be divorced from the crop production
sector where traditionally bullocks provided draught power and milk production came as a by-
product. Therefore, the constraints or opportunities affecting the dairy sector today have to be
found in the internal dynamics of the agriculture proper.
Needless to say that the important role played by draught animals in rural economy in pre-
Green Revolution period kept the production of high quality bullocks at the center stage in
animal husbandry practices. Milk production from cattle in this production relation had but only
a secondary importance while buffalo was used as a specialist dairy animal. However, in rice
growing areas there was always a comparative advantage in using buffalo bulls or even buffaloes
for draught power than the bullocks. Therefore, it is not surprising to find a huge concentration
of buffaloes than cows in rice growing areas of Pakistan. The spread of buffaloes to other parts
can be explained by the preference for buffalo milk in peoples’ diet.
In pre-Green Revolution period feed resources were widespread because landlords used to
produce green fodder to sustain work animals as part of agriculture economy. In this period, the
land tenancy or share cropping relationship was such that typically tenants used to own bullocks
6

while the landlords used to spare land for fodder production for their own animals and the
animals maintained by the tenants. However, with the popularization of the Green Revolution
technologies the traditional landlord-tenant relationship was disturbed because the landlords who
now provided better seeds (i.e., high yielding varieties) and purchased fertilizer (i.e., chemical
fertilizers) claimed higher shares from the produce than the conventional sharing of crop yields.
Even on large tracts of land where in pre-Green Revolution period self-cultivation was not
technically feasible with bullock technology was now made possible with the introduction of
tractors and tractor-driven implements. Empirical literature shows that tractors are a substitute
for animal labor.4 This is because tractors can be employed for similar agricultural operations
that are done by bullocks, e.g., seed bed preparation, harvesting and transportation. The
availability of tractor technology on subsidized prices in late sixties and early seventies initiated
a gradual replacement of bullocks and male buffaloes with tractors. The fear of land reforms and
consequent grabbing of the land by tenants in early 1970s further augmented this process in early
to mid-seventies.
Eventually, in post-Green Revolution period tractors have drastically replaced bullocks and
male buffaloes for transportation purposes while most of the bullocks that were traditionally used
for seed bed preparation and harvesting have also been replaced by tractors paving the way for
gradual phasing-out of the work animals, making cows getting the center-stage. For instance,
there was 34% decline in the number of bullocks for work between 1986 and 1996 [Government
of Pakistan (1998)]. Hence surplus stock of work animals, mainly bullocks, has been culled over
time where they had lived their utility. Since the production of work animals had been the first
priority of farm households in the rural economy, it should not come as a surprise that the
remaining stocks of cows mainly belong to work breeds. It is only a recent phenomenon that
milk production has assumed key significance in rural areas where genetic constraint of milking
animals is increasingly being felt.
With the burgeoning urbanization and income growth, there is commercialization of milk
production in Pakistan whereby milk-processing industry has made in-roads through better
transportation networks and modern storage facilities. The recent economic stimulus provided by
processing units, through collection of milk from subsistence and commercial farmers located in
4 See for instance, Ali and Parikh (1992).
7

remote rural areas, has the potential of setting-in a process of changed management. In the short-
run this may take the form of changing the variable factors of production (such as feeding
practices) while in the long run it may involve such decisions as the optimal farm sizes based on
the economies of scale. The synergies coming from mixed-farming practices could promote
economies of scope that could help in simultaneously maximizing milk production and crop
yields. In this way, the farmers could economize on animal and land assets to maximize profits.
However, these inter-relationships have not been thoroughly examined by analysts and hence
they offer a fertile area for future research. However, it must be emphasized that due to the inter-
relationships between dairy and crop production, agricultural development policies aimed at
transforming the rural economy cannot succeed, not anymore, by neglecting the dairy sector.
However, progress within the dairy sector largely hinges on the potential of enhancing milk
production in the country, which is discussed in Section 3.
3. Characteristics of Milk Production Systems in Pakistan
The milk production system currently prevailing in Pakistan can be characterized by their
location, herd size, feeding practices and marketing opportunities. These production systems
based on rural and urban areas offer immense potential for rapid growth in indigenous milk
production from their current lower milk yields by improving upon animal management and
feeding practices in the short-run and by bringing about a marked improvement in the animal
stocks in the long-run. For illustrative purposes, we distinguish here three milk production
systems in Pakistan and highlight their main characteristics.
Rural Milk Production Systems:
In rural areas of Pakistan, both subsistence and market oriented milk production systems are
rampant. A most common age-old practice for rural families was to keep milching animals to
meet family’s subsistence needs of milk and milk products whereby excess milk was converted
in to butter or ghee for home consumption. At that time there was very little demand, if any, for
commercial milk production within the village. However, with burgeoning urbanization a vast
market for milk and ghee gradually developed in most parts of Pakistan, which encouraged
commercial milk production by subsistence as well as market oriented dairying households.
8

The subsistence dairying households in Pakistan keep buffaloes and cows in smaller herd
sizes while market oriented households keep larger herd sizes for commercial milk production.
Up to 43% of the dairying households in Pakistan still operate under conditions of subsistence by
maintaining herd sizes of one to two while another 27 to 28% of the households operate under
conditions of near subsistence where the herd sizes range from three to four animals (Table 1).
The rest of the dairying households appear to be maintaining larger herd sizes of cattle and
buffaloes located in rural and urban areas that operate essentially for commercial supply of milk.
The subsistence or near subsistence dairying households mostly consist of small farmers,
tenants or landless laborers. These dairying households have very high stakes in dairy production
because dairy income supplements their other income from farming or agricultural labor.
Therefore, smallholder dairying is seen as a tool of raising effective incomes of these
impoverished rural households. Interventions in dairy economy aimed at benefiting these
impoverished classes involve high returns from a policy standpoint.
Because buffalo milk is richer in composition as compared with cow milk, consumers and
dairy milk plants prefer it.5 About 66% of the milk available for human consumption is buffalo
milk, 31.4% is cow milk and about 2.4% is goat and sheep milk [Government of Pakistan
(2001)]. Due to higher demand for buffalo milk it sells at a higher price than the cow milk.6
Higher butter fat content in buffalo milk makes it attractive to milk processing units, which are
located in irrigated areas of Punjab where milk production largely depends on buffaloes.7
Poor management and feeding of animals is one of the key characteristics responsible for
lower milk yields in Pakistan. Artificial insemination can be extremely useful for breeding of
cattle and buffaloes, but the farmers in Pakistan are still not inclined to accept this method for
various reasons. The fact is that only 4% to 4.5% of dairying households in Pakistan use artificial
5 Except for higher butterfat content in buffalo milk, buffalo and cow milk have very similar composition. For example, buffalo milk has 87.2% water, 6.5 to 8% fat, 3.6% protein, 5.5% lactose (milk sugar) and 0.8% ash while the cow milk consists of 87.2% water, 3.7 to 4.6% fat, 3.5% protein, 4.9% lactose and 0.7% ash. Higher sugar content in buffalo milk is another reason for people’s preference for buffalo milk. 6 Buffalo is part of rural production system in Asia for over 5000 years used for milk, draft power, meat and hides. Currently there are 153 million buffalo in several Asian countries. For a detailed review of the role of buffalo in economic and social fabric, in particular, of the small and landless rural poor in Asia, see Nanda and Nakao (2003). 7 According to the Livestock Census, 1996, from the total buffaloes in Pakistan 64% are located in Punjab while 28% are located in Sind. However, the distribution of cattle is more diverse with 46% in Punjab, 27% in Sind, 21% in NWFP and 6% in Balochistan [Government of Pakistan (1998)].
9

insemination (see Table 2) in buffaloes and cows with a slight edge to farmers in North West
Frontier Province (NWFP) over all other provinces. Artificial insemination facilities have either
not been introduced in many parts of Pakistan or this service is not available nearby to be used at
the time of need.
Similarly, proper feeding of animals is important for improving the livestock industry. Even
though animal feeding practices in Pakistan are successful in simply maintaining or achieving
lower milk yields, they are simply devoid of achieving higher milk yields from the milking
animals. For instance, we show in Table 3 that most dairy farmers in Pakistan combine stall-
feeding with grazing while grazing-only option is practiced on very few farms. Most common
feeding regimes for rural subsistence farmers involve stall-feeding or combining stall-feeding
with grazing. They commonly feed their animals on grasses and herbs, with forages gathered
from uncultivated lands, crop residues and low quality roughages. The amount of concentrate or
higher-grade green fodder fed to these animals is often small, which is one of the main reasons
for very low yields in rural milk production system. Ironically, most dairy farmers with large
herd sizes combine stall-feeding with grazing. This is shown in Table 3 where stall feeding-cum-
grazing practice dramatically increases in large herd sizes.
Needless to say that large ruminants such as buffaloes and cows are known as excellent
converters of low quality forages, roughages, grasses and herbs, crop residues, and crop by-
products in to milk, which is a complete food. But these feeding plans do not offer a balanced
food regime required by the milking animals for higher milk yield. General experience shows
that only balanced feeding of animals can bring about 30% increase in milk yield per animal.
Abundant supply of molasses at cheaper rates in the country can be used as concentrate in animal
feed to raise milk yields. Moreover, use of clean but abundant drinking water can also play an
important role in raising milk yields.
The negative impact of conventional feeding practices is further augmented during summer
months when grasses and herbs rapidly dry out. Moreover, high temperatures also limit animal’s
ability to digest enough food. Therefore, due to lesser food intake than desirable, milk production
drops significantly during summer.8 The nutritional quality of animal feed is crucial for milk
8 Based on a survey of 55 small herds in rural Punjab, Anjum et al. (1989) have reported that milk production of buffaloes at 215.4kg in high month (January – February) was 88% higher if compared with milk production of 114.6 kg in low month (May – June).
10

production during lactation and farmers have very little awareness about correct feeding plan for
their animals. As a consequence, per lactation milk production in Pakistan is very low.
A key feature of subsistence milk economy is division of labor in the family whereby
dairying is a task for women. Local traditions mainly determine the role actually played by
women, which differ enormously across regions. In some regions, women in addition to women
husbandry are responsible for marketing of milk and ghee while in others women only do
activities within their home. However, the role of women in more market oriented dairy farming
is limited, if any, because they traditionally depend on males for carrying out various dairy
related tasks.
City and Peri-urban Milk Production:
The oldest form of milk supply in urban areas consists of animal population of cities, which
was (and still is) kept in stables in the outskirts of cities and towns. In other cities, small-scale
dodhis (milkmen) used to transport fresh milk to urban consumers on foot or on bicycles from
peri-urban areas, which still persists in more or less the same form. However, with rapid
urbanization the municipal limits of growing towns and cities are extended, which brought most
of these stables inside main cities. Civic authorities of few metropolitan cities (e.g., Karachi,
Lahore and Rawalpindi) have made concerted efforts to remove dairy animals from city limits
leading to establishment of Gawala Colonies around urban areas. In other cities, buffalo and cow
herds are still kept on stables gathered over the urban area. Some urban families also keep a large
ruminant milch animal (e.g., buffalo or cow) in their streets, garages, or backyards to obtain
guaranteed supply of fresh and unadulterated milk.
By keeping buffaloes and cows in or near cities on a large or small scale the city and peri-
urban milk producers exploit a key feature of this commercial system of shortening the distance
between production units and final consumers that helps in considerably lowering the risk of
milk spoilage. The large market for fresh milk in big cities such as Karachi, Lahore, Rawalpindi
and Islamabad is the main attraction for city and peri-urban milk producers who fetch relatively
higher prices of milk, face lower transportation costs, but bear relatively higher cost of feeding
the milching animals. Milk is often sold on the spot by units located in cities to guarantee fresh
and unadulterated milk. More often, city and peri-urban milk producers supply milk to
11

consumers on the doorstep. Few producers also sell milk to city milk shops or sweet shops
(halwais).
City and peri-urban animals are kept in herd sizes that vary from 6 to more than 50. They are
often fed on stall-feeding with expensive fodder and concentrates.9 Therefore, dairy animals in
this production system are bought shortly before or after calving for greater milk yields while
non-lactating or dry animals are sent back to rural areas or are sold to the butcher. The
establishment of numerous markets for dairy animals around most big cities and towns facilitate
this process.
Commercial Dairy Farming:
This involves keeping larger herd sizes usually about 30 or more animals where production
depends on modern feeding practices with wheat and rice straw, purchased concentrates, green
feeds such as barseem, sorghum and maize, and other agricultural by-products. They often take
full advantage of available breeding practices, e.g., artificial insemination, to improve their herd
quality. Some of them have also installed their own pasteurization or processing equipment. Due
to superior feeding and management practices, yearly milk yield per animal in these production
units is relatively higher.10 However, the share of such farms in total milk production is very low.
In sum, we need primary level research to address the above questions, but given the potential
of the sector, it would be important to research and address the above mentioned concerns. This
obviously raises the question of how production and consumption decisions are influenced by
real prices of fresh and processed milk, to which we turn in Section 4.
4. Prices, Production and Consumption of Milk: Trends and Projections
The growth prospects for the dairy sector in Pakistan largely depend on the pattern of real
prices, which in turn are influenced by production and consumption of fresh and processed milk.
In this section, we evaluate past trends and make projections for the future on prices, production
9To economize on cost of feeding, milch animals (especially those kept in the city) are often paraded through the city streets and roads in the morning in many small cities and towns to take them to suburbs for grazing on public lands, along canals or rivers, and along the roadside and brought back in the afternoon. 10 Yearly milk production per buffalo in commercial farms was 2518 kg as compared with 2460 kg in peri-urban, 2060 kg in rural market oriented, and only 1200 kg in rural subsistence units [Anjum et al. (1989)].
12

and consumption of fresh and UHT milk with the objective to provide direction and pace of
future change, assuming that the current status quo in policy is maintained.
The ARIMA Model:
To make future projection for various time-series, we use the Autoregressive Integrated
Moving Average (ARIMA) model, which gives forecasted values after making the desirable
time-series stationary [Pindyck and Rubinfeld (1998)]. It is well known that the non-stationary
series can be modeled as ARIMA with various lags. To illustrate, the modeling of time series
through the ARIMA model is based on three steps:
1) Modeling of stationary series
2) Identification and estimation
3) Diagnostic check and forecasting.
To determine whether the series is non-stationary at the level the Augmented Dicky-Fuller
(ADF) test is conducted. This test is applied after taking the first difference and in some cases by
taking the second difference. Then a cursory inspection of the declining autocorrelation and the
partial autocorrelation function of the series ensure that the series is stationary. Once the
stationary nature of the series is ensured, the series is modeled depending on its autocorrelation
and partial autocorrelation function’s spikes at various lags.11 After determining the possible
lags, the final step is executed by looking at the residuals of the estimated equation, i.e., ARIMA
(p, d, q).12
Fresh and UHT Milk Prices: Trends and Projections:
The nominal price series of fresh and UHT milk reported in Table 4 shows consistent year to
year increase, which can be misleading unless it is deflated. To illustrate, we show in Table 4
that nominal price of fresh milk consistently increased from 1972 to 2004 while real price of
fresh milk either declined or remained constant after 1976-77. More recently, real price of fresh
milk has decreased by about 2 percent from Rs.12.76 to Rs.12.53 in the period from 1992-93 to
2001-02. Table 4 also reports price time series for UHT processed milk and shows that nominal
11 This was accomplished by determining possible lags, such as AR (p), MA (q), and ARIMA (p, d, q). 12 If these residuals are not white noise then the new specification is tried. When the process discussed above is complete, the future forecasting is made for the future time period.
13

price of UHT milk registered significant increase from 1994-95 to 2003-04 while its deflated
price consistently declined. How milk processing industry has been able to sustain this shock?
The answer largely depends on the nature of productivity growth in the industry. Even though we
have no direct evidence on the nature of productivity growth in milk processing industry, we
conjecture that productivity may have increased in this period due to economies of scale and
scope in these years.
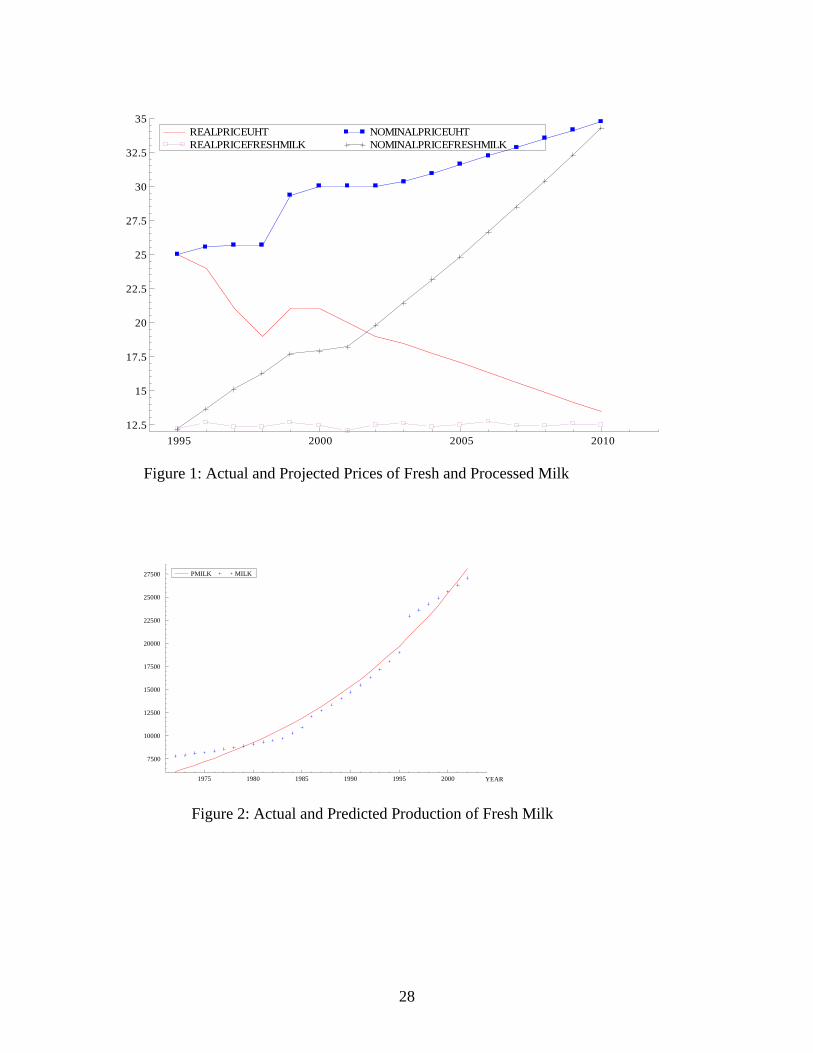
We also note that the gap between nominal and real price of fresh and UHT milk is
narrowing over time. This is clearly shown in Table 5 and Figure 113 where we report actual and
projected price of fresh and UHT milk until 2009-10. It can be seen that the gap between real
price of fresh and UHT milk significantly closes down by the year 2009-10. It indicates that a
continuation of this trend may lead to shutting down of some of the high cost milk plants in the
near future.
Milk Production: Past Trend and Future Projections:
Next we use historical time-series data reported in Table 6 to review trends in fresh and UHT
milk production. In this regard, first we use data from 1971-72 to 2003-04 to estimate a time
trend for fresh milk production. This time trend is estimated by employing an exponential
function of the form yF = 5877e0.0504t, where yF is for fresh milk production and t depicts the year.
The estimated parameters are highly statistically significant (t-statistics is 27.0 and 32.8,
respectively), while the overall explanatory power of the model is very high since R2 = 0.98.
These results indicate that annual growth rate of fresh milk production from 1971-72 to 2003-04
is over 5% per annum. However, it conceals varying growth rates across different time periods.
This is shown in Figure 2 where we plot actual and fitted values of fresh milk production from
1971-72 to 2003-04. Despite overall smoothness of the predicted (solid) line in Figure 2, the
differential in growth rates across various time periods becomes obvious when we look at the
actual data points depicted by the dotted line. It clearly shows that annual growth rate of fresh
milk production is lower in pre-1981-85 period if compared with the period from 1984-85 to
1993-94. However, we notice an upward jump in fresh milk production in 1995-96, which is
followed by a relatively lower annual growth in fresh milk production. We conjecture that this
13 For ease of presentation, we report only the later half of a fiscal year in the horizontal-axis in this and all subsequent figures. For instance, FY1994-95 is reported only as 1995.
14
upward jump may be explained by inter-censual data errors coming from the Livestock Census.
However, slower growth in later period may be explained by poor supply response of dairy
farmers due to falling real price of fresh milk.
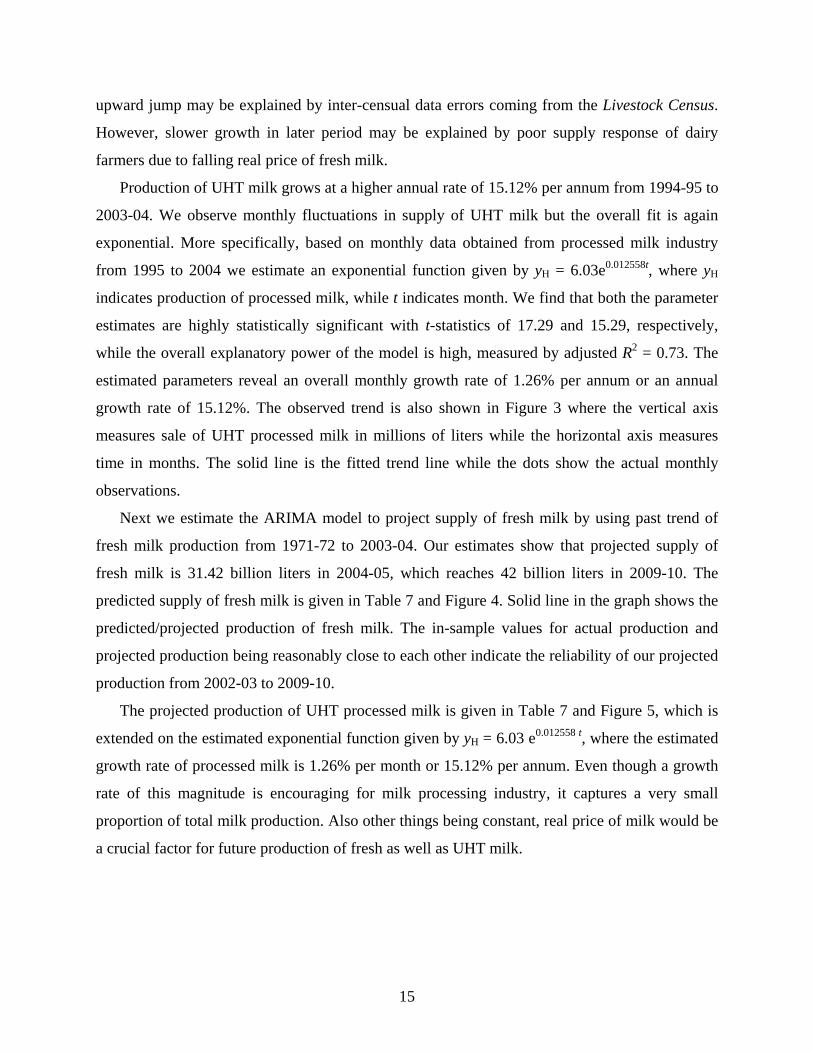
Production of UHT milk grows at a higher annual rate of 15.12% per annum from 1994-95 to
2003-04. We observe monthly fluctuations in supply of UHT milk but the overall fit is again
exponential. More specifically, based on monthly data obtained from processed milk industry
from 1995 to 2004 we estimate an exponential function given by yH = 6.03e0.012558t, where yH
indicates production of processed milk, while t indicates month. We find that both the parameter
estimates are highly statistically significant with t-statistics of 17.29 and 15.29, respectively,
while the overall explanatory power of the model is high, measured by adjusted R2 = 0.73. The
estimated parameters reveal an overall monthly growth rate of 1.26% per annum or an annual
growth rate of 15.12%. The observed trend is also shown in Figure 3 where the vertical axis
measures sale of UHT processed milk in millions of liters while the horizontal axis measures
time in months. The solid line is the fitted trend line while the dots show the actual monthly
observations.
Next we estimate the ARIMA model to project supply of fresh milk by using past trend of
fresh milk production from 1971-72 to 2003-04. Our estimates show that projected supply of
fresh milk is 31.42 billion liters in 2004-05, which reaches 42 billion liters in 2009-10. The
predicted supply of fresh milk is given in Table 7 and Figure 4. Solid line in the graph shows the
predicted/projected production of fresh milk. The in-sample values for actual production and
projected production being reasonably close to each other indicate the reliability of our projected
production from 2002-03 to 2009-10.
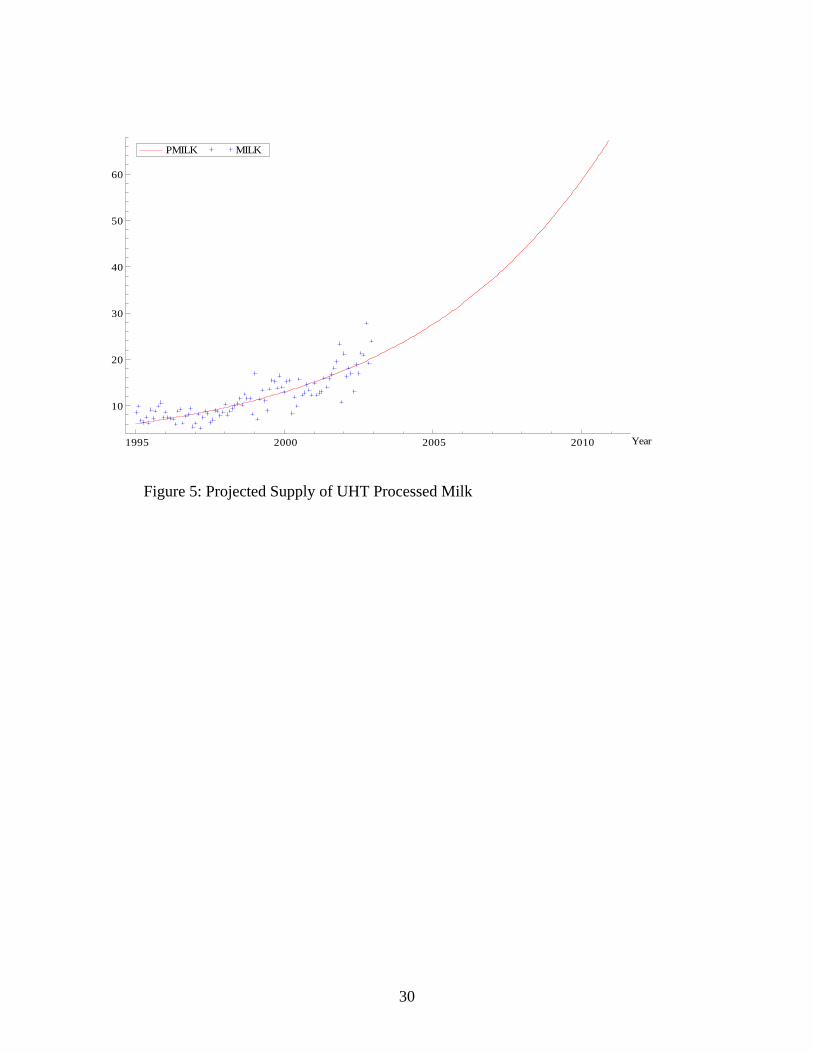
The projected production of UHT processed milk is given in Table 7 and Figure 5, which is
extended on the estimated exponential function given by yH = 6.03 e0.012558 t, where the estimated
growth rate of processed milk is 1.26% per month or 15.12% per annum. Even though a growth
rate of this magnitude is encouraging for milk processing industry, it captures a very small
proportion of total milk production. Also other things being constant, real price of milk would be
a crucial factor for future production of fresh as well as UHT milk.
15

Projecting Future Consumption of Milk:
Any good demand forecast must take into consideration three essential elements, namely: 1)
previous growth trend in sales; 2) randomness in previous trend of prices and sales; and 3) key
determinants of the demand. A most convenient method of obtaining such forecasts may simply
be based on historical growth rates, which only cover the first element. Nonetheless, such
forecasts neither accommodate randomness in market trends, nor take into account the
determinants of consumer behavior. An alternative method to this simple forecasting technique is
the ARIMA model, which is a combination of an autoregressive part that accounts for
randomness, and the moving average part that accounts for the historical growth rates. Even a
simple ARIMA model fails to take into consideration the parameters of consumer demand
model. Therefore, it is an improvement over the simple ARIMA model when we employ a
forecasting technique, which integrates the empirical demand model with the simple ARIMA
method. Here we employ this improved methodology to forecast demand for fresh and UHT
milk.
The estimates of income-elasticity are obtained by specifying separate demand functions for
fresh and processed milk in the following form:
Fresh Milk = f (Real price of fresh milk, Real per capita GNP),
UHT Milk = f (Real price of UHT milk, Real urban per capita GNP)
For the sake of convenience, we estimate these demand functions by using a double-log
functional form, which provides direct estimate of price and income elasticity. We use per capita
gross national product (GNP) instead of GDP to capture the affects of remittances on the
incomes of the population. The use of per capita GNP also helps us gauge joint impact of
increase in population and income levels in the country. These demand functions are estimated
by using the annual time-series data for fresh milk from 1971-72 to 2003-04 and monthly data
from 1994-95 to 2003-04 for UHT processed milk. For these specifications, the parameter
estimates can conveniently be interpreted as own-price and income elasticity.
We report parameter estimates of these demand functions separately for fresh milk and UHT
milk in Table 8. We find that price elasticity of demand is statistically insignificant as shown by
the t-statistics in the parenthesis. This is not surprising given small sample due to time-series
annual data. The elasticity of demand with respect to real per capita income is found to be
significantly elastic. These magnitudes make sense because fresh milk is considered a necessity.
16

However, the elastic response of income depicted by the income elasticity may be explained by
the fact that the current per capita consumption is constrained by low per capita income and as
per capita income rises, consumption of milk rises faster to fulfill basic caloric requirements.
This result may be considered as a positive sign for the growth of the dairy sector because real
per capita income in Pakistan is on the rise.
The estimates of demand function for UHT milk using monthly time series is also presented
in Table 8. The elasticity estimates for UHT milk are price and per capita income elastic and
highly statically significant, indicating an increasing share of UHT processing industry in the
overall milk consumption in the economy where per capita milk consumption is projected to be
rising and real UHT milk price is projected to be falling in future. Since the consumers of UHT
milk belong to middle and higher income groups mostly residing in urban areas, rapid expansion
of UHT milk consumption is expected with increasing urbanization and rising per capita income
and falling gap between the real prices of fresh and UHT milk. Based on our estimated demand
functions for fresh and processed milk, we project future consumption levels of fresh and UHT
milk from 2004-05 to 2009-10 and report them in Table 9 and Table 10.
Future Projections and Deficit/Surplus in Fresh and UHT Milk:
We present a comparison of the projections for fresh milk consumption and production in
Table 10, which indicates that fresh milk production lags behind consumption. More specifically,
if current production and consumption trends continue, fresh milk deficit in the country is
projected to peak in 2005-06 at 1320.38 million liters before falling to 519 million liters in 2009-
10. Similarly, we report our projections for the UHT milk in Table 10, which show that the dairy
processing industry is expected to face surplus production in the near future. If the current trends
in per capita income continue, this surplus is projected to rise from only 74.31 million liters per
annum in 2004-05 to 381.84 million liters in 2009-10. Our in-sample comparison of annual
average production and consumption (from 1995-95 – 2003-04) reveals only marginal
differentials for fresh milk and UHT milk indicating, in other words, supply-demand
equilibrium.
Our projections indicate net deficit in fresh milk market and net surplus in UHT milk market
from 2004-05 to 2009-10. Average annual deficit of fresh milk is projected at 1170.41 million
liters while average annual surplus of UHT milk is projected at 208.26 million liters. These
17

results indicate that if the current status quo in government policy continues milk processing
industry may face challenges lying ahead.
5. Industry Projections and Dairy Sector Outlook
In the previous section, our finding of a stagnant or falling real price of fresh milk during the
past ten years is alarming. Falling real price of fresh milk can elicit two types of responses from
dairy farmers: 1) they may be discouraged to make investment for improvement in their existing
stocks; and 2) an increase in real price of beef relative to the price of fresh milk can motivate
dairy farmers to reap immediate profits by getting rid of their existing stocks of milking animals
for slaughter.
It needs to be realized that in Pakistan same animal breeds are used for milk and meat
production. Recent scare of mad-cow disease in major meat importing Middle Eastern countries
has, not only, led to a surge in export demand for meat from Pakistan, but has also fueled a sharp
increase in retail price of beef in local markets. With rising real price of milking animals and
constant real price of fresh milk, there is a strong possibility that farmers, especially those
residing in non-milk producing areas, may have started selling their surplus stock of milking
animals for profit. If this is indeed the case, the existing growth rate of milk production might not
be sustainable in the long run. May be for the same reason, the Government of Pakistan has
allowed import of beef from India at a low tariff rate of 5% in November 2004. Our projections in Section 4 also indicate that if current trends in production and
consumption of fresh milk continue, Pakistan may face a large deficit in fresh milk supplies. The
deficits observed in fresh milk supplies may be partially filled by surpluses in UHT milk, which
seems very likely in the face of converging real prices of UHT and fresh milk.
Unlike other major milk producing countries in the European Union (EU) and the North
America where generous farm subsidies are provided to the dairy sector leading to dairy
surpluses, there are no subsidies offered to the dairy sector in Pakistan. The fact remains that
Pakistan is one of the few countries in the world, which truly enjoys comparative advantage in
milk production, despite its very low milk yields per animal. This is evident from the relative
18

farm gate price of fresh milk in Pakistan as compared with other major milk-producing nations in
the world.14
At another level, productivity of milk animals in Pakistan is very low if compared with
U.S.A., Germany and New Zealand. For example, one dairy animal in New Zealand produces
milk equal to three dairy animals in Pakistan; in Germany one dairy animal produces milk equal
to six dairy animals in Pakistan; and in U.S.A. one dairy animal produces milk equal to seven
dairy animals in Pakistan [Garcia et al. (2003)]. However, one dairy animal in India produces
milk equal to only 60% of that produced by one dairy animal in Pakistan even after substantial
improvement in Indian dairy sector [see, Garcia et al. (2003). Even though average milk yield
per animal in Pakistan is low, targeted policies for improvement in these areas offer a great
potential for rapid development of the dairy sector in Pakistan.
A sound dairy policy in Pakistan would, therefore, require steps that increase milk yields or
productivity of milking animals, on the one part, and ensures a greater share (price incentives) to
dairy farmers in retail prices of fresh milk, on the other part. Such measures gain more
significance due to the central role played by dairy production and marketing system in poverty
alleviation in the country. However, no serious attempt has yet been made to examine the nexus
between dairy sector development and poverty alleviation.
6. Conclusions and Recommendations
The purpose of this study was to provide a preliminary assessment of the state of Pakistan’s
dairy, explore the sector’s potential in making impact on the dairy economy, and to recommend
areas where more detailed research work is needed. We find that even though milk production
systems prevailing in Pakistan are plagued by lower milk yields, they offer immense potential for
growth in the short to long run. Marked changes in animal management and animal feeding
practices, especially by small dairy farmers, can be instrumental in raising milk yields in the
short run. However, to bring about improvements in the long run the farmers would need to
14 For instance, Garcia et al. (2003) has recently calculated that farm gate milk prices in leading milk producers of the world (e.g., Germany, U.S.A., New Zealand and India) are higher than those prevailing in Pakistan. The most notable difference in farm-gate price of fresh milk with Pakistan is found in U.S.A. and Germany where farm-gate price is more than double than that of Pakistan. Similarly, farm-gate price of fresh milk in India and New Zealand is respectively 53% and 40% higher than farm-gate paid in Pakistan.
19

make sustained efforts to improve their animal stocks, management systems, and production
technologies.
Because most dairying households belong to subsistence or near subsistence category, they
have high stakes in dairy production because dairy income often supplements farming or labor
income. Therefore, attempts to enhance production of smallholder dairying not only are
important for raising milk yield in the country; they could also become an effective tool of
raising incomes of impoverished rural households. Successful interventions in this type of dairy
farms could be the key for alleviating poverty in rural areas. Further research on production
structure in dairying could enable us understand the structural changes needed in this sector.
It is not clear which dairy farm size has the greatest potential of growth? This key question
needs thorough investigation. Moreover, there is a need to probe the interrelationships between
crop production and dairy farming in the context of economies of scale and scope so that an
optimal-mix between land and animal assets could be found to make dairying much more
competitive.
Our projections show increasing deficits in fresh milk market and increasing surpluses in
UHT milk market in the run up to 2009-10, which suggests that the industry should get ready to
face challenges.
The analysis shows that Pakistan’s milk yields are very low, and even simple management of
feed (proper timing, proper mix and so on) can increase yield substantially. This requires
intervention at two levels:
a) The farmers need to have better knowledge of feed management. This can be done by
involving milk plants and provincial livestock departments who can provide training and
extension services to dairy farmers.
b) The feed industry needs to be developed substantially to provide better quality animal feed at
affordable prices. Currently we do not have sufficient supply of high quality nutrients and
additives, especially in rural areas. A specific package needs to be developed with the help of
the government and in partnership with the private sector that would facilitate and encourage
the development of a modern feed industry. Further, the vast potential of using molasses as
concentrate in animal feed also need to be taped.
We also find that the animal stock is of poor quality as well. So even though better feed will
increase yield somewhat, to make the dairy sector commercially viable, the stock of animals
20

needs to be improved substantially in the long run. Artificial insemination facilities have to be
made widely available, and poor stock needs to be eliminated over time. These facilities need to
be cheap enough to be in the reach of poor people who are planning on keeping small herds. One
way of ensuring this is through provision of credit for better quality livestock only. Animal
husbandry contributes 30-40 percent of income to households that keep animals, and it can
contribute substantially in achieving goals concerning poverty alleviation. To exploit the
potential in this area more fully we recommend a) Zarai Tarakiati Bank, government micro-
credit providers as well as non-governmental organizations (NGOs) in the area of micro-credit
provision and rural poverty alleviation should focus on providing credit for rearing better quality
stock; and b) all of the above points are also essential for larger livestock farmers. Corporate
farming cannot take-off in Pakistan unless better feed and better stock are available, and credit
providers are willing to provide credit to the area. In sum, the dairy sector needs a lot more
research before we can understand it fully and recommend more comprehensive set of measures
that would facilitate its development.
21
References
Ali, F., and A. Parikh (1992). Relationships Among Labor, Bullock, and Tractor Inputs in Pakistan Agriculture. American Journal of Agricultural Economics. 74, 371 – 377.
Anjum, Muhammad S., K. Lodhi, A. A. Raza, F. Walters and S. Krause (1989). Pakistan’s Dairy Industry: Issues and Policy Alternatives. Special Report Series No. 14. Islamabad: Directorate of Agricultural Policy and Chemonics International Consulting Division (for the Economic Analysis Network Project and the USAID).
Garcia, O., K. Mahmood, and T. Hemme (2003). A Review of Milk Production in Pakistan with Particular Emphasis on Small-scale Producers. PPLPI Working Paper No. 3. Rome: Food and Agriculture Organization of the United Nations.
Government of Pakistan (1957). The First Five Year Plan, 1955-60. Karachi: National Planning Board.
Government of Pakistan (1966). Final Evaluation of the Second Five Year Plan (1960-65). Karachi: The Planning Commission.
Government of Pakistan (1990). Final Evaluation of the Sixth Five Year Plan (1983-88). Islamabad: The Planning Commission.
Government of Pakistan (1998). Livestock Census 1996. Agricultural Census Organization, Statistics Division, Lahore.
Government of Pakistan (2000). Statistical Supplement Economic Survey 1999-2000. Islamabad: Finance Division, Economic Adviser’s Wing.
Government of Pakistan (2002). Economic Survey 2001-2002. Islamabad: Finance Division, Economic Adviser’s Wing.
Government of Pakistan (2004). Economic Survey 2003-2004. Islamabad: Finance Division, Economic Adviser’s Wing.
Government of Pakistan (2002). Pakistan Statistical Yearbook 2002. Islamabad: Federal Bureau of Statistics, Statistics Division.
Nanda, Amarjit S., and T. Nakao (2003). Role of Buffalo in the Socioeconomic Development of Rural Asia: Current Status and Future Prospectus. Animal Science Journal, 74, 443 – 455.
Pindyck, R.S., and D.L. Rubinfeld (1998). Econometric Models and Economic Forecasts. 4th ed. New York: McGraw-Hill.
SMEDA (Small and Medium Enterprise Development Authority) (2000). Strategy Development in Milk Production and Distribution. Lahore: SMEDA.
22

Table 1: Herd Size by Household, 1996
Herd Size Households owning cattle (%)
Household owning buffaloes (%)
1 – 2 42.05 43.47 3 – 4 27.48 28.67 5 – 6 13.85 10.03
7 – 10 10.74 9.78 11 – 15 3.46 3.32 16 – 20 1.18 0.98 21 – 30 0.77 0.50 31 – 50 0.33 0.18
51 or more 0.14 0.07 Source: Authors’ calculations based on Government of Pakistan (1998), Vol. 1, Table 8.
Table 2: Percentage of Households Reporting Artificial Inseminations, 1996
Buffaloes Cows Pakistan 4.41 5.01 Punjab 5.61 6.54 Sindh 1.28 0.53 N.W.F.P 6.52 7.62 Balochistan 0.74 3.91
Source: Government of Pakistan (1998), Table18.
Table 3: Sources of Feed by Size of Herd, 1996
Only Stall Feeding (%) Only Grazing (%) Both Stall Feeding & Grazing (%)
Cattle Buffaloes Cattle Buffaloes Cattle Buffaloes Pakistan 31.9 48.2 8.7 6.3 59.4 45.5 Herd Size 1-2 50.3 66.2 3.9 3.3 45.8 30.5 3-4 43.5 59.8 4.5 4.0 52.0 36.2 5-6 37.1 53.7 5.7 4.8 57.2 41.5 7-10 32.6 47.3 7.4 6.0 60.0 46.7 11-15 27.4 39.7 9.9 7.6 62.7 52.7 16-20 22.4 33.3 12.7 8.6 64.9 58.1 21-30 17.1 27.9 14.4 11.0 68.5 61.1 31-50 13.8 24.6 17.2 14.7 69.0 60.7 51 or more 9.7 42.1 22.2 8.0 68.1 49.9
Source: Authors’ calculations based on Government of Pakistan (1998), Vol. 1, Table 21.
23

Table 4: Nominal and Real Price of Fresh and UHT Milk
Year GDP deflator
Nominal price of fresh milk
(Rs. liter)
Real price of
fresh milk (Rs. liter)
Nominal price of UHT milk
(Rs. liter)
Real price of
UHT milk (Rs. liter)
1971-72 10.37 1.26 12.15 -- -- 1972-73 12.01 1.39 11.57 -- -- 1973-74 14.88 1.80 12.09 -- -- 1974-75 18.20 2.40 13.18 -- -- 1975-76 20.39 2.71 13.28 -- -- 1976-77 22.57 3.03 13.42 -- -- 1977-78 24.61 3.11 12.64 -- -- 1978-79 25.96 3.22 12.40 -- -- 1979-80 28.68 3.48 12.13 -- -- 1980-81 31.78 3.77 11.86 -- -- 1981-82 34.76 4.20 12.08 -- -- 1982-83 36.60 4.64 12.68 -- -- 1983-84 40.13 4.95 12.33 -- -- 1984-85 41.95 5.53 13.18 -- -- 1985-86 43.33 5.68 13.11 -- -- 1986-87 45.29 5.85 12.92 -- -- 1987-88 49.65 6.08 12.25 -- -- 1988-89 53.91 6.47 12.00 -- -- 1989-90 57.38 7.14 12.44 -- -- 1990-91 64.88 7.71 11.88 -- -- 1991-92 71.42 8.82 12.35 -- -- 1992-93 77.61 9.90 12.76 -- -- 1993-94 87.59 11.07 12.64 -- -- 1994-95 100.00 12.18 12.18 25.00 25.00 1995-96 108.04 13.67 12.65 25.55 23.65 1996-97 122.46 15.12 12.35 25.66 20.95 1997-98 131.84 16.27 12.34 25.66 19.46 1998-99 139.68 17.71 12.68 29.33 20.99 1999-00 144.03 17.91 12.43 30.00 20.83 2000-01 151.01 18.21 12.06 30.00 19.87 2001-02 158.03 19.80 12.53 30.00 18.98 2002-03 164.46 21.44 13.04 31.00 18.84 2003-04 175.58 23.13 13.17 32.00 18.22
-- indicates that data were not available Notes: a) The base year is 1994-95 = 100.
b) For consistency, the base year of the GDP deflator was changed from 1980-81 to 1994-95. c) Data on nominal price of UHT milk was obtained from industry sources.
Sources: Government of Pakistan (2000, 2002, 2004)
24

Table 5: Price Projections for Fresh and UHT Milk with ARIMA Model
Year Nominal price of
fresh milk (Rs.liter)
Real price of fresh
milk (Rs.liter)
Nominal price of UHT milk (Rs.liter)
Real price of
UHT milk (Rs.liter)
2004-05 24.87 12.51 32.20 17.04 2005-06 26.66 12.70 32.24 16.32 2006-07 28.51 12.43 32.87 15.59 2007-08 30.40 12.44 33.50 14.87 2008-09 32.34 12.54 34.13 14.15 2009-10 34.33 12.47 34.76 13.43
Table 6: Actual Production of Fresh and UHT Milk Year Supply of fresh milk
(million liters) Supply of UHT milk (million
liters) 1971-72 6180.799 -- 1972-73 6500.379 -- 1973-74 6836.484 -- 1974-75 7189.967 -- 1975-76 7561.726 -- 1976-77 7952.708 -- 1977-78 8363.906 -- 1978-79 8796.365 -- 1979-80 9251.184 -- 1980-81 9729.520 -- 1981-82 10232.59 -- 1982-83 10761.67 -- 1983-84 11318.10 -- 1984-85 11903.31 -- 1985-86 12518.77 -- 1986-87 13166.06 -- 1987-88 13846.82 -- 1988-89 14562.77 -- 1989-90 15315.75 -- 1990-91 16107.65 -- 1991-92 16940.51 -- 1992-93 17816.42 -- 1993-94 18737.62 -- 1994-95 19706.46 78.63 1995-96 20725.39 91.42 1996-97 21797.00 106.29 1997-98 22924.03 123.58 1998-99 24109.32 143.68 1999-00 25566.00 167.04 2000-01 26284.00 194.22 2001-02 27031.00 225.81 2002-03 27811.00 262.53 2003-04 28624.00 305.23
-- indicates that data were not available Notes: Data on supply of UHT milk was obtained from industry sources. Sources: Government of Pakistan (2000, 2004)
25

Table 7: Predicted Supply of Fresh and UHT Milk
Year Supply of fresh milk (million liters)
Supply of UHT milk (million liters)
2004-05 29882.92 354.87
2005-06 31211.81 412.59
2006-07 32504.91 479.70
2007-08 33805.10 557.72
2008-09 35495.25 648.43
2009-10 37669.75 753.89 Notes: The projected values reported in this table were obtained by the ARIMA model.
Table 8: Parameter Estimates of the Ordinary Least Square Regressions
Demand for Fresh Milk Demand for UHT Milk Variable Parameter Parameter Constant −1.55**
(−2.03) −2.18 (− 0.97)
Real price of fresh milk −0.87 (−1.06) −2.47**
(−7.40) Real per capita GNP 1.74**
(11.82) --
Real per capita urban GNP -- 5.63**
(3.07) F-statistic 73.27 38.10 Adjusted-R2
0.83 0.44 Number of observations 33 120
-- indicates that data were not available Notes: (a) The demand function for UHT milk is based on monthly data. Since GNP data is not reported on a monthly
basis, we have used an approximation and converted yearly GNP into monthly observations. To obtain this series, first we divide yearly growth rate with twelve (to get monthly growth rate) and then extend the series on this constant growth rate and obtain a cumulative series of monthly GNP.
(b) Separate data on urban GNP is also not available from published sources. Therefore, we use a proxy measure for per capita urban GNP by dividing total GNP with urban population. In this way, we capture the trend by assuming that urban GNP grows at the same rate as national GNP. If actual urban GNP growth was faster than the national GNP, our income elasticity parameter for UHT milk may be on the higher side. But, our in-sample forecasts of the series are quite close to the actual indicating that the bias has little or no effect.
26

Table 9: Projections of Fresh Milk Production and Consumption Up to 2009 – 10 Years Annual Production
(million liters) Annual Consumption
(million liters) Annual Deficit (million liters)
Average, 1971-72 to 2003-04 15498.15 15601.53 −103.38
2004-05 29882.92 31194.59 −1311.67
2005-06 31211.81 32532.09 −1320.28
2006-07 32504.91 33785.13 −1280.22
2007-08 33805.10 34929.54 −1124.43
2008-09 35495.25 36361.25 −866.00
2009-10 37669.75 38188.92 −519.17
Average, 2004-05 to 2009-10 33428.29 34498.70 −1170.41
Note: The projected values of fresh milk consumption and production are obtained from the ARIMA model.
Table 10: Projections of UHT Milk Production and Consumption up to 2009 – 10
Year Annual Production (million liters)
Annual Consumption (million liters)
Annual Surplus (million liters)
Averages, 1994-5 to
2003-04 141.24 141.6 − 0.36
2004-05 354.87 280.56 74.31
2005-06 412.59 298.71 113.88
2006-07 479.70 317.1 162.6
2007-08 557.72 335.36 222.36
2008-09 648.43 353.71 294.72
2009-10 753.89 372.05 381.84
Average, 2004-05 to
2009-10 534.53 326.265 208.26
Note: The projected values of UHT milk consumption and production are obtained from the ARIMA model.
27
1995 2000 2005 201012.5
15
17.5
20
22.5
25
27.5
30
32.5
35REALPRICEUHT NOMINALPRICEUHTREALPRICEFRESHMILK NOMINALPRICEFRESHMILK
Figure 1: Actual and Projected Prices of Fresh and Processed Milk
Figure 2: Actual and Predicted Production of Fresh Milk
1975 1980 1985 1990 1995 2000
7500
10000
12500
15000
17500
20000
22500
25000
27500 PMILK MILK
YEAR
28

Figure 3: Actual and Projected Production of UHT Processed Milk
1975 1980 1985 1990 1995 2000 2005 2010
10000
15000
20000
25000
30000
35000
40000
Year
PMILK MILK
Figure 4: Projected Supply of Fresh Milk
1995 1996 1997 1998 1999 2000 2001 2002 2003
7.5
10
12.5
15
17.5
20
22.5
25
27.5 PMILK MILK
29
1995 2000 2005 2010
10
20
30
40
50
60
Year
PMILK MILK
Figure 5: Projected Supply of UHT Processed Milk
30