The State Of Food Insecurity In The World 2004
43
The State of Food Insecurity in the World 2004 monitoring progress towards the World Food Summit and Millennium Development Goals
-
Upload
xueyang-wang -
Category
Health & Medicine
-
view
2.962 -
download
12
description
Published in 2004 by the Food and Agriculture Organization of the United Nations Viale delle Terme di Caracalla, 00100 Rome, Italy The designations employed and the presentation of the material in this information product do not imply the expression of any opinion whatsoever on the part of the Food and Agriculture Organization of the United Nations concerning the legal or development status of any country, territory, city or area or of its boundaries, or concerning the delimitation of its frontiers or boundaries. The mention or omission of specific companies, their products or brand names does not imply any endorsement or judgement by the Food and Agriculture Organization of the United Nations. All rights reserved. Reproduction and dissemination of material in this information product for education or other non-commercial purposes are authorized without any prior written permission from the copyright holders provided the source is fully acknowledged. Reproduction of material in this information product for resale or other commercial purposes is prohibited without written permission of the copyright holders. Applications for such permission should be addressed to the Chief, Publishing Management Service, Information Division, FAO, Viale delle Terme di Caracalla , 00100 Rome , Italy or by e-mail to [email protected] . © FAO 2004 ISBN 92-5-105178-X Printed in Italy Photographs As cover (left to right): Thi ha Thein Nyan/UNEP/Topham; Claudio Marcozzi/UNEP/Topham; Felix O Granmakou/UNEP/Topham.
Transcript of The State Of Food Insecurity In The World 2004

The State of Food Insecurity in the World
2004
monitoring progress towards the World Food Summit and
Millennium Development Goals
The State of Food Insecurity in the World The sixth edition of The State of Food Insecurity in the World reports that the number of chronically hungry people in the developing world has fallen by only 9 million since the World Food Summit baseline period of 1990–1992. The conclusion is inescapable – we must do better.
Looking at the impressive progress that more than 30 countries in all developing regions have made in reducing hunger, the report highlights another clear and compelling lesson – we can do better.
And for the fi rst time, The State of Food Insecurity in the World 2004 presents provisional estimates of the staggering costs that hunger infl icts on households and nations – the millions of lives ravaged by premature death and disability, the billions of dollars in lost productivity and earnings. On both moral and pragmatic grounds, these estimates lead to one more unavoidable conclusion – we cannot afford not to do better.
The report also includes a special feature examining the impact that the rapid growth of cities and incomes in developing countries and the globalization of the food industry have had on hunger, food security and nutrition.
The State of Food Insecurity in the World 2004 concludes with an urgent appeal to scale up action, resources and commitment in order to achieve the World Food Summit goal. That goal of cutting the number of hungry people in half by the year 2015 can still be reached if we just focus our efforts over the next ten years on simple, low-cost, targeted actions that will improve food security quickly for very large numbers of people.
Hunger cannot wait.
TC/M/Y5650E/1/11.04/6000
ISBN 92-5-105178-X
9 7 8 9 2 5 1 0 5 1 7 8 8
AcknowledgementsThis sixth edition of The State of Food Insecurity in the World (SOFI) was prepared as a collaborative effort within FAO led by the Economic and Social Department (ES).
Overall leadership was provided by Hartwig de Haen, Assistant Director- General, ES, assisted by Kostas Stamoulis, Chief of the Agricultural Sector in Economic Development Service, who served as the chair of the core technical team. Valuable conceptual and editorial assistance was provided by Andrew Marx of KnowledgeView Ltd.
Other members of the core technical team in the ES Department were: Jelle Bruinsma, Global Perspectives Study Unit; Randy Stringer, Agricultural and Development Economics Division; Ali Arslan Gurkan, Commodities and Trade Division; Prakash Shetty, Food and Nutrition Division; Jorge Mernies, Statistics Division.
The following FAO staff provided technical contributions: Josef Schmidhuber, Global Perspectives Study Unit (ES); Jennifer Nyberg, Offi ce of the Assistant Director-General (ES); Cinzia Cerri, Haluk Kasnakoglu, Seevalingum Ramasawmy and Ricardo Sibrian, Statistics Division (ES); Luca Alinovi, Sumiter Broca, Gero Carletto, Benjamin Davis, Margarita Flores, Amdetsion Gebre-Michael, Guenter Hemrich, Naoko Horii, Madelon Meijer and Prabhu Pingali, Agricultural and Development Economics Division (ES); Terri Ballard, Gina Kennedy and Guy Nantel, Nutrition Division (ES); Maarten Immink and Jenny Riches, FIVIMS Coordination Unit (ES); Concepción Calpe and Henri Josserand, Commodities and Trade Division (ES); Lavinia Gasperini and Ester Zulberti, Research, Extension and Training Division (SD); Andrew MacMillan, Field Operations Division (TC).
The key estimates on food consumption
and undernourishment used in SOFI 2004 were produced by the Basic Data Branch and the Statistical Analysis Service of the FAO Statistics Division respectively.
FAO extends special thanks to the team of Banson, Cambridge, UK, for design, layout, editorial support and preparation of graphic material.
The Editorial Production and Design Group of the Information Division, GI, was responsible for language editing services, editorial quality control and production. Translations were provided by the Translation Group of the Conference, Council and Protocol Affairs Division, GI.
Published in 2004 by theFood and Agriculture Organization of the United NationsViale delle Terme di Caracalla, 00100 Rome, Italy
The designations employed and the presentation of the material in this information product do not imply the expression of any opinion whatsoever on the part of the Food and Agriculture Organization of the United Nations concerning the legal or development status of any country, territory, city or area or of its boundaries, or concerning the delimitation of its frontiers or boundaries.
The mention or omission of specifi c companies, their products or brand names does not imply any endorsement or judgement by the Food and Agriculture Organization of the United Nations.
All rights reserved. Reproduction and dissemination of material in this information product for education or other non-commercial purposes are authorized without any prior written permission from the copyright holders provided the source is fully acknowledged. Reproduction of material in this information product for resale or other commercial purposes is
prohibited without written permission of the copyright holders.
Applications for such permission should be addressed to the Chief, Publishing Management Service, Information Division, FAO, Viale delle Terme di Caracalla, 00100 Rome, Italy or by e-mail to [email protected].
© FAO 2004
ISBN 92-5-105178-X
Printed in Italy
PhotographsAs cover (left to right): Thi ha Thein Nyan/UNEP/Topham; Claudio Marcozzi/UNEP/Topham; Felix O Granmakou/UNEP/Topham.
The State of Food Insecurity in the World
2004
monitoring progress towards the World Food Summit and
Millennium Development Goals

The State of Food Insecurity in the World 20042
The State of Food Insecurity in the World 2004 reports on progress and setbacks in efforts to reach
the goal set by the World Food Summit (WFS) in 1996 – to halve the number of chronically hungry people in the world by the year 2015.
The fi rst section of the report, Under-nourishment around the world, presents
the latest estimates of the number of undernourished people along with pre-liminary calcu lations of the heavy eco-nomic burden imposed by hunger and malnutrition.
This year’s Special feature focuses on the impact that the rapid growth of cities and incomes in developing countries has had on hunger and food security.
The Towards the Summit commit-ments section presents examples of issues and actions that are essential to fulfi lling the commitments in the WFS Plan of Action and related Millennium Development Goals.
Tables provide detailed indicators of the status and progress of developing countries and countries in transition.
About this report
Food Insecurity and Vulnerability Information and Mapping Systems
It hardly seems that a year has gone by since I sat down to write the introduction for The State of Food Insecurity in the World 2003. Time passes by so quickly for many of us. But for hundreds of millions of hungry people who must worry about where their next meal will come from, this has been another long, painful year. In this publication we see that the number of hungry people remains intolerably high, progress in reaching them unconscionably slow and the costs in ruined lives and wasted resources incalculably large. For those children and adults who were reached, we may have made a life-changing difference. But the lives of far too many others continue to be plagued by hunger and poverty.
In last year’s report, I mentioned the external assessment of the Inter-Agency Working Group on FIVIMS (IAWG-FIVIMS) that was under way at that time. The assessment pulled no punches. While noting some very positive initiatives and results, it concluded that FIVIMS had failed to live up to its true potential. Our membership pledged to fi nd new ways of working together to meet a need that remains even more urgent today than when FIVIMS was created. At our annual meeting in April 2004, we agreed on a new organizational structure. We are currently defi ning our business plan for the future, and, in particular, identifying high-priority areas of activity for the next two years.
Our goal remains unchanged – to help countries establish quality food insecurity information systems that will provide the timely information needed both to formulate effective policies and programmes and to monitor progress in achieving global, national and local goals. We need to go beyond making a world of difference in the lives of a few hungry people to making a dif-ferent world – a world where the scourge of hunger is confi ned to the annals of the past.
Lynn R Brown (World Bank) Chair, IAWG-FIVIMS
IAWG-FIVIMS membership
Bilateral aid and technical agenciesAustralian Agency for International Development (AusAID)Canadian International Development Agency (CIDA)EuropeAid Co-operation Offi ce (EuropeAid)German Agency for Technical Cooperation (GTZ)United Kingdom Department for International Development (DFID)United States Agency for International Development (USAID)United States Department of Agriculture (USDA)
United Nations and Bretton Woods agenciesFood and Agriculture Organization of the United Nations (FAO)International Fund for Agricultural Development (IFAD)International Labour Organization (ILO)United Nations Department of Economic and Social Affairs (UNDESA)Offi ce for the Coordination of Humanitarian Affairs (OCHA)United Nations Development Programme (UNDP)United Nations Environment Programme (UNEP)United Nations Children’s Fund (UNICEF)United Nations Population Fund (UNFPA)World Bank (WB)World Food Programme (WFP)World Health Organization (WHO)World Meteorological Organization (WMO)United Nations System Standing Committee on Nutrition (SCN)
International agricultural research organizationsConsultative Group on International Agricultural Research (CGIAR)International Food Policy Research Institute (IFPRI)International Service for National Agricultural Research (ISNAR)International Center for Tropical Agriculture (CIAT)
International non-governmental organizationsHelen Keller International (HKI)The Rockefeller FoundationSave the Children Fund UK (SCFUK)World Resources Institute (WRI)
Regional organizationsSouthern African Development Community (SADC)Permanent Interstate Committee for Drought Control in the Sahel (CILSS)

The State of Food Insecurity in the World 2004 3
Contents
4 Foreword
Towards the World Food Summit target: confronting the
crippling costs of hunger
6 Undernourishment around the world
6 Counting the hungry: latest estimates
8 The human costs of hunger: millions of lives destroyed by
death and disability
11 The economic costs of hunger: billions in lost productivity,
earnings and consumption
14 Measuring hunger: improving estimates to target more
effective action
16 Hunger hotspots
18 Special feature
18 Globalization, urbanization and changing food systems
in developing countries
20 The impact of changing food systems on small farmers in developing countries
22 The changing profi le of hunger and malnutrition
24 Towards the Summit commitments
24 Acting to combat hunger
26 Factoring the resilience of food systems and communities
into the response to protracted crises
28 Education for rural people and food security
30 Rice and food security
32 The way ahead: scaling up action to scale down hunger
34 Tables
40 Sources

The State of Food Insecurity in the World 20044
Foreword
Towards the World Food Summit target:confronting the crippling costs of hunger
As we approach the mid-term review of progress towards the World Food Summit (WFS) goal,
FAO’s latest report on the state of food insecurity in the world highlights three irrefutable facts and three inescapable conclusions:
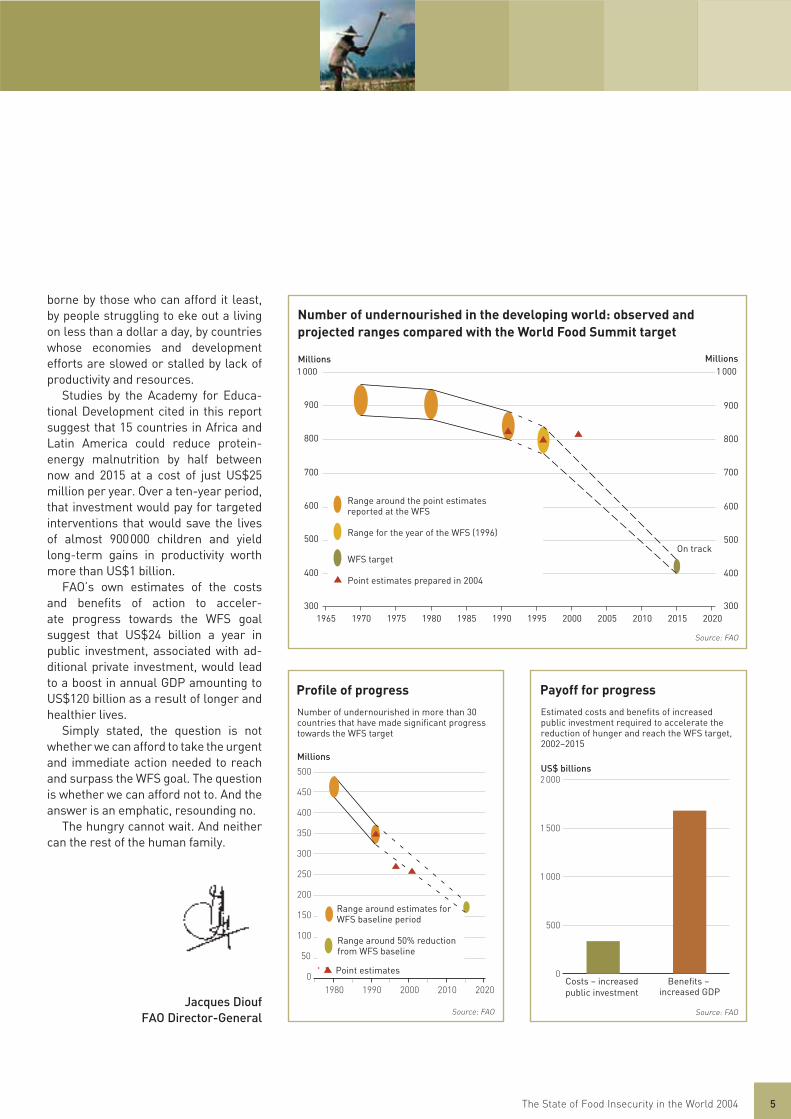
Fact number one: to date, efforts to reduce chronic hunger in the developing world have fallen far short of the pace required to cut the number of hungry people by half no later than the year 2015 (see graph). We must do better.
Fact number two: despite slow and faltering progress on a global scale, nu-merous countries in all regions of the developing world have proven that suc-cess is possible. More than 30 countries, with a total population of over 2.2 billion people, have reduced the prevalence of undernourishment by 25 percent and have made signifi cant progress towards reducing the number of hungry people by half by the year 2015. We can do better.
Fact number three: the costs of not taking immediate and strenuous action to reduce hunger at comparable rates worldwide are staggering. This is the central message I would like to convey to readers of this report. Every year that hunger continues at present levels costs more than 5 million children their lives and costs developing countries bil-lions of dollars in lost productivity and earnings. The costs of interventions that could sharply reduce hunger are trivial in comparison. We cannot afford not to do better.
We MUST do better
According to FAO’s latest estimates the number of hungry people in the develop-ing world has declined by only 9 million since the WFS baseline period, despite commitments made. More alarming
still, the number has actually increased over the most recent fi ve years for which numbers are available. In three of the four developing regions, more people were undernourished in 2000–2002 than had been the case in 1995–1997. Only Latin America and the Caribbean regis-tered a modest reduction in the number of hungry people.
We CAN do better
More than 30 countries, representing nearly half the population of the devel-oping world, have provided both proof that rapid progress is possible and lessons in how that progress can be achieved.
This successful group of countries is striking for several reasons. Every de-veloping region is represented, not only those whose rapid economic growth has been widely touted. Asia accounts for by far the largest drop in the number of hungry people. But sub-Saharan Africa boasts the most countries that have brought the prevalence of hunger down by 25 percent or more, although often from very high levels at the outset.
Among the African countries are several that demonstrate another key lesson – that war and civil confl ict must be regarded as major causes not only of short-term food emergencies but of widespread chronic hunger. Several countries that have recently emerged from the nightmare of confl ict fi gure prominently among those that have registered steady progress since the WFS as well as those that have scored rapid gains over the past fi ve years.
Many of the countries that have achieved rapid progress in reducing hun ger have something else in common – signifi cantly better than average ag-ricultural growth. Within the group of
more than 30 countries that are on track to reach the WFS goal, agricultural GDP increased at an average annual rate of 3.2 percent, almost one full percent-age point faster than for the developing countries as a whole.
Several of these countries have also led the way in implementing a twin-track strategy to attack hunger – strengthening social safety nets to put food on the tables of those who need it most on the one hand, while attacking the root causes of hunger with initiatives to stimulate food production, increase employability and reduce poverty on the other.
In certain cases, as Brazil’s Zero Hunger Programme has demonstrated by buying food for school lunch pro-grammes and other food safety nets from local small and medium-sized farms, the two tracks can be brought together in a virtuous circle of better diets, increased food availability, rising incomes and improved food security.
We cannot afford not to do better
In moral terms, just stating the fact that one child dies every fi ve seconds as a result of hunger and malnutrition should be enough to prove that we can-not afford to allow the scourge of hun-ger to continue. Case closed.
In economic terms the case is more complex but no less cogent. Every child whose physical and mental develop-ment is stunted by hunger and mal-nutrition stands to lose 5 to 10 percent in lifetime earnings. On a global scale, every year that hunger persists at cur-rent levels causes deaths and disability that will cost developing countries future productivity with a present discounted value of US$500 billion or more.
This crushing economic burden is
The State of Food Insecurity in the World 2004 5
borne by those who can afford it least, by people struggling to eke out a living on less than a dollar a day, by countries whose economies and development efforts are slowed or stalled by lack of productivity and resources.
Studies by the Academy for Educa-tional Development cited in this report suggest that 15 countries in Africa and Latin America could reduce protein-energy malnutrition by half between now and 2015 at a cost of just US$25 million per year. Over a ten-year period, that investment would pay for targeted interventions that would save the lives of almost 900 000 children and yield long-term gains in productivity worth more than US$1 billion.
FAO’s own estimates of the costs and benefi ts of action to acceler-ate progress towards the WFS goal suggest that US$24 billion a year in public investment, associated with ad-ditional private investment, would lead to a boost in annual GDP amounting to US$120 billion as a result of longer and healthier lives.
Simply stated, the question is not whether we can afford to take the urgent and immediate action needed to reach and surpass the WFS goal. The question is whether we can afford not to. And the answer is an emphatic, resounding no.
The hungry cannot wait. And neither can the rest of the human family.
Jacques DioufFAO Director-General
Costs – increasedpublic investment
Benefits – increased GDP
Estimated costs and benefits of increased public investment required to accelerate the reduction of hunger and reach the WFS target,2002–2015
Payoff for progress
Source: FAO
US$ billions
0
500
1 000
1 500
2 000
Number of undernourished in more than 30 countries that have made significant progress towards the WFS target
Profile of progress
Source: FAO
Millions
Range around estimates forWFS baseline period
Range around 50% reduction from WFS baseline
Point estimates
200
150
100
50
0
500
300
400
350
250
450
1980 1990 2000 2010 2020
Number of undernourished in the developing world: observed and projected ranges compared with the World Food Summit target
Source: FAO
700
900 900
800
700
600
500
400
800
600
500
400
300300
1 000 1 000Millions Millions
19701965 19801975 1985 1990 1995 2000 2005 2010 2015 2020
On track
Range around the point estimates reported at the WFS
Range for the year of the WFS (1996)
WFS target
Point estimates prepared in 2004

The State of Food Insecurity in the World 20046
FAO estimates that 852 million people worldwide were under-nourished in 2000–2002. This fig-
ure includes 815 million in developing countries, 28 million in the countries in transition and 9 million in the industri-alized countries.
The number of undernourished peo-ple in developing countries decreased by only 9 million during the decade following the World Food Summit base-line period of 1990–1992. During the second half of the decade, the number of chronically hungry in developing countries increased at a rate of almost 4 million per year, wiping out two thirds of the reduction of 27 million achieved during the previous five years.
The reversal during the second half of the decade resulted mainly from changes in China and India. China had registered dramatic progress during the first half of the decade, reducing the number of undernourished by almost 50 million. During the same period, India pared the number of undernourished by 13 million. Gains in these two countries drove the global totals down, despite the fact that the number of under-nourished in the rest of the developing
world increased by 34 million. During the second half of the decade, however, progress slowed in China, where the number of undernourished fell by only 4 million. In India the number increased by 18 million.
The news is not all bad, however. Just as gains in China and India outweighed setbacks elsewhere during the fi rst half of the decade, the slowdown in the two Asian giants masked signifi cant improvements in trends for the rest of the developing world. After climbing at a rate of almost 7 million per year, the number of undernourished in develop-
ing countries other than China and India essentially held steady during the sec-ond half of the decade. And the propor-tion of people who were undernourished declined from 20 percent to 18 percent.
Encouragingly, the most pronounced change in trends took place in sub- Saharan Africa. Between 1995–1997 and 2000–2002, the rate of increase in the number of undernourished slowed from 5 million per year to 1 million per year. And the proportion of undernourished in the region fell from 36 percent, where it had hovered since 1990-1992, to 33 percent.
Undernourishment around the world
Counting the hungry: latest estimates
Mex
ico
Kuw
ait
Alg
eria
Indo
nesi
aM
yanm
arG
abon
Mau
ritiu
sM
oroc
coJo
rdan
Bra
zil
Nig
eria
Jam
aica
Guy
ana
Mau
rita
nia
Chi
naEl
Sal
vado
rSu
rina
me
Trin
idad
and
Tob
ago
Leso
tho
Col
ombi
aP
eru
Gha
naP
arag
uay
Côt
e d’
Ivoi
reB
enin
Nep
alVe
nezu
ela
Viet
Nam
Uga
nda
Swaz
iland
Bur
kina
Fas
o
Tuni
sia
Liby
an A
rab
Jam
ahir
iya
Rep
. of K
orea
Arg
entin
aU
nite
d A
rab
Emir
ates
Mal
aysi
a
Cub
aLe
bano
nTu
rkey
Cos
ta R
ica
Chi
leEc
uado
rU
rugu
ayIr
an, I
slam
ic R
ep. o
fSa
udi A
rabi
aEg
ypt
Syri
an A
rab
Rep
.
2.5–4% undernourished
5–19% undernourished
Proportions of undernourished in developing countries, 1990–1992 and 2000–2002
The graph does not show four countries for which there were insuffi cient data for the years 2000–2002: Afghanistan, Iraq, Papua New Guinea and Somalia
< 2.5% undernourished80
60
40
20
0%
Undernourishment in the countries in transition
The number of undernourished in the countries in transition has risen from 23 million to 28 million since the break-up of the former Soviet Union, Czechoslovakia and Yugoslavia in 1991–1993. Most of the increase and the bulk of undernourished are in the countries of the Commonwealth of Independent States (CIS), where the proportion has increased from 7 percent to 9 percent.
1993–19952000–2002
CIS
Baltic States
Eastern Europe
0 2 4 6 8 10 % undernourished
Undernourished in the countries in transition
Source: FAO

The State of Food Insecurity in the World 2004 7
* 1993–1995 for countries in transition Source: FAO
Countries in transition
Near East/ North Africa
Latin America/ Caribbean
Asia/Pacific
Sub-Saharan Africa
0 10 20 30 40 % undernourished
Dem
. Peo
ple’
s R
ep. o
f Kor
ea
Yem
en
Rw
anda
Mad
agas
car
Con
go
Ang
ola
Cen
tral
Afr
ican
Rep
.
Uni
ted
Rep
. of T
anza
nia
Zim
babw
e
Libe
ria
Hai
ti
Ethi
opia
*
Moz
ambi
que
Zam
bia
Sier
ra L
eone
Bur
undi
Dem
. Rep
. of t
he C
ongo
Eritr
ea*
Thai
land
Pak
ista
n
Indi
a
Bol
ivia
Lao
Peo
ple’
s D
em. R
ep.
Phi
lippi
nes
Sri L
anka
Nam
ibia
Hon
dura
s
Gua
tem
ala
Sene
gal
Dom
inic
an R
ep.
Pan
ama
Cam
eroo
n
Gui
nea
Togo
Suda
n
Gam
bia
Mon
golia
Nic
arag
ua
Mal
i
Ban
glad
esh
Bot
swan
a
Cam
bodi
a
Ken
ya
Mal
awi
Cha
d
Nig
er
Source: FAO
Sour
ce: F
AO
Proportion undernourished by region
Changes in numbers of undernourished in developing subregions
80
60
40
20
0%
20–34% undernourished
35% undernourished
Grey bars: 1990–1992 Coloured bars: 2000–2002 Countries grouped by prevalence of undernourishment in 2000–2002
* Ethiopia and Eritrea were not separate entities in 1990–1992
Changes in proportion of undernourished in developing subregions
1990–1992 to 1995–1997 (percentage points)
ChinaIndia
Southeast AsiaWest Africa
South AmericaSouthern Africa
East AfricaNorth Africa
North AmericaOther South AsiaCentral America
CaribbeanNear East
Other East AsiaCentral Africa
–5 0 5 10 15 20
Reduction (progress)
Increase (setback)
1995–1997 to 2000–2002 (percentage points)
-10 –5 0 5 Source: FAO
Undernourished 2000–2002(millions)
Countries in transition 28
Near East/North Africa 39
Latin America/ Caribbean 53
Sub-Saharan Africa 204
Industrialized countries 9
India 221
China 142
Asia/Pacific* 156
Developing countries: 815 WORLD: 852
1990–1992 to 1995–1997 (millions)
ChinaIndia
Southeast AsiaSouth America
West AfricaNorth Africa
North AmericaCentral America
CaribbeanSouthern AfricaOther East Asia
Other South AsiaNear EastEast Africa
Central Africa–50 –40 –30 –20 –10 0 10 20
Reduction (progress)
Increase (setback)
–10 0 10 20
1995–1997 to 2000–2002 (millions)
1990–1992*2000–2002
* excl. China and India Source: FAO

The State of Food Insecurity in the World 20048
Hunger and malnutrition inflict heavy costs on individuals and households, communities and
nations. Undernourishment and defi-ciencies in essential vitamins and min-erals cost more than 5 million children their lives every year, cost households in the developing world more than 220 million years of productive life from family members whose lives are cut short or impaired by disabilities related to malnutrition, and cost developing countries billions of dollars in lost pro-ductivity and consumption.
The vicious cycle of deprivation
Every year, more than 20 million low birthweight (LBW) babies are born in the developing world. In some coun-tries, including India and Bangladesh, more than 30 percent of all children are born underweight.
From the moment of birth, the scales
are tipped against them. LBW babies face increased risk of dying in infancy, of stunted physical and cognitive growth during childhood, of reduced working capacity and earnings as adults and, if female, of giving birth to LBW babies themselves (see diagram).
Compared with normal babies, the risk of neonatal death is four times higher for infants who weigh less than 2.5 kilograms at birth and 18 times higher for those who weigh less than 2.0 kilograms. LBW babies also suffer sig-nifi cantly higher rates of malnutrition and stunting later in childhood and as adults. A study in Guatemala found that by the time they reached adolescence LBW boys were 6.3 centimetres shorter and 3.8 kilograms lighter than normal, while girls lost 3.8 centimetres in height and 5.6 kilograms in weight.
Almost one third of all children in developing countries are stunted, with heights that fall far enough below the
normal range for their age to signal chronic undernutrition. Stunting, like LBW, has been linked to increased ill-ness and death, to reduced cognitive ability and school attendance in child-hood and to lower productivity and life-time earnings in adults.
When stunting occurs during the fi rst fi ve years of life, the damage to physical and cognitive development is usually irreversible (see graph). The costs in blighted health and opportu-nities extend not only throughout the victim’s lifetime but on to the next gen-eration, as malnourished mothers give birth to LBW babies. Maternal stunting is one of the strongest predictors for giving birth to a low birthweight infant, along with underweight and low weight gain during pregnancy.
Undernourishment and stunting fre-quently overlap with vitamin and min-eral defi ciencies that affl ict nearly 2 billion people worldwide. Even when
Undernourishment around the world
The human costs of hunger: millions of lives destroyed by death and disability
Impact of hunger and malnutrition throughout the life cycle
Higher mortality rate Impaired mental
development Increased risk of adult chronic disease
Untimely/inadequate weaning
Frequent infection
Inadequate food, health and care
Reduced mental capacity
Inadequate food, health and care
Reduced physical capacity and fat-free mass
Inadequate food, health and care
Higher maternal mortality
Inadequate food, health
and care
Inadequate catch-up
growthInadequate foetal nutrition
BABYlow
birthweight
CHILD stunted
ADOLESCENT stunted
PREGNANCY low weight
gain
OLDER PEOPLEmalnourished
WOMAN malnourished
Reduced capacity to care for child
Source: Seres, ACC/SCN Source: Martorell, Khan and Schroeder
Persistence of stunting from childhood into adulthood
Stunting at age five Mild Moderate Severe
0
-5
-10
-15
-20
-25
Guatemala Male Female
India Male Female
Cen
tim
etre
s be
low
nor
mal
at
age
18

The State of Food Insecurity in the World 2004 9
mild, these micronutrient defi ciencies signi fi cantly increase the risk of death and severe illness. They can also cause irreversible cognitive defi cits in children and productivity losses for adults. Iron defi ciency, for example, has been linked to increased maternal mortality in child-birth, poor motor and cognitive devel-opment in child ren and reduced pro-ductivity in adults. Iron defi ciency af-fl icts an estimated 1.7 billion people worldwide, half of whom suffer from iron defi ciency anaemia.
Undernutrition and child mortality
More than three quarters of all child deaths are caused by neonatal disorders and a handful of treatable infectious diseases, including diarrhoea, pneu-monia, malaria and measles. And well over half of these deaths can be traced to the increased vulnerability of children who are undernourished and under-
weight (see graph). Micronutrient defi -ciencies also increase the risk of death from childhood diseases. A defi ciency in vitamin A, for example, increases the risk of dying from diarrhoea, measles and malaria by 20 to 24 percent.
Overall, the World Health Organiza-tion (WHO) estimates that more than 3.7 million deaths in 2000 could be at-tributed to underweight. Defi ciencies in three key micronutrients – iron, vitamin A and zinc – each caused an additional 750 000 to 850 000 deaths.
A study of trends in malnutrition and child mortality in 59 developing countries between 1966 and 1996 found that reducing levels of underweight had a signifi cant effect on reducing child mortality, regardless of other socio-economic and policy changes.
Reductions of 60 percent in levels of underweight accounted for 16 percent of the decline in child mortality in Latin America and 27 percent of the decline in Asia, the Near East and North Africa. In sub-Saharan Africa, immunizations, antibiotics and other improvements in health care helped reduce child mortal-ity despite the fact that levels of under-weight increased. But if underweight had been reduced at the rate seen in the other regions, child mortality in sub- Saharan Africa would have fallen much more rapidly, by 60 percent instead of 39 percent. Looking ahead, the study estimated that reducing the prevalence of underweight by 5 percentage points could reduce child mortality by about 30 percent.
Another recent study found that in-terventions that are available today and are feasible for widespread use in dev-eloping countries could reduce child mortality by about two thirds. In the 42 countries where more than 90 percent of child deaths occur, a few affordable
and effective nutrition interventions, including breastfeeding, complemen-tary feeding, vitamin A and zinc supple-mentation, could reduce child mortality by 25 percent and save about 2.4 million children’s lives each year.
The DALY costs of hunger
Malnourished people who survive child-hood often suffer from lifelong physical and cognitive disabilities. One measure that has been used to quantify the impact of malnutrition on both poor health and increased mortality is called disability-adjusted life years or DALYs – the sum of years lost as a result both of premature death and of disabilities, adjusted for severity.
The Global Burden of Disease Study, sponsored by WHO and the World Bank, calculates DALYs caused by a wide range of diseases and conditions and estimates the percentage that can be attributed to various risk factors, in-cluding childhood and maternal mal-nutrition. The latest Burden of Disease report ranks being underweight as the single most signifi cant risk factor for DALYs worldwide (see graph, next page) and for both death and DALYs in “high-mortality developing countries” – a group that includes almost 70 countries with a combined population of more than 2.3 billion people.
In all, six of the ten leading risk fac-tors for DALYs in these high-mortality countries are related to hunger and mal-nutrition, including un derweight, defi -ciencies in zinc (ranked fi fth), iron (sixth) and vitamin A (seventh), and unsafe wa-ter, sanitation and hygiene (third), which contributes to malnutrition by causing infections that prevent digestion and ab-sorption of nutrients (see graph).
Around 50 percent of DALYs caused Source: Black, Morris and Bryce
Global child deaths by cause
Neonatal disorders
Diarrhoea
Pneumonia
Malaria
Other
AIDS
Measles
Unknown
0 5 10 15 20 25 30 35% of child deaths
Proportion due to being underweight

The State of Food Insecurity in the World 200410
by diarrhoea, pneumonia and malaria in high-mortality developing countries can be attributed to underweight. When the impact of micronutrient defi ciencies is added, the proportion of DALYs from these diseases attributable to malnutri-tion rises to between 60 and 80 percent (see graph).
As might be expected, underweight and micronutrient defi ciencies rank lower as risk factors for death and dis-ability in more advanced developing countries with lower mortality rates. But nutrition-related conditions still
domi nate the list of risk factors. Among low-mortality developing countries – a group that includes China, several other countries in Asia and most of South America – underweight and iron defi -ciency remain among the top ten risk factors. They are joined on the list by overweight and a number of other diet-related risks that contribute to non-communicable chronic diseases such as ischaemic heart disease, high blood pressure and diabetes.
These chronic diseases are generally associated not with hunger but with
overnutrition. A growing body of evi-dence suggests, however, that low birth-weight and undernutrition early in life increase the risk of obesity and diet-related diseases in adulthood (see also page 23). In China, more than 30 per-cent of diabetes and around 10 percent of both strokes and coronary heart disease are estimated to be caused by childhood undernutrition (see graph).
Overall, not including their contribu-tion to adult chronic diseases, child-hood and maternal undernutrition are estimated to cost more than 220 million DALYs in developing countries. When other nutrition-related risk factors are taken into account, the toll rises to al-most 340 million DALYs, fully one half of all DALYs in the developing world.
That total represents a loss of pro-ductivity equivalent to having a disaster kill or disable the entire population of a country larger than the United States of America. It also highlights the im-measurable suffering that the ongoing disaster of world hunger infl icts on millions of households and the crush-ing economic burden it imposes on countries throughout the developing world.
Chronic diseases and childhood undernutrition, China and Sri Lanka
Coronary heart
disease
Diabetes
Stroke
0 10 20 30 40 % of chronic disease due to childhood undernutrition
Source: Popkin, Horton and KimSource: WHO
Nutritional risk factors for childhood and childbirth in developing countries with high mortality rates, 2000
Diarrhoeal diseases
Lower respiratory infections
Malaria
Measles
Maternal mortality
0 20 40 60 80 100% of DALYs attributable to malnutrition
Source: WHO
Global DALYs attributed to nutrition-related risk factors, 2000
Underweight (1, 1*)
Unsafe water/sanitation** (6, 3)
Iron deficiency (9, 6)
Overweight (10)
Zinc deficiency (11, 5)
Low fruit/vegetable intake (12)
Vitamin A deficiency (13, 7)
Physical inactivity (14)
0 30 60 90 120 150Attributable DALYs (millions)
Developing countries with high mortalityDeveloping countries with low mortalityDeveloped countries
* rank among risk factors worldwide and in developing countries with high mortality** includes inadequate hygiene
UnderweightVitamin A deficiencyZinc deficiencyIron deficiency
ChinaSri Lanka
Undernourishment around the world
The State of Food Insecurity in the World 2004 11
Estimating the millions of human lives cut short or scarred by dis-ability leaves no doubt that hun-
ger is morally unacceptable. Calcu-lating the value of lost productivity in dollars suggests that allowing hunger to persist is simply unaffordable, not only to the victims themselves but to the economic development and pros-perity of the nations in which they live.
The costs of hunger to society come in several distinct forms. Perhaps the most obvious are the direct costs of dealing with the damage it causes. These include the medical costs of treating both the problem pregnancies and deliveries of anaemic, underweight mothers and the severe and frequent illnesses of children whose lives are threatened by malaria, pneumonia, di-arrhoea or measles because their bod-ies and immune systems have been weakened by hunger.
A very rough estimate, apportioning medical expenditures in developing countries based on the proportion of disability-adjusted life years ( DALYs) attributed to child and maternal under-
nutrition, suggests that these direct costs add up to around US$30 billion per year – over fi ve times the amount committed so far to the Global Fund to Fight AIDS, Tuberculosis and Malaria.
These direct costs are dwarfed by the indirect costs of lost productivity and income caused by premature death, disability, absenteeism and lower edu-cational and occupational opportunities. Provisional estimates suggest that these indirect costs range into the hun-dreds of billions of dollars.
Both the direct and indirect costs represent the price of complacency, of allowing widespread hunger to persist. Both are unacceptably high, not only in absolute terms but in com-parison with estimates of a third type of costs – the costs of interventions that could be taken to prevent and eliminate hunger and malnutrition. Numerous studies suggest that every dollar invested in well-targeted inter-ventions to reduce undernourishment and micronutrient defi ciencies can yield from fi ve times to over 20 times as much in benefi ts.
Lifetime costs of childhood hunger
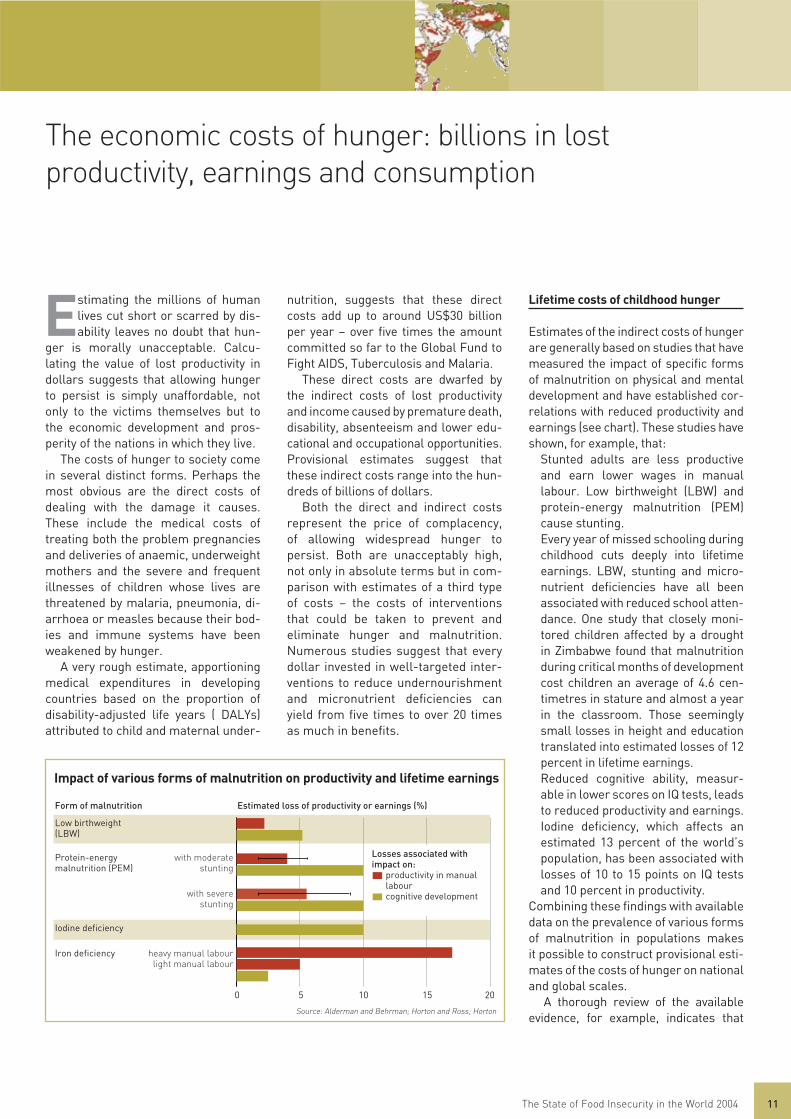
Estimates of the indirect costs of hunger are generally based on studies that have measured the impact of specifi c forms of malnutrition on physical and mental development and have established cor-relations with reduced productivity and earnings (see chart). These studies have shown, for example, that: Stunted adults are less productive
and earn lower wages in manual labour. Low birthweight (LBW) and protein-energy malnutrition (PEM) cause stunting.
Every year of missed schooling during childhood cuts deeply into lifetime earnings. LBW, stunting and micro-nutrient defi ciencies have all been associated with reduced school atten-dance. One study that closely moni-tored children affected by a drought in Zimbabwe found that malnutrition during critical months of development cost children an average of 4.6 cen-timetres in stature and almost a year in the classroom. Those seemingly small losses in height and education translated into estimated losses of 12 percent in lifetime earnings.
Reduced cognitive ability, measur-able in lower scores on IQ tests, leads to reduced productivity and earnings. Iodine defi ciency, which affects an estimated 13 percent of the world’s population, has been associated with losses of 10 to 15 points on IQ tests and 10 percent in productivity.
Combining these fi ndings with available data on the prevalence of various forms of malnutrition in populations makes it possible to construct provisional esti-mates of the costs of hunger on national and global scales.
A thorough review of the available evidence, for example, indicates that
The economic costs of hunger: billions in lost productivity, earnings and consumption
Source: Alderman and Behrman; Horton and Ross; Horton
Impact of various forms of malnutrition on productivity and lifetime earnings
Form of malnutrition
Low birthweight(LBW)
Protein-energy malnutrition (PEM)
Iodine deficiency
Iron deficiency
0 5 10 15 20
with moderate stunting
with severe stunting
heavy manual labourlight manual labour
Estimated loss of productivity or earnings (%)
Losses associated with impact on: productivity in manual
labour cognitive development

The State of Food Insecurity in the World 200412
switching one LBW infant to non-LBW status could yield almost US$1 000 in benefi ts over a lifetime (see graph). With about 20 million LBW children born every year in developing coun-tries, the costs of doing nothing for one more year add up to around US$20 billion.
These benefi ts include estimates of reductions both in the direct costs of neonatal care, illness and chronic dis-eases and in the indirect costs of pro-ductivity lost as a result of shortened working lives and impaired physical and cognitive development. Since the bene-fi ts are estimated as the current value of increased productivity over the course of a lifetime, a discount value must be ap-plied to account for infl ation and the
probability that any given individual may not survive or work throughout the nor-mal span of working years.
Estimating the losses of a lifetime
The Academy for Educational Develop-ment (AED) has developed a methodol-ogy and software for quantifying both the costs of various forms of mal nu-trition and the benefi ts of action to re-duce or eliminate it. FAO calcu lations based on data provided by AED show that the discounted present value of al-lowing current levels of iodine defi cien-cy and PEM to persist for another ten years range as high as 15 percent of one year’s GDP (see graph below and on-line technical note cited on page 40).
A similar exercise estimated the long-term costs incurred for every year that iron defi ciency remains at current levels in a different set of ten countries. The present discounted value of costs asso-ciated with iron defi ciency anaemia ranged from about 2 percent of GDP in Honduras to 8 percent in Bangladesh (see graph, next page). In a big country
like India, whose GDP in 2002 topped US$500 billion, the estimated present value of the cost of iron defi ciency totals more than US$30 billion.
These fi gures represent the dis-counted present values of costs im-posed over a life time by a specifi c form of malnutrition. If the cost of anaemia to Bangladesh is estimated to be equiva-lent to 8 percent of GDP, for example, this does not mean that anaemia slash-es output by 8 percent every year. Rather it means that for every year that the prevalence of anaemia remains un-changed, the present value of costs spread over the lifetimes of the current generation of fi ve-year-olds amounts to 8 percent of one year’s GDP.
None of these estimates present any-thing like a full accounting of the costs of hunger. Among other limitations, the calculations: take account only of market activities,
ignoring the value of work performed inside the home;
fail to take account of the fact that wages are likely to grow over time;
generally do not include the transmis-
Costs of protein-energy malnutrition and iodine defi ciency
20
15
10
5
0
* United Rep. of Source: FAO from AED data
Benin
Bolivi
aBot
swan
aBur
kina F
aso
China
Côte d
’Ivoir
eGua
tem
ala
Guine
aKen
yaLe
soth
oLi
beria
Mad
agas
car
Mal
iM
ozam
biqu
eSen
egal
Tanz
ania*
Ugand
a
Protein-energy malnutrition (PEM)Iodine deficiency
% of GDP
Undernourishment around the world
Source: Alderman, Behrman and Hoddinott
Estimated benefits of shifting one infant from low birthweight status
Lower infant mortality 94.66
Lower costs of chronic diseases 73.83
Higher productivity from higher ability 434.06
Higher productivity from less stunting 180.17
Less neonatal care 41.80
Intergenerational benefits 122.26
Reduced illness 38.83
Total: 985.61
1 000
800
600
400
200
0
Discounted present value using 3% discount US$
Discounted present value of estimated long-term costs of allowing protein-energy malnutrition and iodine defi -ciency to persist at current levels for another ten years, as a percentage of one year’s GDP, selected countries.

The State of Food Insecurity in the World 2004 13
sion of malnutrition from one genera-tion to the next, as under nourished mothers give birth to LBW babies;
depend on somewhat arbitrary dis-count rates to calculate the present value of costs spread over a lifetime. The choice of rates is diffi cult to de-termine and can make a big differ-ence in the estimated benefi ts.
Yet even these partial and provisional estimates make it clear that the costs of hunger are extremely high. Take the low end of the estimated range of lost pro-ductivity and earnings for each individu-al form of malnutrition. Adjust for the likelihood that there may be consider-able overlap among them. Even with these conservative assumptions, the present discounted value of the com-bined costs of PEM, LBW and micro-nutrient defi ciencies would add up to at least 5 to 10 percent of GDP in the developing world – roughly US$500 billion to US$1 trillion.
Losses of that magnitude clearly rep-resent a signifi cant drag on national development efforts. AED’s estimates at the country level demonstrate that
they dwarf the costs of action to reduce or eliminate malnutrition. For the 25 countries for which AED data were made available, the benefi ts of inter-ventions to reduce PEM outweighed the costs by a factor of 7.7 to 1, on average. For actions to reduce iron and iodine defi ciencies, the benefi ts averaged 9.8 and 22.7 times the costs respectively (see graph).
The costs of missing the WFS goal
Coming at the costs of hunger from another direction, FAO conducted a macroeconomic study to estimate the benefi ts of reducing undernourishment by enough to meet the World Food Summit (WFS) target. The study esti-mated the value of increased produc-tion that would be unleashed by re -ducing the number of undernourished people in developing countries to around 400 million by the year 2015, in-stead of the approximately 600 million projected by a standard FAO model in the absence of concerted action to re-duce hunger.
Based only on the increased life ex-pectancy associated with higher levels of food availability required to meet the WFS goal, the total discounted value over the years up to 2015 was estimated to be approximately US$3 trillion, which translates into an annuity benefi t of US$120 billion per year.
This calculation, too, almost cer-tainly underestimates the true costs of hunger. But like the AED estimates it clearly demonstrates that the costs of allowing widespread hunger to persist are extremely high and far outweigh the costs of decisive action to eliminate it. The FAO study estimated that an in-crease of just US$24 billion per year in public investment would make it possi-ble to attain the WFS goal and reap US$120 billion in annual benefi ts.
Source: Horton and Ross
Costs of iron deficiency anaemia
Impaired cognitive development in childrenImpaired physical labour of adults
Bangl
ades
h
Indi
a
Pakist
an
Mal
iUni
ted
Rep.
of T
anza
nia
Egypt
Oman
Bolivi
a
Hondu
ras
Nicara
gua
% of GDP
Discounted present value of estimated long-term costs of allowing iron defi ciency anaemia to persist at current levels for another year, as a percentage of one year’s GDP, selected countries.
8
6
4
2
0
Source: FAO from AED data
Costs and benefits of interventions to reduce hunger and malnutrition
25
20
15
10
5
0 Iodine PEM** Iron Form of malnutrition to be reduced
Benefits as a multiple of costs (costs = 1)*
* Averages for 25 countries from AED calculations** Protein-energy malnutrition
CostsBenefits

The State of Food Insecurity in the World 200414
FAO’s estimates of the number of undernourished people in the world are the most closely fol-
lowed and widely cited element of The State of Food Insecurity in the World. News reports invariably headline the latest figures as a gauge of progress towards the targets set by the World Food Summit and the Millennium Development Goals – to reduce hunger by half by the year 2015.
Given the attention focused on these annual estimates, it is not surprising that the methodology employed to cal-culate them has been subject to close scrutiny and debate. Experts within and outside FAO have pointed out limita-tions in both the underlying data and FAO’s methods of analysing them.
In 2002, FAO hosted an International Scientifi c Symposium to review differ-ent methods of measuring food depri-vation and undernutrition and identify ways to improve FAO’s estimates. Since then, FAO has taken action both to improve its own methodology and to validate alternative, complementary approaches.
Measuring food deprivation
FAO’s estimates are essentially a mea-sure of food deprivation based on calcu-lation of three key parameters for each country: the average amount of food available per person, the level of in-equality in access to that food and the minimum number of calories required for an average person.
Average food availability comes from “food balance sheets” compiled by FAO every year by tallying how much of each food commodity the country produces, imports and withdraws from stocks, subtracting the amounts that were ex-ported, wasted, fed to livestock or used
for other non-food purposes, and divid-ing the caloric equivalent of all the food available for human consumption by the total population to come up with an av-erage daily food intake or dietary energy supply (DES).
Data from household surveys are used to derive a “coeffi cient of varia-tion” to account for the degree of in-equality in access to food. Similarly, since a large adult needs almost twice as many calories as a three-year-old child, the minimum requirement per person for each country takes into ac-count its mix of age, gender and body sizes. FAO reports the proportion of the population whose daily food consump-tion falls below that minimum daily re-quirement as undernourished.
FAO’s method of estimating food deprivation offers several advantages. In particular, it relies on data that are available from most countries in more or less the same form and can be up-dated regularly. This allows compari-sons across countries and over time.
But the FAO methodology also suffers from several obvious limitations. For one thing, the estimates it pro duces are only as reliable and accurate as the data used to calculate the food balance sheets, levels of inequality and daily energy requirement cut-off points. For many countries, the reliability of the underlying food balance sheet data and measures of inequality is uncertain. A relatively small variation in just one of these parameters can make a big dif-ference in a country’s estimated level of hunger (see graph).
Furthermore, estimates based on national production and trade fi gures cannot be used to pinpoint where hun-ger has become increasingly concen-trated in specifi c geographic areas and socio-economic groups.
Other approaches and dimensions
Many of the proposals to improve the FAO estimates put forward at the Sym-posium called for increased reliance on data obtained from household budget surveys. Such surveys, which are avail-able from an increasing number of de-veloping countries, provide data that can be used to calculate two of the parame-ters used in FAO’s estimates – daily food intake and the degree of inequality in access to food. They can also be used to measure other dimensions of hunger and food insecurity, including poor diet quality and vulnerability to food depriva-tion, and to monitor them over time within different areas and population groups.
Surveys also suffer from certain weaknesses. Data are not collected regularly in all countries. Even where they are, the surveys are usually updat-ed only once every three to fi ve years and the results are often not compara-ble across countries or even from one
Measuring hunger: improving estimates to target more effective action
Source: FAO
Impact of mean food consumption and inequality of access to food on estimates of undernourishment
70
60
50
40
30
20
10
0 1 700 2 040 2 450 2 940 Mean food consumption (kcal/person/day)
% undernourished
Coefficient of variation for dietary energy consumption distribution
Undernourishment around the world
0.20 0.24 0.29 0.35 higher number = greater inequality
The State of Food Insecurity in the World 2004 15
survey to the next. This limits their val-ue for monitoring national and global trends annually.
Nutritional status can be impaired not only by lack of food but by frequent illness, poor sanitation and other condi-tions that prevent people from getting full nutritional benefi t from their food. FAO’s estimates of undernourishment measure only food deprivation. Other indicators, such as the proportion of children who are stunted (short for their age) or underweight capture all the di-mensions that affect nutritional status. Most countries regularly collect such anthropometric data, though only every few years and only for children. Although the prevalence of stunting or underweight rarely matches the level of undernourishment, the relative magni-tude and overall trends generally coin-cide (see graph). Anthropometric data are extremely valuable for highlighting trends and evaluating interventions among particularly vulnerable groups, such as children and pregnant women.
Strengthening monitoring efforts
Since the Symposium, FAO has worked with more than 50 countries to improve their ability to apply FAO’s methodology to measure food deprivation for specifi c population groups. The mean of food consumption that is one of the key parameters in FAO’s estimates can be derived either from national food bal-ance sheets or from household budget surveys. In calculating the estimates given in this report, FAO relies on food balance sheets as the only way to obtain consistent global and regional coverage on a regular basis. When it comes to targeting geographical areas or popula-tion groups within countries, however, the FAO methodology can be applied using fi gures for both food consumption and inequality of access taken from household survey data.
By taking this approach, countries have been able to use data collected from household income and expen diture surveys to estimate levels of hunger
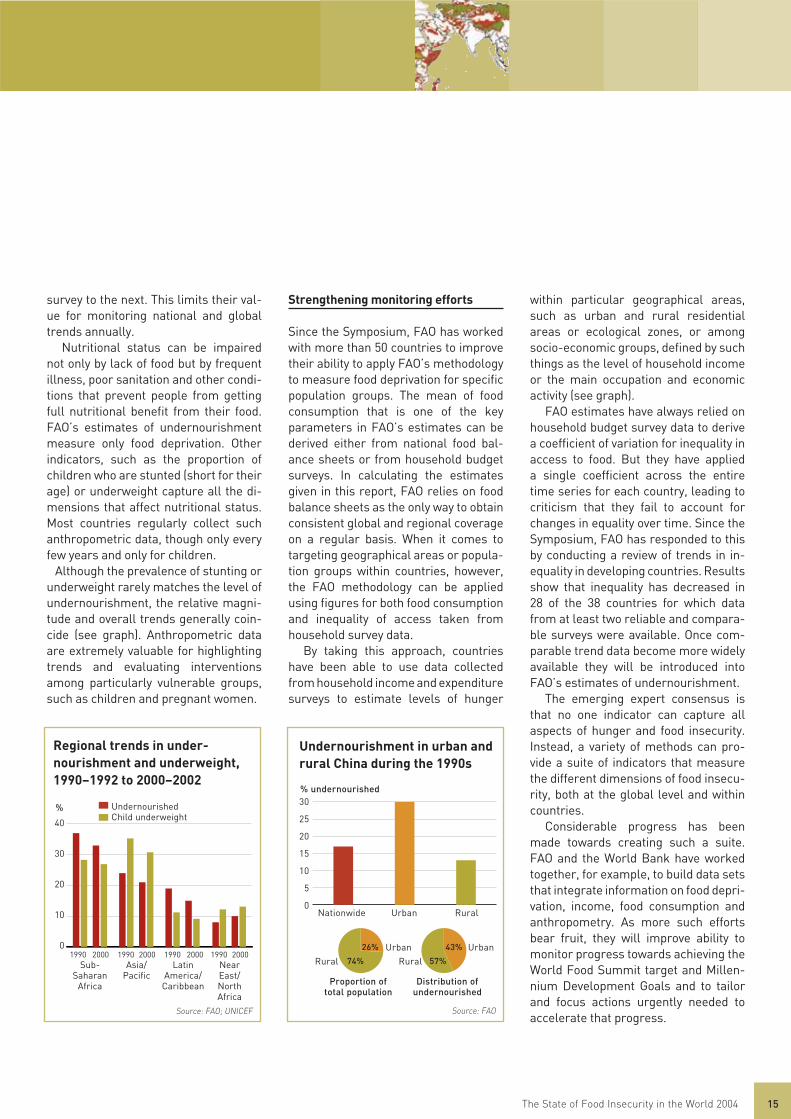
within particular geographical areas, such as urban and rural residential areas or ecological zones, or among socio-economic groups, defi ned by such things as the level of household income or the main occupation and economic activity (see graph).
FAO estimates have always relied on household budget survey data to derive a coeffi cient of variation for inequality in access to food. But they have applied a single coeffi cient across the entire time series for each country, leading to criticism that they fail to account for changes in equality over time. Since the Symposium, FAO has responded to this by conducting a review of trends in in -equality in developing countries. Results show that inequality has decreased in 28 of the 38 countries for which data from at least two reliable and compara-ble surveys were available. Once com-parable trend data become more widely available they will be introduced into FAO’s estimates of undernourishment.
The emerging expert consensus is that no one indicator can capture all aspects of hunger and food insecurity. Instead, a variety of methods can pro-vide a suite of indicators that measure the different dimensions of food insecu-rity, both at the global level and within countries.
Considerable progress has been made towards creating such a suite. FAO and the World Bank have worked together, for example, to build data sets that integrate information on food depri-vation, income, food consumption and anthropometry. As more such efforts bear fruit, they will improve ability to monitor progress towards achieving the World Food Summit target and Millen-nium Development Goals and to tailor and focus actions urgently needed to accelerate that progress.
Source: FAO; UNICEF
Regional trends in under-nourishment and underweight, 1990–1992 to 2000–2002
%
1990 2000 1990 2000 1990 2000 1990 2000 Sub- Asia/ Latin Near Saharan Pacific America/ East/ Africa Caribbean North Africa
40
30
20
10
0
Source: FAO
Undernourishment in urban and rural China during the 1990s
% undernourished30
25
20
15
10
5
0 Nationwide Urban Rural
UndernourishedChild underweight
Proportion of Distribution of total population undernourished
Urban UrbanRural Rural
26% 43%
74% 57%

The State of Food Insecurity in the World 200416
Undernourishment around the world
Hunger hotspots
As of July 2004, 35 countries faced food crises requiring emergency assistance. Neither the number
of crises nor their locations differed markedly from the situation reported in The State of Food Insecurity in the World 2003. Most of the crises were concentrated in Africa and were caused by drought, conflict or a combination of the two (see map). Almost all had per-sisted over a prolonged period, with an average duration of nine years.
In East Africa alone, the food security of over 13 million people was threatened by a combination of erratic rains and the impact of recent and ongoing confl icts. Escalating civil confl ict in the Darfur region of the Sudan uprooted more than a million people from their homes and fi elds, precipitating a major crisis. Elsewhere in the subregion, recurrent drought caused crop failures and heavy livestock losses in parts of Ethiopia, Eritrea, Somalia, Uganda and Kenya.
Trends in locations and causes
The number of food emergencies has been rising over the past two decades, from an average of 15 per year during the 1980s to more than 30 per year since the turn of the millennium. Most of this increase has taken place in Africa, where the average number of food emergencies each year has almost tripled (see graph).
The balance of causes of food emer-gencies has also shifted over time. Since 1992, the proportion of emergencies that can be attributed mainly to human causes, such as confl ict or economic failures, has more than doubled, rising from around 15 percent to more than 35 percent (see graph).
In many cases, natural and human-induced factors reinforce each other. Such complex crises tend to be the most severe and prolonged. Between 1986 and 2004, 18 countries were “in crisis” more than half of the time. War or economic and social disruptions caused or compounded the crises in all 18 (see graph, facing page). These coun-tries also offer evidence that frequent and prolonged crises cause widespread chronic undernourishment. FAO’s lat-est estimates list 13 of the 18 countries among those where more than 35 per-cent of the population goes hungry.
Monitoring hunger “hotspots”
In order to identify and monitor potential hunger “hotspots”, both the specifi cs of locations and the complexities of causes of food emergencies must be taken into account. Tracking weather conditions and crop prospects in regions regu-larly buffeted by monsoons, droughts and other recurring weather patterns is relatively straightforward. The task
Food emergencies and their causes, 2003–2004
Source: FAO
Conflict (13)Past conflict (6)Economic problems (2)Refugees (1)
Mainly human-induced (22) Mainly natural (18) Weather (mainly
drought,18)
Note: stripes indicate a combination of causes
Food emergencies by region
1986–1990
1991–1995
1996–2000
2001–2004 0 5 10 15 20 25 30 35 Average number of food emergencies
Sub-Saharan AfricaAsia/PacificEurope
Latin America/CaribbeanNear East/North Africa
Source: FAO Source: FAO
Primary causes of food crises
1986–1991
1992–2004
0 20 40 60 80 100% of crises
Human-induced (mainly conflict)Natural (mainly drought)Mixed
Primary cause

The State of Food Insecurity in the World 2004 17
of identifying potential human-induced and complex emergencies is much more diffi cult, requiring an ongoing assessment of many different environ-mental, economic, social and political indicators. Once a food emergency has been identifi ed, monitoring can provide the information needed to tailor effec-tive relief and rehabilitation measures.
Many countries that are plagued by unfavourable weather but enjoy relatively stable economies and govern-ments have implemented crisis preven-tion and mitigation programmes and established effective channels for relief and rehabilitation efforts. But when a country has also been battered by con-fl ict or economic collapse, programmes and infrastructure for prevention, relief and rehabilitation are usually disrupted or destroyed.
As the continent with the highest number and proportion of countries fac-ing food crises, Africa provides a good illustration, especially if one analyses
differences among the continent’s sub-regions.
East Africa, for example, not only experienced several of the most severe crises during 2003–2004 but includes six countries that have been in crisis more than half the time since 1986. The sub region suffers from frequent droughts and occasional torrential rains and fl oods. But the East African coun-tries that have suffered the most dev-astating and persistent crises are those that have been stricken by confl ict. The humanitarian crisis in Darfur, for exam-ple, engulfed an area that had generally enjoyed good rains and crops. The crisis was triggered by confl ict that drove an estimated 1.2 million people from their homes and prevented them from tend-ing their fi elds and herds.
The Sudan and other East African countries are less vulnerable to weather conditions than the neighbouring Sahel, where the single annual growing season receives an average of only 575 milli-
metres of rainfall in good years and is plagued with frequent droughts.
Sahel countries have been relatively free of confl ict, however. And after a series of devastating droughts, they have integrated the unpredictability and vol a tility of weather conditions into their agricultural and trade policies and farm-ing systems. As a result, these countries tend to fall into crisis less often than countries elsewhere on the continent. When crises do occur they tend to be less severe and far shorter. Since the mid-1980s, the longest emergencies in the Sahel lasted an average of one year. In East Africa, the average was more than 11 years (see graph).
Taking account of such differences in underlying causes of hunger and poverty and in countries’ vulnerability to natural disasters and human-induced crises is essential both for monitor-ing potential hunger hotspots and for responding effectively when crises do erupt.
Frequency and primary causes of chronic food emergency, 1986–2004
AngolaEthiopiaSomalia
SudanMozambiqueAfghanistan
HaitiLiberia
Sierra LeoneIraq
MongoliaDem. Rep. of the Congo
BurundiEritrea
TajikistanRwandaGeorgia
Armenia
Countries in crisis more than 50% of the time
Source: FAO Source: FAO
Sahel Central East Southern Africa Africa Africa
Duration of longest crises in African countries, 1986–2004
12
10
8
6
4
2
0
Subregional average (years)
Principal causes of food emergency
0 50 60 70 80 90 100 % of reporting periods “in crisis”
Current or past conflict
Economic problems
Weather(mainly drought)
The State of Food Insecurity in the World 200418
With more than 800 million peo-ple in developing countries still suffering from chronic under-
nutrition, hunger and food security will remain the top priority for food policy for many years to come. But profound demographic and economic changes are rapidly transforming food systems and the scope and nature of nutritional challenges.
Although the pace of change var-ies considerably from region to re-gion, common trends can be identi-fied throughout the developing world. Population is becoming increasingly urban. Average incomes and calorie intake are rising. Commodity and food prices are falling. An increasingly in-tegrated world trade environment and improved transportation facilities are spurring a greater concentration of the food industry and a convergence of dietary patterns and preferences.
Rapid growth of cities and incomes
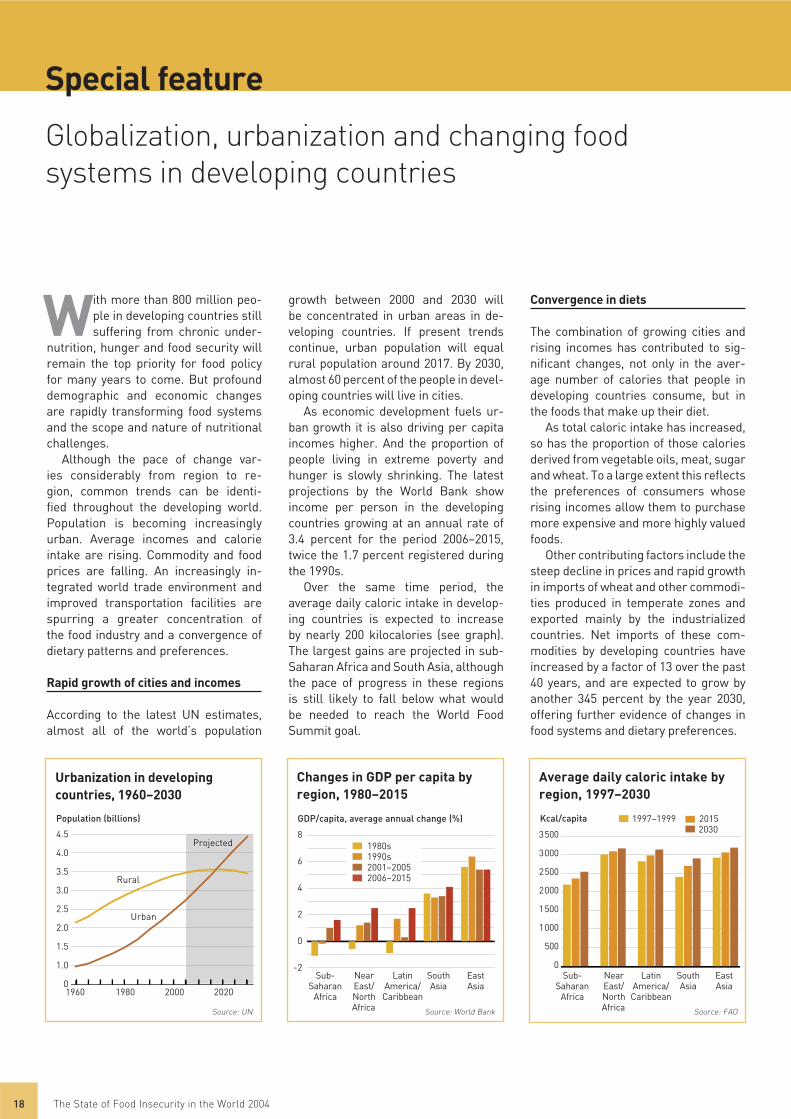
According to the latest UN estimates, almost all of the world’s population
growth between 2000 and 2030 will be concentrated in urban areas in de-veloping countries. If present trends continue, urban population will equal rural population around 2017. By 2030, almost 60 percent of the people in devel-oping countries will live in cities.
As economic development fuels ur-ban growth it is also driving per capita incomes higher. And the proportion of people living in extreme poverty and hunger is slowly shrinking. The latest projections by the World Bank show income per person in the developing countries growing at an annual rate of 3.4 percent for the period 2006–2015, twice the 1.7 percent registered during the 1990s.
Over the same time period, the average daily caloric intake in develop-ing countries is expected to increase by nearly 200 kilocalories (see graph). The largest gains are projected in sub-Saharan Africa and South Asia, although the pace of progress in these regions is still likely to fall below what would be needed to reach the World Food Summit goal.
Convergence in diets
The combination of growing cities and rising incomes has contributed to sig-nifi cant changes, not only in the aver-age number of calories that people in developing countries consume, but in the foods that make up their diet.
As total caloric intake has increased, so has the proportion of those calories derived from vegetable oils, meat, sugar and wheat. To a large extent this refl ects the preferences of consumers whose rising incomes allow them to purchase more expensive and more highly valued foods.
Other contributing factors include the steep decline in prices and rapid growth in imports of wheat and other commodi-ties produced in temperate zones and exported mainly by the industrialized countries. Net imports of these com-modities by developing countries have increased by a factor of 13 over the past 40 years, and are expected to grow by another 345 percent by the year 2030, offering further evidence of changes in food systems and dietary preferences.
Special feature
Globalization, urbanization and changing food systems in developing countries
Average daily caloric intake by region, 1997–2030
3 500
3 000
2 500
2 000
1 500
1 000
500
0 Sub- Near Latin South East Saharan East/ America/ Asia Asia Africa North Caribbean Africa
Kcal/capita
Source: FAO
Urbanization in developing countries, 1960–2030
4.5
4.0
3.5
3.0
2.5
2.0
1.5
1.0
01960 1980 2000 2020
Population (billions)
Changes in GDP per capita by region, 1980–2015
8
6
4
2
0
-2 Sub- Near Latin South East Saharan East/ America/ Asia Asia Africa North Caribbean Africa
GDP/capita, average annual change (%)
Source: World Bank
1980s1990s2001–20052006–2015
1997–1999 2015 2030
Source: UN
Rural
Urban
Projected

The State of Food Insecurity in the World 2004 19
Nutrition experts identify two distinct trends fuelled by these changes: dietary convergence and dietary adaptation. Dietary convergence refers to the in- creasing similarity in diets worldwide. It is characterized by a greater reliance on a narrow base of staple grains (wheat and rice), increased consumption of meat, dairy products, edible oil, salt and sugar, and lower intake of dietary fi bre (see graph). Dietary adaptation, on the other hand, refl ects the rapid pace and time pressures of urban lifestyles. In households where both parents of-ten commute long distances and work long hours, consumers eat more meals outside the home and purchase more brand-name processed foods.
Concentration of food processing and retail trade
The trends towards dietary convergence and adaptation have also been fuelled by the increasing concentration of food pro-cessing and retail trade. Latin America and Asia, the regions where these trends have been most pronounced, have expe-
rienced explosive growth both in invest-ments by transnational food corpora-tions and in the proportion of food sold through supermarkets.
In the decade 1988–1997, foreign di rect investment in the food industry increased from US$743 million to more than US$2.1 billion in Asia and from US$222 million to US$3.3 billion in Latin America, outstripping by far the level of investments in agriculture (see graph).
Over roughly the same period, the share of food sales made through su-permarkets more than doubled both in Latin America and in East and South-east Asia (see graph, next page). In Latin America, supermarkets increased their share of retail food sales by almost as much in one decade as it took them 50 years to do in the United States of America. In the larger and wealthier countries that account for three quar-ters of the Latin American economy, the share of supermarkets increased from about 15–20 percent in 1990 to 60 per-cent in 2000. In Asia, the supermarket boom started later but took off even more quickly. In just two years, from
1999 to 2001, the share of supermarkets in sales of packaged and processed food in urban China increased by more than 50 percent.
Transnational food companies played a big part in this supermarket boom as well. Between 1980 and 2001, each of the fi ve largest global supermarket chains (all based in Europe or the United States) expanded the number of coun-tries where it operated by at least 270 percent (see graph). The rapid growth and increasing concentration of super-markets are among the most visible causes and consequences of the trans-formation and consolidation of global food systems – the entire chain from agricultural production through trade, processing, retail and consumption. These changes have profound implica-tions for the food security and nutrition-al well-being of people at both ends of the chain, from farmers who must adapt to the requirements and standards of changing markets to urban consumers who depend increasingly on processed foods and meals purchased from street vendors and fast food restaurants.
Foreign investment in agriculture and the food industry, 1988–1997
3 500
3 000
2 500
2 000
1 500
1 000
500
0 1988 1997 1988 1997 1988 1997 Sub-Saharan Asia/ Latin America/ Africa Pacific Caribbean
US$ (millions)
Source: FAO
Global expansion of transnational supermarkets, 1980–2001
35
30
25
20
15
10
5
0
Number of countries where operating
AgricultureFood, beverages and tobacco
Carrefour
(France) Ahold
(Netherla
nds)Metro
(Germ
any)Walm
art
(USA) Tesco
(UK)
19802001
Changing diets in developing countries, 1964–1966 to 2030
1964–1966 1997–1999 2030
Kcal/capita/day
Source: FAO
3 000
2 500
2 000
1 500
1 000
500
0
Other
Wheat
Rice
Other cereals
Vegetable oils
SugarMeatRoots/tubersPulses
Source: UK Food Group

The State of Food Insecurity in the World 200420
Changes in food markets, fuelled by the rapid growth of cities and incomes, have major implica-
tions for the food security of millions of people who are neither urban nor affluent – the small farmers and land-less labourers in rural areas who make up the vast majority of the world’s chronically hungry population. For these households, the globalization of food industries and the expansion of super-markets present both an opportunity to reach lucrative new markets and a sub-stantial risk of increased marginaliza-tion and even deeper poverty.
Over recent decades, a handful of vertically integrated, transnational cor-porations have gained increasing con-trol over the global trade, processing and sales of food. The 30 largest super-market chains now account for about one third of food sales worldwide. In South America and East Asia, the super-market share of retail food sales has ballooned from less than 20 percent to more than 50 percent over the past de-cade (see graph). And the biggest chains, most of them owned by multi-national giants, now control 65 to 95
percent of supermarket sales in Latin America (see graph).
Opportunities and risks
The increasing dominance of super-markets has yielded greater consumer choice, more convenience, lower prices and higher food quality and safety for urban consumers. It has also led to consolidated supply chains in which buyers for a handful of giant food pro-cessors and retailers wield increasing power to set standards, prices and de-livery schedules.
The globalization of supermarket procurement has created unprecedent-ed opportunities for some farmers in developing countries. In Kenya, for ex-ample, exports of fresh fruits, vegeta-bles and cut fl owers for sale in European supermarkets have soared to more than US$300 million per year. Smallholders who grow for the export market enjoy signifi cantly higher incomes than non-participating households. A recent study found that if non-participating rural households were able to take up grow-ing horticultural crops for export, their
poverty rate would decrease by approxi-mately 25 percent (see graph).
But as the scale of Kenya’s exports has grown, the share produced by smallholders has dwindled. Before the horticultural export boom in the 1990s, smallholders produced 70 percent of vegetables and fruits shipped from Kenya. By the end of the 1990s, 40 per-cent of the produce was grown on farms owned or leased directly by importers in the developed countries and another 42 percent on large commercial farms. Smallholders produced just 18 percent.
The rise of supermarkets in develop-ing countries has created a domestic sector with centralized procurement and high-quality standards that has quickly outgrown the export market in most countries. Latin American super-markets, for example, now buy 2.5 times more fresh fruit and vegetables from local farmers than the region exports to the rest of the world. Like their counter-parts in the industrialized countries, domestic supermarket chains are shift-ing towards contracts with a limited number of suppliers who can meet their requirements (see graph, next page).
Special feature
The impact of changing food systems on small farmers in developing countries
Horticultural exports and poverty reduction, Kenya
* Headcount of households for which food expenditures are insufficient to meet the recommended daily food allowance
Source: McCulloch and Ota
Supermarket share of retail food sales
0 10 20 30 40 50 60
Central America
South America
Southeast Asia
East Asia*
Central Europe
South Africa
Kenya
Zimbabwe
China (urban) 0 20 40 60
Concentration of supermarket sector in Latin America
0
20
40
60
80
00100
80
60
40
20
0
Sales of 10 biggest chains as % of supermarket sales
Source: Faigenbaum* excl. China Source: Reardon et al.
1992 2002
Mexico
Argentin
a
ColombiaBra
zilChile
Non-participating household
Simulation of switching to become a:
contract farm worker
participating smallholder
0 20 40 60 80 100Household food poverty (%)*

The State of Food Insecurity in the World 2004 21
Carrefour, the world’s largest super-market chain, has set up its own, huge distribution centre in São Paulo, Brazil, serving a market of more than 50 mil-lion consumers. Carrefour buys melons from just three growers in northeast Brazil to supply all its Brazilian stores and to ship to distribution centres in 21 countries.
Small dairy farmers in Brazil have also borne the brunt of consolidation. Between 1997 and 2001, more than 75 000 Brazilian dairy farmers were “delisted” by the 12 largest milk proces-sors (see graph). Most presumably went out of business. Similar consolidation has been taking place at an even more rapid rate in Asia. In less than fi ve years, Thailand’s leading supermarket chain pared its list of vegetable suppliers from 250 down to just 10.
Smallholders face many obstacles to joining the ranks of preferred suppliers for supermarkets. Meeting standards for quality and reliability may require substantial investments in irrigation, greenhouses, trucks, cooling sheds and packing technology. Supermarket tran-saction costs may be signifi cantly higher
for negotiating and managing contracts with small producers.
Empowering small producers
Smallholders who have succeeded as suppliers for supermarkets have gener-ally overcome these obstacles by forging cooperatives or enrolling in outgrower schemes. Often they have benefi ted initially from information, training and start-up funds provided by public and private sector development initiatives.
In Zambia, for example, a consortium of government and industry organiza-tions helped forge a partnership that included government ministries, the country’s largest supermarket chain, suppliers of farm inputs, and the poor farming community of Luangeni. The project enabled the farmers in Luangeni to begin supplying high-quality vegeta-bles for Shoprite. Participating farmers reported both substantially higher in-comes and improved nutrition.
A number of farmer cooperatives have broken into lucrative and dynamic niche markets by obtaining certifi cation for their produce as “organic”, “fair
trade” and “environmentally friendly”. Such products command a premium price and bring higher returns to farmers. For small producers, organic farming offers the added benefi ts of reduced dependence on purchased in-puts like pesticides and fertilizer and increased use of low-cost labour.
The Del Cabo cooperative in Mexico, for example, has thrived by supplying organic cherry tomatoes to supermar-kets in the United States. Since it was founded in the mid-1980s, the coopera-tive has grown to include 250 family farms, many of them smaller than 2 hectares. Average income in the coop-erative has increased from US$3 000 to more than US$20 000.
Certifi ed products generally com-mand better market access in the in-dustrialized countries. They may well enjoy similar advantages in local super-markets as consumers become more demanding about food quality, safety and sustainability. But the certifi cation process itself is costly and may present a major obstacle to small producers, who often lack access to the credit, in-formation and training they would need to enter these niche markets.
As supermarkets expand their mar-ket from the wealthy elite in the cities out to middle and working class neigh-bourhoods and towns throughout the country, one Central American super-market chain has estimated that only 17 percent of the population is beyond their reach. That 17 percent is charac-terized as the poorest, rural segment of the population. Smallholders who fail to gain a foothold in this globalized marketplace risk fi nding themselves consigned to a permanently margin-alized minority, excluded from the food system both as producers and as consumers.
Number and size of suppliers to top 12 Brazilian milk processors
200
150
100
50
0
Source: www.terraviva.com.br
Number of suppliers (‘000)Litres/day/farmer
Sources of supplies for a Kenyan supermarket, 1997–2008
Small Medium/ Brokers Imports farmers large farmers
% of supplies
80
60
40
20
0
Source: Neven and Reardon
199720032008
1997 1998 1999 2000 2001

The State of Food Insecurity in the World 200422
Rising incomes and falling levels of hunger and malnutrition have generally been associated with
the rapid growth of cities in the devel-oping world. But although the propor-tion of people who go hungry usually remains lower in cities, the numbers of poor and hungry city dwellers are climbing rapidly along with the total urban population.
A study by the International Food Policy Research Institute (IFPRI) anal-ysed trends in urban poverty and mal-nutrition in 14 developing countries between 1985 and 1996. In a majority of these countries the number of un-derweight children living in urban areas is rising, and at a more rapid rate than in rural areas. In 11 of the 14 countries, the share of urban children among underweight preschoolers nationwide also increased (see graph).
More than 40 percent of all urban residents in developing countries live in slums. That means around 950 million people lack one or more of such basic services as access to sufficient living space, clean water and improved sani-
tation facilities. Many also lack ac cess to adequate food, even though the urban poor in many developing countries spend 60 percent or more of their total expenditures on food. In India 36 per-cent of urban children are stunted and 38 percent are underweight.
A recent FAO study compared levels of stunting in urban and rural areas in Angola, the Central African Republic and Senegal. Although overall prevalence of stunting was higher in rural areas, the prevalence was essentially the same in urban and rural areas when economic status was considered (see graph).
Changing lifestyles, changing diets
Urbanization and the globalization of food systems are redrawing not only the map but the profile of hunger and mal-nutrition in developing countries.
For the developing world as a whole, per capita consumption of vegetable oils and of animal source foods such as meat, dairy, eggs and fi sh doubled be-tween 1961 and 2000. Where the pace of urban growth and rising incomes has
accelerated, so have dietary changes. In China, the proportion of urban adults consuming high-fat diets, in which more than 30 percent of calories come from fat, shot up from 33 to 61 percent in just six years between 1991 and 1997.
Changes in the composition of diets and increased consumption of pro-cessed foods have been spurred by changing lifestyles and the rapid growth of fast food outlets and supermarket chains. In 1987, Kentucky Fried Chicken (KFC) opened the first foreign-owned fast food restaurant in Beijing. Fifteen years later, KFC boasts more than 600 stores in China and total fast food sales top US$24 billion a year.
The urban poor may not be able to afford fast food restaurants, but they do share in the lifestyle and dietary chang-es brought on by urbanization. In cities from Bangkok to Bamako, poor people often buy more than half their meals from street food vendors. A study in Accra, Ghana, found that the poorest city residents spend 40 percent of their food budget and 25 percent of their total ex-penditures on street foods (see graph).
Trends in urban malnutrition, selected developing countries
1985 1987 1989 1991 1993 1995
*United Rep. of Source: IFPRI
Stunting by residence and wealth, three African countries
0
0
20
30
40
50100
80
60
40
20
0
% stunted
Source: FAO
UrbanRural
Special feature
The changing profile of hunger and malnutrition
Food and street food as shares of expenditure, Accra, Ghana
0
0
0
0
0
0
0
0
0
70
60
50
40
30
20
10
0
% of total expenditure
Source: IFPRI
Underweight children in urban areas as % of total60
50
40
30
20
10
0
Brazil
PhilippinesMauritania
PeruZambia
EgyptNigeria
Honduras
Madagascar
Tanzania*Bangladesh
Uganda ChinaMalawi Q1 Q2 Q3 Q4 Q5
Wealth index quintilepoorest wealthiest
On food On street food
Q1 Q2 Q3 Q4 Q5 Expenditure quintilepoorest wealthiest
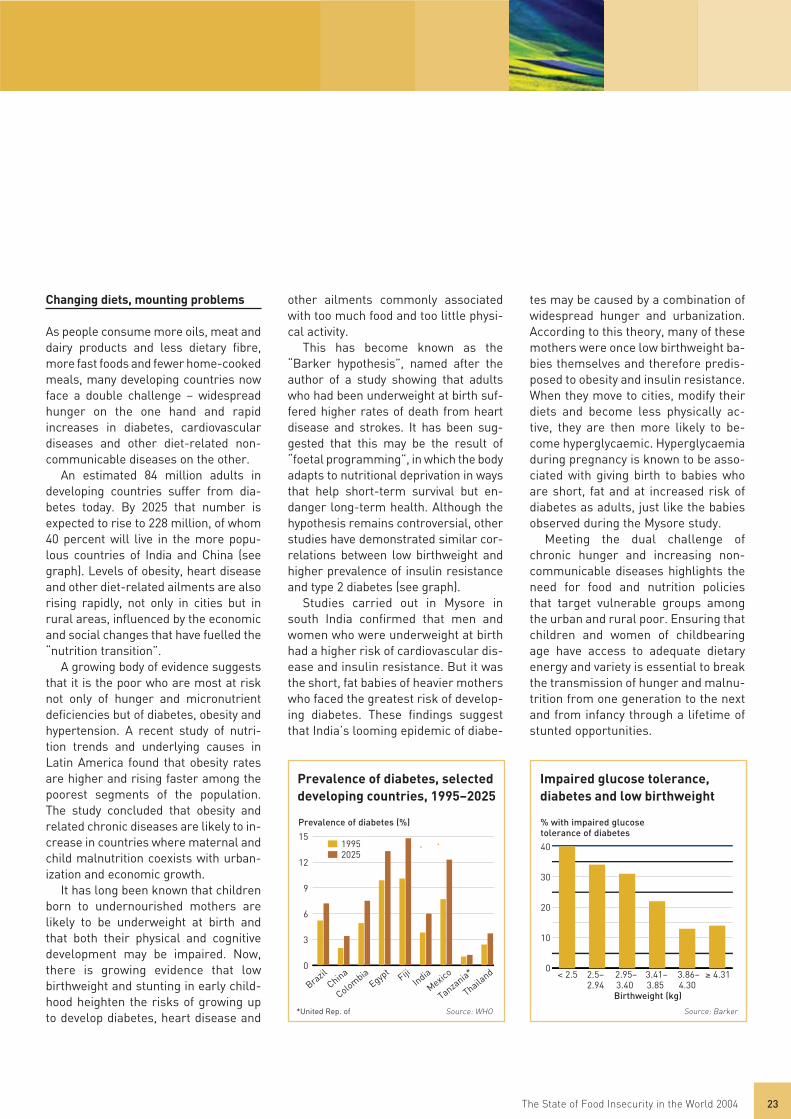
The State of Food Insecurity in the World 2004 23
Changing diets, mounting problems
As people consume more oils, meat and dairy products and less dietary fibre, more fast foods and fewer home-cooked meals, many developing countries now face a double challenge – widespread hunger on the one hand and rapid increases in diabetes, cardio vascular diseases and other diet- related non-communicable diseases on the other.
An estimated 84 million adults in developing countries suffer from dia-betes today. By 2025 that number is expected to rise to 228 million, of whom 40 percent will live in the more popu-lous countries of India and China (see graph). Levels of obesity, heart disease and other diet-related ailments are also rising rapidly, not only in cities but in rural areas, influenced by the economic and social changes that have fuelled the “nutrition transition”.
A growing body of evidence suggests that it is the poor who are most at risk not only of hunger and micronutrient deficiencies but of diabetes, obesity and hypertension. A recent study of nutri-tion trends and underlying causes in Latin America found that obesity rates are higher and rising faster among the poorest segments of the population. The study concluded that obesity and related chronic diseases are likely to in-crease in countries where maternal and child malnutrition coexists with urban-ization and economic growth.
It has long been known that children born to undernourished mothers are likely to be underweight at birth and that both their physical and cognitive development may be impaired. Now, there is growing evidence that low birthweight and stunting in early child-hood heighten the risks of growing up to develop diabetes, heart disease and
other ailments commonly associated with too much food and too little physi-cal activity.
This has become known as the “Barker hypothesis”, named after the author of a study showing that adults who had been underweight at birth suf-fered higher rates of death from heart disease and strokes. It has been sug-gested that this may be the result of “foetal programming”, in which the body adapts to nutritional deprivation in ways that help short-term survival but en-danger long-term health. Although the hypothesis remains controversial, other studies have demonstrated similar cor-relations between low birthweight and higher prevalence of insulin resistance and type 2 diabetes (see graph).
Studies carried out in Mysore in south India confirmed that men and women who were underweight at birth had a higher risk of cardiovascular dis-ease and insulin resistance. But it was the short, fat babies of heavier mothers who faced the greatest risk of develop-ing diabetes. These findings suggest that India’s looming epidemic of diabe-
tes may be caused by a combination of widespread hunger and urbanization. According to this theory, many of these mothers were once low birthweight ba-bies themselves and therefore predis-posed to obesity and insulin resistance. When they move to cities, modify their diets and become less physically ac-tive, they are then more likely to be-come hyperglycaemic. Hyperglycaemia during pregnancy is known to be asso-ciated with giving birth to babies who are short, fat and at increased risk of diabetes as adults, just like the babies observed during the Mysore study.
Meeting the dual challenge of chronic hunger and increasing non-communicable diseases highlights the need for food and nutrition policies that target vulnerable groups among the urban and rural poor. Ensuring that children and women of childbearing age have access to adequate dietary energy and variety is essential to break the transmission of hunger and malnu-trition from one generation to the next and from infancy through a lifetime of stunted opportunities.
Prevalence of diabetes, selected developing countries, 1995–2025
Prevalence of diabetes (%)
15
12
9
6
3
0
*United Rep. of Source: WHO
19952025
Impaired glucose tolerance, diabetes and low birthweight
0
5
10
15
20
25
30
35
4040
30
20
10
0
Source: Barker
< 2.5 2.5– 2.95– 3.41– 3.86– 4.31 2.94 3.40 3.85 4.30
Birthweight (kg)Bra
zilChina
ColombiaEgyp
tFiji
India
Mexico
Tanzania*
Thailand
% with impaired glucose tolerance of diabetes
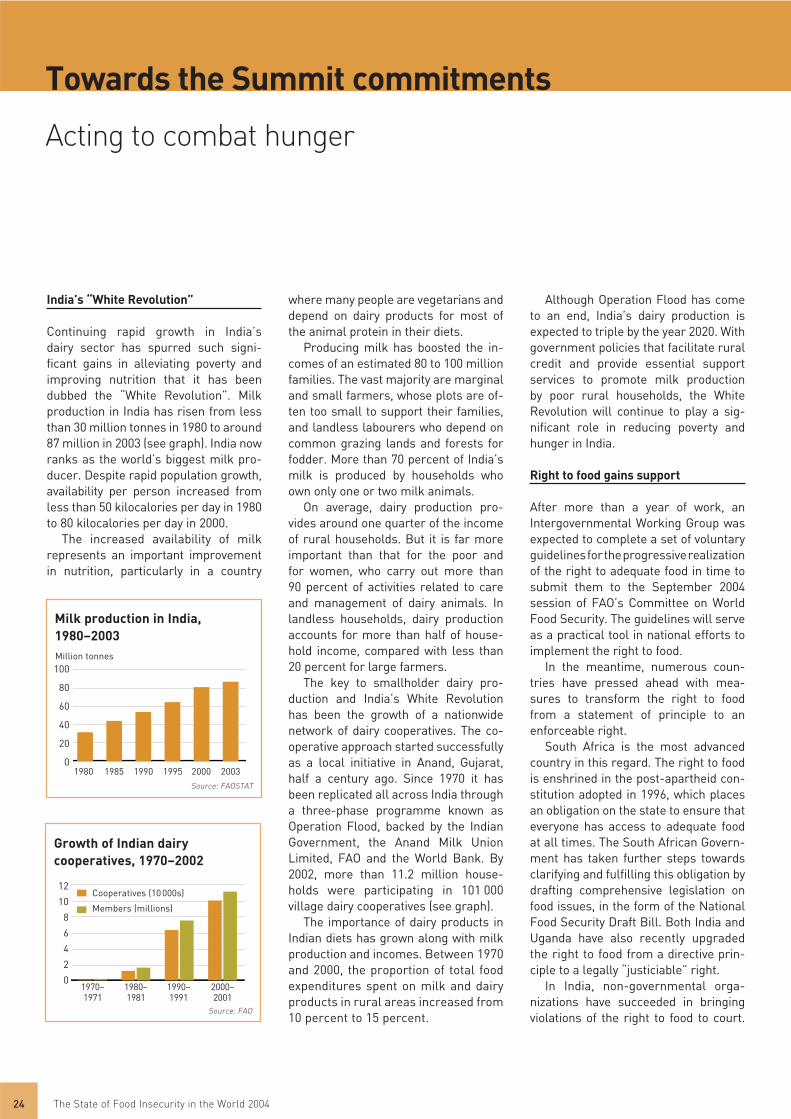
The State of Food Insecurity in the World 200424
India’s “White Revolution”
Continuing rapid growth in India’s dairy sector has spurred such signi-ficant gains in alleviating poverty and im proving nutrition that it has been dubbed the “White Revolution”. Milk pro duction in India has risen from less than 30 million tonnes in 1980 to around 87 million in 2003 (see graph). India now ranks as the world’s biggest milk pro-ducer. Despite rapid population growth, availability per person in creased from less than 50 kilocalories per day in 1980 to 80 kilocalories per day in 2000.
The increased availability of milk represents an important improvement in nutrition, particularly in a country
where many people are vegetarians and depend on dairy products for most of the animal protein in their diets.
Producing milk has boosted the in-comes of an estimated 80 to 100 million families. The vast majority are marginal and small farmers, whose plots are of-ten too small to support their families, and landless labourers who depend on common grazing lands and forests for fodder. More than 70 percent of India’s milk is produced by households who own only one or two milk animals.
On average, dairy production pro-vides around one quarter of the income of rural households. But it is far more important than that for the poor and for women, who carry out more than 90 percent of activities related to care and management of dairy animals. In landless households, dairy production accounts for more than half of house-hold income, compared with less than 20 percent for large farmers.
The key to smallholder dairy pro-duc tion and India’s White Revolution has been the growth of a nationwide net work of dairy cooperatives. The co- operative approach started suc cessfully as a local initiative in Anand, Gujarat, half a cen tury ago. Since 1970 it has been replicated all across India through a three-phase programme known as Operation Flood, backed by the Indian Government, the Anand Milk Union Limited, FAO and the World Bank. By 2002, more than 11.2 million house-holds were participating in 101 000 vil lage dairy cooperatives (see graph).
The importance of dairy products in Indian diets has grown along with milk production and incomes. Between 1970 and 2000, the proportion of total food expenditures spent on milk and dairy products in rural areas increased from 10 percent to 15 percent.
Although Operation Flood has come to an end, India’s dairy pro duction is expected to triple by the year 2020. With government policies that facili tate rural credit and provide essential sup port services to promote milk produc tion by poor rural house holds, the White Revolution will con tinue to play a sig-nificant role in reducing poverty and hunger in India.
Right to food gains support After more than a year of work, an Intergovernmental Working Group was expected to complete a set of voluntary guidelines for the progressive reali zation of the right to adequate food in time to submit them to the September 2004 session of FAO’s Committee on World Food Security. The guidelines will serve as a practical tool in national efforts to implement the right to food.
In the meantime, numerous coun-tries have pressed ahead with mea-sures to transform the right to food from a statement of principle to an enforceable right.
South Africa is the most advanced country in this regard. The right to food is enshrined in the post-apartheid con-stitution adopted in 1996, which places an obligation on the state to ensure that everyone has access to adequate food at all times. The South African Govern-ment has taken further steps towards clarifying and fulfilling this obligation by drafting compre hensive legislation on food issues, in the form of the National Food Security Draft Bill. Both India and Uganda have also recently upgraded the right to food from a directive prin-ciple to a legally “justiciable” right.
In India, non-governmental orga-ni zations have succeeded in bringing violations of the right to food to court.
Towards the Summit commitments
Acting to combat hunger
Source: FAOSTAT
Milk production in India,1980–2003 Million tonnes100
80
60
40
20
0 1980 1985 1990 1995 2000 2003
Source: FAO
Growth of Indian dairy cooperatives, 1970–2002
12
10
8
6
4
2
0 1970– 1980– 1990– 2000– 1971 1981 1991 2001
Cooperatives (10 000s)
Members (millions)

The State of Food Insecurity in the World 2004 25
The People’s Union for Civil Liberties, for example, claimed that the public food distribution system is not working in some districts and that no attempts have been made to prevent hunger-related deaths. Although the Supreme Court has not yet reached a final judgement on the case, it has issued “interim orders” directing the gov ern-ment to introduce midday meals for all primary schools, provide 35 kilograms of grain per month to 15 million desti-tute house holds and double the funding for India’s largest rural employment programme.
Judicial processes can be slow and expensive. In some countries, quasi-judicial mech a nisms are being used to claim the right to food. In Brazil, for example, public prosecutors in the Minis tério Público (Public Ministry) can initiate civil suits against any person or entity, including govern ment agencies, “for the protec tion of public and social patrimony, of the en vi ronment and of
other diffuse and collective interests”. Since the 1988 Constitution broadened the scope for these “public civil suits”, public pro secutors have used them increasingly to press for rights such as the right to food that might be derived from the cons titutional right to “edu-cation, health, work, leisure, security, social welfare, maternity protection and childhood”. Indeed a survey of atti tudes among public prosecutors found that they believe the Public Ministry can con-tri bute more than any other institution or sector to broadening and con soli da-ting such “diffuse and col lective rights” (see graph).
Hunger Task Force promotes action
Both the UN’s Millennium Develop-ment Goals and the Rome Declaration approved by heads of state and gov-ernment at the World Food Summit pledge to reduce hunger by half by the year 2015. The United Nations Millennium Project has established a special “Hunger Task Force” to promote immediate action towards achiev-ing that goal. The Task Force includes ex perts on nutrition, agri culture, en- vironmental sustainability, research, capacity building, business and com-munications, drawn from a wide range of public and private institutions.
The Task Force has carried out research to identify more pre cisely who and where hungry people are. A set of maps highlights the world’s “hunger hotspots” and has been used to help define general typologies of hunger. Based on available informa-tion, the Task Force has concluded that about half of the world’s hungry people are from smallholder farming commu-nities, another 20 percent are rural landless and about 10 percent live in
com munities whose livelihoods depend on herding, fishing or forest resources. The remaining 20 percent live in cities (see graph).
Within these communities, hunger disproportionately affects the most vulnerable groups, including children under the age of five, women of child-bearing age and mothers of babies, the sick and the infirm. The Task Force has called for urgent, adequately funded programmes to improve peri-natal health and nutrition services and to get food to the needy. It is also emphasizing the need to renew and increase support for smallholder farming, with special attention given to improving soil fertility, water man age-ment, improved seeds and a complete restoration and overhaul of extension services. All of the recommendations from the Hunger Task Force focus on investment in poor people and the in-frastructure and services they need to escape from the cycle of abject poverty and hunger. Following early action in a number of countries in Africa, the Task Force intends to put a price tag on the investments that are needed and to call upon the United Nations and its member countries to make the nec-essary funds available.
Source: Arantes
Public Ministry
Society
Other agencies
Press
Lawyers
Judiciary branch
Trade unions
Churches
Legislative branch
Executive branch
0 20 40 60 80 100Proportion of public prosecutors who
believe that the contribution is high or very high (%)
Source: Hunger Task Force
Smallholder farmers 50%
Urban poor 20%
Rural landless
20%
Pastoralists, fishers, forest-dependent 10%
Who the hungry are
Views of members of Public Ministry on contributions to collective rights, Brazil
Bodies contributing to collective rights

The State of Food Insecurity in the World 200426
More than 45 million people were affected by the 21 most serious humanitarian crises in 2003.
Most of these crises have persisted for many years, often triggered by armed confl ict and compounded by drought, fl oods and the effects of the AIDS pandemic (see map). Protracted crises disrupt food production and undermine food security as they drive people from their homes, strike at the foundations of their livelihoods and erode the social fabric of families, communities and countries.
Frequently, however, farmers and communities show remarkable resil-ience in the face of such disasters. As Angola neared the end of almost three decades of civil war, for example, a broad review of agricultural recovery and development options reported that in many areas traditional village institu-tions remained largely intact, demon-strating a sustained capacity to manage land allocation and small-scale irriga-tion systems. In a war-torn area of Sri Lanka, a case study found that farmers
in one Tamil village had been forced to abandon traditional paddy cultivation in the lowlands. But they succeeded in earning considerable cash by growing rainfed crops in the nearby hills and en-gaging in wage labour. Similar evidence of both destruction and resilience has been cited in reports from other coun-tries ravaged by war, natural disasters and HIV/AIDS.
In recent years, recognition has grown that responses to chronic and protracted crises must go beyond the repeated mobilization of emergency support when humanitarian conditions deteriorate. Relief and rehabilitation efforts are far more effective if they build on the foundations of resilience rather than relying exclusively on injec-tions of external inputs, technology and institutions.
Resilience, relief and rehabilitation
Studies have identifi ed several keys to the resilience of farming systems and communities. And emergency relief
and rehabilitation programmes have achieved notable success by building on these foundations.
Strengthening diversity: communi-ties that cultivate a variety of crops, raise livestock and engage in other food- and income-generating activities can often adjust and survive when food production and social institutions are disrupted. In the drought-prone west-ern Sudan, for example, communities traditionally de voted most of their land to crops and allocated only a small portion for grazing livestock. Food and income from their herds helped them survive the increasingly frequent years when drought destroyed their crops. To enhance their capacity to cope with recurring crises, a project was designed to build on this diversity by encouraging a signifi cant shift of resources from cropping to grazing. At the conclusion of the project, the proportion of land allocated for grazing had increased from less than 30 percent to more than 80 percent (see graph, next page). The shift in land use was accompanied by a wide range of other activities, including rehabilitation of rangelands, improved access to credit and improved vet-erinary services, all of which fostered greater diversity, increased resilience and improved food security.
Supporting local institutions: during protracted crises, government and market institutions often collapse, leaving communities to fend for themselves. Their ability to do so often hinges on the strength and adaptability of traditional support networks and communities. Local seed markets have been recognized as responsive institutions that can fuel both resilience during crises and rehabilitation afterwards. Agencies engaged in emergency relief have found that
Towards the Summit commitments
Factoring the resilience of food systems and communities into the response to protracted crises
Location and duration of protracted food emergencies, 2004
Source: FAO
Consecutive years including 2004
5–8 years 12–14 years 9–11 years > 15 years

The State of Food Insecurity in the World 2004 27
providing vouchers that can be redeemed at local seed markets is often far more effective than distribut-ing seeds purchased on commercial markets. Seed fairs give farmers access to a much wider selection of crops and varieties suited to local conditions. At seed fairs organized by Catholic Relief Services in fi ve East African countries, for example, farmers were able to ex-change their vouchers for an average of seven different crops and around ten varieties of each crop. In addition, since project funds are not spent on seeds, 65 to 80 percent of the money remains in the community. And much of it goes to women. Half the seed sellers at fairs in Kenya, the Sudan and Uganda and more than 80 percent in the United Republic of Tanzania were women.
Enabling adaptation and building on local knowledge: traditional insti-tutions and knowledge often provide a foundation for resilience. But crisis conditions may also present unprece-dented challenges that call for creative responses. As a way of reinforcing local knowledge and building on farmers’ capacity to adapt and reorganize, a number of projects have successfully
employed Farmer Field Schools (FFS). A project in Zimbabwe, for example, used participatory classes conducted by local farmers to teach AIDS widows how to produce organic cotton. Tradi-tionally, cotton had been considered a “man’s crop”, and many of the women could not afford the expensive inputs required to grow conventional cotton. Growing organic cotton reduced both input costs and labour requirements substantially. Although average yields fell below those of conventional farm-ers, saving an average of US$48 per hectare spent on pesticides allowed the women to reap signifi cantly higher profi ts (see graph).
Elements of resilience are serving as important building blocks in efforts to reconstruct Sierra Leone’s rural economy, shattered by over a decade of civil war, and to reach the nation’s goal of eliminating hunger by the year 2007. When availability of grains fell sharply during the war, for example, farmers fell back on crops that required fewer inputs and did not depend on access to distant markets. Production of cas-sava and other tubers increased rapidly (see graph). Maintaining this diversity
and promoting cassava production have been emphasized in the reconstruction campaign as keys to current progress and future resilience.
Reconstruction efforts have also tapped local knowledge and enlisted traditional village work groups to help identify, multiply and distribute cher-ished local seed varieties. FFS are be-ing extended to every rural household in the country as a way to spur innova-tion and foster participatory, commu-nity institutions.
A growing body of experience con-fi rms the importance of strengthening the resilience of societies and food systems before crises erupt and of factoring resilience into responses to protracted crises, based on: a dynamic understanding of commu-
nity opportunities and capacities; a participatory approach to defi ning
community priorities; strategies and policies that address
communities’ specifi c long-term food security concerns; and
mechanisms to ensure that food security assessments, programme monitoring and impact evaluation take account of the resilience of food
Source: Zakieldin, AIACC
Change in land use increases resilience to drought, Sudan
Land use (%)100
80
60
40
20
0 Before project After project
Source: FAO
Availability of tubers and cereals during civil war in Sierra Leone
Source: LEISA
1 000
800
600
400
200
0 1998 1999 2000
Organic and conventional cotton, Lower Guruve, Zimbabwe
Conventional
1998 1999 2000 0
2
4
6
8
120
100
80
60
40
20
0
Average yield (kg/ha) Average profit (US$/ha)
Organic100
80
60
40
20
0 1991 1992 1993 1994 1995 1996 1997 1998
Per capita availability (kg/yr)
Cereals
Tubers
CroplandGrazing land

The State of Food Insecurity in the World 200428
The vast majority of the world’s 852 million chronically under-nourished people live in rural
areas in the developing world. So do most of the 860 million illiterate adults (a majority of whom are women) and the 130 million children (mainly girls) who do not go to school. The fact that hun-ger, illiteracy and lack of schooling af-fect many of the same areas and people is no coincidence. Nor does it merely reflect the fact that both hunger and
lack of education are facets of extreme poverty. Hunger, malnutrition and food insecurity erode cognitive abilities and reduce school attendance. Conversely, illiteracy and lack of education reduce earning capacity and contribute directly to hunger and poverty.
School attendance and literacy rates are particularly low for women and girls in rural areas (see graph). In 50 developing countries for which data are available, primary school attendance
for rural girls averaged only 58 percent, compared to 63 percent for rural boys and over 75 percent for urban children. As a result, around two thirds of the illiterate people in the developing world are women and the gender gap is sig-nificantly larger in rural areas.
Hunger and malnutrition deter chil-dren from going to school and stunt their learning capacity when they do attend. A study in rural Pakistan found that a relatively minor improvement in nutrition would increase the likeli-hood of starting school by 4 percent for boys and 19 percent for girls. Low birthweight, protein energy malnutri-tion, iron deficiency anaemia and iodine deficiency have all been linked to cogni-tive deficiencies that reduce children’s ability to learn. Iodine defi ciency, for example, affects an estimated 1.6 bil-lion people worldwide and has been associated with an average 13.5 point reduction in IQ for a population.
Lack of education reduces produc ti-vity and earning capacity and increases vulnerability to hunger and extreme poverty. Research shows that a farmer with four years of elementary edu cation is, on average, 8.7 percent more produc-tive than a farmer with no education. When complementary inputs such as fertilizers, new seeds or farm ma chinery are available, the productivity in crease rises to 13 percent.
Improving education to feed both minds and bodies
Improving education can be one of the most effective ways to reduce hunger and malnutrition. Malnutrition rates decline with increased literacy, espe-cially fe male literacy. Higher rates of literacy among rural women are also associated with increased enrolment of
Towards the Summit commitments
Education for rural people and food security
Correspondence of high rates of illiteracy and undernourishment
Source: USAID DHS
100
80
60
40
20
0 Female Male Female Male Urban Rural
% literacy
Rural and urban literacy, 1990–1995 (22 countries)
Adult illiteracy > 30%Undernourishment > 20% Adult illiteracy > 30% and undernourishment > 20%
Source: FAO
Source: FAO
80
60
40
20
0 0–19% 20–34% 35%
Underweight rural children under 5 years old
% literacy Female Male
Literacy and prevalence of rural child undernutrition

The State of Food Insecurity in the World 2004 29
girls in primary school and lower rates of malnutrition (see graph).
Education is also the front line against HIV/AIDS. A recent study in Uganda found that people who fi n-ished primary school were only half as likely to contract HIV – and those with a secondary education only 15 percent as likely – as those who received little or no schooling.
The Indian state of Kerala is often cited as a prime example of the virtuous circle of benefits from investments in education and nutrition. Since shortly after independence, successive govern-ments in Kerala have made education a top priority. Special attention has been given to girls and women in rural areas.
The investment has paid off. Although Kerala is not one of India’s wealthier states, it ranks first in fe male literacy and school enrolment by a wide margin. Kerala also boasts the lowest rate of malnutrition among children and an infant mortality rate that is a fifth of that of the country as a whole (see graph).
A number of countries have rec og-nized the importance of edu cation for rural people and adopted policies to
make it more accessible and relevant. Almost half of the rural schools in Colombia, for example, have adopted the Escuela Nueva (New School) model. These schools emphasize participatory learn ing and employ a curriculum that com bines core national content with local modules relevant to the culture and needs of rural people. Communities and parents are actively engaged in the schools. Drop-out rates are far lower and third-grade scores in Spanish and mathematics are significantly higher than in traditional schools.
The Indian state of Madhya Pradesh pledged to build a primary school building within 90 days for any rural community that provided space and hired a qualifi ed teacher. Today, all children of primary school age in the state are enrolled in school.
Programmes that take direct aim simultaneously at lack of education and malnutrition have achieved notable gains in several countries.
In Bangladesh’s Food for Education programme, families receive food if they send their children to school in stead of putting them to work. After eight years,
an evaluation by the International Food Policy Research Institute found gains in both education and nutrition. Primary school atten dance had in creased, es-pecially for girls. School absences and drop-out rates had declined. And calorie and protein con sumption among parti-cipating families had risen significantly.
Mexico’s Programa de Educación, Salud y Alimentación (PROGRESA) pro-vides cash transfers to more than 2.6 million poor, rural families as long as they send their children to school. Benefits are higher for older children and for girls, who are more likely to drop out prior to secondary school. The pro-gramme also provides nutri tional sup-plements for infants and small children in participating families.
After its first three years in oper ation, enrolment for the critical transi tion year from primary to sec ondary school increased by 20 percent for girls and 10 percent for boys. Simulation of the impact over a longer period shows that, on average, children would com plete 0.6 more grades in school and 19 percent more of them would attend some secondary grades (see graph).
Source: UNDP; Govt. of India Planning Commission
Rural education and nutrition in Kerala and India as a whole
Rural areasFemale literacy
Female enrolment
Childunderweight
Infant mortality*
0 20 40 60 80 100 %
* Infant mortality = per 1000 live births
Kerala India With PROGRESAWithout PROGRESA
Source: Behrman, Sengupta and Todd
PROGRESA impact on enrolmentSimulated distribution at age 14
40
30
20
10
0Primary Grade Grade Grade Grade only 7 8 9 10
Proportion at grade level (%)
Without PROGRESAWith PROGRESA
Source: UNICEF; WHO; UNESCO; FAO
Girls enrolled in schoolChildren underweight
100
80
60
40
20
0 < 50% 50–79% 80%
Rural female literacy
%
* 18 countries grouped by female literacy
Child undernutrition and rural net enrolment for girls*

The State of Food Insecurity in the World 200430
Rice is central to food security in the world. It is the main source of calorie intake for about half of
the world’s population and the predo-minant staple food for 34 countries in Asia, Latin America and Africa (see map). In several Asian countries, people depend on rice for more than two thirds of the calories and 60 percent of the protein in their diets.
Growing and processing rice is also the main source of employment and in-come for an estimated 2 billion people. About 90 percent of the world’s rice is produced and consumed by small-scale farmers in developing nations. In many of the poorest coun tries in Asia, 60 percent of the crop land is devoted to growing rice and the poor-est segments of the population spend between 20 and 40 percent of their income on rice.
Higher yields, lower prices
Over the past 40 years, advances in technology and policy changes have fuelled rapid gains in rice production
and a steep decline in prices. High-yielding varieties introduced dur ing the Green Revolution gave a strong boost to rice production. Between 1961 and 1990, global production more than doubled, from 216 million to 518 million tonnes. Yields increased from less than 1 900 kilograms per hectare to more than 3 500. Real prices fell by more than 50 percent (see graph).
The increased availability and affor-dability of rice contributed to a rapid decline in the number of people suffer-ing from hunger in countries where rice is the main staple food. In Asia, annual per capita rice con sumption increased by more than 20 kilograms and the proportion of under nourished declined from almost 40 percent to 16 percent.
Changing consumption patterns
Over the past four decades, rice con-sumption patterns in different regions have evolved and converged. In Asia, where rice has been the mainstay of diets for centuries, per capita con sum-ption of rice increased rapidly during
the 1960s and 1970s. Since then con-sumption of other foods has in creased and the relative contribution of rice has fallen. In parts of Africa, the Near East and Latin America and the Caribbean, on the other hand, rice consumption has increased significantly, both in volume and as a proportion of total calorie intake (see graph). Rice is now the most rapidly growing source of food in Africa.
Meeting the challenge
The International Rice Research Insti tute estimates that by the year 2025 the number of people who depend on rice as their main source of food will rise by more than 40 percent, from 2.7 billion to 3.9 billion. Meeting this demand will require government poli cies and agri cultural practices to sup port sustain able in creases in rice production.
Governments must calibrate farm and trade policies to keep rice both affordable for poor consumers and pro-fitable for small farmers. In Indonesia,
Towards the Summit commitments
Rice and food security
Source: IRRI/FOB Bangkok
World rice prices, 1950–1998
2 000
1 600
1 200
800
400
01950 1958 1966 1974 1982 1990 1998
Contribution of rice to calorie intake, 1999–2001
40–50 50
20–3030–40
5–1010–20
Proportion of calorie intake (%)
Source: FAO
Trend 1950–1981, 1985–19981997 US$

The State of Food Insecurity in the World 2004 31
for example, the State Logistics Agency (Bulog) establishes a guaranteed floor price at which it will purchase rice from farmers and distributes more than 2 million tonnes of subsidized rice to poor households through a targeted social safety net programme.
In West Africa, several governments have taken steps to increase production. In Mali, the rice sector has grown rapidly over the past decade. Price lib er alization has encouraged farmers and merchants to invest resources and ex pand production. Proliferation of small mills at the village level has reduced processing costs significantly. And the government has increased pub- lic invest ments in infrastructure. Now Mali, which boasts large areas suitable for irrigated rice production, aims to become “the rice basket of the Sahel” by increasing output from 735 000 tonnes to 4.5 million by the year 2010.
Closing the yield gap
With limited areas available to ex-pand rice production, efforts to meet in creased demand will depend on reduc ing the “yield gap” between yields demonstrated at research stations and
those achieved in farmers’ fields. FAO estimates that yield gains of 1 percent per year will be required to meet de-mand without pushing prices higher.
Hybrid rice varieties offer one proven way to boost production. Such var ieties typically yield about 15 to 20 per cent more than even the best of the high-yielding varieties. Since breed ing the first successful hybrid in 1974, China has increased production by almost 50 percent, even while the area planted to rice has shrunk by almost one quarter.
Breakthroughs in rice breeding have also yielded major gains in West Africa. The West Africa Rice Development Association succeeded in crossing hardy African rice species with higher-yielding species imported from Asia, producing what has become known as NERICA (New Rice for Africa). With a minimal increase in fertilizer, these new varieties can increase yields by as much as 150 percent in upland areas and rainfed lowlands. Nigeria has empha sized use of NERICA as a key element in its drive to increase production from an average of 3 mil-lion tonnes in 2000–2002 to about 15 million in 2007.
Empowering small farmers
Technological advances can boost yields and government policies can help cre-ate a favourable environment for pro-ducing and marketing rice. But long-term success in improving food security depends on the ability of millions of small farmers to benefit from these gains and increase rice production as part of sustainable, diversified agri cul -tural systems.
One approach that has proven suc-cessful at engaging and empowering small farmers has been the use of Farmer Field Schools (FFS). Between 1990 and 2000, more than 2 million Asian rice farmers participated in FFS. They learned how to reduce their use of pesticides and how to make better and more sustainable use of fertil-izer and water. Their lessons translated into reduced costs, increased yields and higher incomes (see graph).
In Sri Lanka, for example, farmers who participated in FFS reduced pest-icide use by more than 80 percent while increasing yields by over 20 per cent. With substantial savings on pesti cides and higher yields, incomes from rice pro duction more than doubled.
Source: van den Berg
Farmer Field Schools reduce pesticide use and improve yields
4020
0-20-40-60-80
-100
YieldPesticide use
FFS-trained farmers vs control (%)
Asia/Pacific Near East/ Sub-Saharan Latin America/ Low-income food- North Africa Africa Caribbean deficit countries
Kg/capita/year
1961 1971 1981 1991 2001100
80
60
40
20
0
Source: FAO
Annual rice consumption per capita by region, 1961–2001
Indonesia
Bangladesh
Cambodia
Sri Lanka
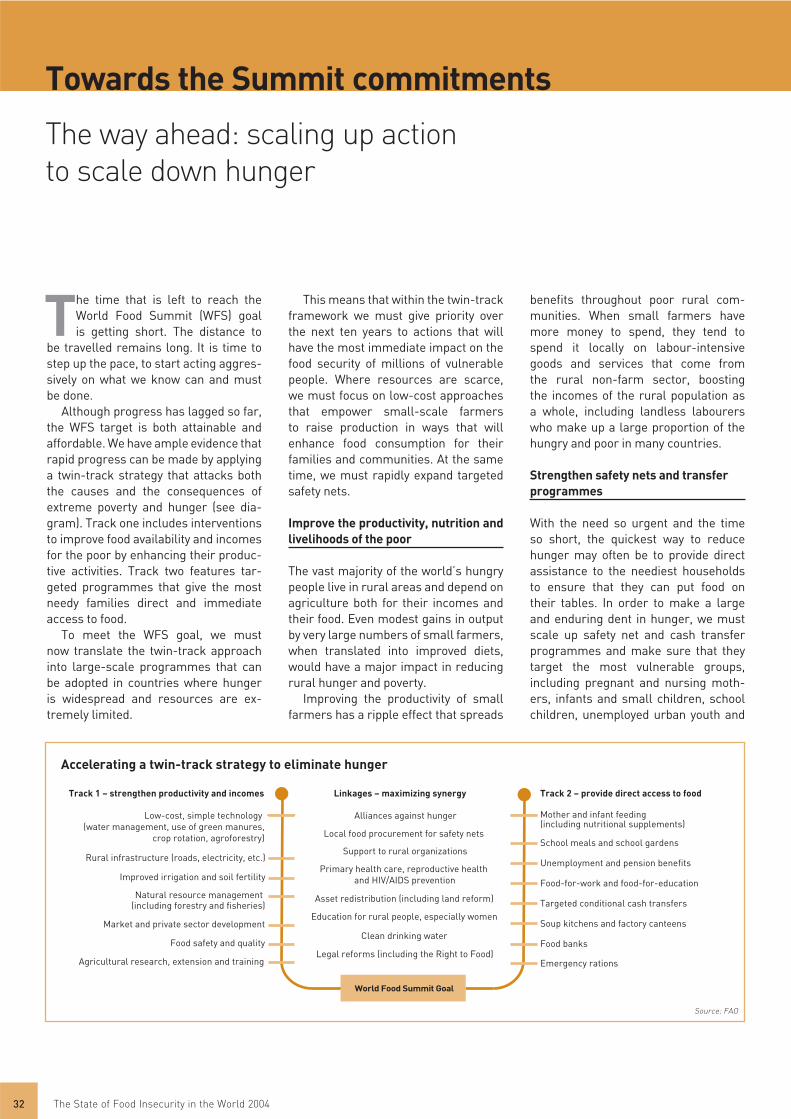
The State of Food Insecurity in the World 200432
The time that is left to reach the World Food Summit (WFS) goal is getting short. The distance to
be travelled remains long. It is time to step up the pace, to start acting aggres-sively on what we know can and must be done.
Although progress has lagged so far, the WFS target is both attainable and affordable. We have ample evidence that rapid progress can be made by applying a twin-track strategy that attacks both the causes and the consequences of extreme poverty and hunger (see dia-gram). Track one includes interventions to improve food availability and incomes for the poor by enhancing their produc-tive activities. Track two features tar-geted programmes that give the most needy families direct and immediate access to food.
To meet the WFS goal, we must now translate the twin-track approach into large-scale programmes that can be adopted in countries where hunger is widespread and resources are ex-tremely limited.
This means that within the twin-track framework we must give priority over the next ten years to actions that will have the most immediate impact on the food security of millions of vulnerable people. Where resources are scarce, we must focus on low-cost approaches that empower small-scale farmers to raise production in ways that will enhance food consumption for their families and communities. At the same time, we must rapidly expand targeted safety nets.
Improve the productivity, nutrition and livelihoods of the poor
The vast majority of the world’s hungry people live in rural areas and depend on agriculture both for their incomes and their food. Even modest gains in output by very large numbers of small farmers, when translated into improved diets, would have a major impact in reducing rural hunger and poverty.
Improving the productivity of small farmers has a ripple effect that spreads
benefi ts throughout poor rural com-munities. When small farmers have more money to spend, they tend to spend it locally on labour-intensive goods and services that come from the rural non-farm sector, boosting the incomes of the rural population as a whole, including landless labourers who make up a large proportion of the hungry and poor in many countries.
Strengthen safety nets and transfer programmes
With the need so urgent and the time so short, the quickest way to reduce hunger may often be to provide direct assistance to the neediest households to ensure that they can put food on their tables. In order to make a large and enduring dent in hunger, we must scale up safety net and cash transfer programmes and make sure that they target the most vulnerable groups, including pregnant and nursing moth-ers, infants and small children, school children, unemployed urban youth and
Towards the Summit commitments
The way ahead: scaling up action to scale down hunger
Track 1 – strengthen productivity and incomes
Low-cost, simple technology (water management, use of green manures,
crop rotation, agroforestry)
Improved irrigation and soil fertility
Natural resource management (including forestry and fisheries)
Market and private sector development
Food safety and quality
Agricultural research, extension and training
Linkages – maximizing synergy
Alliances against hunger
Primary health care, reproductive health and HIV/AIDS prevention
Legal reforms (including the Right to Food)
Asset redistribution (including land reform)
Education for rural people, especially women
Clean drinking water
Support to rural organizations
Local food procurement for safety nets
World Food Summit Goal
Track 2 – provide direct access to food
Mother and infant feeding(including nutritional supplements)
School meals and school gardens
Unemployment and pension benefits
Food-for-work and food-for-education
Targeted conditional cash transfers
Soup kitchens and factory canteens
Food banks
Emergency rations
Accelerating a twin-track strategy to eliminate hunger
Rural infrastructure (roads, electricity, etc.)
Source: FAO

The State of Food Insecurity in the World 2004 33
the elderly, disabled and sick, including people living with HIV/AIDS.
Safety nets can also be woven with strands that contribute to develop-mental goals. Food banks and school feeding programmes can often be de-signed to boost incomes, improve food security and stimulate development in vulnerable rural communities by buying food locally from small-scale farmers. Similarly, programmes that provide food to people who attend education and training programmes can improve both their nutritional status and their em-ployment prospects.
Empower rural communities
Rural communities themselves are of-ten best able to diagnose the local root causes of chronic hunger and to iden-tify solutions that will benefi t the most community members with the least re-liance on external resources.
Experience has shown that Farmer Field Schools (FFS) and similar ap-proaches to adult education and com-munity empowerment can help farmers
increase production and improve target-ing of social safety nets.
Sierra Leone has made FFS a key el-ement in mobilizing a community-based drive to eradicate hunger within fi ve years. By September 2006, more than 200 000 of the country’s 450 000 farm-ers are expected to have been enrolled in self-fi nancing FFS focusing on food security (see graph).
Scale up funding and commitment
Scaling up direct actions to reach the WFS goal, while simultaneously increas-ing long-term investments in sus tainable agriculture and rural development, will also require scaling up resources and political commitment. Fortunately sev-eral countries have taken the lead in mobilizing political will and pressing for innovative funding mechanisms.
Calling hunger “the worst of all weapons of mass destruction”, Presi-dent Luiz Inácio Lula da Silva of Brazil has proposed taxes on the inter na tional arms trade and on some fi nancial trans-actions carried out in “fi scal paradises”.
The Presidents of Chile, France and Spain and UN Secretary-General Kofi Annan have joined President Lula to forge the “Quintet against Hunger”, which is considering a variety of alterna-tive funding mechanisms.
The United Kingdom has proposed one such mechanism – an Interna-tional Finance Facility (IFF) designed “to ‘frontload’ aid to help meet the Mil-lennium Development Goals”. The IFF would use bonds backed by long-term commitments from donor countries to provide US$50 billion a year in develop-ment assistance to the world’s poorest countries up to 2015 (see diagram).
On 20 September 2004, more than 100 countries participated in a one-day World Leaders Summit on Hunger held at UN Headquarters in New York. At its conclusion, they endorsed a campaign to raise an additional US$50 billion a year to fi ght hunger and declared:
“The greatest scandal is not that hun-ger exists but that it persists even when we have the means to eliminate it. It is time to take action.
“Hunger cannot wait.”
Structure of the International Finance Facility
INTERNATIONALFINANCE FACILITY
(IFF)
Donor countries International capital markets
Approved disbursementmechanism
Approved disbursementmechanism
Approved disbursementmechanism
Recipient countries
Donors
A
B
C
Source: HM Treasury/DFID
Bonds
0
50
100
150
200
End2003*
July2004
Sept.2004
Sept.2006
(projected)
* < 100 trainers
Number of farmers trained (thousands)
Scaling up Farmer Field Schools in Sierra Leone
Source: FAO

The State of Food Insecurity in the World 200434
Tables
DEVELOPING WORLD 4 058.7 4 431.1 4 796.7 823.8 796.7 814.6 20 18 17 ASIA AND THE PACIFIC* 2 815.2 3 039.5 3 256.1 569.2 509.5 519.0 20 17 16 EAST ASIA 1 241.5 1 307.2 1 364.5 198.8 155.1 151.7 16 12 11 China [3] 1 175.7 1 237.8 1 292.5 193.5 145.6 142.1 16 12 11 Dem. People’s Rep. of Korea [5] 20.3 21.6 22.4 3.7 7.6 8.1 18 35 36 Mongolia [4] 2.3 2.4 2.5 0.8 1.1 0.7 34 46 28 Rep. of Korea [1] 43.3 45.4 47.1 0.8 0.8 0.7 — — —SOUTHEAST ASIA 444.2 484.7 522.8 78.4 66.3 65.5 18 14 13 Cambodia [4] 10.1 11.8 13.5 4.3 5.2 4.4 43 44 33 Indonesia [3] 185.2 200.1 214.3 16.4 11.2 12.6 9 6 6 Lao People’s Dem. Rep. [4] 4.2 4.8 5.4 1.2 1.3 1.2 29 28 22 Malaysia [1] 18.3 20.9 23.5 0.5 0.5 0.6 3 — —Myanmar [3] 41.2 44.8 48.2 4.0 3.2 2.8 10 7 6 Philippines [4] 62.5 69.9 77.1 16.2 16.3 17.2 26 23 22 Thailand [4] 55.1 58.5 61.6 15.2 12.0 12.2 28 20 20 Viet Nam [3] 67.5 74.0 79.2 20.6 16.7 14.7 31 23 19 SOUTH ASIA 1 125.3 1 242.7 1 363.3 291.3 287.3 301.1 26 23 22 Bangladesh [4] 112.1 126.3 140.9 39.2 50.4 42.5 35 40 30 India [4] 863.3 948.6 1 033.3 215.8 203.0 221.1 25 21 21 Nepal [3] 19.1 21.4 24.1 3.9 5.6 4.0 20 26 17 Pakistan [4] 113.7 128.4 146.3 27.7 23.8 29.3 24 19 20 Sri Lanka [4] 17.0 17.9 18.8 4.8 4.6 4.1 28 26 22 LATIN AMERICA AND THE CARIBBEAN 443.4 482.5 521.2 59.5 54.8 52.9 13 11 10 NORTH AMERICA 84.8 92.7 100.5 4.6 5.0 5.2 5 5 5 Mexico [3] 84.8 92.7 100.5 4.6 5.0 5.2 5 5 5 CENTRAL AMERICA 28.8 32.7 36.9 5.0 6.5 7.4 17 20 20 Costa Rica [2] 3.2 3.6 4.0 0.2 0.2 0.2 6 5 4 El Salvador [3] 5.2 5.8 6.3 0.6 0.8 0.7 12 14 11 Guatemala [4] 9.0 10.3 11.7 1.4 2.2 2.8 16 21 24 Honduras [4] 5.0 5.8 6.6 1.1 1.2 1.5 23 21 22 Nicaragua [4] 3.9 4.6 5.2 1.2 1.5 1.4 30 33 27 Panama [4] 2.5 2.7 3.0 0.5 0.6 0.8 21 23 26 THE CARIBBEAN 28.5 30.2 31.7 7.8 8.9 6.7 27 30 21 Cuba [2] 10.7 11.0 11.2 0.8 1.9 0.4 8 18 3 Dominican Rep. [4] 7.2 7.8 8.5 1.9 2.0 2.1 27 26 25 Haiti [5] 7.0 7.6 8.1 4.6 4.5 3.8 65 59 47 Jamaica [3] 2.4 2.5 2.6 0.3 0.3 0.3 14 11 10 Trinidad and Tobago [3] 1.2 1.3 1.3 0.2 0.2 0.2 13 15 12 SOUTH AMERICA 301.3 327.0 352.2 42.0 34.4 33.6 14 11 10 Argentina [1] 33.0 35.2 37.5 0.7 0.4 0.6 — — —Bolivia [4] 6.8 7.6 8.5 1.9 1.9 1.8 28 25 21 Brazil [3] 151.2 162.8 174.0 18.5 16.5 15.6 12 10 9 Chile [2] 13.3 14.4 15.4 1.1 0.7 0.6 8 5 4 Colombia [3] 35.7 39.3 42.8 6.1 5.1 5.7 17 13 13 Ecuador [2] 10.5 11.6 12.6 0.9 0.6 0.6 8 5 4 Guyana [3] 0.7 0.7 0.8 0.2 0.1 0.1 21 12 9 Paraguay [3] 4.3 5.0 5.6 0.8 0.7 0.8 18 13 14 Peru [3] 22.2 24.3 26.4 9.3 4.6 3.4 42 19 13 Suriname [3] 0.4 0.4 0.4 0.1 0.0 0.0 13 10 11 Uruguay [2] 3.1 3.2 3.4 0.2 0.1 0.1 6 4 4 Venezuela [3] 20.0 22.4 24.8 2.3 3.5 4.3 11 16 17
Table 1. PREVALENCE OF UNDERNOURISHMENT in developing countries and countries in transition
DEVELOPING WORLD Total population Number of people undernourished Proportion of undernourished Region/subregion/country in total population[undernourishment category] 1990–1992 1995–1997 2000–2002 1990–1992 1995–1997 2000–2002 1990–1992 1995–1997 2000–2002 millions millions %

The State of Food Insecurity in the World 2004 35
NEAR EAST AND NORTH AFRICA* 322.8 362.6 399.4 24.8 34.9 39.2 8 10 10 NEAR EAST* 202.5 230.2 255.0 19.4 29.2 33.1 10 13 13 Iran, Islamic Rep. of [2] 58.0 63.3 67.3 2.1 2.1 2.7 4 3 4 Jordan [3] 3.4 4.4 5.2 0.1 0.3 0.4 4 7 7 Kuwait [3] 2.1 1.8 2.3 0.5 0.1 0.1 23 5 5 Lebanon [2] 2.8 3.2 3.5 0.1 0.1 0.1 — 3 3 Saudi Arabia [2] 17.1 19.5 22.8 0.7 0.8 0.8 4 4 3 Syrian Arab Rep. [2] 13.1 15.0 17.0 0.7 0.6 0.6 5 4 4 Turkey [2] 58.7 64.1 69.3 1.0 1.5 1.8 — — 3 United Arab Emirates [1] 2.1 2.6 2.9 0.1 0.1 0.1 4 — —Yemen [5] 12.5 15.7 18.7 4.2 5.7 6.7 34 36 36 NORTH AFRICA 120.4 132.4 144.4 5.4 5.7 6.1 4 4 4 Algeria [3] 25.6 28.4 30.8 1.3 1.7 1.7 5 6 5 Egypt [2] 57.0 62.8 69.1 2.5 2.2 2.4 4 3 3 Libyan Arab Jamahiriya [1] 4.4 4.8 5.3 0.0 0.0 0.0 — — —Morocco [3] 25.0 27.3 29.6 1.5 1.7 2.0 6 6 7 Tunisia [1] 8.4 9.1 9.6 0.1 0.1 0.1 — — —
SUB-SAHARAN AFRICA* 477.3 546.4 620.0 170.4 197.4 203.5 36 36 33 CENTRAL AFRICA 63.4 73.6 82.0 22.7 38.8 45.2 36 53 55 Cameroon [4] 12.0 13.8 15.4 4.0 4.6 3.9 33 33 25 Central African Rep. [5] 3.0 3.4 3.8 1.5 1.7 1.6 50 51 43 Chad [4] 6.0 6.9 8.1 3.5 3.4 2.7 58 49 34 Congo [5] 2.6 3.0 3.5 1.4 1.8 1.3 54 59 37 Dem. Rep. of the Congo [5] 38.8 45.3 49.9 12.2 27.2 35.5 32 60 71 Gabon [3] 1.0 1.1 1.3 0.1 0.1 0.1 10 8 6 EAST AFRICA* 167.8 190.8 217.7 76.4 88.7 86.2 46 46 40 Burundi [5] 5.7 6.1 6.4 2.7 3.8 4.4 48 63 68 Eritrea [5]** na 3.3 3.9 na 2.2 2.8 na 68 73 Ethiopia [5]** na 59.0 67.3 na 35.8 31.3 na 61 46 Kenya [4] 24.4 28.1 31.1 10.7 10.8 10.3 44 38 33 Rwanda [5] 6.4 5.5 8.0 2.8 2.8 3.0 44 52 37 Sudan [4] 25.5 28.7 32.2 8.0 6.6 8.5 32 23 27 Uganda [3] 17.9 20.9 24.2 4.2 5.4 4.6 24 26 19 United Rep. of Tanzania [5] 27.0 31.7 35.6 9.9 15.8 15.6 37 50 44 SOUTHERN AFRICA 71.0 80.6 90.1 34.1 36.5 35.7 48 45 40 Angola [5] 9.6 11.2 12.8 5.6 5.4 5.1 58 49 40 Botswana [4] 1.4 1.6 1.7 0.3 0.4 0.6 23 27 32 Lesotho [3] 1.6 1.7 1.8 0.3 0.2 0.2 17 14 12 Madagascar [5] 12.3 14.2 16.4 4.3 5.7 6.0 35 40 37 Malawi [4] 9.6 10.3 11.6 4.8 4.1 3.8 50 40 33 Mauritius [3] 1.1 1.1 1.2 0.1 0.1 0.1 6 6 6 Mozambique [5] 13.9 16.4 18.2 9.2 9.5 8.5 66 58 47 Namibia [4] 1.5 1.7 1.9 0.5 0.6 0.4 35 36 22 Swaziland [3] 0.9 1.0 1.1 0.1 0.2 0.2 14 23 19 Zambia [5] 8.4 9.6 10.6 4.0 4.6 5.2 48 48 49 Zimbabwe [5] 10.7 11.9 12.7 4.9 5.6 5.6 45 47 44 WEST AFRICA 175.1 201.4 230.3 37.2 33.5 36.4 21 17 16 Benin [3] 4.8 5.6 6.4 1.0 0.9 0.9 20 17 15 Burkina Faso [3] 9.2 10.6 12.3 1.9 2.0 2.3 21 19 19 Côte d’Ivoire [3] 12.9 14.7 16.1 2.3 2.3 2.2 18 16 14 Gambia [4] 1.0 1.2 1.4 0.2 0.4 0.4 22 31 27 Ghana [3] 15.7 17.9 20.0 5.8 3.2 2.5 37 18 13
Table 1 cont. PREVALENCE OF UNDERNOURISHMENT in developing countries and countries in transition
DEVELOPING WORLD Total population Number of people undernourished Proportion of undernourished Region/subregion/country in total population[undernourishment category] 1990–1992 1995–1997 2000–2002 1990–1992 1995–1997 2000–2002 1990–1992 1995–1997 2000–2002 millions millions %

The State of Food Insecurity in the World 200436
Tables
Guinea [4] 6.4 7.5 8.2 2.5 2.3 2.1 39 31 26 Liberia [5] 2.1 2.3 3.1 0.7 1.0 1.4 34 42 46 Mali [4] 9.3 10.6 12.3 2.7 3.4 3.6 29 32 29 Mauritania [3] 2.1 2.4 2.7 0.3 0.3 0.3 15 11 10 Niger [4] 7.9 9.4 11.1 3.2 3.9 3.8 41 42 34 Nigeria [3] 88.7 102.7 117.8 11.8 8.9 11.0 13 9 9 Senegal [4] 7.5 8.5 9.6 1.8 2.2 2.3 23 25 24 Sierra Leone [5] 4.1 4.1 4.6 1.9 1.8 2.3 46 44 50 Togo [4] 3.5 4.0 4.7 1.2 1.0 1.2 33 25 26
Table 1 cont. PREVALENCE OF UNDERNOURISHMENT in developing countries and countries in transition
DEVELOPING WORLD Total population Number of people undernourished Proportion of undernourished Region/subregion/country in total population[undernourishment category] 1990–1992 1995–1997 2000–2002 1990–1992 1995–1997 2000–2002 1990–1992 1995–1997 2000–2002 millions millions %
COUNTRIES IN TRANSITION Total population Number of people undernourished Proportion of undernourished Region/subregion/country in total population[undernourishment category] 1993–1995 2000–2002 1993–1995 2000–2002 1993–1995 2000–2002 millions millions %
COUNTRIES IN TRANSITION 413.6 409.8 23.3 28.3 6 7 COMMONWEALTH OF INDEPENDENT STATES 284.5 281.7 19.0 24.1 7 9 Armenia [4] 3.4 3.1 1.8 1.1 52 34 Azerbaijan [3] 7.7 8.2 2.6 1.2 34 15 Belarus [1] 10.3 10.0 0.1 0.2 — —Georgia [4] 5.4 5.2 2.1 1.4 39 27 Kazakhstan [3] 16.7 15.5 0.2 2.0 — 13 Kyrgyzstan [3] 4.5 5.0 0.9 0.3 21 6 Rep. of Moldova [3] 4.4 4.3 0.2 0.5 5 11 Russian Fed. [2] 148.4 144.9 6.4 5.2 4 4 Tajikistan [5] 5.7 6.1 1.2 3.7 21 61 Turkmenistan [3] 4.1 4.7 0.5 0.4 13 9 Ukraine [2] 51.7 49.3 1.2 1.5 — 3 Uzbekistan [4] 22.3 25.3 1.7 6.6 8 26 BALTIC STATES 7.6 7.2 0.4 0.2 5 2 Estonia [3] 1.5 1.4 0.1 0.1 9 5 Latvia [2] 2.5 2.4 0.1 0.1 3 4 Lithuania [1] 3.6 3.5 0.2 0.0 4 —EASTERN EUROPE 121.4 120.9 3.9 4.0 3 3 Albania [3] 3.2 3.1 0.2 0.2 5 6 Bosnia and Herzegovina [3] 3.6 4.1 0.3 0.3 9 8 Bulgaria [3] 8.5 8.0 0.7 0.8 8 11 Croatia [3] 4.5 4.4 0.7 0.3 16 7 Czech Rep. [1] 10.3 10.3 0.2 0.2 — —Hungary [1] 10.2 10.0 0.1 0.0 — —TFYR Macedonia [3] 2.0 2.0 0.3 0.2 15 11 Poland [1] 38.5 38.6 0.3 0.3 — —Romania [1] 22.8 22.4 0.4 0.2 — —Serbia and Montenegro [3] 10.5 10.5 0.5 1.1 5 11 Slovakia [3] 5.3 5.4 0.2 0.3 4 5 Slovenia [1] 2.0 2.0 0.1 0.0 3 —
For notes on Table 1, please see page 39.

The State of Food Insecurity in the World 2004 37
Table 2. FOOD AVAILABILITY, DIET DIVERSIFICATION, CHILD MORTALITY, CHILD NUTRITIONAL STATUS, EDUCATION AND URBANIZATION in developing countries, classified by category of prevalence of undernourishment
LESS THAN 2.5% UNDERNOURISHED
Argentina 2 990 3 070 67 65 28 19 2 5 98 99 87 89
Libyan Arab Jamahiriya 3 280 3 320 54 51 42 19 na 5 91 97 80 85
Malaysia 2 820 2 890 48 53 21 8 25 20 95 98 50 62
Rep. of Korea 3 000 3 060 32 51 9 5 na na 100 100 74 80
Tunisia 3 150 3 270 42 47 52 26 10 4 84 95 58 63
United Arab Emirates 2 930 3 200 70 62 14 9 na na 85 92 83 85
2.5 TO 4% UNDERNOURISHED
Chile 2 610 2 850 51 56 19 12 2 1 98 99 83 86
Costa Rica 2 710 2 860 62 65 17 11 3 na 97 99 54 59
Cuba 2 720 3 000 58 63 13 9 na 4 99 100 74 75
Ecuador 2 510 2 740 65 66 57 29 17 14 96 98 55 60
Egypt 3 200 3 340 36 35 104 39 10 11 61 72 43 42
Iran, Islamic Rep. of 2 980 3 070 39 38 72 41 na 11 86 95 56 64
Lebanon 3 160 3 160 58 62 37 32 na 3 92 96 83 87
Saudi Arabia 2 770 2 840 52 50 44 28 na na 85 94 78 86
Syrian Arab Rep. 2 830 3 040 51 54 44 28 12 7 80 89 49 50
Turkey 3 490 3 360 45 47 78 41 10 8 93 97 59 65
Uruguay 2 660 2 830 62 59 24 15 4 na 99 99 89 92
5 TO 19% UNDERNOURISHED
Algeria 2 920 2 990 41 41 69 49 9 6 77 91 51 57
Benin 2 340 2 520 30 27 185 156 na 23 40 57 34 42
Brazil 2 810 3 010 57 66 60 37 7 6 92 96 75 81
Burkina Faso 2 350 2 410 26 25 210 207 33 34 25 38 14 17
China 2 710 2 960 20 42 49 38 17 10 95 98 27 36
Colombia 2 440 2 580 59 59 36 23 10 7 95 97 69 75
Côte d’Ivoire 2 470 2 620 34 35 157 191 12 21 53 64 40 44
El Salvador 2 490 2 550 44 48 60 39 15 10 84 89 49 58
Gabon 2 450 2 610 58 51 92 91 na 12 na na 68 81
Ghana 2 080 2 620 35 28 125 97 30 25 82 93 36 44
Guyana 2 350 2 710 50 50 90 72 18 14 100 100 33 36
Indonesia 2 700 2 910 25 30 91 43 38 25 95 98 31 42
Jamaica 2 500 2 670 58 60 20 20 7 4 91 95 51 52
Jordan 2 820 2 670 48 48 43 33 6 4 97 100 72 79
Kuwait 2 370 3 050 62 58 16 10 11 2 88 93 95 96
Lesotho 2 450 2 620 26 19 120 87 16 18 87 91 17 18
Mauritania 2 560 2 780 50 49 183 183 48 32 46 50 44 58
Mauritius 2 890 2 960 49 53 25 19 24 15 91 95 41 43
Mexico 3 100 3 160 52 53 46 29 14 8 95 97 72 75
Morocco 3 030 3 040 35 36 85 43 10 9 55 71 48 55
Myanmar 2 630 2 880 20 27 130 108 32 35 88 92 25 28
Nepal 2 350 2 440 19 23 145 87 na 48 47 64 9 14
Nigeria 2 540 2 700 45 35 235 201 35 31 74 89 35 44
Paraguay 2 400 2 560 56 59 37 30 4 na 96 97 49 55
Peru 1 960 2 550 46 46 80 39 11 7 95 97 69 73
Suriname 2 530 2 630 52 56 48 40 na 13 na na 65 74
CATEGORY OF PREVALENCE Food Diet Child Child nutritional Education UrbanizationOF UNDERNOURISHMENT availability diversification mortality status in total population 2000–2002 Dietary energy Share of non-starchy Under-five Under-five Literacy Urban share inCountry supply (DES) food in total DES mortality rate underweight rate total population 1990–1992 2000–2002 1979–1981 2000–2002 1990 2002 1990 2000 1990 2003 1990 2000 kcal/day/person % per 1 000 live births % % %

The State of Food Insecurity in the World 200438
Tables
Swaziland 2 460 2 360 45 53 110 149 na 10 85 92 23 23
Trinidad and Tobago 2 640 2 730 59 62 24 20 7 6 100 100 69 74
Uganda 2 270 2 360 52 55 160 141 23 23 70 81 11 12
Venezuela 2 460 2 350 63 60 27 22 8 4 96 98 84 87
Viet Nam 2 180 2 530 16 28 53 26 41 34 94 96 20 24
20 TO 34% UNDERNOURISHED
Bangladesh 2 070 2 190 15 16 144 73 66 48 42 50 20 23
Bolivia 2 110 2 250 52 50 120 71 11 8 93 97 56 62
Botswana 2 260 2 160 45 51 58 110 na 13 83 90 42 50
Cambodia 1 870 2 060 12 22 115 138 na 45 74 81 13 17
Cameroon 2 110 2 260 45 43 139 166 15 23 81 92 40 49
Chad 1 780 2 150 34 42 203 200 na 28 48 71 21 24
Dominican Rep. 2 260 2 320 65 67 65 38 10 5 88 92 55 58
Gambia 2 370 2 270 36 47 154 126 na 17 42 62 25 26
Guatemala 2 350 2 190 40 48 82 49 33 24 73 81 41 45
Guinea 2 110 2 380 40 40 240 165 24 23 na na 25 33
Honduras 2 310 2 350 46 54 59 42 18 17 80 86 40 44
India 2 370 2 420 32 39 123 90 56 47 64 75 26 28
Kenya 1 920 2 110 36 46 97 122 23 21 90 96 25 36
Lao People’s Dem. Rep. 2 110 2 290 14 23 163 100 44 40 70 80 15 19
Malawi 1 880 2 150 29 24 241 182 28 25 63 73 12 15
Mali 2 220 2 200 30 28 250 222 31 33 28 39 24 30
Mongolia 2 070 2 240 52 53 104 71 12 13 99 99 57 57
Namibia 2 060 2 270 42 40 84 67 26 na 87 93 27 31
Nicaragua 2 220 2 280 52 49 68 41 11 10 68 73 53 56
Niger 2 020 2 130 28 26 320 264 43 40 17 25 16 21
Pakistan 2 300 2 430 42 47 130 104 40 38 47 60 31 33
Panama 2 320 2 240 61 61 34 25 na 8 95 97 54 56
Philippines 2 260 2 380 41 44 63 37 34 32 97 99 49 59
Senegal 2 280 2 280 34 39 148 138 22 23 40 54 40 47
Sri Lanka 2 230 2 390 42 45 23 19 37 33 95 97 21 21
Sudan 2 160 2 260 50 47 120 94 34 41 65 80 27 36
Thailand 2 250 2 450 33 50 40 28 25 18 98 99 29 31
Togo 2 150 2 300 22 23 152 141 25 25 64 78 29 33
35% OR MORE UNDERNOURISHED
Angola 1 780 2 040 40 32 260 260 na 31 na na 26 33
Burundi 1 900 1 640 56 48 190 190 38 45 52 67 6 9
Central African Rep. 1 870 1 980 34 43 180 180 27 24 52 71 37 41
Congo 1 860 2 090 34 37 110 108 24 na 93 98 48 52
Dem. People’s Rep. of Korea 2 450 2 140 34 36 55 55 na 28 na na 58 60
Dem. Rep. of the Congo 2 170 1 630 28 24 205 205 na 31 69 85 28 30
Eritrea na 1 520 na 25 147 89 41 40 61 73 16 19
Ethiopia na 1 840 na 20 204 171 46 47 43 59 13 15
Haiti 1 780 2 080 49 45 150 123 27 17 55 67 29 36
Liberia 2 210 1 990 27 36 235 235 na 27 57 72 42 45
Table 2 cont. FOOD AVAILABILITY, DIET DIVERSIFICATION, CHILD MORTALITY, CHILD NUTRITIONAL STATUS, EDUCATION AND URBANIZATION in developing countries, classified by category of prevalence of undernourishment
CATEGORY OF PREVALENCE Food Diet Child Child nutritional Education UrbanizationOF UNDERNOURISHMENT availability diversification mortality status in total population 2000–2002 Dietary energy Share of non-starchy Under-five Under-five Literacy Urban share inCountry supply (DES) food in total DES mortality rate underweight rate total population 1990–1992 2000–2002 1979–1981 2000–2002 1990 2002 1990 2000 1990 2003 1990 2000 kcal/day/person % per 1 000 live births % % %

The State of Food Insecurity in the World 2004 39
Table 2 cont. FOOD AVAILABILITY, DIET DIVERSIFICATION, CHILD MORTALITY, CHILD NUTRITIONAL STATUS, EDUCATION AND URBANIZATION in developing countries, classified by category of prevalence of undernourishment
Madagascar 2 080 2 060 27 23 168 135 41 40 72 82 24 26
Mozambique 1 740 2 030 25 25 240 205 na 26 49 64 21 32
Rwanda 1 950 2 050 50 44 173 203 29 24 73 86 5 14
Sierra Leone 1 990 1 930 40 36 302 284 29 27 na na 30 37
United Rep. of Tanzania 2 050 1 960 31 29 163 165 29 29 83 92 22 32
Yemen 2 040 2 040 34 34 142 114 30 46 50 69 21 25
Zambia 1 930 1 900 23 23 180 182 21 28 81 90 39 35
Zimbabwe 1 970 2 020 34 44 80 123 12 13 94 98 29 34
CATEGORY OF PREVALENCE Food Diet Child Child nutritional Education UrbanizationOF UNDERNOURISHMENT availability diversification mortality status in total population 2000–2002 Dietary energy Share of non-starchy Under-five Under-five Literacy Urban share inCountry supply (DES) food in total DES mortality rate underweight rate total population 1990–1992 2000–2002 1979–1981 2000–2002 1990 2002 1990 2000 1990 2003 1990 2000 kcal/day/person % per 1 000 live births % % %
NOTES TO TABLE 2Non-starchy food: all food sources for DES, except cereals and roots and tubers. Under-five mortality rate: probability that a newborn baby will die before reaching age five, if subject to current age-specific mortality rates. The probability is expressed as a rate per 1 000 live births. Under-five underweight: proportion of children under the age of five whose weight falls below the mean weight-for-age by two standard deviations or more. Dates of the surveys vary. For each country, data were included for the year closest to 1990 from the decade 1985–1994 and for the most recent year from the decade 1995–2004.Literacy rate: The percentage of persons aged between 15 and 24 who can, with understanding, both read and write a short simple statement on everyday life.Urbanization: Percentage of population at mid-year residing in urban areas.
KEY
na data not available
SOURCES
Category of undernourishment, food availability and diet diversification: FAOChild mortality: UNICEFChild nutritional status: WHOEducation: UNESCOUrbanization: UN Population Division: UN Population Prospects, 2003 revision
NOTES TO TABLE 1Countries revise their offi cial statistics regularly for the past as well as the present. The same holds for population data of the UN. Whenever this happens, FAO revises its estimates of undernourishment accordingly. Therefore users are advised to refer to changes of estimates over time only within the same SOFI publication and refrain from comparing data published in editions for different years.
Figures following country name refer to the prevalence categories (proportion of the population undernourished in 2000–2002): [1] < 2.5% undernourished[2] 2.5–4% undernourished[3] 5–19% undernourished[4] 20–34% undernourished[5] 35% undernourished
Table does not list countries for which there were insuffi cient data.
* Although not listed separately, provisional estimates for Afghanistan, Iraq, Papua New Guinea and Somalia have been included in the relevant regional aggregates.
** Eritrea and Ethiopia were not separate entities in 1990–1992 but estimates of the number and proportion of undernourished in the former Ethiopia PDR are included in regional and subregional aggregates for that period.
KEY
— proportion less than 2.5% undernourishedna data not available0.0 zero or less than half the unit shown
SOURCES
Total population: UN Population Prospects, 2002 revisionUndernourishment: FAO estimates

The State of Food Insecurity in the World 200440
The State of Food Insecurity in the World 2004 is based mainly on data and analysis provided by FAO’s technical divisions. Specifi c references cited for particular articles in this edition include the following:
Pages 8-13
A technical note regarding FAO’s preliminary estimates of the costs of hunger is available at www.fao.org/sof/sofi /.
ACC/SCN. 2004. Fifth report on the world nutrition situation. Geneva. 130 pp.
Alderman, H. and Behrman, J. 2003. Estimated economic benefi ts of reducing LBW in low-income countries. Philadelphia. University of Pennsylvania.
Alderman, H., Hoddinott, J., & Kinsey, B. 2003. Long-term consequences of early childhood malnutrition. Washington, DC, IFPRI. 30 pp.
Alderman, H., Behrman, J., & Hoddinott, J. 2004. Hunger and malnutrition. In Lomborg, B. ed., Global crises, global solutions. Cambridge. Cambridge University Press. 672 pp.
Black, R., Morris, S. & Bryce, J. 2003. Where and why are 10 million children dying every year. The Lancet, 361: 2226-34.
Horton, S. 1999. Opportunities for investments in nutrition in low-income Asia. Asian Development Review, 17 (1,2): 246-273.
Horton, S. & Ross, J. 2003. The economics of iron defi ciency. Food Policy 28: 51-75.
Jones, G., Steketee, R., Black, R., Bhutta, Q., Morris, S. & the Bellagio Child Survival Study Group. 2003. How many child deaths can we prevent this year. The Lancet, 362: 65-71.
Martorell, R., Khan, K.L. & Schroeder, D.G. 1994. Reversibility of stunting: Epidemiological fi ndings in children from developing countries. European Journal of Clinical Nutrition, 48 (Suppl 1): S45-57.
Pelletier, D., Frongillo, E. 2002. Changes in child survival are strongly associated with changes in malnutrition in developing countries. Washington, DC, Academy for Educational Development. 32 pp.
Popkin, B., Horton, S., and Kim, S. 2001. The nutrition transition and prevention of diet-related diseases in Asia and the Pacifi c. Tokyo. UN University Press. 58 pp.
Seres, N. in ACC/SCN. 2000. Fourth report on the world nutrition situation. Geneva. 121 pp.
WHO. 2002. The world health report 2002. Geneva. 248 pp.
Pages 14-15
FAO. 2003. Proceedings: Measurement and assessment of food deprivation and undernutrition. Rome, 411 pp.
UNICEF. 2003. The state of the world’s children 2004. New York. 147 pp.
Pages 18-23
Barker, D. 1999. The long-term outcome of retarded fetal growth. Schweiz Med Wochenschr 129:189–96.
Barker, D. 1999. The fetal origins of type 2 diabetes mellitus. Annals of Internal Medicine, 130 (4): 322-324.
Faigenbaum, S. 2002. Los supermercados en la distribución alimentaria y su impacto sobre el sistema agroalimentario nacional. Santiago. University of Chile. 93 pp.
FAO. 2000. Analysis of disparities in nutritional status by wealth and residence: examples from Angola, Central African Republic and Senegal. Rome. 23 pp.
Haddad, L., Ruel, M. & Garrett, J. 1999. Are urban poverty and undernutrition growing: some newly assembled evidence. Washington. IFPRI. 41 pp.
Maxwell, D., Levin, C., Armar-Klemesu, M., Ruel, M., Morris, S., & Ahiadeke, C. 2000. Urban livelihoods and food and nutrition security in greater Accra, Ghana. Washington. IFPRI. 172 pp.
McCulloch, N. & Ota, M. 2002. Export horticulture and poverty in Kenya. Brighton. IDS. 24 pp.
Neven, D. & Reardon, T. 2003. The rapid rise of Kenyan supermarkets: impact on the fruits and vegetables supply system. Unpublished paper presented at FAO Scientifi c Workshop: Globalization of food systems: impact on food security and nutrition, Rome, 8-10 October 2003. 17 pp.
Popkin, B. 2003. The nutrition transition in the developing world. Development Policy Review, 21 (5-6): 581-597.
Reardon, T., Timmer, P., Barrett, C. & Berdegué, J. 2003. The rise of supermarkets in Africa, Asia and Latin America. American Journal of Agricultural Economics 85 (5): 1140-1146.
UK Food Group. 2003. Food, inc. London. IIED. 89 pp.
UN. 2004. World urbanization prospects: the 2003 revision, data tables and highlights. New York. 20 pp.
Weatherspoon, D. & Reardon, T. 2003. The rise of supermarkets in Africa: implications for agrifood systems and the rural poor. Development Policy Review, 21 (3).
World Bank. 2003. Global economic prospects 2004. Washington. 333 pp.
Pages 24-25
Arantes, R. 2003. The Brazilian “Ministério Público” and political corruption in Brazil. Oxford. Centre for Brazilian Studies, University of Oxford. 28 pp.
Millennium Project Task Force on Hunger. 2004. Halving hunger by 2015: a framework for action. Interim report. New York. Millennium Project. 219 pp.
Pages 26-27
Korf, B, & Singarayer, R. 2002. Livelihoods, food security and confl ict in Trincomalee. Paper presented at the Third CEPA/PIMU Poverty Symposium, Colombo. 21 pp.
FAO. 2003. Understanding seed systems and strengthening seed security. Rome. 23 pp.
LEISA. 2001. Coping with disaster. LEISA Magazine 17 (1): 1-36.
Zakieldin, S. 2002. How communities of Western Sudan have coped with and adapted to present climate hazards. Presentation to the Second AIACC African and Indian Ocean Island Regional Workshop, Dakar. 20 pp.
Pages 28-29
Behrman, J., Sengupta, P. & Todd, P. 2001. Progressing through PROGRESA: an impact assessment of a school subsidy experiment. Washington. IFPRI. 83 pp.
Global Campaign for Education. 2004. Learning to survive: how education for all would save millions of young people from HIV/AIDS. 32 pp. Available at www.campaignforeducation.org/resources/Jan2004/WEF_GGI2003.pdf
McEwan, P. 1999. Evaluating rural education reform: the case of Colombia’s Escuela Nueva Program. La Educación, 132-133 (available at www.iacd.oas.org/LaEduca132/mcewan/mcewan132-134.htm).
Pages 30-33
FAO. 2004. International Year of Rice fact sheets (available at www.fao.org/rice2004/en/factsheets.htm).
HM Treasury/DFID. 2004. International Finance Facility proposal. London. HM Stationery Offi ce. 19 pp.
IRRI. 2002. Food security as economic stimulus. Rice Today 1 (1): 29.
van den Berg, H. 2004. IPM Farmer Field Schools: a synthesis of 25 impact evaluations. Rome. FAO. 53 pp.
Sources

The State of Food Insecurity in the World
2004
monitoring progress towards the World Food Summit and
Millennium Development Goals
The State of Food Insecurity in the World The sixth edition of The State of Food Insecurity in the World reports that the number of chronically hungry people in the developing world has fallen by only 9 million since the World Food Summit baseline period of 1990–1992. The conclusion is inescapable – we must do better.
Looking at the impressive progress that more than 30 countries in all developing regions have made in reducing hunger, the report highlights another clear and compelling lesson – we can do better.
And for the fi rst time, The State of Food Insecurity in the World 2004 presents provisional estimates of the staggering costs that hunger infl icts on households and nations – the millions of lives ravaged by premature death and disability, the billions of dollars in lost productivity and earnings. On both moral and pragmatic grounds, these estimates lead to one more unavoidable conclusion – we cannot afford not to do better.
The report also includes a special feature examining the impact that the rapid growth of cities and incomes in developing countries and the globalization of the food industry have had on hunger, food security and nutrition.
The State of Food Insecurity in the World 2004 concludes with an urgent appeal to scale up action, resources and commitment in order to achieve the World Food Summit goal. That goal of cutting the number of hungry people in half by the year 2015 can still be reached if we just focus our efforts over the next ten years on simple, low-cost, targeted actions that will improve food security quickly for very large numbers of people.
Hunger cannot wait.
TC/M/Y5650E/1/11.04/6000
ISBN 92-5-105178-X
9 7 8 9 2 5 1 0 5 1 7 8 8