The State of Food and Agriculture 2018 - fao.org · Food and Agriculture Organization of the United...
199
MIGRATION, AGRICULTURE AND RURAL DEVELOPMENT FOOD AND AGRICULTURE THE STATE OF 2018
-
Upload
trinhquynh -
Category
Documents
-
view
222 -
download
0
Transcript of The State of Food and Agriculture 2018 - fao.org · Food and Agriculture Organization of the United...
MIGRATION, AGRICULTUREAND RURAL DEVELOPMENT
FOOD AND AGRICULTURE
THE STATE OF
2018 2018 2018 2018

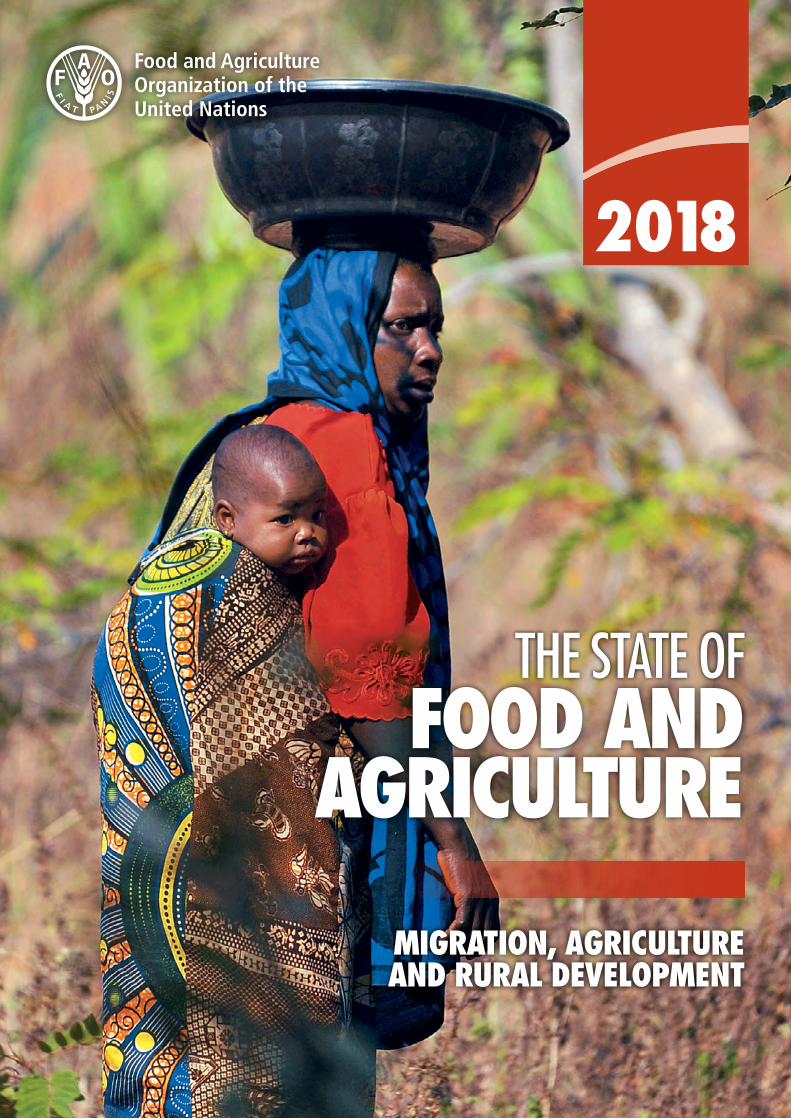
UNITED REPUBLIC OF TANZANIA: A forest-dependent mother walks through the brush with her child. In the United Republic of Tanzania, around 30 percent of rural–urban female migrants eventually return to rural areas.
COVER PHOTOGRAPH ©FAO/Simon Maina
This flagship publication is part of THE STATE OF THE WORLD series of the Food and Agriculture Organization of the United Nations.
Required citation:FAO. 2018. The State of Food and Agriculture 2018. Migration, agriculture and rural development. Rome. Licence: CC BY-NC-SA 3.0 IGO.
The designations employed and the presentation of material in this information product do not imply the expression of any opinion whatsoever on the part of the Food and Agriculture Organization of the United Nations (FAO) concerning the legal or development status of any country, territory, city or area or of its authorities, or concerning the delimitation of its frontiers or boundaries. The mention of specific companies or products of manufacturers, whether or not these have been patented, does not imply that these have been endorsed or recommended by FAO in preference to others of a similar nature that are not mentioned.
ISBN 978-92-5-130568-3© FAO 2018
Some rights reserved. This work is made available under the Creative Commons Attribution-NonCommercial-ShareAlike 3.0 IGO licence (CC BY-NC-SA 3.0 IGO; https://creativecommons.org/licenses/by-nc-sa/3.0/igo).
Under the terms of this licence, this work may be copied, redistributed and adapted for non-commercial purposes, provided that the work is appropriately cited. In any use of this work, there should be no suggestion that FAO endorses any specific organization, products or services. The use of the FAO logo is not permitted. If the work is adapted, then it must be licensed under the same or equivalent Creative Commons license. If a translation of this work is created, it must include the following disclaimer along with the required citation: “This translation was not created by the Food and Agriculture Organization of the United Nations (FAO). FAO is not responsible for the content or accuracy of this translation. The original English edition shall be the authoritative edition.”
Any mediation relating to disputes arising under the licence shall be conducted in accordance with the Arbitration Rules of the United Nations Commission on International Trade Law (UNCITRAL) as at present in force.
Third-party materials. Users wishing to reuse material from this work that is attributed to a third party, such as tables, figures or images, are responsible for determining whether permission is needed for that reuse and for obtaining permission from the copyright holder. The risk of claims resulting from infringement of any third-party-owned component in the work rests solely with the user.
Sales, rights and licensing. FAO information products are available on the FAO website (www.fao.org/publications) and can be purchased through [email protected]. Requests for commercial use should be submitted via: www.fao.org/contact-us/licence-request. Queries regarding rights and licensing should be submitted to: [email protected].

Food and Agriculture Organization of the United NationsRome, 2018
2018
MIGRATION, AGRICULTURE AND RURAL DEVELOPMENT
FOOD AND AGRICULTURE
THE STATE OF
ISS
N 0
081-
4539

| ii |
CONTENTSFOREWORD v
METHODOLOGY viii
ACKNOWLEDGEMENTS ix ACRONYMS AND ABBREVIATIONS xi
CORE MESSAGES OF SOFA 2018 xii
EXECUTIVE SUMMARY xiii
CHAPTER 1 RURAL MIGRATION AND DEVELOPMENT: LAYING THE GROUNDWORK 1Key messages 1
Migration: a reflection of evolving societies 2
Migration in changing contexts 4
Migration concepts and drivers: from totally voluntary to totally forced migration 5
What is the role of rural areas in the development-migration nexus? 8
Structural transformation, rural–urban linkages and demographics in rural areas 13
Different migration challenges – country profiles based on drivers of rural migration 13
A territorial development approach can maximize the benefits of rural migration for economic transformation 17
Objectives of the report 19
CHAPTER 2 TRENDS AND PATTERNS OF RURAL MIGRATION 21Key messages 21
Numbers of international migrants have increased significantly, but much less as a share of total population 22
International and internal rural migration are closely linked 29
Internal migration is a greater phenomenon than international migration 32
Many migrants are refugees or internally displaced people 42
Conclusions 45
CHAPTER 3 WHAT DRIVES RURAL MIGRATION: DETERMINANTS, CONSTRAINTS AND MIGRANT CHARACTERISTICS 49Key messages 49Conceptual framework for migration drivers 50Macrofactors create incentives for rural migration 54Intermediate conditioning factors can influence the magnitude of rural migration 58Who are the migrants and how are they different from non-migrants? 61Protracted crises cause large human displacements and alter migration systems 68Conclusions and policy implications 72
CHAPTER 4 IMPACTS OF MIGRATION ON AGRICULTURE AND RURAL AREAS 75Key messages 75Migration impact channels 76Impacts of rural migration on communities of origin are significant, but mixed 80Rural migration has indirect impacts on rural communities and the broader economy 87Forced migration due to protracted crises disrupts rural livelihoods, but also offers potential benefits to host communities 92Immigrants play a crucial role in maintaining agriculture and rural livelihoods in developed countries 98Conclusions and policy implications 100
CHAPTER 5 MIGRATION AND ECONOMIC TRANSFORMATION: AN INTEGRATED POLICY APPROACH 103Key messages 103Policy objectives and challenges related to rural migration: the broad perspective 105Setting priorities for policy areas relevant to rural migration 107Enhancing the development potential of migration 114Conclusions 117
STATISTICAL ANNEX 118
REFERENCES 159

| iii |
TABLES, FIGURES AND BOXES TABLES
1 Seasonal migrants as share of international and internal rural migrants for selected countries 29
2 Numbers of refugees by hosting region – 1990, 1995, 2000, 2005, 2010 and 2015 44
3 Percentage change in employment status for rural–urban migrants and rural non-migrants based on previous status – South Africa, 2008–2014 55
4 Five dimensions of the 2016 OECD fragility framework 69
FIGURES
1 Migration decisions are mostly made under combinations of coercive factors and free will 8
2 A schematic representation of migration flows considered in this report 12
3 A typology of country profiles based on drivers of rural migration as a function of development, governance, and rural demographics 15
4 Placement of selected countries within the country profile typology based on drivers of rural migration, 2015 16
5 International migrants by origin and destination – 1990, 1995, 2000, 2005, 2010 and 2015 24
6 Destination of out-migrants from different sub-regions, 2015 26
7 Share of international migrants originating from rural areas vs share of rural population in national population – selected countries 28
8 Destinations of rural out-migrants by gender for selected countries 30
9 Share of people planning to migrate internationally in the following 12 months by country income group and by internal migrants/ non-migrants, 2013 31
10 Share of internal migrants planning to migrate internationally in the following 12 months, by rural and urban area and by country income group, 2013 31
11 Shares of five-year internal migrants to rural and to urban areas by country income group, 2013 34
12 Share of population that migrated or remained based on childhood residence and current location – aggregate for 31 countries 36
13 Share of population that migrated or remained based on childhood residence and current location – selected countries 37
14 Share of national population that remained, moved once, and moved more than once based on childhood residence – aggregate measure based on 31 countries (late 1990s – early 2000s) 39
15 Share of moves that are between rural and urban areas, intra-urban and intra-rural 40
16 Share of rural–urban migrants who return to rural areas, by gender 41
17 Trends in global displacement due to conflict, 2000–2016 43
18 Distribution of refugee population by type of locality, globally, and by selected regions, 2016 44
19 Relationship between migration drivers and pools of actual and potential migrants 52
20 Migrants’ information sources prior to migration, by migration type and country 60
21 Proportion of internal and international migrant age groups for selected countries (national and rural levels) 63
22 Education levels of rural migrant groups compared to those who remain in rural areas, Indonesia and Kenya 64
23 Reasons for out-migration from rural areas in selected countries, by gender 66
24 Impact channels of migration 77
25 Share of households in rural and urban areas that receive international remittances 79
26 Household activities previously undertaken by male and female migrants 82
27 Household use of cash remittances 83
28 Share of rural households receiving international remittances, by participation in agriculture 90
29 Hours of farm work and share of rural households in agriculture in China, by survey round 91
30 Agricultural value added as a percentage of GDP, by fragility level, 2002–2015 93

TABLES, FIGURES AND BOXES
| iv |
BOXES
1 Taking part in economic transformation 3
2 Does development reduce international migration? 6
3 Push and pull factors: Lee’s model of migration and beyond 9
4 Key migration terms used in this report 10
5 Population dynamics, farmland availability and rural migration 14
6 Potential data sources for analysing migration and rural transformation 23
7 Challenges in measuring internal migration 33
8 Internal migration flows in India 38
9 Refugees and Internally Displaced Persons (IDPs): basic concepts and legal implications 42
10 International migration: few potential migrants envision migrating within a year 53
11 Empirical evidence indicates that those with little or no access to resources are the least mobile 67
12 Nexus of poor governance, environmental degradation and rural migration: the example of the Syrian Arab Republic 71
13 Establishing the causal effects of migration: the limitations of existing evidence 78
14 Male out-migration and women’s increasing role in agriculture 81
15 Stabilizing food security and increasing protein consumption through migration: the monga season in Bangladesh 85
16 Impacts of migration on rural labour and food markets in Bangladesh 88
17 Promoting inclusive economic growth by matching grants for agriculture and agribusiness in the Republic of Tajikistan 89
18 The economic benefits of camp-based refugees for surrounding communities 96
19 Engaging refugees in agriculture in the United States of America 97
20 Is restricting immigration good for high-income countries? 99
21 Policies to enhance human development outcomes of migration – proposals by UNDP 105
22 Colombia: revitalization of the rural sector after conflict 110
23 Coordination to facilitate seasonal international migration 113
24 Mobilizing the human and financial resources of return migrants for agricultural development in Moldova 115
25 What can be done to address the data gaps in the study of rural migration? 116

FOREWORD
| v |
Few issues attract as much attention or are subject to as much controversy in international and domestic policy debates today as migration. Growing concerns over the increasingly large numbers of migrants and refugees moving across borders has directed most of this attention towards international migration, which has made it to the top of the international policy agenda. The United Nations 2030 Agenda for Sustainable Development and the Sustainable Development Goals (SDGs) it embraces clearly recognize the importance of migration, the challenges it poses and the opportunities it provides. SDG Target 10.7 calls for facilitating orderly, safe and responsible migration. It is significant that this call is placed within the context of SDG 10, which aims at reducing inequality within and among countries. This constitutes a clear recognition of the positive side of migration and the role it can play in reducing inequalities. Furthermore, in September 2016 the United Nations General Assembly adopted the New York Declaration for Refugees and Migrants, taking another step forward by launching the process of developing two Global Compacts for safe, orderly and regular migration and on refugees, respectively.
Unfortunately, much of the debate on migration focuses on its negative sides. The complexity of the phenomenon tends to be overlooked and the opportunities presented not fully recognized. In his report Making migration work for all, the United Nations Secretary-General acknowledges the widespread existence of “xenophobic political narratives about migration” and calls for a respectful and realistic debate on migration. He also draws attention to the role of migration as “an engine of economic growth, innovation and sustainable development”. The basic challenge, according to the UN Secretary-General, is to maximize the benefits of migration while ensuring that it is never an act of desperation.
In order to arrive at a more realistic and dispassionate debate on the issue, there is a need
to truly understand migration: what it is, what its magnitude is, what drives it and what the impacts are. Only through such an enhanced understanding will we be able to put in place the best policy responses to the challenges it poses and the opportunities it presents. This report aims to contribute to just such an outcome on both internal and international migration, from an FAO perspective.
The first thing to understand is the diverse nature of the migration experience. Migration is a complex and multifaceted phenomenon that ranges from voluntary migration – whereby people choose to move in search of better opportunities – to forced migration – where they move to escape life-threatening situations caused by conf licts or disasters. The two have different drivers and different impacts and call for – at least partly – different responses. In between are situations where choice and coercion contribute to different degrees to people’s decision to move. This typically applies to slow-onset processes such as the incremental impacts of climate change, where people at some point come to the conclusion that moving is the best available option.
Furthermore, I have noted that most of the attention is on international migration, but this report highlights that this is only part of a much bigger picture that also includes migration within countries, and that the latter is much larger than the former. International migration is often preceded by internal migration, for example through a move from a rural area to a city. Another fact, which may come as a surprise to many, is that migration between developing countries is just as important in terms of magnitude as migration from developing to developed countries. A lot of people may also be surprised to learn that the vast majority of international refugees – around 85 percent – are hosted by developing countries.

FOREWORD
The key focus of this report is rural migration, which constitutes a considerable portion of both internal and international migration f lows. By rural migration we mean migration from, to and between rural areas, whether the move occurs within a country or involves crossing a border. In many countries, especially those at less advanced levels of development and that still have large rural populations, migration between rural areas exceeds rural–urban migration. What is more, a large number of international refugees – at least 30 percent at the global level and more than 80 percent in sub-Saharan Africa – are found in rural areas of their host countries. Understanding rural migration – its magnitude, characteristics, drivers and impacts – must therefore feature prominently when addressing development.
Rural migration is closely linked not only with agriculture and rural development, but also with the overall development of societies. It is a historically important phenomenon which has contributed to the transformation of societies from essentially rural to more urbanized. It has accompanied the gradual process whereby labour is transferred from agriculture to more productive sectors in manufacturing and services that are often located in urban areas, thus contributing to rising incomes and economic, social and human development. The process of people moving out of rural areas, either to cities or to other countries, continues in many societies today. In many high-income countries the process has reached the point where agriculture and rural areas are economically viable only to the extent that immigrant labour is available.
Clearly, we must recognize that rural migration is a phenomenon that presents both opportunities and challenges, benefits as well as costs, for migrants themselves and for societies in general. For migrants, migration can mean higher incomes, access to better social services, and improved livelihoods. It can mean improved education and nutrition for their children. It can also have beneficial effects on the families and
households of migrants who have remained behind in rural areas, for example through remittances, and can help them diversify their sources of income and improve their conditions. Migration can contribute to rising incomes and the overall economic and social development of societies through new productive resources, skills and ideas. Unfortunately, these opportunities are often not available for the poorest sectors of the population, who may not have the means to face the high cost of migrating.
We cannot ignore the challenges and costs associated with migration. For individuals, these costs can be high at the economic, social and personal levels. It can be disruptive for families and for communities of origin, not least when it leads to the loss of often the most dynamic part of the workforce, since it is generally the younger and better educated who migrate. The balance between the benefits and the costs is not always positive for those who move or for those who are left behind.
Finally, we must not ignore that too many people – refugees and the internally displaced – move not because they choose to, but because they have no choice. Increasing numbers of refugees and internally displaced people constitute the most dramatic dimension of migration and call for determined efforts by the international community to address the causes of this displacement, to build resilience among rural people threatened by disasters and conf licts and to support host countries and communities in coping with the sometimes vast inf lux of people.
Given the complexity of migration, the appropriate policy responses are diff icult to identify or put in place. The drivers, impacts, costs and benefits of migration are very different and dependent on context. Policy challenges relating to rural migration vary greatly between countries. Some are destination countries for international migration, others are at the origin of international migration f lows, some are transit
FOREWORD
| vi |

countries, and many are two or three of these at the same time. Some countries still have large rural populations, constituting a potential source of large f lows of rural outmigration, while others have already seen major rural outmigration and are now largely urbanized. Some countries with large or growing rural populations – particularly youth – have the development momentum necessary to generate employment opportunities; others, mired in low levels and slow progress of development, face major diff iculties addressing these demographic pressures and providing opportunities for young people in rural areas.
Countries in protracted crisis face enormous challenges due to displacement of people and the undermining of livelihoods, not to mention the physical threat to lives and assets, while others have to cope with sometimes massive inf lows of refugees and displaced populations. All these countries face different challenges associated with migration and will have different policy priorities when trying to address them.
Beyond the case of forced migration linked to crisis situations, it is important not to consider migration per se as a problem that requires a solution. As such, policies should not aim to either stem or promote migration. Rather the objective must be to make migration a choice, not a necessity, and to maximize the positive impacts while minimizing the negative ones. This means that in many situations it makes sense to facilitate migration and help prospective migrants overcome the constraints they might face, thus allowing them to take advantage of the opportunities that migration offers. At the same time, it also means providing attractive alternative opportunities to prospective rural migrants, not least by promoting development in rural areas or in their proximity. In this context, a key role can be played by the territorial development approach advocated in the 2017 edition of this publication, namely by improving infrastructure and services in small cities and towns and the surrounding rural areas, creating
better links between them and exploiting the potential that agriculture and agroindustry offer for local and overall development.
When FAO published The State of Food and Agriculture for the first time in 1947, the focus was on reconstructing the global food system after years of world war. Since then liv ing conditions around the world have improved dramatically, not least thanks to the increased circulation of goods, people, and ideas. Looking back, I cannot help but think that we are at a critical juncture in history where we risk losing sight of how far we have come. Yet much remains to be done to eliminate poverty and hunger in the world. Migration was – and will continue to be – part and parcel of the broader development process. My hope is that this report can help to better understand how the challenges associated with rural migration can be turned into opportunities and the benefits it offers maximized, thereby contributing to eradicating poverty and hunger.
| vii |
José Graziano da SilvaFAO Director-General

| viii |
METHODOLOGY
The preparation of The State of Food and Agriculture 2018 began with an inception workshop, held at FAO headquarters in Rome on 18 September 2017 and attended by members of a panel of external experts and FAO specialists. Following the workshop, an advisory group representing all relevant FAO technical units and chaired by the Deputy-Director of FAO’s Agricultural Development Economics Division (ESA) was formed to assist in the drafting process. At a seminar held on 27 September 2017, the research and writing team and the advisory group discussed the report ’s outline. Input on the first annotated outline was also received through an open online consultation organized by the Global Forum on Food Security and Nutrition (FSN Forum). The first full draft was presented to the advisory group at a seminar in January 2018. The team used comments received from the advisory group to revise the outline and draft. The draft was then discussed at a second workshop held on 8-9 February with the advisory group and panel of external experts. With inputs from that workshop, the report was revised and presented to the FAO Economic and Social Development Department Management Team. The revised draft was sent for comments to other FAO departments and to the FAO regional offices for Africa, Asia and the Pacific, Europe and Central Asia, Latin America and the Caribbean, and the Near East and North Africa, as well as to external reviewers. Comments were incorporated in the final draft, which was submitted to the Office of the FAO Director-General on 28 May 2018. In drafting the report, the research and writing team drew on background papers prepared by FAO and external experts.

ACKNOWLEDGEMENTS
The State of Food and Agriculture 2018 was prepared by a multidisciplinary team from the Food and Agriculture Organization of the United Nations (FAO), under the direction of Marco V. Sánchez Cantillo, Deputy-Director of FAO’s Agricultural Development Economics Division, and Andrea Cattaneo, Senior Economist and Editor of the publication. Overall guidance was provided by Kostas Stamoulis, Assistant Director-General of the Economic and Social Development Department (ES). Guidance was also provided by the ES Management Team.
SOFA RESEARCH AND WRITING TEAMRaffaele Bertini, Thu Hien Dao, Elisenda Estruch, Julius Jackson, Theresa McMenomy, Andrew Park (consulting editor), Ahmad Sadiddin and Jakob Skøt.
BACKGROUND PAPERS, DATA AND SECTIONS OF THE REPORTSolomon Asfaw (FAO), Andrea Cattaneo (FAO), S. Chandrasekhar (Indira Gandhi Institute of Development Research, India), Reza Daniels (University of Cape Town, South Africa), Anda David (AFD), Alan de Brauw (IFPRI), Sylvie Démurger (CNRS), Tim Frankenberger (TANGO International), Joan Hamory Hicks (University of Oklahoma, USA), Nicholas Li (University of California, Berkeley, USA), Mariapia Mendola (University of Milan-Bicocca, Italy), Björn Nilsson (AFD), Michele Nori (European University Institute, Italy), Cecilia Poggi (University of Sussex, UK), Sherman Robinson (IFPRI), Alwyn Young (London School of Economics and Political Science, UK) and Stefanija Veljanoska (FAO).
ADDITIONAL FAO INPUTSCarlo Cafiero, Marinella Cirillo, Piero Conforti, Clara Aida Khalil, Svetlana Livinets, Marina Mastrorillo, Meghan Miller, Elise Polak, George Rapsomanikis and Mauricio Rosales.
FAO ADVISORY GROUPShukri Ahmed, Rima Al Azar, Solomon Asfaw, Omar Benammour, Dominique Burgeon, Piero Conforti, Mariaeleonora Dandrea, Benjamin Davis, Ana Paula de la O Campos, Jessica Fanzo, Nicole Franz, Adriana Ignaciuk, Patrick Jacqueson, Sally James, Etienne Juvanon du Vachat, Günter Hemrich, Panagiotis Karfakis, Svetlana Livinets, Erdgin Mane, Marina Mastrorillo, Patricia Mejias Moreno, Carlos Mielitz Netto, Giorgia Prati, Selvaraju Ramasamy, Cristina Rapone, George Rapsomanikis, Ahmed Raza, Clarissa Roncato Baldin, Mauricio Rosales, Luca Russo, Vanya Slavchevska, Stefanija Veljanoska and Natalia Winder Rossi.
| ix |

PANEL OF EXTERNAL EXPERTSClaudia Ah Poe (WFP), Sandra Paola Alvarez (IOM), Aslihan Arslan (IFAD), S. Chandrasekhar (Indira Gandhi Institute of Development Research, India), Luc Christiaensen (World Bank), Anda David (AFD), Alan de Brauw (IFPRI), Sylvie Démurger (CNRS), Eva-Maria Egger (IFAD), Jason Gagnon (OECD), Julie Litchfield (University of Sussex, UK), Robert E.B. Lucas (Boston University, USA), Bruno Losch (CIRAD), Mariapia Mendola (University of Milan-Bicocca, Italy), Cecilia Poggi (University of Sussex, UK), Donato Romano (University of Florence, Italy), Susanna Sandström (WFP), Ronald Skeldon (University of Sussex, UK), Rob Vos (IFPRI) and Raffaella Zucaro (CREA).
STATISTICAL ANNEXThe annex was prepared by Raffaele Bertini, Marinella Cirillo, Theresa McMenomy, Meghan Miller and Ahmad Sadiddin.
ADMINISTRATIVE SUPPORTPaola Di Santo and Liliana Maldonado.
The Publishing Group (OCCP) in FAO’s Office for Corporate Communication provided editorial support, design and layout, as well as production coordination, for editions in all six official languages.
ACKNOWLEDGEMENTS
| x |
CRRF Comprehensive Refugee Response
Framework
DHS Demographic and Health Surveys
Eurostat Statistical Office of the European Union
EWEA early warning early action
GDP gross domestic product
GWP Gallup® World Poll
HAFA Hmong American Farmers Association
HDI Human Development Index
IDPs internally displaced persons
ILO International Labour Organization
IOM International Organization for Migration
IPUMS Integrated Public Use Microdata Series
LSMS Living Standards Measurement Study
MOOP Migrating out of Poverty Research
Programme Consortium
OECD Organisation for Economic Co-operation
and Development
SDG Sustainable Development Goal
SOFA The State of Food and Agriculture
UN United Nations
UN DESA UN Department of Economic
and Social Affairs
UNDP United Nations Development Programme
UNHCR Office of the United Nations High
Commissioner for Refugees
UNRWA United Nations Relief and Works
Agency for Palestine Refugees
in the Near East
USAID United States Agency for
International Development
USD United States dollar
WFP World Food Programme
ACRONYMS AND ABBREVIATIONS
| xi |

CORE MESSAGES OF SOFA 2018
1Migration, despite the challenges it may present, is part and parcel of economic, social and human
development and a means of reducing inequality both within and between countries.
2At different points in their development, all countries will be areas of origin, transit or
destination – sometimes a combination of the three – for international migration.
3 Globally, international migration is a significantly smaller phenomenon than internal migration: more
than 1 billion people living in developing countries have moved internally.
4 International and internal migration flows share some of the same drivers and constitute an
integrated system: for example, in low-income countries internal migrants are five times more likely to migrate internationally than individuals who have not moved.
5 In developing regions with high urbanization rates, rural migration in all its forms accounts for at least
50 percent of all internal movements. In sub-Saharan Africa the share is greater than 75 percent.
6 Rural out-migration can be a means of income diversification, as well as an adaptation
mechanism to slow-onset environmental stressors such as severe water scarcity. However, it is not often an option for the poorest, who face the greatest constraints to mobility.
7 Rural areas host large numbers of displaced populations during protracted crises, leading to
further challenges and potentially negative effects. This burden can be alleviated through rural development policies that focus on the economic and social integration of migrants, resulting in outcomes that benefit both displaced people and their host areas.
8 In many developed countries immigrants can help fill labour shortages in high-value agriculture
activities that are difficult to mechanize, but integration can pose challenges both for immigrants and for host countries. Implementing and enforcing regulatory schemes and programmes to protect their labour rights can help improve their working conditions.
9 Policy coherence between migration and agriculture and rural development policies is
essential to ensure safe, orderly, and regular migration. Policies should not aim to reduce or accelerate migratory flows, but rather to maximize the economic and social benefits while minimizing the costs to migrants and societies.
10 Policy priorities relating to rural migration depend on country contexts that are
continuously evolving: these will be different for countries in protracted crisis situations, countries where rural youth employment is a challenge, countries in economic and demographic transition, and for developed countries in need of migrant workers.
| xii |

EXECUTIVE SUMMARY MIGRATION IS PART OF THE EVOLUTION OF SOCIETIESMigration is part and parcel of the history of humankind and accompanies the evolution of societies. Human mobility has always been part of the process of economic, social and human development. As societies undergo transformation, people inevitably move within and between countries in search of better opportunities. In fact, migration is recognized in the UN Sustainable Development Goals (SDGs) as one of the means to reduce inequality within and among countries.
The last century has witnessed dramatic changes in international migration f lows. At the beginning of the twentieth century Europe was a major source of migration, with people moving to the Americas, Australasia, and Central Asia. Another source was Southern China, with substantial numbers migrating to Southeast Asia. Today Europe is mostly a destination for migrants from Africa, Asia, and the Americas, as well as a locus for major internal migration f lows. Migration to North America originates mainly in Latin America and Asia. As development has advanced in Asia, some countries – such as Japan, the Republic of Korea, and Malaysia – have transitioned into destination countries. The same has happened for oil-rich countries in the Near East.
These shifts in international migration must be seen in the broader context of economic development. They have occurred alongside one of the most sweeping transformations in human society: the transition from predominantly rural to increasingly urban societies, in which internal migration, particularly from rural to urban areas, has played a major role. Globally, internal migration is a significantly larger phenomenon than international migration, and an essential component of the process of economic development.
Today, international migration is the subject of great concern and attention. Between 1990 and 2015, the number of international migrants increased from 153 million to 248 million. As many as 25 million of these are refugees who left their countries because of conf licts and crises. In light of this, high-income destination countries increasingly perceive international migration as a major challenge. However, to put things into perspective it should be noted that as a share of the world population the increase in international migration between 1990 and 2015 was only from 2.9 percent to 3.3 percent. Further, this migration follows multiple trajectories, not just that which leads from developing to developed countries.
Based on 2015 data, more international migrants have moved between developing countries (38 percent of the total stock of international migrants) than from a developing to a developed country (35 percent). In particular, migration between regions and subregions is a key component of international migration patterns. Subregional migration is particularly important in Western Africa and Western Asia, while migration within the same continent is dominant in South Asia and Middle Africa. Furthermore, the most publicized migrants – i.e. international refugees – are hosted nearly entirely by developing countries (with 85 percent of the stock of refugees).
RURAL MIGRATION IS CENTRAL TO ECONOMIC TRANSFORMATIONMigration from, to and between rural areas is an important component of both international and internal migration. The reallocation of labour from less productive to more productive sectors of the economy is an integral component of economic development. Migration from rural areas is thus part of the process of structural transformation of economies in which the importance of agriculture for income and employment generation declines relative to other sectors. This process leads to a decrease in
| xiii |

EXECUTIVE SUMMARY
demand for labour in some rural areas, but an increase in others. On the one hand, transformations from agriculture-based to industry- and service-based economies have led to large-scale rural–urban migration, including across borders. Based on evidence from a set of countries on the origins of migrants, a significant share of international migrants are found to have come from rural areas. On the other hand, as part of this process, rural areas have also become destinations for many international migrants – often, but not only, in high-income destination countries that need migrants to meet demand for labour in agriculture.
The large f lows of internal migration described in this report suggest that reallocation of labour resources in many developing countries is contributing to economic transformation and development. Nevertheless, internal migration will continue to be closely interlinked with international migration as potential migrants are particularly attracted to opportunities in countries with higher levels of income and overall development. While this can contribute to improving the prospects of international migrants, there are also negative aspects to this process. Although they may send back remittances and other benefits, migrants essentially represent a productive resource that is being diverted out of their respective country or area of origin.
Different forms of rural migration play different roles in the process of structural economic transformation. In particular, the duration of migration has different implications in terms of impacts at origin and destination. Circular migration involves repeated moves between an area of origin and one or more destination areas. Also common in rural areas is seasonal migration, i.e. short-term migration during specific seasons and linked to agricultural production cycles. Migration between rural areas is still an important phenomenon in countries at earlier stages of development. Population trends
in these countries’ rural areas – in particular of growing numbers of rural youth – will continue to be a major driving force behind rural migration and will present significant challenges, particularly in areas that face increasing population pressure.
Not all rural migration is linked to structural transformation processes. Many migrants are refugees or internally displaced people, which is challenging for areas of origin and of destination. Over the last ten years, the world has witnessed a sharp rise in crises due to armed conf licts or acute climate events, causing an increase in the number of refugees and internally displaced people. Worldwide in 2016, there were 66 million forcibly displaced people as a result of persecution, conf lict, generalized violence and human rights violations, of which 40 million were internally displaced persons (IDPs), with the remainder being refugees and asylum seekers. Around nine out of ten refugees are hosted by developing countries, but rural populations often bear the brunt of the impact. Globally at least one-third of the refugee population is located in rural areas, with the share exceeding 80 percent in the case of sub-Saharan Africa.
INTERNAL MIGRATION IS CHARACTERIZED BY THE MOVEMENT OF PEOPLE FROM AND TO RURAL AREAS, BUT IS ALSO LINKED TO INTERNATIONAL MIGRATIONAs a whole, internal migration is a significantly larger phenomenon than international migration and exhibits different patterns across countries. Although comprehensive global estimates are diff icult to come by due to both scarcity of data and varying definitions of internal migration, by one estimate the number of internal lifetime (having lived in an area other than their birthplace) migrants in 2005 was four times the number of international lifetime migrants. This estimate is based on major administrative units, but when moves between smaller units are considered the number increases further. At a
| xiv |

very conservative estimate, the stock of lifetime internal migrants in developing countries alone – accounting for moves between smaller units – is over 1 billion people.
Across countries evaluated in Demographic and Health Surveys of the United States Agency for International Development, more than half the population originating in rural areas have migrated internally at least once. Rural-to-urban migration f lows are larger than urban-to-rural, implying that net rural–urban migration is the norm. However, a larger share of people migrate between rural areas than from rural to urban areas. Migration between rural areas is particularly important in rural-dominated societies such as in sub-Saharan Africa and parts of Asia, while rural–urban and urban–urban migration is most common in more urbanized societies such as in Latin America and the Caribbean, and in the Near East and North Africa. Significant portions of the population originating in both rural and urban areas have moved more than once – ranging between 15 and 25 percent of the total population in most countries. Of those who have moved from rural to urban areas, a certain portion return to rural areas at some point. Such return migration is particularly prevalent in countries in relatively early stages of development.
Internal migration is often linked to international migration, frequently through a step-wise process. For instance, a migrant may initially move internally and later on migrate internationally, or vice versa. The interplay between international and internal migration is important for understanding migration dynamics. Data suggest that people who have already undertaken internal migration are more likely to migrate internationally. Indeed, across all country income groups, the share of people planning to migrate internationally is higher for those who have moved internally in the last f ive years compared to those who have not.
THE CHALLENGES AND OPPORTUNITIES OF MIGRATION DEPEND ON COUNTRIES’ CONTEXTS AND DEVELOPMENT PATHS Rural migration assumes various forms and presents different challenges and opportunities for migrants and societies. This is seen across countries with different levels of development, governance, agricultural resource availability, and rural demographic structures. This report uses a broad categorization of countries in terms of rural migration, which ref lect different migration challenges and drivers. Although some countries may have characteristics pertaining to two or more categories, the following five broad profiles are identif ied:
1. fragile and conf lict-affected states; 2. countries facing a rural youth employment
challenge in fragile contexts; 3. countries with development momentum,
allowing them to generate employment for youth;
4. transitioning countries with economic momentum, advanced urbanization and demographic transitions; and
5. aspirational destinations with high levels of development.
This report describes the unique challenges and opportunities for each category and how different policy areas need to be prioritized. In fragile contexts such as prolonged conf licts and protracted crises, people may be forced to move for reasons of safety and security, presenting enormous challenges for areas of origin and destination. Countries where rural youth employment is a challenge have large and/or growing populations of rural youth, without the development momentum to absorb added labour market entrants. This is typical in sub-Saharan Africa and South Asia, where urbanization has not been matched by comparable growth in manufacturing or modern service sectors, and where people exiting low-productivity agriculture move mostly into low-productivity informal
| xv |

EXECUTIVE SUMMARY
services, usually in urban areas. This challenge is made more acute by the prediction that in the decades ahead, sub-Saharan Africa in particular will face large increases in its rural youth population. Although facing a similar challenge of large numbers of rural youth, countries with development momentum can generate employment and use the demographic profile to their advantage. Transitioning countries have made major advances towards becoming aspirational destinations – that is, poles of attraction for international migration.
For countries in the last category – aspirational destinations – the primary policy issue has increasingly revolved around the growing numbers of international migrants. Among policy-makers, an apparent solution is to stem migration f lows by promoting development in countries of origin. While this development is a desirable objective in its own right, it is important to point out that there is no evidence to support the notion that development within countries will necessarily lead to declining f lows of international emigration in the short and medium term – in fact the opposite may actually be the case. The evidence suggests that for low- and lower-middle-income countries, development and rising incomes initially lead to increased levels of emigration; only when countries reach upper-middle-income status do levels of emigration tend to decline. This process will normally continue over decades. Development should therefore be considered as desirable in its own right, and not merely as a means of curbing emigration.
For most types of countries, and certainly for those in the intermediate categories, the type of development they undertake will dictate which rural–urban linkages are relevant for their migration f lows and patterns. A territorial development approach that focuses on these linkages can help offer solutions to some of the challenges. Improved territorial planning of metropolitan areas, small cities and towns,
together with improved connective infrastructure, can dampen rates of out-migration to overburdened large cities or to other countries by generating opportunities in closer proximity to rural areas. Where local jobs are lacking, investments in connective infrastructure specific to the food system – such as warehousing, cold storage and wholesale markets – can generate employment in both agriculture and the non-farm economy. In this way the needs of potential migrants can be met before they decide to leave. Where rural people are attracted by more prosperous conditions in urban centres, investments in “agglomeration” services – such as education, health, communication and leisure facilities – in small cities and towns distributed over a territory and in proximity to rural areas, can also reduce rates of out-migration to overburdened larger cities.
UNDERSTANDING MIGRATION DRIVERS IS CRUCIAL FOR THE DEVELOPMENT OF STRATEGIES THAT LEAD TO IMPROVED LIVELIHOODS AND INCLUSIVE ECONOMIC TRANSFORMATION The drivers of migration can be defined as the forces that induce and perpetuate migration f lows, which may operate at different levels. In the case of voluntary migration, the incentive is created by differentials in conditions between areas of origin and potential destination – i.e. macrofactors of migration. This might involve, for instance, differences in terms of employment opportunities, education facilities and public services. However, migration decisions are also affected by a set of intermediate conditioning factors that may either constrain or facilitate moving. Constraints include travel distances and costs as well as legal constraints, while facilitating factors can include social networks or recruitment agencies. The decision to migrate is ultimately a consequence of people’s agency and depends on the characteristics of prospective migrants and their household – i.e. microfactors of migration. For example, migrants are generally
| xvi |
younger and more educated than non-migrants, and in possession of more financial resources. Migration decisions will also differ due to gender disparities among countries in terms of mobility constraints and access to resources.
Migration is driven by unequal opportunities. Rural migration is primarily driven by differentials in employment opportunities and in access to public services. Productivity differences and corresponding income gaps between agriculture and other sectors of the economy, such as manufacturing and services, constitute one driver of rural–urban migration. In general, productivity differences and differences in wages and employment opportunities between rural and urban areas and between different rural areas drive rural–urban and rural–rural migration respectively. Also, in rural areas of developing countries a lack of social services and infrastructure often create an incentive to leave. Environmental differentials can affect rural migration f lows, inter alia, through their impacts on agricultural productivity. Demographic factors are also a key driver of migration, in particular as they interact with other drivers, such as limited natural resources. In countries with large numbers of rural youth, unless adequate employment opportunities are created in or in proximity to rural areas, this lack and the scarcity of farmland are likely to induce vast numbers of these youth to seek opportunities in cities and abroad. Land scarcity is projected to increase in sub-Saharan Africa and in the Near East and North Africa regions, while in South Asia, where the increase is projected to be smaller, levels of land scarcity are already extreme.
Understanding the conditioning factors affecting migration is key to identifying potential interventions. Various factors can constrain rural migration. The costs make it an unviable option for many, particularly for far-away destinations. These costs are f inancial as well as psychological, social and cultural. Yet migration can also be useful as a risk-management strategy for rural households, as it
reduces their dependence on uncertain agricultural incomes and diversif ies their sources of livelihood. Social networks of migrants in destination areas can play a role in facilitating this rural migration; they can help migrants mitigate social and cultural costs and provide them with necessary information. This can also be ensured by recruitment agencies, both formal and informal, to assist migrants in f inding jobs and navigating bureaucratic procedures.
Legal frameworks and public policies can encourage or discourage migration through a variety of channels. From a legal standpoint, weak land rights are a factor that can dissuade potential migrants from leaving rural areas. Similarly, labour laws – such as setting a minimum wage – and anti-discrimination laws may affect migration and the choice of destination. On the policy side, foremost for agriculture are those that aim to boost the adoption of mechanization as a tool to promote agricultural productivity, which often frees up labour to move into other sectors. To compensate for this, promoting agri-territorial development – which aims to expand food systems and create non-farm employment in rural areas – may reduce rural out-migration by offering people opportunities to improve their incomes and diversify their livelihoods close to their homes. However, these policies can also increase migration by improving rural incomes and thus helping many prospective migrants to overcome financial constraints.
In this context, social and employment policies affect migration but can have different impacts according to location and circumstances. Social protection can deter migration when access is conditional on physical presence in rural areas. On the other hand, if beneficiaries are constrained by a lack of funds to cover migration costs, unconditional cash transfers could help overcome this and allow them to migrate. Credit policies can also affect migration for households facing financial or liquidity constraints.
| xvii |

EXECUTIVE SUMMARY
MIGRATION CAN HAVE A VARIETY OF IMPACTS ON RURAL AREAS Migration in its different forms has impacts both on areas of origin and of destination. Rural migration, in particular out-migration, can have profound effects on rural development, food security and nutrition, and poverty. The impacts of migration are conveyed through three main channels. First, the fact in itself that a person has left has an impact on the sending household – due to the loss of labour and resulting changes in household composition – as well as on rural labour markets. Second, the remittances sent back by migrants can affect consumption patterns and livelihoods in rural communities of origin. Third, there may be non-monetary transfers as well – referred to as “social” remittances – such as ideas, skills and new social patterns brought back or transmitted by migrants. The impacts of rural out-migration can be felt at different levels. There is an immediate impact on the sending household, but there are ripple effects that go beyond, affecting both the rural communities of origin and societies at large. Impacts on households and societies can be negative or positive, depending on the form of migration, the characteristics of the migrants, and the migration context.
Impacts of migration on households of origin are significant but mixed. Coping with the reduction in family labour can be challenging for farming households if the labour cannot be replaced. The loss of family labour can negatively affect levels of household farm and non-farm production, and may encourage households engaged in agriculture to shift production towards less labour-intensive crops and activities. At the same time, migrant remittances can help cash-constrained households invest in new technologies. By diversify ing income, remittances provide an insurance against risk and can encourage households to adopt higher-return production technologies in agriculture or to launch non-farm business activ ities. Ultimately, the impact of migration on sending households depends on the
net effect of the loss of family labour and the positive impacts of receiving remittances. The actual net effect is seen to differ according to location and circumstances.
Migration can also lead to changes in the intra-household division of labour along gender and generational lines. Often male out-migration leads to an increased role of women in agriculture in terms of greater workloads, but also of potentially more decision-making power. However, this “feminization” of agriculture is not universally observed and in many societies female out-migration is more prevalent than male out-migration. In addition to affecting productive activ ities, out-migration from rural areas often leads to improved food security, nutrition and health for household members. It can also allow households to invest more in the education of children, to build wealth and to invest in assets.
Indirect impacts of rural migration can spread beyond households of origin to communities and societies at large. The positive impacts of out-migration can spread to entire rural communities, as out-migration pushes up local wages and remittances are spent on local goods and invested in local economic activ ities, leading to increased incomes and employment. These spill-over effects are likely to be larger than the direct effects on sending households. Migrants can also contribute to broader development in rural communities through monetary remittances and involvement in community development projects. Return migrants also contribute positively to local communities through their often high economic performance.
At the national level, migration can promote the broader economic development of regions and countries as well as structural change in economies, leading to increased incomes. Labour scarcity caused by out-migration can encourage technological improvements in agriculture. Likewise, out-migration can lead to increased land consolidation and enable economies of scale
| xviii |

in agriculture. The shift of labour from agriculture to other high income-generating activities in the non-farm sector can contribute to productivity growth at the national level. International diaspora communities can facilitate trade by creating trade linkages between their communities and their countries of origin. However, inf lows of remittances can also have negative effects on exports – including agricultural exports – when they are high relative to GDP, and risk leading to a large appreciation of the exchange to the detriment of export competitiveness.
Forced migration due to protracted crises disrupts rural livelihoods and threatens food security and nutrition in areas of both origin and destination. Mass displacements of people and the associated loss of assets can severely impact economic development, including rural development, not only in the country or location from which people f lee but also in host countries – most of which are developing countries – and locations. In most protracted crisis situations the majority of the population is rural and largely dependent on agriculture, livestock, f isheries and aquaculture for their livelihoods. Protracted crises disrupt food systems and rural livelihoods in communities of origin. The impacts are felt across the entire food value chain, from production to marketing. However, it can be diff icult to disentangle the impacts of migration per se from those of the crises that led people to move.
These large inf luxes of refugees and IDPs can create serious challenges for host countries and locations. They can, inter alia, lead to strains on local food markets and limit basic services. Nonetheless, there is evidence that integrating refugees in local economies can be mutually beneficial. Well-managed inf lows of displaced people can have positive effects on local economies by fil l ing labour shortages, promoting knowledge diffusion and boosting demand for local goods and services.
Immigrants play a crucial role in supporting agriculture and rural areas in developed destination countries. For many developed countries experiencing rural depopulation, international migrants can contribute to the development of rural areas by filling labour shortages in agriculture. In North America and Europe for instance, foreign labour constitutes the backbone of agricultural production. However, protection of labour rights and the working conditions of migrants are often poor. In many rural areas agricultural labourers often work informally, earn less than legal salaries and are subject to exploitation. Providing decent working conditions for migrant agricultural workers can ensure that the migration experience is positive both for migrants and their host countries.
MAKING MIGRATION WORK FOR ALL As migration is a multidimensional phenomenon, it is closely linked to a wide set of SDGs. In the words of the UN Secretary-General in his report Making migration work for all, we must constantly return to the SDGs and remind ourselves of the links between migration and our broader goals of eradicating poverty and fighting against inequality, including gender inequalities.
Policies must aim to harness the benefits of rural migration while reducing the negative impacts. The vastly unequal distribution of opportunities in the world – both within and between countries – is bound to continue driving migration, internal and international. Rural migration will remain a large component of these migration f lows. The differences in opportunities also imply that migration has the potential to contribute to economic, social and human development. Gradually shifting labour out of low-productivity employment, often in rural areas, and into more productive sectors, mostly in urban areas, offers huge potential for economic gains. However, migration also involves costs for the migrants themselves, as well as for areas or communities of destination and origin.
| xix |
EXECUTIVE SUMMARY
The challenge for policy-makers is to maximize the benefits of rural migration while minimizing the negative effects. As much as possible, migration must be a voluntary decision made by migrants, based on real and informed choices. In terms of rural migration, this involves creating attractive rural livelihood opportunities. It also requires removing constraints to rural migration and facilitating regular migration for those who decide to move, as well as developing human capital in rural areas through training and skills development, allowing prospective migrants to take advantage of opportunities. Furthermore, this involves preventing crises that lead to forced migration and limiting the negative impacts on migrants and host communities.
Countries at different levels of development face different challenges in relation to rural migration. Many different policies affect rural migration through their impacts on agriculture, rural development, food insecurity and poverty. Countries at different levels of development face different challenges, and each category of countries has its own policy priorities, although several are relevant across multiple categories.
} Countries with development momentum, although having a large pool of youth in rural areas, may need to focus on promoting employment opportunities in agricultural value chains while encouraging the development of regional urban centres to provide opportunities for rural residents closer to their areas of residence. Supporting human capital development in rural areas will prepare rural youth to take advantage of new opportunities. It is also important to facilitate migration by providing information on opportunities available elsewhere and assistance to prospective migrants.
} Countries facing a rural youth employment challenge in fragile contexts, which do not have the development momentum to absorb labour market entrants in rural areas, need to promote
rural livelihoods and provide options for youth in rural areas, while supporting productive capacity in areas subject to out-migration. When emerging from crisis situations they need to provide support to returnees and communities of origin.
} Fragile and conf lict-affected states, often in situations of protracted crisis, must focus on addressing the needs of migrants and host communities while fostering preventive measures. Agriculture must be a priority, as rural areas tend to be the most affected and many refugees are found in rural areas.
} Transitioning countries, which are at an intermediate level of development, are already urbanizing and have undergone a demographic transition due to lower birth rates. They will want to advance some of the policies suggested in the previous points for employment generation. However, they may need to focus particularly on increasing the mobility in labour markets by removing barriers to rural migration, and develop education and services in rural areas before depopulation takes hold.
} Aspirational destinations must address challenges posed by the poor integration of migrants and lack of social cohesion, which can limit the success and thus the contributions of immigrants. These countries need to protect immigrants’ rights and promote their social and economic integration. International cooperation instruments with countries of origin, such as bilateral agreements promoting temporary or seasonal migration, can facilitate this process.
Country contexts will change over time. No country is just a host, transit or destination country, but rather two or three at the same time. Just as European countries have become destinations for migration after having been a long-time source of migration, emerging countries are likely to become regional hubs and receive more immigrants as they advance in their development, particularly in light of the rapidly increasing populations in many developing
| xx |

countries, the limits to the absorption capacity of developed countries, and the importance of intraregional migration. As income differentials between developing countries widen, the successful ones will attract migrants from less advanced neighbouring countries, which will have implications for national and regional development strategies.
ENHANCING THE DEVELOPMENT POTENTIAL OF MIGRATION It is important to enhance the contributions migrants make to the development of their rural areas of origin through remittances and in other ways. Several policy areas can contribute, including facilitating and reducing the cost of sending remittances and promoting their investment in rural areas, for example by providing matching funds. The facilitation of circular and seasonal migration, both internal
and international, can boost incomes in rural areas. The contribution of return migrants to rural areas can also be enhanced by providing a conducive environment for business and investment and supporting migrants’ integration into local labour markets. Finally, it is important to ensure coherence and cooperation on policies related to migration across sectors, among different actors and levels of government, as well as between countries. In this respect the Global Compacts on migration and refugees, can play a key role.
Rural migration will continue to be an essential element of processes of economic and social development. Developing clear and coherent policies, both for migration and for rural development more broadly, is essential for a successful process of development that can benefit migrants, their areas of origin and their areas of destination.
| xxi |

KABALA TOWN, SIERRA LEONEMembers of Koinadugu Women’s Vegetable Cooperative on the move – mobility in Africa contributes to the progress of communities and societies.©FAO/Sebastian Liste

Key messages
1Human mobility has always been part of the process of economic and social
development and has contributed to the progress of communities and societies.
2 Rural migration must be thought of within the context of rural
development, demographics, and governance, which create incentives and affect decisions to migrate.
3 Migration decisions lie along a continuum: from voluntary migration –
driven by the search for opportunities – to forced migration and displacement, generally driven by conflicts and crises.
4 Benefits and challenges associated with migration will depend on where
on the “continuum” prospective migrants find themselves, and on how opportunities are distributed across sectors, territories and countries.
5 Each country needs to prioritize different policy areas – accounting for
the benefits and costs of migration – depending on its context and its development objectives.
6 Analysis of rural migration is hampered by the relative scarcity of data.
Integrated data collection efforts in censuses and migration surveys are needed to obtain consistent and comparable data on both internal and international migration.
CHAPTER 1RURAL
MIGRATION AND DEVELOPMENT:
LAYING THE GROUNDWORK

MIGRATION: A REFLECTION OF EVOLVING SOCIETIES Migration is not a new phenomenon. The movement of populations in various forms has been part and parcel of the history of humanity. Migration has often been the cause or consequence (or both) of conf lict and violence. Large migratory f lows have also been driven by natural disasters, adverse climatic and weather events, and natural resource constraints. However, there is also a fundamentally positive side to migration. Human mobility has always been an essential component of economic, social and human development and has contributed to the progress of communities and societies. As phrased by the United Nations (UN) Secretary-General in his report to the General Assembly Making migration work for all: “Migration is an engine of economic growth, innovation and sustainable development. It allows millions of people to seek new opportunities each year …”.1 For their part, the United Nations Sustainable Development Goals (SDGs) recognize migration as one of the means to ensuring the reduction of inequality within and among countries, in accordance with SDG 10.
As economies undergo transformation, the movement of people in search of better opportunities within and between countries is inevitable. People’s mobility is often fuelled by the substantial inequalities in opportunities that persist worldwide within and between countries. Despite global improvements in the 1960s and 1970s in the distribution of income and opportunities, inequalities have been on the rise again.2 Migration, being driven by these inequalities, can be an opportunity to
reduce them. However, it can also represent a challenge. For example, immigrants may be viewed either favourably as a new workforce or as an unwanted burden on society, depending on whether they can be absorbed into the socio-economic system of their destination as quickly as they arrive. Migration also represents a challenge for those who migrate – especially in terms of vulnerability at the different stages of the migration process – and for the families left behind.
Migration from, to or between rural areas is part of the process of structural transformation of economies, in which the relative role of agriculture in terms of income generation and employment gradually declines and labour is transferred to other sectors of the economy (see Box 1). Out-migration (i.e. migrating to another community, region or country) from rural areas can also bring benefits to those areas themselves: either through the transfer of knowledge, skills and technology by returning migrants, or through remittances to migrants’ areas of origin. This can enhance human capital and support development of farm and off-farm activities as well as improve resilience to shocks. However, if out-migration occurs too rapidly, it can lead instead to a decline in agricultural production and productivity due to loss of labour, skills and knowledge and, in many cases, to the absence of labour-saving technologies.
It is clear that migrants move, internally and internationally, to seek better opportunities inside or outside agriculture. The nature and the pace of structural transformations at both origin and destination shape the trends that lead people to exit agriculture, by allocating and reallocating resources and skills across spaces and sectors. n
CHAPTER 1
RURAL MIGRATION AND DEVELOPMENT: LAYING THE GROUNDWORK
| 2 |
THE STATE OF FOOD AND AGRICULTURE 2018
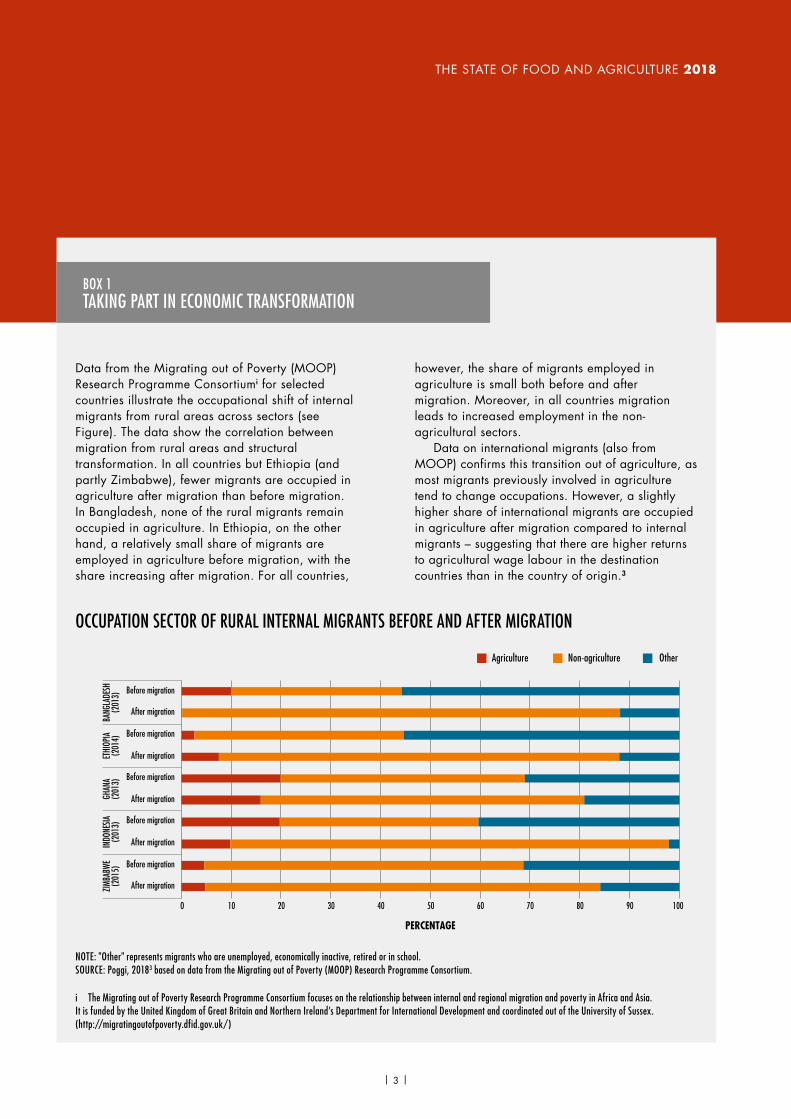
Data from the Migrating out of Poverty (MOOP) Research Programme Consortiumi for selected countries illustrate the occupational shift of internal migrants from rural areas across sectors (see Figure). The data show the correlation between migration from rural areas and structural transformation. In all countries but Ethiopia (and partly Zimbabwe), fewer migrants are occupied in agriculture after migration than before migration. In Bangladesh, none of the rural migrants remain occupied in agriculture. In Ethiopia, on the other hand, a relatively small share of migrants are employed in agriculture before migration, with the share increasing after migration. For all countries,
BOX 1TAKING PART IN ECONOMIC TRANSFORMATION
however, the share of migrants employed in agriculture is small both before and after migration. Moreover, in all countries migration leads to increased employment in the non-agricultural sectors.
Data on international migrants (also from MOOP) confirms this transition out of agriculture, as most migrants previously involved in agriculture tend to change occupations. However, a slightly higher share of international migrants are occupied in agriculture after migration compared to internal migrants – suggesting that there are higher returns to agricultural wage labour in the destination countries than in the country of origin.3
0 10 20 30 40 50 60 70 80 90 100
After migration
Before migration
After migration
Before migration
After migration
Before migration
After migration
Before migration
After migration
Before migration
ZIMB
ABWE
(201
5)ET
HIOP
IA(2
014)
GHAN
A(2
013)
BANG
LADE
SH(2
013)
INDO
NESIA
(201
3)
PERCENTAGE
Agriculture Non-agriculture Other
OCCUPATION SECTOR OF RURAL INTERNAL MIGRANTS BEFORE AND AFTER MIGRATION
NOTE: "Other" represents migrants who are unemployed, economically inactive, retired or in school.SOURCE: Poggi, 20183 based on data from the Migrating out of Poverty (MOOP) Research Programme Consortium.
i The Migrating out of Poverty Research Programme Consortium focuses on the relationship between internal and regional migration and poverty in Africa and Asia. It is funded by the United Kingdom of Great Britain and Northern Ireland’s Department for International Development and coordinated out of the University of Sussex. (http://migratingoutofpoverty.dfid.gov.uk/)
| 3 |

CHAPTER 1 RURAL MIGRATION AND DEVELOPMENT: LAYING THE GROUNDWORK
MIGRATION IN CHANGING CONTEXTS In the last century, international migration f lows have changed dramatically. At the beginning of the twentieth century, Europe was a major source of migration, with people moving to the Americas, Australasia, and Central Asia. Another considerable migration f low was from Southern China into Southeast Asia. Today’s Europe is mostly a destination for migrants from Africa, Asia, and the Americas, as well as a locus for major internal migration f lows, while migration to North America originates mostly in Latin America and Asia. As development advanced in Asia, some countries – such as Japan, Malaysia and the Republic of Korea – transitioned to being destination countries. The same has happened for oil-rich countries in the Near East.
The shifts in international migration need to be understood in the broader context of economic development. These changes have happened alongside one of the most sweeping transformations in human history: the transition from predominantly rural to increasingly urban societies, in which internal migration, particularly from rural to urban areas, has played a major role.4
To appreciate the relative magnitude of different migration phenomena, in 2015 the number of people liv ing in a country different from their country of birth surpassed 244 million,5 while there were roughly 65 million forcibly displaced persons, including over 21 million refugees, 3 million asylum seekers and over 40 million IDPs.6 A much larger number of people – by one estimate 763 million people in 2005 (more than 11 percent of the world population in 2005) – have migrated within their own country between major administrative units.7 The number of people who have migrated within and between rural and urban areas may be larger if one takes into account migration between minor administrative units inside each major unit. Given the magnitude of the combined international and internal migration as a share of the global population, the migration process clearly plays an important role in the evolution of economic systems. Furthermore, the social, cultural and political
implications of these massive f lows of people – between urban and rural areas, between different rural areas and between countries – have been momentous, in particular for the broader transformation of societies.
In the past, transformations from agriculture-based to industry- and service-based economies have led to large-scale migration from rural to urban areas. In East and Southeast Asia, due to considerable improvements in agricultural productivity, since the 1960s rural–urban migration has contributed to the rural share of the total population falling from 70 percent to about 50 percent. The main drivers of this out-migration have been faster growth and higher incomes in manufacturing and associated services. Productivity increases across all sectors have generated positive dynamics of rural and structural transformation, which while leading to rural–urban migration, have also resulted in major reductions in overall poverty.9
However, in other contexts rural–urban migration has not been accompanied by a comparatively strong industrialization process. In the case of many countries in sub-Saharan Africa and South Asia, those migrating from rural areas to cities have mostly moved into low-productivity informal sectors such as retail trade and services, rather than the industrial sector.9-11 Lack of industrial development and associated employment opportunities in urban areas has further restrained rural–urban migration, as those who migrate from rural to urban areas are more likely to join the already growing urban poor.9 Not without reason, rural–rural migration tends to constitute the dominant form of migration in these two regions.
A lack of industrial development has yielded similar results in the Near East and North Africa, especially in countries with relatively large agricultural bases, such as Egypt and Morocco. Here again, people leaving agriculture are not moving into industry but into low-productivity informal services or the public sector, frequently while continuing to farm as a part-time activity.12-14 While this helps rural households to deal with the seasonality of farm employment, it does not lead to complete labour transition out of agriculture nor to labour productivity gains.
| 4 |

THE STATE OF FOOD AND AGRICULTURE 2018
Consequently, improvements in household incomes often remain modest and vulnerable.
In the decades ahead, Africa in particular will face large increases in its youth population and the associated challenge of generating jobs. Between 2015 and 2030, the combined population of Africa and Asia is projected to increase from 5.6 billion to 6.6 billion. In the same period, the number of people aged 15–24 is expected to grow by about 100 million to 1.3 billion worldwide.15 Almost all of that increase will take place in sub-Saharan Africa, and particularly in rural areas. With unprecedented growth in their youth populations, many low-income countries face the challenge of providing decent employment for millions of new entrants in their labour markets. Although educational opportunities and improved access to services are also important drivers, migration is often spurred by the search for better jobs and income opportunities.9 Workers who exit agriculture but are unable to f ind jobs in the local non-farm economy must seek employment elsewhere, leading to seasonal or permanent migration.
Today there is growing global attention to the causes and effects of migration, as well as the way in which it occurs. Most of the focus is on international migration, which is increasingly perceived as a major challenge by destination countries, with little consideration given to its potential benefits. The perceived solution among policy-makers is to stem migration f lows by providing development opportunities in the countries of origin. However, the expectation that development will reduce migration may not be realistic, at least in the short and medium term (Box 2). Rather, it is important to consider development as an objective in its own right. A more comprehensive approach that accounts for both benefits and costs of migration is ref lected in SDG 10 to “Facilitate orderly, safe, regular and responsible migration and mobility of people, including through the implementation of planned and well-managed migration policies”. Similar concerns underlie the New York Declaration for Refugees and Migrants i adopted by the UN General Assembly on 19 September 2016, which
i New York Declaration for Refugees and Migrants, United Nations General Assembly Resolution 71/1.
launched the process of intergovernmental negotiations on a global compact for safe, orderly and regular migration and the development of a global compact on refugees.
In addition to Goal 10, the SDGs contain several migration-related targets and indicators that cover issues such as emigration of health professionals, scholarships to study abroad, rights of migrant workers, human trafficking, remittances, and disaggregation of national data by migratory status. At the same time, as migration is a multi-dimensional phenomenon it has an effect on and is affected by all areas of governance and is therefore relevant for all SDGs. In the words of the UN Secretary-General in his report Making migration work for all, we must constantly return to the SDGs and remind ourselves of the links between migration and our broader goals of eradicating poverty and fighting against inequality, including gender inequalities. n
MIGRATION CONCEPTS AND DRIVERS: FROM TOTALLY VOLUNTARY TO TOTALLY FORCED MIGRATIONMigration is not easily defined, as dimensions of time and distance are critical to the concept. There is no universal agreement on what distance someone must move, or for how long, to be considered a migrant. Duration and distance are among the most important dimensions not only to define migration, but also to measure it. Any changes in either dimension affect the estimates of migration.
The International Organization for Migration (IOM) describes migration as “the movement of a person or a group of persons, either across an international border, or within a State. It is a population movement, encompassing any kind of movement of people, whatever its length, composition and causes; it includes migration of refugees, displaced persons, economic migrants, and persons moving for other purposes, including family reunification.”19 »
| 5 |

CHAPTER 1 RURAL MIGRATION AND DEVELOPMENT: LAYING THE GROUNDWORK
It is a commonly held assumption among policymakers in high-income countries that economic development and rising incomes in developing countries will deter international migration. An implication is that, through official development assistance and trade policies that support development, high-income countries can supposedly contribute to reducing migratory flows from recipient countries. The fundamental question is: does economic development in poor countries lead to less emigration?
A significant body of theoretical and empirical literature shows that this is not necessarily the case, and that development often leads to more, not less, international migration. Clemens reviews the existing literature on the relationship between development and emigration – often referred to as “the mobility transition” – and presents new empirical evidence.16 He suggests that over the course of the mobility transition, emigration generally rises with economic development until countries reach upper-middle-income status, and only thereafter falls.
Clemens presents and analyses cross-sectional data on stocks of emigrants and emigration flows from both the World Bank and the UN, together with data on levels of per capita real income from the World Bank, for a large number of countries for different periods. The data shows a clear inverted-U pattern across countries in the relationship between per capita income levels and emigration. For low-income and lower-middle-income countries, higher levels of per capita income are associated with both higher numbers of emigrants and larger flows of emigration relative to the size of the population. At income levels of around USD 6 000 to 8 000 (in purchasing power parity) the relationship changes. For countries above this level – upper-middle-income and high-income countries – higher levels of per capita income are associated with less emigration. But even countries at the highest income levels do not systematically show emigration rates lower than those of the poorest countries.
The analysis by Clemens is in line with previous analysis conducted by De Haas on the development drivers of international migration.17 The author empirically analyses the relationship between migration
and net migration flows (both relative to population size) and a set of development indicators, including gross domestic product (GDP) per capita and the Human Development Index (HDI). Both indicators are associated initially with increasing and subsequently with declining levels of emigration, corresponding to the inverted U-curve relationship. Both indicators also have an overall positive effect on immigration. The author concludes that “the robust outcomes of the analyses strongly suggest that capability- and aspiration-increasing human development is initially associated with generally higher levels of emigration and immigration.”17
The implication is that as long as inequalities and income gaps between geographical areas persist, this will lead to continuous migration from poorer regions to higher-income countries. Development in poor countries will help incomes grow, enabling people exiting poverty to cover migration costs; therefore these countries will initially see rising levels of emigration. Eventually, once countries reach a certain level of development and are able to bridge the income gaps, migration levels will start declining again. However, for poor countries the whole process will span several decades at best, and even when they reach high-income status, migration levels may remain above initial levels.
The analysis of both Clemens and De Haas is based on cross-sectional data, as time-series data needed for capturing similar patterns do not exist. Caution should therefore be used in concluding definitively that all countries have had or will follow the described path. However, the notion that development per se will reduce migration is not borne out by empirical evidence.
A recent paper reviews the evidence on the relationship between foreign development aid and emigration. It concludes that the capacity of development assistance to deter migration is limited at best and that successful development in almost all formerly-poor countries has resulted in increased emigration. It suggests that donors could achieve more impact by leveraging development aid to shape migration for mutual benefit.18
BOX 2DOES DEVELOPMENT REDUCE INTERNATIONAL MIGRATION?
| 6 |

THE STATE OF FOOD AND AGRICULTURE 2018
However, the term “migrant”, has more nuanced meanings. As reported in the IOM glossary, “The United Nations defines a migrant as an individual who has resided in a foreign country for more than one year irrespective of the causes, voluntary or involuntary, and the means, regular or irregular, used to migrate”.19 This definition has two major shortcomings: it ignores internal migrants (distance dimension), and it does not recognize short-term or seasonal migration f lows (time dimension)19 (see Box 7 in Chapter 2). In the end, as for migration, “no universally accepted definition for ‘migrant’ exists” as stated by the IOM. “The term migrant was usually understood to cover all cases where the decision to migrate was taken freely by the individual concerned for reasons of ‘personal convenience’ and without intervention of an external compelling factor; it therefore applied to persons and family members moving to another country or region to better their material or social conditions and improve the prospects for themselves or their family.”19
In this report, when migration occurs as a consequence of free decisions, it is referred to as “voluntary migration”, as distinct from “forced migration”, which usually follows human displacements due to conf licts, natural disasters and human-made crises. The IOM defines forced migration as “a migratory movement in which an element of coercion exists, including threats to life and livelihood, whether arising from natural or [hu]man-made causes (e.g. movements of refugees and internally displaced persons as well as people displaced by natural or environmental disasters, chemical or nuclear disasters, famine, or development projects)”.20 However, this does not mean that there is a dichotomy between forced migration on the one hand, and “voluntary” migration on the other.
People may decide to migrate for a number of di f ferent reasons. Their decisions are based on the interact ion of di f ferent factors, some purely economic and others not. Under normal condit ions, migrat ion occurs in search of better employment opportunit ies, higher-earning jobs, and/or more and better publ ic serv ices, for example those related to educat ion or health. However, in extremely f rag i le contexts, including prolonged conf l icts and protracted cr ises, people may
move pr imari ly for reasons of safety and secur ity. In real it y migrat ion decisions are complex, and choices are rarely made without constraint. For instance, when l ivel ihoods are threatened by slow-onset events such as cl imate change and env ironmental degradat ion, the dist inct ion between forced and voluntary migrat ion may not be clear-cut. The term “surv ival migrat ion” has sometimes been used to refer to migrat ion induced by condit ions of extreme economic di f f icult ies. The important point is that in real it y, migrat ion decisions are complex and depend on mult iple factors. They are best v iewed as ly ing along a spectrum in which elements of choice and coercion intermingle and can be more or less predominant depending on circumstances and context.
Figure 1 depicts the “spectrum” of migration decisions that lie between two extreme cases of totally voluntary or totally forced migration. Totally forced migration generally occurs in the form of displacement (often over short distances) in response to direct threats to life caused by natural or human-made disasters or by armed conf licts. In most cases the displacement is initially temporary. However, depending on the scale of the catastrophe/conf lict and its duration, temporary displacement can turn into protracted displacement or permanent migration, often involving multiple moves before reaching a f inal destination. On the other hand, totally voluntary migration happens when the decision to migrate is taken under completely free will in the absence of any coercive factors, although it may still be subject to constraints. In the context of the celebrated Lee model of migration, totally forced migration/displacement can be viewed as being driven exclusively by push factors in areas of origin, while totally voluntary migration is driven exclusively by pull factors from the area of destination (Box 3). However, in most cases, migration decisions are based on a combination of coercive factors and freely-made choices with varying weight attached to them. Among a host of other variables, these can depend on the local context and socio-economic conditions of the people involved. A comprehensive conceptual framework for the drivers of migration is presented in Chapter 3.
»
| 7 |

CHAPTER 1 RURAL MIGRATION AND DEVELOPMENT: LAYING THE GROUNDWORK
Protracted crises in particular are among the most challenging situations in which migration takes place. They are driven by a combination of recurring causes, such as socio-political factors and natural hazards, lengthy food crises, breakdowns of livelihood and food systems and insufficient institutional capacity to deal with the resulting serious disruptions. Several factors can inf luence migration or displacement in protracted crises, including conf lict, poor governance, environmental conditions and natural-resource constraints, as well as severe food insecurity. Protracted crises increase vulnerability and cause people to lose access to the resources necessary for food and agricultural production, forcing them to relocate.
Key among these factors that can contribute to the decision to migrate (either permanently or seasonally) is food insecurity. Migration often represents a strategy on the part of households to manage the risks of poverty and food insecurity, allowing them to diversify income sources. This is particularly important as agriculture is subject to f luctuations in production, income and employment due to climatic factors and its seasonal nature, while non-farm employment
opportunities are limited in rural areas. A recent joint report by FAO and other technical agencies deals more in depth with the food security dimension of international and internal migration.21 n
WHAT IS THE ROLE OF RURAL AREAS IN THE DEVELOPMENT-MIGRATION NEXUS? While much of the world’s attention focuses on international migration, it is only one part of a bigger picture that includes both international (either intraregional or interregional) and internal migration f lows. The two are distinct, but they are also interlinked. The drivers and impacts of both migration types are often similar, although they may be different in scale. Moreover, internal and international migrations can be linked in a stepwise migration process, whereby for example an internal move towards larger cities then leads to international migration.
TOTALLY FORCED MIGRATION OR DISPLACEMENT
TOTALLY VOLUNTARY MIGRATION
Increasing vulnerability due to poverty, food insecurity, discrimination, natural hazards, conflicts, environmental degradation, etc.
Migration due to a combination of coercive factors and voluntary decisions
FIGURE 1MIGRATION DECISIONS ARE MOSTLY MADE UNDER COMBINATIONS OF COERCIVE FACTORS AND FREE WILL
SOURCE: FAO.
| 8 |
THE STATE OF FOOD AND AGRICULTURE 2018
The focus of this report is on rural migration, which is defined as migration that takes place to, from or between rural areas, independently of the destination or origin or of the duration of the migratory movement. Migration to, from or between rural areas is an important component of both internal (within countries) and international (between countries) migration. Due to the complexity of factors driving rural migration, it is usually a multifaceted process that takes different forms. It can be permanent or temporary, often taking the form of seasonal movements between urban and rural areas in search of employment. It may lie at different
points along the migration decision spectrum, from voluntary to forced, and can also take the form of rural–rural migration. These rural migration f lows are closely linked to agricultural and rural development in a bidirectional relationship: agricultural and rural development affects migration, but at the same time is itself affected by migration (see Box 4 for a list of terms describing various migration types and patterns).
On the one hand, migration is shaped by conditions in rural areas and in agriculture, f isheries and forestry. These are associated with, and also underpin, the process of structural »
The classic model of migration formulated by Lee provides a description of migration decisions.22 Lee defines migration broadly as “a permanent or semi-permanent change of residence”, with no distinction between internal and international migration and no restriction on the distance of the move. The decision to migrate and the process of migration are the result of: 1) factors associated with the area of origin; 2) factors associated with the areas of potential destinations; 3) intervening obstacles; and 4) personal factors. Both at the origin and the destination there may be factors acting to hold or attract people and factors which tend to repel them. In the subsequent literature, such factors have been frequently referred to as pull and push factors, respectively, although this terminology does not appear in Lee’s original paper from 1966. According to Lee, in addition to push and pull factors, migration decisions are affected by a set of intervening obstacles or constraints that may prevent people from migrating or at least make migration more difficult and/or costly. Comparing Lee’s model of push and pull factors to the migration drivers spectrum depicted in Figure 1, it can be said that totally forced migration is driven exclusively by push factors in areas of origin, while totally voluntary migration is driven exclusively by the pull factors in destination areas.
A more nuanced framework of migration drivers (referred to by its authors as “push-pull plus”) is proposed by Van Hear, Bakewell and Long, in a recent
paper that builds on the push-pull model. While the distinction between push and pull factors as drivers of migration in the conventional model is conceptually convenient, the push-pull plus framework emphasizes that migration decisions are driven by interconnected “driver complexes” that reflect the differentials in opportunities across locations. These decisions are subject to constraints or obstacles that may prevent people from moving, such as the cost of migrating and the distance to be travelled, among others. However, they may also be facilitated by other factors such as good infrastructure and the presence of social networks.23
The framework proposes a classification of migration drivers into four categories, referring to them as structural drivers that are distinct from the individual and household characteristics that can affect migration decisions. The categories are: disposing drivers, which reflect disparities across regions; proximate and precipitating drivers, which reflect crises in areas of origin versus improvements in areas of destination, with the difference between them being that the former are less identifiable while the latter may actually trigger departure; and mediating drivers, which are the constraining and facilitating factors.23
Building on these two frameworks and on existing theoretical empirical literature, a comprehensive framework for migration drivers is presented and discussed in Chapter 3.
BOX 3PUSH AND PULL FACTORS: LEE’S MODEL OF MIGRATION AND BEYOND
| 9 |
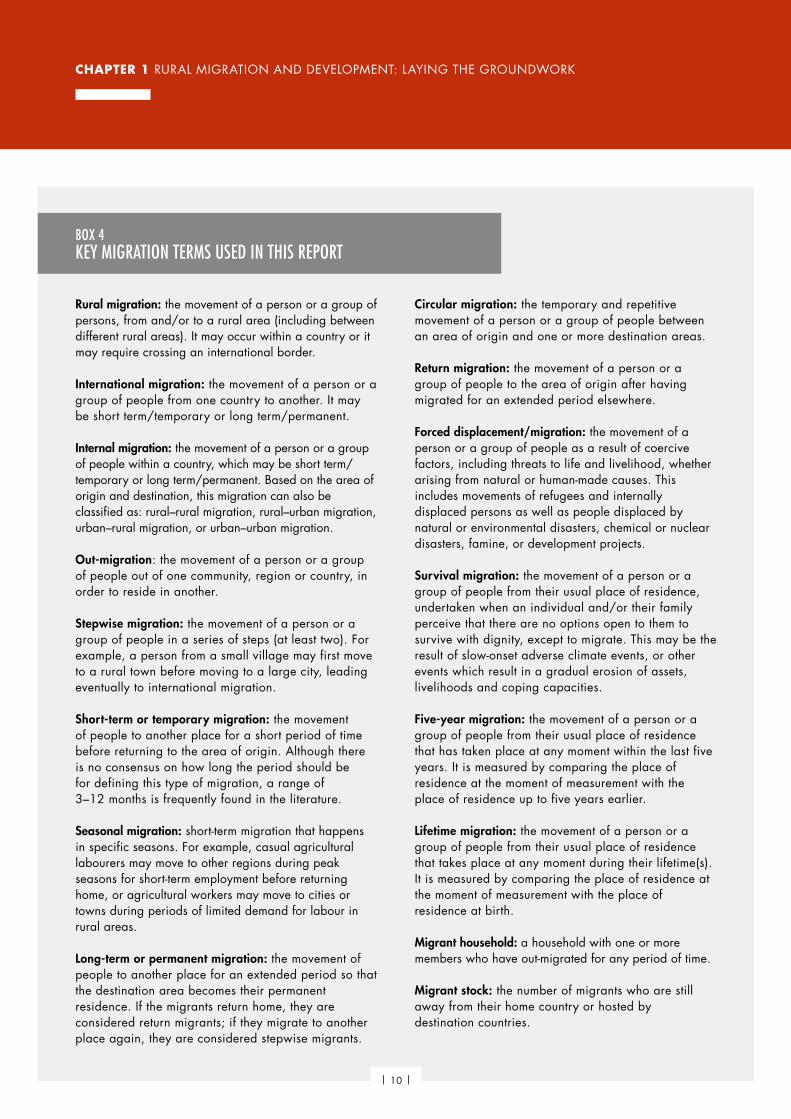
CHAPTER 1 RURAL MIGRATION AND DEVELOPMENT: LAYING THE GROUNDWORK
Rural migration: the movement of a person or a group of persons, from and/or to a rural area (including between different rural areas). It may occur within a country or it may require crossing an international border.
International migration: the movement of a person or a group of people from one country to another. It may be short term/temporary or long term/permanent.
Internal migration: the movement of a person or a group of people within a country, which may be short term/temporary or long term/permanent. Based on the area of origin and destination, this migration can also be classified as: rural–rural migration, rural–urban migration, urban–rural migration, or urban–urban migration.
Out-migration: the movement of a person or a group of people out of one community, region or country, in order to reside in another.
Stepwise migration: the movement of a person or a group of people in a series of steps (at least two). For example, a person from a small village may first move to a rural town before moving to a large city, leading eventually to international migration.
Short-term or temporary migration: the movement of people to another place for a short period of time before returning to the area of origin. Although there is no consensus on how long the period should be for defining this type of migration, a range of 3–12 months is frequently found in the literature.
Seasonal migration: short-term migration that happens in specific seasons. For example, casual agricultural labourers may move to other regions during peak seasons for short-term employment before returning home, or agricultural workers may move to cities or towns during periods of limited demand for labour in rural areas.
Long-term or permanent migration: the movement of people to another place for an extended period so that the destination area becomes their permanent residence. If the migrants return home, they are considered return migrants; if they migrate to another place again, they are considered stepwise migrants.
Circular migration: the temporary and repetitive movement of a person or a group of people between an area of origin and one or more destination areas.
Return migration: the movement of a person or a group of people to the area of origin after having migrated for an extended period elsewhere.
Forced displacement/migration: the movement of a person or a group of people as a result of coercive factors, including threats to life and livelihood, whether arising from natural or human-made causes. This includes movements of refugees and internally displaced persons as well as people displaced by natural or environmental disasters, chemical or nuclear disasters, famine, or development projects.
Survival migration: the movement of a person or a group of people from their usual place of residence, undertaken when an individual and/or their family perceive that there are no options open to them to survive with dignity, except to migrate. This may be the result of slow-onset adverse climate events, or other events which result in a gradual erosion of assets, livelihoods and coping capacities.
Five-year migration: the movement of a person or a group of people from their usual place of residence that has taken place at any moment within the last five years. It is measured by comparing the place of residence at the moment of measurement with the place of residence up to five years earlier.
Lifetime migration: the movement of a person or a group of people from their usual place of residence that takes place at any moment during their lifetime(s). It is measured by comparing the place of residence at the moment of measurement with the place of residence at birth.
Migrant household: a household with one or more members who have out-migrated for any period of time.
Migrant stock: the number of migrants who are still away from their home country or hosted by destination countries.
BOX 4KEY MIGRATION TERMS USED IN THIS REPORT
| 10 |
THE STATE OF FOOD AND AGRICULTURE 2018
transformation. Key drivers of migration from rural areas include rural poverty, vulnerability and food insecurity, as well as lack of employment and income-generating activ ities, especially in combination with rapid population growth. Most of the world’s poor, vulnerable and food-insecure live in rural areas and depend heavily on agricultural production, f isheries and forest-based livelihoods for their subsistence. Another migration driver is inequality, with urban areas offering better opportunities for employment, access to health services, education and social protection. Depletion of natural resources due to environmental degradation can also be a major driver of migration. The advancing threat of climate change with the risk of substantial negative effects on agriculture and rural areas, in particular for the rural poor, is increasingly perceived as a driver of potentially vast migratory f lows. Finally, both natural and human-made disasters – in the shape of conf licts – are often strong drivers of rural migration.
On the other hand, migration itself can have a major impact on rural areas, bringing both challenges and opportunities to areas of origin, transit and destination. Here migration affects the supply of labour and the demographic composition of the remaining population. While migration may reduce pressure on local labour markets in areas of origin and foster a more efficient allocation of labour and higher wages in agriculture, rural areas of origin risk losing the younger and most dynamic sector of their workforce and must cope with increased vulnerability of families at the source.
In rural areas in low- and middle-income transit and destination countries, migration and forced protracted displacement can present a challenge for local authorities in terms of providing public services, as well as put further strain on natural resources and increase pressure on agriculture- and fisheries-based livelihoods. However, migration can also contribute to agricultural and rural development in areas of origin: remittances from migrants to these areas can help overcome a lack of access to credit and insurance and foster investments in agriculture or other rural economic activities as well as in human resources. They also represent an informal type of social protection intervention. Moreover, diaspora organizations
and returning migrants can help rural areas through capital investment, skills and technology transfer, know-how and improved social networks.
This report examines the complex relationship between rural migration and development, focusing on both internal and international migration. This focus is supported by empirical studies in both developed and developing countries, showing that the destinations considered by potential migrants are often both internal and international and may vary with economic cycles.24 Internal and international migration may also serve as complements to one another, rather than alternatives. Migration can be a stepwise process involving an internal move, either before or after an international move.25 This is often the case in sub-Saharan Africa, where typically rural–urban migration has given way to dynamic migration f lows across Africa and to other continents.11 Similarly, Mexican migration to the United States of America is often stepwise.26,27
It is important to also note that in general a large share of international migration f lows take place between south-south regions and countries. Many of these f lows happen between countries that are undergoing a process of structural transformation and urbanization in which agriculture and rural areas are significant in terms of their share of the population and contribution to GDP.
The view taken in this report is that internal and international migration have similar drivers and constitute an integrated system – looking at only one or the other can lead to biased interpretations and misguided policy interventions. For example, internal rural–urban migration may leave a vacuum in rural areas in one country that is f il led by international migration from another. This in turn may leave a vacuum in specific rural areas in the country of origin, which then leads to internal migration across rural areas. Alternatively, when sources of internal migrants to cities become exhausted, international migration can substitute for internal migration, as has happened in developed countries. This highlights how measures linked to purely internal or international migration may not lead to the desired policy outcome unless the other dimension is also considered.
»
| 11 |

CHAPTER 1 RURAL MIGRATION AND DEVELOPMENT: LAYING THE GROUNDWORK
Figure 2 provides a graphic illustration of the focus of the report, distinguishing on the international front between countries where migration originates and countries of destination. The figure illustrates how flows of migrants – both internal and international – can be inter-related and how rural migration cannot be ignored if one wants to draw a complete picture of migration processes. As highlighted in the literature for Asia, there are cases of internal migration leading to international migration, but there are also cases of equally important international movements from rural areas without prior internal migration.4 Migrants may also transit through countries before reaching their final destination country.
Despite the inter-relatedness of internal and international migration, there is a significant gap between the two in terms of both data and analysis. While international migration f lows are relatively well documented, data on migratory movements to and from rural areas – both within and between countries – are much more diff icult to come by. This is particularly true at the interface between the two forms of migration: there is rarely information on the rural or urban provenance of international migrants. As pointed out by some scholars, there is a need to integrate
data collection efforts in censuses and migration surveys so that information on both internal and international migrants is collected together, and to ensure that migration data are consistent and comparable.28 Research that traces the moves of the same individuals and groups within and between countries is particularly valuable in f il l ing these gaps.
A further data challenge that complicates the empirical analysis of rural migration is the lack of a common definition of “rural” versus “urban” areas. Definitions for statistical and other purposes differ widely from country to country, making cross-country comparisons problematic. ii
Given these challenges regarding rural migration patterns, this report aims to achieve the following:
� present the main trends and issues of international migration f lows and how these may impact rural areas in both developing and developed countries;
� provide a clearer picture of internal rural migration in different regions of the developing world; and
ii For a discussion, see FAO, 2017, p. 15.9
COUNTRY A (ORIGIN)
TRANSIT COUNTRY
COUNTRY B (DESTINATION)
RURAL AREAS
URBAN AREAS
RURAL AREA
URBAN AREA
RURAL AREA
FIGURE 2A SCHEMATIC REPRESENTATION OF MIGRATION FLOWS CONSIDERED IN THIS REPORT
NOTE: The blue arrows represent migration flows from rural areas, the orange arrows represent those from urban areas and the grey arrows represent flows of either rural or urban origin.SOURCE: FAO.
| 12 |

THE STATE OF FOOD AND AGRICULTURE 2018
� establish the link, as much as possible, between internal and international migration and their relationship with agricultural and rural development. n
STRUCTURAL TRANSFORMATION, RURAL–URBAN LINKAGES AND DEMOGRAPHICS IN RURAL AREASThe movement of people within and between countries is part of the process of development and structural change in economies, in which the relative role of agriculture in terms of income generation and employment gradually declines. The reallocation of economic activ ities across sectors and the consequent declining share of labour employed in agriculture is typically accompanied by a movement of labour from rural to urban areas, where the proportion of people has been increasing worldwide, particularly in developing regions.
Today the global urban population stands at around 3.9 billion, equivalent to 54 percent of the world’s population. This f igure is expected to reach 66 percent by 2050, compared to only 30 percent in 1950. Urbanization trends, which present significant heterogeneities across regions, ref lect three factors that play different roles in different contexts: natural urban growth, reclassif ication of rural areas into urban areas, and net rural–urban migration. Among the three, the extent to which rural–urban migration has been contributing to urbanization is likely far less significant than for the other two factors. In a recent report, it was estimated that 60 percent of the growth in urban populations is due to natural increases, with another 20 percent coming from reclassif ication of settlements.29 Even so, rural–urban migration is still an important phenomenon, and, depending on its speed and where it is directed, it can affect how urbanization unfolds. Population dynamics in rural areas will continue to be a major driving force behind rural migration (see Box 5). n
DIFFERENT MIGRATION CHALLENGES – COUNTRY PROFILES BASED ON DRIVERS OF RURAL MIGRATIONThe development dimensions of rural migration and the associated challenges are brought together in Figure 3, which displays a typology of country profiles based on drivers of rural migration. These profiles aim to illustrate the main processes that drive rural migration movements in a country – both internally and internationally – using two dimensions: 1) the level of economic development and governance; and 2) the rural youth density per hectare of agricultural land, as a close approximation of the labour absorption capacity of agricultural and rural areas. The basic premise is that, to different degrees and depending on the context, demographics, governance, and economic conditions are drivers of rural migration, either internally or internationally.
In order to approximate the level of countries’ economic and social development, the typology draws on the composite Human Development Index (HDI). This global index integrates life expectancy at birth, mean and expected years of schooling, and gross national income per capita to ref lect an individual’s ability to lead a long and healthy life, acquire knowledge, and achieve a decent standard of liv ing.32 The inclusion of the HDI in the typology of country profiles provides insight not only into the social, economic and political conditions in the countries, but also into the status of structural transformation. These are likely to be relevant for both internal and international migration.
The rural youth density per hectare of agricultural land is meant to provide insight into the extent to which population pressures in rural areas – and particularly the need to generate employment for rural youth – are likely to generate migratory f lows from these areas. It is important to look at this indicator in combination with the HDI, as the latter may provide an indication of a country’s ability to address the »
| 13 |
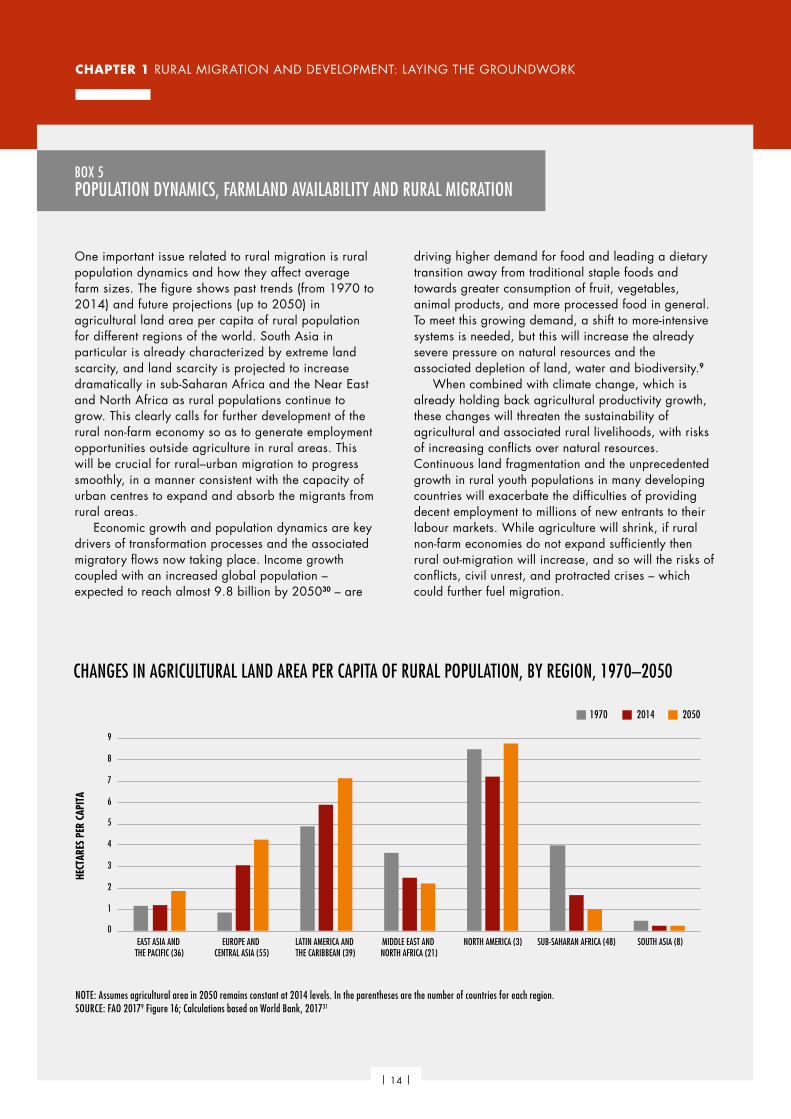
CHAPTER 1 RURAL MIGRATION AND DEVELOPMENT: LAYING THE GROUNDWORK
One important issue related to rural migration is rural population dynamics and how they affect average farm sizes. The figure shows past trends (from 1970 to 2014) and future projections (up to 2050) in agricultural land area per capita of rural population for different regions of the world. South Asia in particular is already characterized by extreme land scarcity, and land scarcity is projected to increase dramatically in sub-Saharan Africa and the Near East and North Africa as rural populations continue to grow. This clearly calls for further development of the rural non-farm economy so as to generate employment opportunities outside agriculture in rural areas. This will be crucial for rural–urban migration to progress smoothly, in a manner consistent with the capacity of urban centres to expand and absorb the migrants from rural areas.
Economic growth and population dynamics are key drivers of transformation processes and the associated migratory flows now taking place. Income growth coupled with an increased global population – expected to reach almost 9.8 billion by 205030 – are
driving higher demand for food and leading a dietary transition away from traditional staple foods and towards greater consumption of fruit, vegetables, animal products, and more processed food in general. To meet this growing demand, a shift to more-intensive systems is needed, but this will increase the already severe pressure on natural resources and the associated depletion of land, water and biodiversity.9
When combined with climate change, which is already holding back agricultural productivity growth, these changes will threaten the sustainability of agricultural and associated rural livelihoods, with risks of increasing conflicts over natural resources. Continuous land fragmentation and the unprecedented growth in rural youth populations in many developing countries will exacerbate the difficulties of providing decent employment to millions of new entrants to their labour markets. While agriculture will shrink, if rural non-farm economies do not expand sufficiently then rural out-migration will increase, and so will the risks of conflicts, civil unrest, and protracted crises – which could further fuel migration.
BOX 5POPULATION DYNAMICS, FARMLAND AVAILABILITY AND RURAL MIGRATION
CHANGES IN AGRICULTURAL LAND AREA PER CAPITA OF RURAL POPULATION, BY REGION, 1970–2050
0
1
2
3
4
5
6
7
8
9
EAST ASIA AND THE PACIFIC (36)
EUROPE AND CENTRAL ASIA (55)
LATIN AMERICA AND THE CARIBBEAN (39)
MIDDLE EAST AND NORTH AFRICA (21)
NORTH AMERICA (3) SUB-SAHARAN AFRICA (48) SOUTH ASIA (8)
HECT
ARES
PER
CAP
ITA
1970 2014 2050
NOTE: Assumes agricultural area in 2050 remains constant at 2014 levels. In the parentheses are the number of countries for each region.SOURCE: FAO 20179 Figure 16; Calculations based on World Bank, 201731
| 14 |

THE STATE OF FOOD AND AGRICULTURE 2018
issue of employment generation for rural youth. Indeed, countries at higher levels of human development are likely to be further ahead in the process of structural transformation and better able to provide employment opportunities outside agriculture.
A high density of rural youth per hectare of land could be thought of as mainly a driver of internal rather than international migration. However, it must be remembered (as will be seen in Chapter 2) that internal migration from rural to urban areas often precedes international migration, and that people who have already migrated internally are more likely to undertake international migration – especially if they have migrated to an urban area. Furthermore, the size of a country may also matter when determining whether migration is mostly internal or more international. Indeed, all other things being equal, the smaller the country, the more migration is likely to be international.
These two indicators are only rough proxies for a broader range of factors that affect rural migration and determine the major challenges countries face in terms of migration. Although it is difficult to provide a clear cut-off categorization of countries, as some may have characteristics pertaining to two or more categories, the following five broad profiles are identified using the two dimensions:
i. fragile and conf lict-affected states; i i. states facing a rural youth employment
challenge in fragile contexts; i i i. states with development momentum, allowing
them to absorb youth labour market entrants; iv. transitioning countries with economic
momentum, advanced urbanization and demographic transition; and
v. aspirational destinations with high levels of development.
However, the two dimensions used to categorize countries in this typology are better understood
DEVELOPMENT MOMENTUM: youth density can bring about a demographic dividend – still mostly an origin of international migrants, but may also attract them from fragile contexts
TRANSITIONING COUNTRIES: will be both origin of and destination
for international migrants; internal migration diversifies
RURAL EMPLOYMENT CHALLENGE IN FRAGILE CONTEXTS: origin of international migrants; internal migration mostly low-skilled rural–urban (may attract migrants from adjoining fragile and conflict-affected states)
FRAGILE ANDCONFLICT-AFFECTED STATES:
will be origin for migrantsand refugees; share of internal
migration linked to internallydisplaced people
Low socio-economic development and/or fragile states
Low-density rural youth (per hectare of agricultural land)
High-density rural youth (per hectare of agricultural land)
High socio-economic development and good governance
ASPIRATIONAL DESTINATIONS: low net internal migration; higher commuting and circular mobility. May need immigration to meet demand for labour in agriculture
FIGURE 3A TYPOLOGY OF COUNTRY PROFILES BASED ON DRIVERS OF RURAL MIGRATION AS A FUNCTION OF DEVELOPMENT, GOVERNANCE, AND RURAL DEMOGRAPHICS
SOURCE: FAO elaboration based on data FAOSTAT, 201833, UN DESA, 201730 and UNDP, 201834 .
»
| 15 |

CHAPTER 1 RURAL MIGRATION AND DEVELOPMENT: LAYING THE GROUNDWORK
from a dynamic viewpoint, as intervening factors (policies, geographical locations, and legal frameworks, among others) that may differ by country can pose a variety of challenges, causing drivers of rural migration in each category to operate at scales and time frames that are also different by country. This implies that the triggering or mediating effects of these two dimensions on rural migration may affect countries of the same category differently.
From these five profiles, the following observations can be broadly highlighted, as also illustrated in Figure 4.
� Many of the countries that are now in the aspirational destination category were once a
major origin of migrants, but now are major destinations of international migration. iii Some of these countries now have a low number of youth in rural areas, and often they will need migration to those areas in order to meet labour demand in agriculture and/or need to invest heavily in mechanization. Net internal rural–urban migration is low, as rural areas are mostly depopulated while commuting and circular mobility are very high. Out-migration from these countries mostly involves either highly skilled workers – usually migrating to other developed countries – or migrants returning to their countries of origin after a
iii Clear exceptions are represented by Australia, Canada, New Zealand and the United States of America.
Aspirational destinations Transitioning countries Development momentum Fragile and conflict-affected states Rural employment challenge in fragile contexts
Afghanistan
Algeria
Angola
Bangladesh
Belgium
Benin
Bolivia (Plurinational State of)
Brazil
Burkina Faso Burundi
Cambodia
Cameroon
Canada
Chad
Chile
ChinaColombia
Cuba
Czechia
Democratic Republic of the Congo
Dominican Republic
Ecuador
Egypt
Ethiopia
France
Germany
Ghana
Greece
Guatemala
Guinea
Haiti
India
Indonesia
Iran (Islamic Republic of)
Iraq
ItalyJapan
Kazakhstan
Kenya
MadagascarMalawi
Malaysia
Mali
Mexico
Morocco
Mozambique
Myanmar Nepal
Netherlands
Niger
Nigeria Pakistan
Peru
Philippines
PolandPortugal
Republic of Korea
RomaniaRussian Federation
RwandaSenegal
South Africa
South Sudan
Spain
Sri Lanka
Sudan
Syrian Arab Republic
ThailandTunisia
Turkey
Uganda
Ukraine
United Kingdom
United Republic of Tanzania
United States of America
UzbekistanViet Nam
Yemen
Zambia
Zimbabwe
0.3
0.4
0.5
0.6
0.7
0.8
0.9
1.0
2 3 4 5 6 7 8 9
HUM
AN D
EVEL
OPM
ENT
INDE
X IN
201
5
LN DENSITY OF RURAL YOUTH ON AGRICULTURAL LAND IN 2015
Low socio-economic development and/or fragile states
Low-density rural youth (per hectare of agricultural land)
High-density rural youth (per hectare of agricultural land)
High socio-economic development and good governance
NOTE: The red text represents countries in protracted crisis affected by conflicts as defined by FAO et al., 2017, Table A2.1.35 For country-level data, see Statistical Annex Table A3. The values on the x-axis are logarithms of the values presented in Statistical Annex Table A3.SOURCE: FAO elaboration based on data from FAOSTAT, 201833, UN DESA, 201730, and UNDP, 201834.
FIGURE 4PLACEMENT OF SELECTED COUNTRIES WITHIN THE COUNTRY PROFILE TYPOLOGY BASED ON DRIVERS OF RURAL MIGRATION, 2015
| 16 |
THE STATE OF FOOD AND AGRICULTURE 2018
relatively long period of migration. This category includes Canada, Chile, the Republic of Korea, the Russian Federation, the United States of America, most European countries, and oil-rich countries in the Near East.
� Transitioning countries are those that have made advances in terms of economic development and governance. This is ref lected in their birth and urbanization rates, resulting in fewer youth per hectare of agricultural land. Internal migration is diversif ied, with urban–urban migration dominating. Examples of countries in this category are Algeria, Brazil, China, Colombia, Ghana, Mexico, Morocco, Peru, Thailand, Tunisia, Turkey, South Africa, Uzbekistan and Zambia. Many of these countries are both orig ins and destinations of international migration. If current trends continue, some of them will soon join the “aspirational” group. This is more l ikely to happen in countries l ike Malaysia, Mexico, and Turkey, which are currently borderline aspirational destinations.
� The development momentum category includes countries that have a large pool of youth in rural areas, but also a reasonable degree of economic momentum to generate employment for youth, either in rural or in urban areas. Net rural–urban migration is usually positive, but rural–rural migration is considerable, at least in countries with a big agricultural base. This category includes countries like Bangladesh, Cambodia, India, Myanmar, Nepal, Pakistan, the Philippines, Sri Lanka, and Viet Nam. Currently these countries are major sources of emigration, which could accelerate if economic development increases (see Box 2).
� Countries that are facing a rural youth employment challenge in fragile contexts, while at the same time not having the development momentum to absorb labour market entrants, are found mostly in Africa (Benin, Burundi, Ethiopia, Rwanda, Senegal, Uganda), with the exception of Haiti. Some countries, such as Nigeria and Cameroon, straddle this category and the development momentum category. Here internal migration is mostly rural–rural, with high levels of
seasonal migration. Survival migration is also frequent due to a high incidence of extreme poverty and food insecurity.
� Finally, the category of fragile and conflict-affected states, where migration is more likely to be driven by conf lict (or insecure post-conf lict situations) than by resource pressures or economic incentives, includes countries such as Afghanistan, Chad, Mali, Niger, South Sudan, the Sudan, the Syrian Arab Republic and Yemen. In these countries, migratory f lows usually begin with internal displacements which, depending on the intensity and the duration of conf lict, become frequent and may lead to large international out-migration.
As compared to the classif ication of countries based on income levels and growth rates by the Organisation for Economic Co-operation and Development (OECD),36 the typology proposed in this report aims at focusing more specifically on the drivers and challenges associated with rural migration. Therefore, it adopts a broader indicator of economic and social development. The majority of the “transitioning countries” in this typology fall into the OECD category of “high and sustained growth,” while some from that category of OECD have graduated to “aspirational” and others are still in the “development momentum” category. n
A TERRITORIAL DEVELOPMENT APPROACH CAN MAXIMIZE THE BENEFITS OF RURAL MIGRATION FOR ECONOMIC TRANSFORMATION As already indicated, the movement of people within and between countries is an integral part of successful agricultural and rural development and is linked to structural changes in the economy, in which the relative role of agriculture
| 17 |

CHAPTER 1 RURAL MIGRATION AND DEVELOPMENT: LAYING THE GROUNDWORK
in terms of income generation and employment gradually declines. Migration is largely shaped by structural and rural transformation processes, but migration f lows themselves also affect rural areas in various ways.
The speed and magnitude of migration, as well as the circumstances in which it occurs, depend on socio-economic conditions in areas of both origin and destination, on different sectoral policies, as well as on the management of migratory f lows. Under perfectly functioning factor markets, returns to labour across locations and sectors would eventually be broadly equalized as growth in specific locations or sectors attracts labour from others. However, when the working-age population is growing quickly, agricultural and rural development is lagging or unsustainable, and other sectors are not growing quickly or strongly enough to absorb “excess” rural labour, this risks resulting in increasing rural poverty and the emergence of survival migration.
The structural transformations of the past have in some cases led to massive migration out of rural areas, with associated benefits and costs. Future transformations are likely to be different in terms of the economic potential of urban areas, which may be characterized in most parts of Africa and Asia by relatively low levels of industrialization combined with growing populations. This does not mean that rural–urban migration will necessarily be reduced. Where rural employment creation does not keep pace with rural population growth, the pressure to migrate will increase. However, there may be fewer options for migrants to exit poverty in urban areas as well: in such contexts the benefits of migration appear to be limited.
A territorial development approach that focuses on rural–urban linkages and their economic potential can help resolve this dilemma. As it goes hand in hand with the territorial planning of metropolitan areas, small cities and towns, and with improved regional infrastructure networks, it addresses the drivers of rural out-migration. For example, where local jobs are lacking, investments in connective infrastructure specific to the food system – such as warehousing, cold storage and wholesale markets – can generate employment both in agriculture and in the non-farm economy. Where rural people are attracted
by more prosperous conditions in urban centres, investments in “agglomeration” services – such as education, health, communication and leisure facilities in small cities and towns (which are more evenly distributed over a territory and in proximity to rural areas) – can reduce rates of out-migration to overburdened larger cities.9
Rural out-migration happens on a large scale usually where there is a lack of opportunities, in both rural areas and their associated towns, and where the metropolitan bias works against an equitable distribution of public investments in infrastructure and services, not only between rural and urban areas but also between different territories. Large-scale migration can also be caused by non-economic factors such as conf lict and political instability, food insecurity, l imited access to land and credit, natural resource depletion and degradation, and the impacts of climate change, many of which operate concurrently.
As proposed by The State of Food and Agriculture 2017,9 improving basic infrastructure and services in small cities, towns and surrounding rural areas, and creating better links between them, are key steps in ensuring a more inclusive transformation. In addition, these interventions should go hand in hand with institutional reforms to adopt good responsive governance structures. This is important for ensuring that best practices are adopted for natural resources management and that transparency and accountability are guaranteed. When inclusive transformation is achieved, rural out-migration will continue but it will be more by choice, in response to the pull factors of urban areas such as lifestyle preferences and not due to a lack of economic opportunities in rural areas. In many cases this may involve internal migration to other rural areas with more dynamic agriculture, where demand for labour – and labour productivity – is higher.
The rural–urban spectrum described in The State of Food and Agriculture 2017 provides a general framework for rethinking the interplay between the push factors in rural areas and the pull factors attracting rural people to urban centres. It suggests that rural–urban migration is unlikely to be a jump from rural hinterland to megacity, but more a gradual transition. People
| 18 |

THE STATE OF FOOD AND AGRICULTURE 2018
in rural hinterlands may first move to better-connected villages before moving to small towns, which are probably the main source of migrants entering larger cities. For example, life history accounts of rural–urban migrants from Kagera in the United Republic of Tanzania show that secondary towns occupy a middle ground between semi-subsistence agriculture and the capitalistic big city, between that which is close by and familiar and that which is much further away and unknown.37 International migration directly from rural areas is less common, as people may face more constraints owing to distance and the economic resources required to migrate abroad.9 There are exceptions however, such as cross-border movements of seasonal workers in agriculture in certain areas in Africa. n
OBJECTIVES OF THE REPORTThis report aims to contribute to the debate on migration, with a focus on rural migration in all its forms. This objective must be seen in the context of the New York Declaration for Refugees and Migrants adopted by the UN General Assembly in September 2016 and the development of the global compact for safe, orderly and regular migration, as well as that concerning refugees. Although aligned with the UN Secretary-General’s report Making migration work for all,1 this report has a narrower scope with its focus on rural migration and rural development, while also addressing both international and internal migration. In particular, two of the four fundamental considerations made by the UN Secretary-General in his report are crucial to the approach taken in this edition of The State of Food and Agriculture:
“(a) The basic challenge before us is to maximize the benefits of migration rather than obsess about minimizing risks; we have a clear body of evidence revealing that, despite many real problems, migration is beneficial both for migrants and host communities in economic and social terms – our overarching task is to broaden the opportunities that migration offers to us all;
[...] (d) Migration should never be an act of desperation: migration works for all when those who travel make an informed and voluntary choice to go abroad through legal means, but we have seen too many migrants on the move in large numbers in response to unsustainable pressures in their home countries in recent years. We should use all the developmental, governance and political tools at our disposal to prevent and mitigate the human and natural forces that drive such large movements of people, but we should also recognize that we have a duty to care for those who migrate out of desperation.”
In the light of these considerations, this report aims to help policy-makers better understand the relationship between rural migration on the one hand, and agricultural and rural development on the other. The overarching policy objective should not be to stem or accelerate migratory f lows, but rather to maximize the contribution of rural migration to economic and social development and minimize the costs. The report analyses rural migration f lows – both internal and international – as well as their determinants and impacts. It looks at the factors in rural areas – and more specifically in agriculture – which contribute to determining migration decisions, and analyses the relationship between agricultural and rural development and migration. Throughout there is also a special focus on the problems associated with forced migration, especially in connection with protracted crises. Finally, the report addresses the question of how policies can be designed to harness the development benefits of rural migration, along with the key policy areas that require attention.
To this end, the report is structured as follows. Chapter 2 reviews available evidence on trends in rural migration. Chapter 3 provides an overview of the drivers of rural migration, while Chapter 4 analyses how rural areas and agriculture are affected by migration. Chapter 5 concludes the report by presenting the main implications of the analysis of the previous chapters and discusses how policies can maximize the development benefits of rural migration. n
| 19 |

GREECEA woman with her baby at the makeshift camp of Idomeni, northern Greece, where thousands of mostly-Syrian refugees used to pass through the Greek–Macedonian border every day.©FAO/Giuseppe Carotenuto

Key messages
1Migration from developing to developed countries garners most
attention today, but in terms of magnitude it is actually surpassed by migration between developing countries. About 85 percent of international refugees are hosted by developing countries, with at least a third – and in sub-Saharan Africa more than 80 percent – in rural areas.
2 Globally, international migration is a significantly smaller phenomenon
than internal migration, but the two are interlinked; often, international migration is preceded by internal migration.
3 More than 1 billion people living in developing countries have moved
internally as part of economic transformation; rural–urban and rural–rural migration flows are part of this process.
4 Internal rural migration involves more than permanent moves to an urban
area: return migration to rural areas can reach peaks of 30 percent or more among rural–urban migrants. Migration between rural areas is a significant component of internal migration as well, particularly in countries at less advanced stages of development.
5 Rural development can affect rural migration by broadening the
opportunities available to rural people, and also by helping communities both prepare for and respond to protracted crises.
CHAPTER 2TRENDS AND PATTERNS OF
RURAL MIGRATION

As mentioned in Chapter 1, there has been growing international attention on migration, mostly focused on international migration. From an economic and social development perspective however, international migration is part of a much larger process, one that also involves movements of people within countries – including migration to, from or between rural areas. This chapter reviews available evidence to assess the trends and patterns of migration f lows and explore their magnitude and characteristics, with a special focus on rural migration (see Box 6 for available data sources). Inter alia, the chapter tries to shed new light on the different components of internal rural migration: rural–rural, urban–rural, and rural–urban. It also attempts to provide new insight into how international and internal migration f lows are linked to rural areas. Because the data on international migration often do not capture the area of origin of international migrants, this remains a diff icult task. n
NUMBERS OF INTERNATIONAL MIGRANTS HAVE INCREASED SIGNIFICANTLY, BUT MUCH LESS AS A SHARE OF TOTAL POPULATIONThe growing attention to international migration is motivated in part by a perception that migratory f lows have increased dramatically. According to the United Nations Department of Economic and Social Affairs (UN DESA), international migrant stocks increased from
153 mill ion people in 1990 to 248 mill ion in 2015. This represents an increase of 61 percent over 25 years – 70 percent in developed regions and 53 percent in developing regions.1
In spite of the large increase in absolute numbers, when measured as a percentage of world population the increase in migration is much smaller: from 2.9 percent in 1990 to only 3.3 percent in 2015. However, the share of migrants in the total population has evolved differently between developed and developing countries. In developing countries it has remained stable at 1.7 to 1.8 percent over the last three decades, as a consequence of high rates of overall population growth. In developed countries the share of migrants rose from 7.2 percent of the population in 1990 to 11.2 percent in 2015.1
Migration between and within regions International migration is often perceived as a movement of people along one predominant vector: from developing countries towards developed countries. However, this perception ignores the vast f lows of migration to developing countries, mainly from other developing countries. Indeed, of the total stock of 248 million migrants in 2015, the majority (57 percent) are found in developed countries, although a significant share (43 percent) had developing regions as their destination. Breaking down the shares of migrant stocks by area of origin and destination – developed and developing regions, respectively - shows that in 2015 migrants who had moved between developing countries represented 38 percent of the total number of international migrants, compared to 35 percent for those who had moved from developing to developed countries. Thus, migration f lows between developing countries are larger than those from developing to developed countries »
CHAPTER 2
TRENDS AND PATTERNS OF RURAL MIGRATION
| 22 |

THE STATE OF FOOD AND AGRICULTURE 2018
Most available data on migration derive from population censuses, while some additional data are generated by administrative records and some by specialized sample-based surveys. Population censuses focus on the demographic aspects of migration by recording those who took and left residences in different parts of a country. They are the main source of data on international migrant stocks, which can be enumerated by counting either the foreign-born population or foreign citizens living in a country. The main advantages of censuses in analysing migration is that they rely on full enumeration and are typically comparable across countries. They take place infrequently, however, and do not delve into the causes and consequences of migration.
Administrative records mostly include population registries or targeted registries for special population groups, such as asylum seekers or foreigners taking up temporary residence in a country. However, from a policy analysis perspective their potential is limited because the information gathered refers to administrative procedures rather than people. For example, an individual could be assigned multiple residence permits in a year, or a single permit could cover both an individual and his or her dependents.
Sample-based household surveys – such as labour force surveys, the Demographic and Health Surveys (DHS) of the US Agency for International Development (USAID), and the surveys of the Living Standard Measurement Study (LSMS) promoted by the World Bank – are more useful for analytical and policy analysis purposes. These surveys do not focus on migration but often include questions on the topic, making them suitable for studying the causes and consequences. Nonetheless they are usually not statistically representative for migration-related variables, unless they have been specifically designed with this in mind.
At the international level, a number of organizations provide data:
� The United Nations Department of Economic and Social Affairs (UN DESA) has developed the United Nations Global Migration Database, which is a comprehensive collection of data on stocks and flows of international migrants by country of birth and citizenship. These are available by sex and age as enumerated in population censuses, population registers, nationally representative surveys and other official statistical sources.
� The International Organization for Migration (IOM) disseminates and analyses similar data through its Global Migration Data Analysis Centre, together with Migration Profiles for individual countries.
� The International Labour Organization (ILO) has a large collection of data on the labour force and migrant labour, assembled from a number of different sources, including labour force surveys, household budget and expenditure surveys, registries, and other surveys.
� The Organisation for Economic Co-operation and Development (OECD) and the European Commission’s Directorate-General for Statistics (Eurostat) maintain international migration databases with information supplied by Member States. Migration indicators can also be obtained from another project named the Integrated Public Use Microdata Series (IPUMS) International, which is aimed at harmonizing and disseminating census data.
� Data from the UN Refugee Agency (UNHCR) focus on forced migration. The organization collects and disseminates time series data on asylum seekers, internationally and internally displaced persons (IDPs), persons who have returned from internal displacement conditions, persons in refugee-like situations and in resettlement, and stateless persons. Data are obtained by the UNHCR Field Information and Coordination Support Section.
Other data on migration are available from specific studies and surveys. Among these, the Gallup World Poll collects migration information as part of its national surveys. In particular, the Gallup World Poll asks interviewees about their intentions to change residence, and also their intended destinations. This information is matched with a number of socio-demographic characteristics of potential migrants. The European Commission’s Directorate-General for Statistics (Eurostat) also runs a project called MED-HIMS (Households International Migration Surveys in the Mediterranean countries), aimed at collecting data in southern Mediterranean countries. Beyond the LSMS surveys, the World Bank has also conducted a series of Migration and Remittances Household Surveys in nine African countries as part of the Africa Migration Project, jointly undertaken with the African Development Bank.
BOX 6POTENTIAL DATA SOURCES FOR ANALYSING MIGRATION AND RURAL TRANSFORMATION
| 23 |

CHAPTER 2 TRENDS AND PATTERNS OF RURAL MIGRATION
and have increased more over the past ten years (Figure 5).
Intra-regional international migration, as reported by UN DESA, is a key element in internat ional migration patterns because of its magnitude and relevance to structural transformation in developing countr ies. In many reg ions, legal movements of people f rom country to country within the same reg ion or cont inent are a lso of ten faci l itated by polit ical and economic agreements established in past decades.
Regional agreements have shaped movements within developed regions, such as the progressive enlargement of the European Union (Member Organization) and the free circulation of people within it. At the end of 2016 there were 20.4 million European Union citizens liv ing within the borders of the organization’s Member Countries but not in their country of origin.2 This may explain at least in part the increase in
the stock of migrants between developed regions (Figure 5). Moreover, border changes following the dissolution of the Soviet Union resulted in a reclassif ication of internal migrants as international migrants, thus altering the stock records of migrants from developing to developed countries.
In both developed and developing regions, migration between countries within the same region or even sub-regions is common.1,3 According to data from UN DESA, the share of international migrants who move within the same region is at least half of the total number of international migrants.1 Figure 6 shows the number of international migrants who have moved within the same sub-region (dark blue), within the same continent (orange), or to elsewhere in the world (l ight blue) in 2015, with the size of the arrows representing the magnitude of the international migrant stock. The prevalence of each type of move is shown with the segments of
0
10
20
30
40
50
60
70
80
90
100
1990 1995 2000 2005 2010 2015
MIL
LION
S
Developed to developed Developed to developingDeveloping to developed Developing to developing
FIGURE 5INTERNATIONAL MIGRANTS BY ORIGIN AND DESTINATION – 1990, 1995, 2000, 2005, 2010 AND 2015
NOTE: Data refer to stock of international migrants. See Statistical Annex Tables A1 and A2 for country-level data.SOURCE: FAO elaboration based on data from UN DESA, 20171
»
| 24 |

THE STATE OF FOOD AND AGRICULTURE 2018
the donut charts. Western Africa and Western Asia have the largest shares of intra-regional migration (66 percent and 57 percent respectively). Migration within the same continent is dominant in Polynesia (72 percent) and Melanesia (61 percent), and is also high in South Asia (45 percent) and Middle Africa (35 percent).
In 2015 about 33 million Africans were liv ing outside their home countries, with more than half of these international migrants having moved within Africa.3 North Africans migrate predominately overseas while sub-Saharan Africans move mostly within Africa to neighbouring countries or within their region. Migration systems covering smaller geographic areas within sub-regions are also observable; the four main systems are Senegal-Mali, Burkina Faso-Côte d’Ivoire, Gulf of Guinea, and the Sahel/Sudan.3
From North Africa and all sub-regions of Latin America, most migrants appear to have moved elsewhere in the world. For North Africa, the destinations differ from one country to the other: a sizeable number of migrants from Egypt go to the Gulf states (part of West Asia),4 while international migrants from Tunisia and Morocco have Europe as their main destination.5 Among the Latin American sub-regions, South America shows the strongest intra-regional movements, driven by the MERCOSUR (Southern Common Market) Residence Agreement. This allows citizens of the signatory states temporary residence in another country of the block, the option to apply for permanent residence in the host country, and equal rights and civil, social, cultural and economic freedoms.6
In Asia there are regional migration systems as well, such as Bangladeshi plantation workers migrating to Malaysia,7 the Indian-Nepalese system8 and post-Soviet migration patterns centred around the Russian Federation and Kazakhstan.9 The latter f low does not emerge clearly from Figure 6 because the Russian Federation is part of Europe in the UN classif ication system used in the Figure; migrants from Central Asian countries to the Russian Federation are therefore shown as going to another continent.
A significant share of international migrants come from rural areas The key focus of this report is rural migration, which is defined in this report as the movement of people from, towards and between rural areas. While data on international migration are available on a country basis, the data on precise levels of rural migration, whether internal or international, are scarce. Data from a few recent national censuses or nationally representative surveys from high-migration countries allow us to estimate the share of international migrants coming from rural areas over total international migrants. When compared with the share of the rural population over the total population in the same countries, this can shed light on the relative propensity to migrate from rural and urban areas (Figure 7).
As Figure 7 shows, in all cases a significant share of international migrants originate from rural areas. In most cases, the share of international migrants coming from rural areas is very similar to that of the population residing in rural areas in countries of origin. This indicates that, broadly speaking, the propensity to migrate internationally from rural and urban areas is relatively similar. There are some exceptions – such as Bangladesh and Nepal, both in South Asia – where the share of international migrants from rural areas is substantially lower than the share of rural residents in the population, indicating that the propensity to migrate internationally is lower among the rural population than the population at large. On the other hand, the surveys do not indicate whether the international migrants had previously migrated internally. Therefore, it is not possible to know to what extent the urban international migrants are originally from rural areas and thus represent examples of stepwise migration, as discussed in the next section.
Rural areas are also destinations for many international migrants, and while global data are lacking, country case studies on foreign workers in agriculture or food processing provide insight into these f lows. In the United States of America for example, three-quarters of al l hired workers in high-value crop production were born outside the country, according to the
| 25 |

CHAPTER 2 TRENDS AND PATTERNS OF RURAL MIGRATION
2013–2014 National Agricultural Workers Survey.11 In the United Kingdom of Great Britain and Northern Ireland, there were about 27 000 nationals of other European Union countries working in agriculture in 2016, amounting to 8 percent of al l people employed in the country ’s
sector. An addit ional 116 000 nationals of the European Union were working in the food manufacturing sector in the United Kingdom of Great Britain and Northern Ireland, representing 33 percent of al l people employed in the sector. Furthermore, every summer there are an
FIGURE 6DESTINATION OF OUT-MIGRANTS FROM SELECT REGIONS AND SUB-REGIONS, 2015
9 349 766
81 788
16 420
40 228
850 355
732 416
2 925 690
2 434 879
NORTH AFRICA
318 252
1 141 431
7 654
140 735
21 339
4 166
156 241
MICRONESIA
MELANESIA
POLYNESIA
AFRICA OCEANIA
Migration within sub-region- Migration from sub-region to same continent- Migration to elsewhere in the world
19 963
1 668 190
MIDDLE AFRICA
1 355 508
SOUTHERN AFRICA
675 596
106 893
EASTERN AFRICA
4 442 305
2 376 482
WESTERN AFRICA
5 699 598
514 109
| 26 |
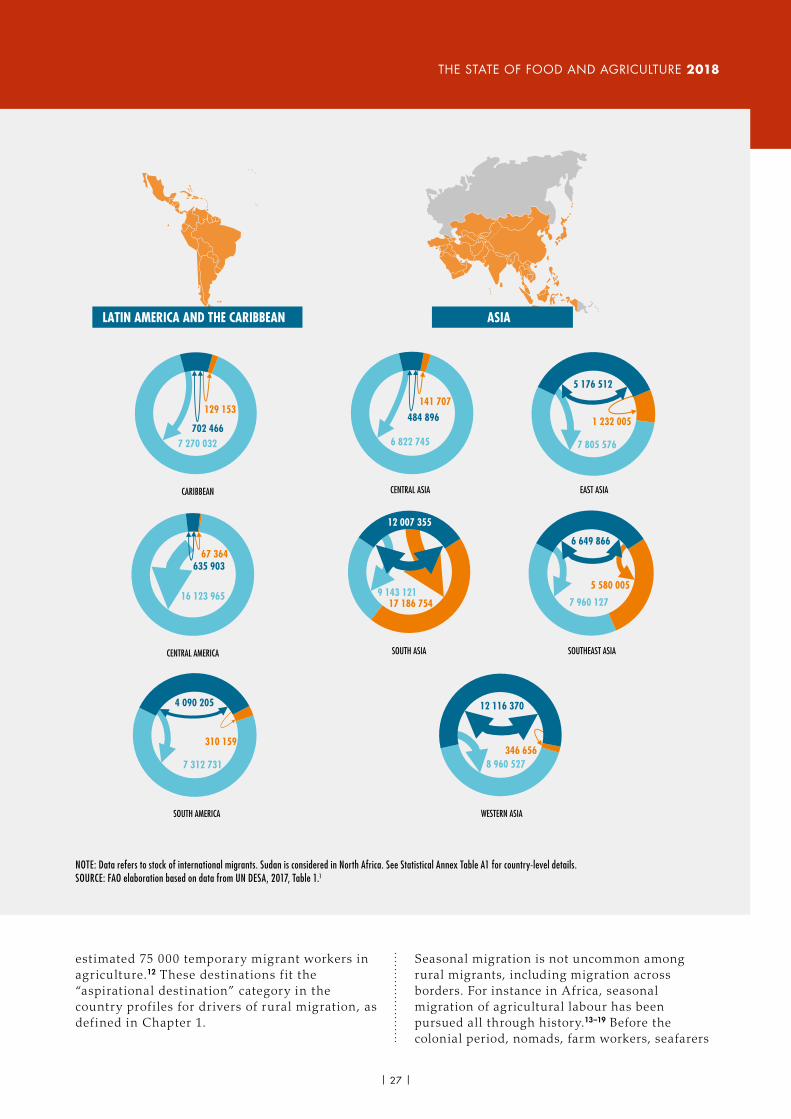
THE STATE OF FOOD AND AGRICULTURE 2018
estimated 75 000 temporary migrant workers in agriculture.12 These destinations f it the “aspirational destination” category in the country prof i les for drivers of rural migration, as def ined in Chapter 1.
Seasonal migration is not uncommon among rural migrants, including migration across borders. For instance in Africa, seasonal migration of agricultural labour has been pursued all through history.13–19 Before the colonial period, nomads, farm workers, seafarers
NOTE: Data refers to stock of international migrants. Sudan is considered in North Africa. See Statistical Annex Table A1 for country-level details.SOURCE: FAO elaboration based on data from UN DESA, 2017, Table 1.1
7 312 731
7 270 032 7 805 5766 822 745
9 143 121
8 960 527
16 123 965 7 960 127
LATIN AMERICA AND THE CARIBBEAN ASIA
SOUTH ASIA
CENTRAL ASIA
WESTERN ASIA
EAST ASIA
SOUTH AMERICA
CARIBBEAN
4 090 205
310 159
702 466
129 153
5 176 512
1 232 005484 896
141 707
12 007 355
17 186 754
12 116 370
346 656
CENTRAL AMERICA
635 90367 364
SOUTHEAST ASIA
6 649 866
5 580 005
| 27 |

CHAPTER 2 TRENDS AND PATTERNS OF RURAL MIGRATION
and traders migrated not only inside their own countries but also frequently crossed international borders, in the form of circular, seasonal, and short-term migration.20 Seasonal migration to the forest during the dry season has been most important and widespread in semi-arid areas.13 Sedentary farmers also used to migrate in search of supplementary income
during the slack dry farming season, moving from the drier interior onto the plantations (cocoa and coffee) of West Africa (in Côte d’Ivoire, Ghana, Guinea and Senegal) and also to the coastal farm estates of East Africa (for example, cotton and coffee in Uganda; pastoralism in Kenya and the United Republic of Tanzania).21 Today there are continued seasonal
0 10 20 30 40 50 60 70 80 90
Honduras (2013)
El Salvador (2009)
Ecuador (2010)
Dominican Republic (2010)
Costa Rica (2011)
Tajikistan (2013)
Kyrgyzstan (2013)
Albania (2012)
Nepal (2010-2011)
Bangladesh (2015)
Viet Nam (2009)
Philippines (2013)
Indonesia (2010)
Senegal (2009)
LATIN
AME
RICA
AND
THE C
ARIB
BEAN
SOUT
HERN
EURO
PE A
NDCE
NTRA
L ASIA
SOUT
H AS
IAEA
ST A
ND SO
UTHE
AST A
SIASU
B-SA
HARA
NAF
RICA
PERCENTAGE
International rural migrants Rural share of total population
FIGURE 7SHARE OF INTERNATIONAL MIGRANTS ORIGINATING FROM RURAL AREAS VS SHARE OF RURAL POPULATION IN NATIONAL POPULATION – SELECTED COUNTRIES
NOTE: For Bangladesh, number of migrants estimated from the Bangladesh Integrated Household Survey (2015), and the stock of international migrants from the United Nations Population Division (2015). Figures from the censuses computed from IPUMS reflect migration over the past five years. Percent of population in rural areas is from the World Development Indicators (2016) from the same year as migration data. Apart from data on Bangladesh, the original sources of which are explained above, the following are the original sources of data on other countries as reported in De Brauw (2017):10 for Albania: Albania LSMS, 2012; for Costa Rica: 2011 Census, via IPUMS (2017); for Dominican Republic: 2010 Census, via IPUMS (2017); for Ecuador: 2010 Census, via IPUMS (2017); for El Salvador: Encuesta de Hogares de Propósitos Múltiples, 2009; for Honduras: Census, 2013; for Indonesia: 2010 Census, via IPUMS (2017); for Kyrgyzstan: World Bank Jobs, Skills, and Migration Survey, 2013; for Nepal: Nepal Living Standards Survey III, 2010-2011; for Philippines: Philippines Labor Force Survey, October 2013; for Senegal: 2009 World Bank Migration and Remittances survey; for Tajikistan: World Bank Jobs, Skills, and Migration Survey, 2013; for Viet Nam: 2009 Census, via IPUMS (2017).SOURCE: de Brauw, 2017, Table 1.10
| 28 |

THE STATE OF FOOD AND AGRICULTURE 2018
migration f lows, a trend that is increasing across many regions in the world.22 In particular, the share of international migrants coming to f il l seasonal farm jobs is rising in many middle-income and high-income countries.23
Data from the MOOP Consortium on rural migrants from Bangladesh, Ethiopia and Zimbabwe – which considers seasonal migration as temporary or short-term moves of less than 12 months – show that the duration of this type of migration averages 5 to 7 months. According to this definition, 17 percent of international migrants from Bangladesh are seasonal migrants, while the share for Ethiopia is 16 percent and for Zimbabwe 39 percent ( Table 1). The relatively larger share for Zimbabwe could be attributed to its proximity to South Africa’s emerging economy. International seasonal migrants from rural Bangladesh and Zimbabwe tend to be male, while those from rural Ethiopia have a more balanced gender composition. International seasonal migration often happens through temporary visa work programmes for either high- or low-skilled occupations, for which agreements among countries provide a formal channel.24 n
INTERNATIONAL AND INTERNAL RURAL MIGRATION ARE CLOSELY LINKED International and internal migration can often be viewed as part of a single process. A migrant may initially move internally before then migrating internationally – or their path may be the opposite. International and internal migration can be substitutes or complements depending on the context, in particular in terms of the benefits, costs and risks associated with different types of migration. The following section compares the magnitude of international and internal migration, in particular from rural areas.
Data from the MOOP Consortium for selected countries show that rural migration destinations differ signif icantly by country and sometimes also by gender within countries (Figure 8). In Bangladesh most internal migration, especially of men, is towards the capital, while in Ethiopia, Indonesia and Zimbabwe internal movements are mostly to areas outside the capital. In the latter two countries, international migration is particularly important, but is largely directed to other countries in the same continent. For Bangladesh and particularly Ethiopia, the Near East is a key destination for international migrants. Gender plays a role in shaping migration, although the exact gender patterns differ by country. For example, the MOOP
TABLE 1SEASONAL MIGRANTS AS SHARE OF INTERNATIONAL AND INTERNAL RURAL MIGRANTS FOR SELECTED COUNTRIES
Bangladesh (2013) Ethiopia (2014) Zimbabwe (2015)
Percent
Seasonal migrants as share of international rural migrants 17 16 39
of which female 9 51 30
Seasonal migrants as share of internal rural migrants 47 17 38
of which female 23 39 28
NOTE: The table reports seasonal migration trends for each country, accounting for migrations of less than 12 months in duration, for international and internal migrants. SOURCE: Poggi, 201824 based on data from the MOOP Consortium.
| 29 |
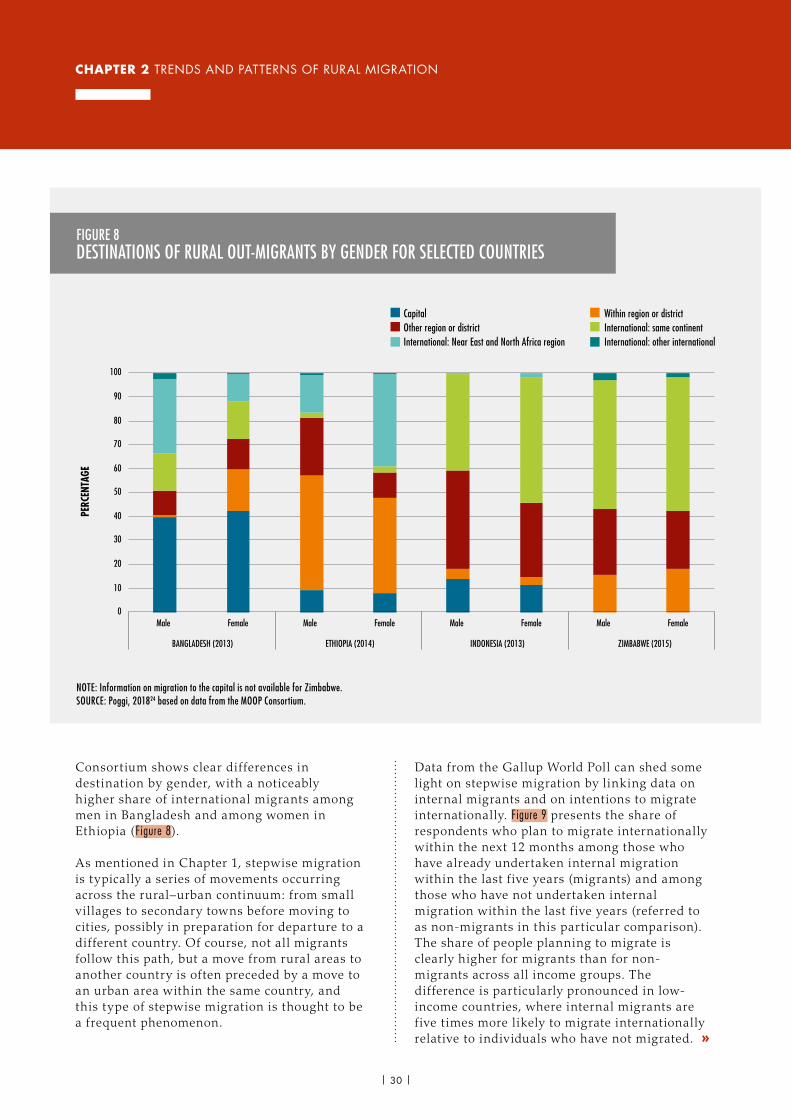
CHAPTER 2 TRENDS AND PATTERNS OF RURAL MIGRATION
Data from the Gallup World Poll can shed some light on stepwise migration by linking data on internal migrants and on intentions to migrate internationally. Figure 9 presents the share of respondents who plan to migrate internationally within the next 12 months among those who have already undertaken internal migration within the last f ive years (migrants) and among those who have not undertaken internal migration within the last f ive years (referred to as non-migrants in this particular comparison). The share of people planning to migrate is clearly higher for migrants than for non-migrants across all income groups. The difference is particularly pronounced in low-income countries, where internal migrants are f ive times more likely to migrate internationally relative to individuals who have not migrated. »
Consortium shows clear differences in destination by gender, with a noticeably higher share of international migrants among men in Bangladesh and among women in Ethiopia (Figure 8).
As mentioned in Chapter 1, stepwise migration is typically a series of movements occurring across the rural–urban continuum: from small v illages to secondary towns before moving to cities, possibly in preparation for departure to a different country. Of course, not all migrants follow this path, but a move from rural areas to another country is often preceded by a move to an urban area within the same country, and this type of stepwise migration is thought to be a frequent phenomenon.
0
10
20
30
40
50
60
70
80
90
100
Male Female Male Female Male Female Male Female
BANGLADESH (2013) ETHIOPIA (2014) INDONESIA (2013) ZIMBABWE (2015)
PERC
ENTA
GE
Capital Within region or districtOther region or district International: same continentInternational: Near East and North Africa region International: other international
FIGURE 8DESTINATIONS OF RURAL OUT-MIGRANTS BY GENDER FOR SELECTED COUNTRIES
NOTE: Information on migration to the capital is not available for Zimbabwe. SOURCE: Poggi, 201824 based on data from the MOOP Consortium.
| 30 |

THE STATE OF FOOD AND AGRICULTURE 2018
0
2
4
6
8
10
12
HIGH-INCOME COUNTRIES UPPER-MIDDLE-INCOME COUNTRIES LOWER-MIDDLE-INCOME COUNTRIES LOW-INCOME COUNTRIES
PERC
ENTA
GE
Migrants Non-migrants
Rural Urban
0
2
4
6
8
10
12
14
16
HIGH-INCOME COUNTRIES UPPER-MIDDLE-INCOME COUNTRIES LOWER-MIDDLE-INCOME COUNTRIES LOW-INCOME COUNTRIES
PERC
ENTA
GE
FIGURE 9SHARE OF PEOPLE PLANNING TO MIGRATE INTERNATIONALLY IN THE FOLLOWING 12 MONTHS BY COUNTRY INCOME GROUP AND BY INTERNAL MIGRANTS/NON-MIGRANTS, 2013
FIGURE 10SHARE OF INTERNAL MIGRANTS PLANNING TO MIGRATE INTERNATIONALLY IN THE FOLLOWING 12 MONTHS, BY RURAL AND URBAN AREA AND BY COUNTRY INCOME GROUP, 2013
NOTE: Based on nationally representative samples for 138 countries. Migrants refer to people who have migrated internally within the last five years and non-migrants to those who have not. See Statistical Annex Table A5 for details by country.SOURCE: FAO elaboration based on data from Gallup World Poll, 2017.25
NOTE: Based on nationally representative samples for 138 countries. See Statistical Annex Table A5 for details by country. SOURCE: FAO elaboration based on data from Gallup World Poll, 2017.25
| 31 |
CHAPTER 2 TRENDS AND PATTERNS OF RURAL MIGRATION
Figure 10 presents a rural–urban breakdown of the share of people planning to migrate internationally among those who have already undertaken internal migration over the last f ive years. Except for high-income countries, the share of internal migrants planning to migrate internationally within the following 12 months is higher in urban than in rural areas. However, the difference is very pronounced only in low-income countries. Rural–urban gaps in terms of income and access to services, and easier access in urban areas to information about opportunities abroad, may motivate potential international migrants in rural areas to move first to an urban centre. n
INTERNAL MIGRATION IS A GREATER PHENOMENON THAN INTERNATIONAL MIGRATION Estimating internal migrationHaving discussed the link between international and internal migration, this section investigates internal migration f lows in more detail. Internal migration is a significantly larger phenomenon than international migration. However, differences in data collection practices across countries – including differences in types of data collected, the intervals considered and the geographic units with reference to which migration is defined – make cross-country comparisons diff icult (Box 7). The following draws on available data from selected countries to shed some light on the dominant trends and patterns of internal rural migration.
Differences in methodologies and criteria result in a wide range of internal migration estimates. Considering movements between major regions (usually the first-level administrative subdivision) within each country, Bell and Charles-Edwards estimate that in 2005, 229 million people were liv ing in a different region of the same country compared to f ive
years before (i.e. f ive-year migrants). This corresponds to 3.7 percent of the relevant population iv – or a migration intensity of 3.7 percent.26 They also estimate that 763 million people were liv ing in a different region than their region of birth (life-time migration) but within the same country, corresponding to a migration intensity of 11.7 percent.
No less important are the geographical boundaries that, when crossed, define an individual as a migrant. While the criterion is clear in international migration, when dealing with internal migration different options present themselves. According to the Bell and Charles-Edwards estimates, considering major administrative units, the total number of internal life-time migrants in 2005 was four times the total stock of international life-time migrants of 190.5 million in the same year (based on UN DESA data). However, if moves between smaller administrative units are taken into account, the number is considerably larger. For example, in 2004 five-year internal migration in Morocco was estimated at 4.1 percent when only major administrative units were considered, but when movements within these units were added the share increased to 7.2 percent.5
Analysis carried out by Cattaneo and Robinson29 using data from Demographic and Health Surveys (DHS) for 31 countries indicates a life-time migration intensity of more than 50 percent – 58 percent of women and 56 percent of men – compared to the Bell and Edwards estimate of 12 percent for life-time migrants. This considerably larger number includes all movements within and between rural and urban areas, including rural–rural and urban–urban.29 Although the limited sample prevents a direct comparison of the DHS estimates against the Bell and Charles-Edwards numbers, coverage in Africa and Latin America – 19 and 6 countries respectively – is sufficient to venture a comparison. While Bell and Charles-Edwards estimate a life-time intensity of 13 percent for Africa and 20 percent for Latin America and the Caribbean, the lowest intensities recorded using DHS data were 32 and 36 percent respectively in these regions.
iv Or population at risk, calculated as 95 percent of the 2005 mid-year population.
»
| 32 |

THE STATE OF FOOD AND AGRICULTURE 2018
The average for countries in these two regions was over 50 percent. The sample used by Cattaneo and Robinson29 does not include China and India. However, for 2011 Chandrasekhar reports the number of migrants residing in India’s rural and urban areas to be 271 million and 183 million.30 For 2010, Démurger reports that approximately 225 million people are considered internal migrants in China.31 By combining the estimates for Africa and Latin America (obtained from Cattaneo and Robinson) and including only China, India, the Philippines and Viet Nam for the Asia region, we reach a conservative estimate of 1.3 billion internal migrants in total, from only a subset of countries in the developing world.
Data from the Gallup World Pollv allows the estimation of f ive-year internal migration for a large sample of countries (138) worldwide with the possibility of disaggregating the migratory f lows between those to rural areas and those to urban areas. However, these data do not show whether migrants are coming from rural or urban areas. For 2013, the five-year internal migration intensity is estimated at 10 percent globally, with 6 percent having migrated to urban areas and the remaining 4 percent to rural areas (Figure 11). This amounts to a total of more than 665 million people, almost three times the estimate by Bell and Charles-Edwards presented above. Migration
v The Gallup® World Poll (GWP) is an annual, nationally representative survey of individuals covering urban and rural residents from over 150 developing and highly-developed countries.
One fundamental problem in measuring internal migration is the absence of international statistical standards for its measurement, which are an essential pre-requisite for conducting cross-national comparisons and ensuring considerable homogeneity in the types of data collected across countries and the methods of collection across the world. Migration has spatial and temporal dimensions that must be pre-defined for any measurement exercise to have meaning. Thus the definition of migration used for statistical purposes must account for both distance and duration of movements.
The distance aspect is illustrated by Srivastava and Pandey, who estimated internal migration in India in 2001 to be equal to 119 million people when considering only inter-district moves. However, this number increased to 301 million after accounting for intra-district moves.27 Also, Rodríguez estimated internal life-time migration rates in Latin America and the Caribbean in 2000 to be 17.7 percent based on major administrative divisions and 35.2 percent based on minor administrative divisions.28 As regards the time dimension, the migration rates reported by the author were reduced to 4 percent and 8.7 percent respectively when only migration during the last five years was considered. However, even when data on migration between minor administrative units are obtained, cross-country comparisons remain problematic because the
size of administrative units at any level may vary substantially between countries; therefore, comparisons must be made with caution.
The difficulty in reaching comparable estimates of internal migration is exacerbated when rural migration is considered. In addition to distance and time, estimates of rural–urban, rural–rural, urban–rural, and urban–urban migration flows are also sensitive to how rural and urban areas are defined. The main source of UN urban population and urbanization data is national population censuses, and the UN Population Division uses primarily administrative criteria to define urban and rural populations. Country definitions of “urban” and “rural” vary widely, however. The great disparity in country definitions, and the fact that they change, hinders comparison of urban and rural population sizes across countries and consequently of the various migration flows.
One further challenge in measuring internal migration regards the fact that many migration flows are temporary or short term. This is the case for seasonal or circular movements, which are often not captured in national censuses and can only be measured through ad hoc, specifically targeted surveys. However, the lack of a widely accepted agreement on the exact definition or time-span of these temporary migration flows make the (already scarce) data on them barely comparable.
BOX 7CHALLENGES IN MEASURING INTERNAL MIGRATION
| 33 |
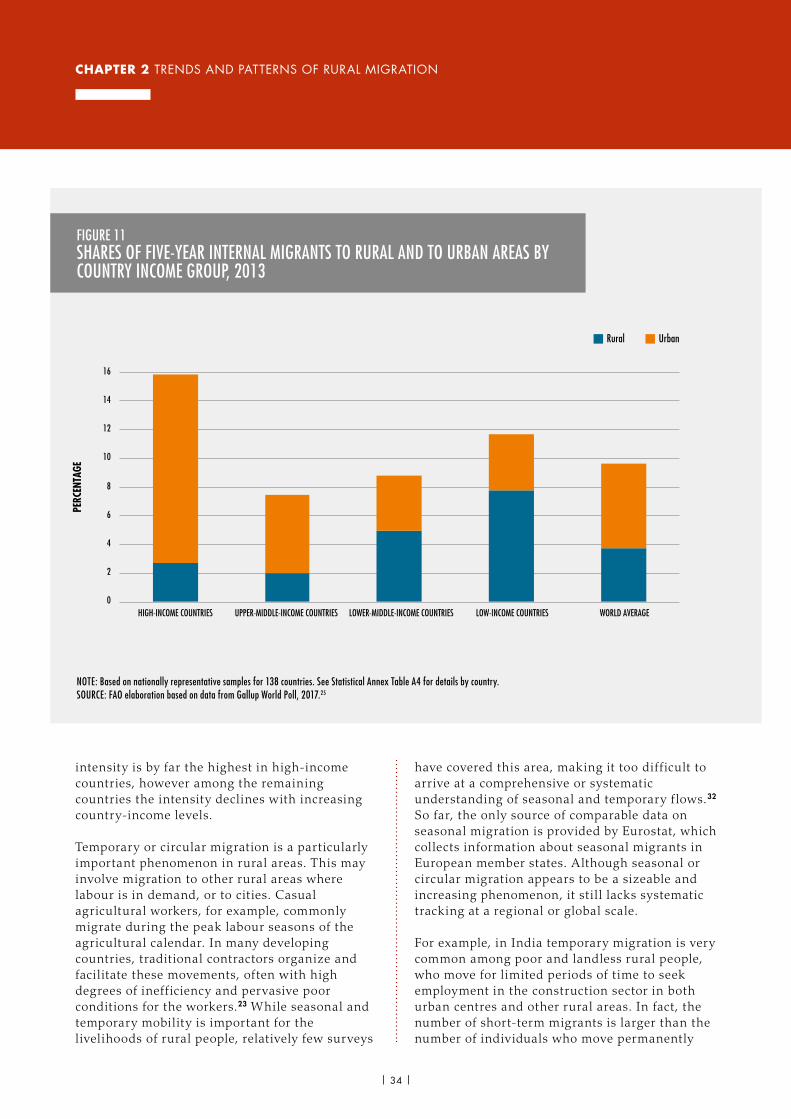
CHAPTER 2 TRENDS AND PATTERNS OF RURAL MIGRATION
intensity is by far the highest in high-income countries, however among the remaining countries the intensity declines with increasing country-income levels.
Temporary or circular migration is a particularly important phenomenon in rural areas. This may involve migration to other rural areas where labour is in demand, or to cities. Casual agricultural workers, for example, commonly migrate during the peak labour seasons of the agricultural calendar. In many developing countries, traditional contractors organize and facilitate these movements, often with high degrees of inefficiency and pervasive poor conditions for the workers.23 While seasonal and temporary mobility is important for the livelihoods of rural people, relatively few surveys
have covered this area, making it too diff icult to arrive at a comprehensive or systematic understanding of seasonal and temporary f lows.32 So far, the only source of comparable data on seasonal migration is provided by Eurostat, which collects information about seasonal migrants in European member states. Although seasonal or circular migration appears to be a sizeable and increasing phenomenon, it still lacks systematic tracking at a regional or global scale.
For example, in India temporary migration is very common among poor and landless rural people, who move for limited periods of time to seek employment in the construction sector in both urban centres and other rural areas. In fact, the number of short-term migrants is larger than the number of individuals who move permanently
Rural Urban
0
2
4
6
8
10
12
14
16
HIGH-INCOME COUNTRIES UPPER-MIDDLE-INCOME COUNTRIES LOWER-MIDDLE-INCOME COUNTRIES LOW-INCOME COUNTRIES WORLD AVERAGE
PERC
ENTA
GE
FIGURE 11SHARES OF FIVE-YEAR INTERNAL MIGRANTS TO RURAL AND TO URBAN AREAS BY COUNTRY INCOME GROUP, 2013
NOTE: Based on nationally representative samples for 138 countries. See Statistical Annex Table A4 for details by country. SOURCE: FAO elaboration based on data from Gallup World Poll, 2017.25
| 34 |

THE STATE OF FOOD AND AGRICULTURE 2018
during the year, when this is defined as being away for a period of 15 days to six months.30 An estimated 10 million households in rural India have at least one short-term migrant per year, and most are concentrated in regions known to have higher poverty rates by national standards.30 In South Africa, rural women are increasingly participating in the labour market, often by temporarily migrating within or near to their districts for work, for example in seasonal employment in the commercial farm sector.3 As illustrated in Table 1 above with data for selected countries from the MOOP Consortium, seasonal migrants represent 47 percent of internal migrants in Bangladesh, 17 percent in Ethiopia and 38 percent in Zimbabwe. These migrants tend to be mostly male, but with a somewhat higher share of women in Ethiopia. Mobile phone network data in Senegal for 2013 show that seasonal migration takes place mainly according to the agricultural calendar. Recorded migration f lows are very intense during the planting period from May to July, and also during the harvest period from October to December.33
Estimating patterns of internal rural migrationQuantifying the f lows of migration to, from or between rural and urban areas is as diff icult for internal migration as it is for international migration. As mentioned, estimates are sensitive to different definitions of migration, as well as of rural versus urban areas, across countries.34 To overcome the paucity of data some studies have attempted to estimate rural–urban migration indirectly from population and demographic data. For example, de Brauw, Mueller and Lee estimate net rural–urban migration in sub-Saharan Africa to have been very low between 1990 and 2000 and also point out the presence of urban–rural migration.35 Such an indirect estimate can only be made for net f lows, as counter-f lows are cancelled out by each other.
Following Young,36 Cattaneo and Robinson use data from the Demographic and Health Surveys (DHS) of the US Agency for International Development (USAID) to show patterns of various internal migration f lows.29 The DHS data are composed of in-depth, nationally representative household surveys that are neither systematic nor identical. They focus on
fertility and health in developing countries but also include substantial data on migration. Originally covering only women, the surveys were later updated to include men. The data cover the following: 1. what type of region (capital, city, town, or
countryside) survey respondents lived in prior to the age 12 and at the time of the survey;
2. whether they still l ive in the same locale as at the age of 12 or whether they moved, and if so from where (again from capital, city, town, or countryside).
Using the same approach as Young to reclassify regions into rural or urban – taking capital, city and town as urban, and countryside as rural – and considering only the countries and surveys where both questions were asked, a sample of 31 surveys/countries (one sample per country) was obtained. Using this sample, four types of internal migration were assessed: rural–rural, rural–urban, urban–rural, and urban–urban.29
For the countries being considered, over 50 percent of the population – 58 percent of women and 56 percent of men – have moved internally at least once. Figure 12 shows the incidence of different migration types in the overall male and female population. The blue colours refer to the share of the population that l ived in rural areas prior to the age of 12. The share of those having had a rural childhood is broken down into those who stayed in their rural areas of origin (dark blue), those who migrated from one rural area to another (medium blue), and those who migrated from a rural to an urban area (light blue). Similarly, the orange in the f igure represents the population liv ing in urban areas before the age of 12. This share is broken down into those who stayed in the same urban area (dark orange), those who migrated from one urban area to another (medium orange) and those who migrated from an urban to a rural area (light orange).
Some key features stand out for both men and women. More than half the population originating from rural areas undertook some form of migration. A larger share of the population migrated between rural areas (22 percent for men and 26 percent for women) than from rural to urban areas (16 percent for men and 17 percent for
| 35 |

CHAPTER 2 TRENDS AND PATTERNS OF RURAL MIGRATION
women). But the share of rural–urban migrants in the population is larger than the share of the population that migrated from urban to rural areas (8 percent for men and 6 percent for women). The latter relationship points to a net rural-to-urban migration f low of around 10 percent of the population for both men and women.
Migration patterns differ quite significantly by country, however. In all countries in the sample, net rural–urban migration was positive, although in line with findings by Lucas34 rural–rural migration is very important – and greater than rural-to-urban migration – in rural-dominated societies such as those in Asia and sub-Saharan Africa. These countries are mostly in one of the two “fragile contexts” categories of our typology, with some also in the “development momentum” category (as is the case for Burkina Faso and Bangladesh respectively in Figure 13). On the other hand, urban–urban migration as well as
rural–urban migration are more important in highly urbanized countries, such as those of Latin America and the Caribbean and in the Near East and North Africa (as shown by Brazil and Morocco in the same figure), which map more closely into the “transitioning countries” or “aspirational destinations” categories.
There is also considerable variation across countries in terms of the role of gender in determining migration patterns. In Figure 13 for example, there are significant gender differences in migration patterns in Burkina Faso and Bangladesh but not in Brazil. Generally, sharply different gender patterns seem to be found in South Asia, along with some – but far from all – African countries. In these instances, rural-to-rural migration tends to be significantly more prevalent among women than among men (see also Box 8 describing internal migration f lows in India). Meanwhile in some other countries women
Rural childhood − remained Rural childhood − migrated rural Rural childhood − migrated urban
Urban childhood − remained Urban childhood − migrated urban Urban childhood − migrated rural
33%
22%
16%
11%
10%
8%(A) ALL DHS: MALE
30%
26%
17%
12%
9%
(B) ALL DHS: FEMALE6%
FIGURE 12SHARE OF POPULATION THAT MIGRATED OR REMAINED BASED ON CHILDHOOD RESIDENCE AND CURRENT LOCATION – AGGREGATE FOR 31 COUNTRIES
NOTE: Countries included in the sample in alphabetical order together with the reference year of the relevant DHS survey: Bangladesh 2004, Benin 1996, Brazil 1996, Burkina Faso 2003, Cameroon 2003, Dominican Republic 2002, Egypt 2003, Ethiopia 2000, Haiti 2000, Jordan 1997, Kazakhstan 1999, Madagascar 2003/2004, Malawi 2004, Mali 2006, Morocco 2003/2004, Mozambique 2003, Namibia 1992, Nepal 2001, Nicaragua 2001, Niger 2006, Nigeria 1999, Paraguay 1990, Peru 2002/2003, Philippines 2003, Senegal 1992/1993, South Africa 1998, United Republic of Tanzania 1999, Togo 1998, Uzbekistan 1996, Viet Nam 2002, Zambia 1996. SOURCE: Cattaneo and Robinson, 201829 elaboration on DHS data based in Young, 2013.36
| 36 |

THE STATE OF FOOD AND AGRICULTURE 2018
tend to dominate all migration patterns. This is the case in Kyrgyzstan, where rural–rural migration is relatively low: in 2016 it represented only 18 percent of internal migration, compared to 44 percent for rural–urban migration, 22 percent for urban–rural migration, and 16 percent for urban–urban migration. All these f lows of internal migration were dominated by women, who made up 67 percent of Kyrgyzstan’s internal migrants in 2016.37 Although gender differences in migration are not necessarily present at lower development levels, it is noticeable that with development and an increase in urbanization gender differences in migration typically become smaller, possibly
reflecting a broader and more equal participation in the labour market as well as better information.
As the shares of different types of migrants shown above account for a considerable timespan (from the age of under 12 until the time of the survey, where the average age of those surveyed is about 35 years old), they conceal the possibility of multiple moves. Indeed, many people could have moved more than once and gone through intermediate migration steps before reaching their current area of residence. Estimating the share of migrants who moved once and more than once, respectively, provides an indication of
Rural childhood – remained
Rural childhood – migrated rural
Rural childhood – migrated urban
Urban childhood – remained
Urban childhood – migrated urban
Urban childhood – migrated rural
12%
64%
15%
2% 4% 3%
57%21%
13%
5%3% 1%
BANGLADESH
13%
9%
26%22%
27%
3%
BRAZIL
9%
12%
27%22%
26%
4%
FEMALE FEMALEMALE
FEMALEMALE FEMALEMALE
24%
15%
24%
21%
14%
2%
MOROCCO
53%33%
8%
2% 2% 2%
BURKINA FASO
35%
51%
8%
2% 2% 2%
Reference years for the DHS surveys: Bangladesh 2004, Brazil 1996, Burkina Faso 2003, and Morocco 2003/2004. SOURCE: Cattaneo and Robinson, 201829 elaboration on DHS data based in Young, 2013.36
FIGURE 13SHARE OF POPULATION THAT MIGRATED OR REMAINED BASED ON CHILDHOOD RESIDENCE AND CURRENT LOCATION – SELECTED COUNTRIES
| 37 |

CHAPTER 2 TRENDS AND PATTERNS OF RURAL MIGRATION
the incidence of stepwise migration (Figure 14). As in the preceding graphics, the blue sections refer to the population living in rural areas before the age of 12 and the orange sections to the population living in urban areas before the age of 12.
Based on the sample and using econometric analysis, Cattaneo and Robinson estimate that globally 33 percent of the male population stayed in rural areas of origin (dark blue), 22 percent originated in rural areas and moved once
In India, a predominantly rural country with more than 65 percent of the population classified as rural38 and high rates of internal migration, rural–rural migration streams represented 55 percent of total migration flows – almost 250 million people – for 2011, according to data from the Census of India. By comparison, rural-to-urban migration represented only 20 percent (90 million people). If only net rural–urban migration is considered, the share declines to 14 percent due to a flow of urban–rural migration equal to 6 percent. The shares of different migration flows have remained relatively stable over the three censuses for which data are currently available (see figure).
However, there are very distinct gender differences. For female migrants, rural-to-rural migration flows are dominant, with a share of 64 percent, while rural–urban migration represented only 16 percent in 2011. For men, rural–rural migration represented only 34 percent of migration flows and rural–urban flows were
30 percent, almost twice the share for women. The differences may be associated with different motivations for migration. According to data from the 2001 census, 65 percent of women’s migratory movements since the previous census were motivated by marriage (with the share reaching 78 percent for rural–rural migration) and only 3 percent by work/employment. For men, work/employment was the dominant reason for migration (38 percent and 50 percent in the case of rural–urban migration) while only 2 percent migrated for marriage. However, these shares refer to the total population who moved, including children and other dependents, who constitute 36 percent of male migrants and 23 percent of female ones.39 Indeed, the high rate of women migrating for marriage is quite specific to India, and more and more women are moving from rural areas for economic reasons (as discussed in Chapter 3).
BOX 8INTERNAL MIGRATION FLOWS IN INDIA
0
10
20
30
40
50
60
70
80
90
100
MALE FEMALE TOTAL MALE FEMALE TOTAL MALE FEMALE TOTAL
1991 2001 2011
PERC
ENTA
GE
Rural–rural Rural–urban Urban–rural Urban–urban
SHARES OF MIGRANTS IN INDIA, BY MIGRATION STREAM IN 1991, 2001 AND 2011
SOURCE: Chandrasekhar, 201730 based on data from the Census of India, 1991, 2001, and 2011.
| 38 |
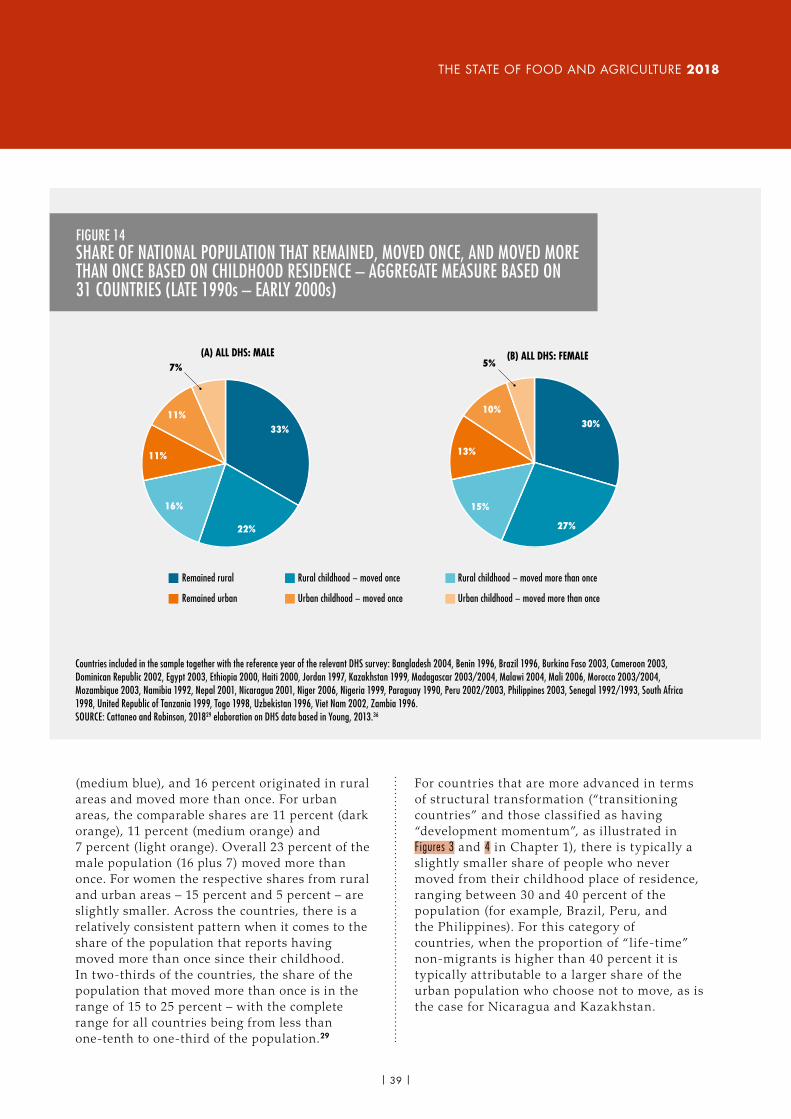
THE STATE OF FOOD AND AGRICULTURE 2018
(medium blue), and 16 percent originated in rural areas and moved more than once. For urban areas, the comparable shares are 11 percent (dark orange), 11 percent (medium orange) and 7 percent (light orange). Overall 23 percent of the male population (16 plus 7) moved more than once. For women the respective shares from rural and urban areas – 15 percent and 5 percent – are slightly smaller. Across the countries, there is a relatively consistent pattern when it comes to the share of the population that reports having moved more than once since their childhood. In two-thirds of the countries, the share of the population that moved more than once is in the range of 15 to 25 percent – with the complete range for all countries being from less than one-tenth to one-third of the population.29
For countries that are more advanced in terms of structural transformation (“transitioning countries” and those classif ied as having “development momentum”, as il lustrated in Figures 3 and 4 in Chapter 1), there is typically a slightly smaller share of people who never moved from their childhood place of residence, ranging between 30 and 40 percent of the population (for example, Brazil, Peru, and the Philippines). For this category of countries, when the proportion of “life-time” non-migrants is higher than 40 percent it is typically attributable to a larger share of the urban population who choose not to move, as is the case for Nicaragua and Kazakhstan.
Remained rural Rural childhood − moved once Rural childhood − moved more than once
Remained urban Urban childhood − moved once Urban childhood − moved more than once
(A) ALL DHS: MALE (B) ALL DHS: FEMALE
33%
22%
16%
11%
11%
7%
30%
27%
15%
13%
10%
5%
Countries included in the sample together with the reference year of the relevant DHS survey: Bangladesh 2004, Benin 1996, Brazil 1996, Burkina Faso 2003, Cameroon 2003, Dominican Republic 2002, Egypt 2003, Ethiopia 2000, Haiti 2000, Jordan 1997, Kazakhstan 1999, Madagascar 2003/2004, Malawi 2004, Mali 2006, Morocco 2003/2004, Mozambique 2003, Namibia 1992, Nepal 2001, Nicaragua 2001, Niger 2006, Nigeria 1999, Paraguay 1990, Peru 2002/2003, Philippines 2003, Senegal 1992/1993, South Africa 1998, United Republic of Tanzania 1999, Togo 1998, Uzbekistan 1996, Viet Nam 2002, Zambia 1996. SOURCE: Cattaneo and Robinson, 201829 elaboration on DHS data based in Young, 2013.36
FIGURE 14SHARE OF NATIONAL POPULATION THAT REMAINED, MOVED ONCE, AND MOVED MORE THAN ONCE BASED ON CHILDHOOD RESIDENCE – AGGREGATE MEASURE BASED ON 31 COUNTRIES (LATE 1990s – EARLY 2000s)
| 39 |

CHAPTER 2 TRENDS AND PATTERNS OF RURAL MIGRATION
A given individual or household may undertake multiple moves.vi By accounting for multiple movements made by the same individual or household, it is possible to calculate the share of moves that involve rural areas either as origin or destination. In the aggregate, for the countries being considered, for both males and females approximately 80 percent of moves involve a rural area (Figure 15). Regional differences exist, however: in sub-Saharan Africa, the lowest share of internal movements involving rural migration (in all its forms) is greater than 75 percent, while in other developing regions that have a higher urbanization rate, rural migration accounts for at least 50 percent of all internal movements.29
vi Based on the data, one can only estimate if people moved once or more than once. In Figure 15 the moves of individuals who moved three or more times are therefore undercounted. This may introduce a bias in our estimates if, for example, individuals who moved three or more times are moving predominantly between urban areas. However, given that the population that moved three or more times will be only a fraction of the 20–22 percent that moved more than once, the bias should be limited and not affect the relative magnitude of rural moves vis-à-vis purely urban-to-urban moves.
Another important dimension relating to rural migration is that of return migration. Among people who move more than once, a certain number return to their area of origin. The DHS data do not allow for assessing how many people return to their exact area of origin. However, it can be established whether someone who moved from a rural to an urban area (or vice versa) after childhood subsequently decided to go back to a rural (or urban area) area, even though it may not be their one of origin (Figure 16). This type of “return” migration can be quite substantial, especially in countries in relatively early phases of development (as for many countries in sub-Saharan Africa, as illustrated in Figure 16/A). It tends to be higher for people who moved from rural areas than those who moved from urban areas. In terms of gender differences, return migration to rural areas is higher for males than for females (Haiti, Kazakhstan, the Philippines and the United Republic of Tanzania being the sole exceptions). As countries transition to being more developed, return migration to rural areas
Rural–rural moves Rural–urban moves
Urban–urban moves Urban–rural moves
(A) ALL DHS: MALE (B) ALL DHS: FEMALE
32%
28%
23%
17%
43%
25%
20%
12%
SOURCE: Cattaneo and Robinson, 201829 elaboration on DHS data based in Young, 2013.36
FIGURE 15SHARE OF MOVES THAT ARE BETWEEN RURAL AND URBAN AREAS, INTRA-URBAN AND INTRA-RURAL
| 40 |

THE STATE OF FOOD AND AGRICULTURE 2018
decreases (as a share of those who migrated rural–urban) to about 10 percent or less (Bangladesh, Brazil, Kazakhstan, Nicaragua, the Philippines, Viet Nam), with the exception of Peru (21 percent for males and 17 percent for females).
There are gender differences in terms of return migration. In Burkina Faso, for example, 53 percent of males who moved from a rural to an urban area subsequently returned to a rural area. The comparable number for women is 34 percent. This corresponds to 6.5 and 3.4 percent respectively of the total male and female population. Burkina Faso is at the higher end of the spectrum in terms of the incidence of return migration; however, for a number of countries return migration to rural areas by males is in the
range of 25 to 45 percent of those who migrated from rural to urban areas at an earlier stage (Ethiopia, Malawi, Mali, Nepal, Nigeria, Togo and Zambia). Different explanations may exist for the high rates of return to rural areas for males in these countries. The data may be capturing circular migration, where the household stays in the rural area while the male household members move back and forth between the rural area of origin and urban areas. Alternatively, these people may be returning to rural areas after having found limited opportunities in urban areas, or to apply acquired skills to set up economic activ ities in rural areas. n
0 20 40 60
ZAMBIA
TOGO
UNITED REPUBLIC OF TANZANIA
NIGERIA
MOZAMBIQUE
MALI
MALAWI
MADAGASCAR
ETHIOPIA
CAMEROON
BURKINA FASO
BENIN
PERCENTAGE
(A) SUB-SAHARAN AFRICA – SELECTED COUNTRIES
0 20 40 60
VIET NAM
UZBEKISTAN
PHILIPPINES
PERU
PARAGUAY
NICARAGUA
NEPAL
MOROCCO
KAZAKHSTAN
JORDAN
HAITI
EGYPT
DOMINICAN REPUBLIC
BRAZIL
BANGLADESH
PERCENTAGE
(B) SELECTED COUNTRIES IN OTHER REGIONS
Male Female
Reference years for the DHS surveys: Bangladesh 2004, Benin 1996, Brazil 1996, Burkina Faso 2003, Cameroon 2003, Dominican Republic 2002, Egypt 2003, Ethiopia 2000, Haiti 2000, Jordan 1997, Kazakhstan 1999, Madagascar 2003/2004, Malawi 2004, Mali 2006, Morocco 2003/2004, Mozambique 2003, Nepal 2001, Nicaragua 2001, Nigeria 1999, Paraguay 1990, Peru 2002/2003, Philippines 2003, United Republic of Tanzania 1999, Togo 1998, Uzbekistan 1996, Viet Nam 2002, Zambia 1996. SOURCE: Cattaneo and Robinson, 201829 elaboration on DHS data based in Young, 2013.36
FIGURE 16SHARE OF RURAL–URBAN MIGRANTS WHO RETURN TO RURAL AREAS, BY GENDER
| 41 |

CHAPTER 2 TRENDS AND PATTERNS OF RURAL MIGRATION
MANY MIGRANTS ARE REFUGEES OR INTERNALLY DISPLACED PEOPLEA significant portion of migratory movements are caused by crisis situations in fragile contexts, as per the typology introduced in Chapter 1 (Figures 3 and 4). Over the last ten years, the world has been witnessing a sharp rise in crises due to acute climate events or armed conflicts (or a combination of the two), with large-scale implications for different patterns of migration. The number of internal conflicts has grown dramatically since 2010, with an increase of 125 percent for internal stateless conflicts and of 60 percent for internal conflicts where the state represents one party in the conflict.40 The effects of these crises are seen throughout many developing and developed countries and regions, causing an increase in the number of refugees, asylum-seekers and internally displaced persons (IDPs) (Box 9). This phenomenon is worth analysing in its own right, but for this report what is most striking is that important proportions of the refugee population and IDPs are found in rural areas.
According to UNHCR, in 2016 65.6 mill ion individuals were forcibly displaced worldwide as a result of persecution, conf lict, generalized violence and human rights v iolations. Of these, 40.3 mill ion were IDPs, 22.5 mill ion were refugees, and 2.8 mill ion were asylum seekers.44 The number of newly displaced individuals due to conf lict and persecution in 2016 was 10.3 mill ion. Children constituted half of the refugee population.44 The number of people displaced due to conf lict around the world was relatively stable until 2011. From 2011 to 2016, the number of displaced individuals – both refugees and IDPs – increased dramatically (by over 50 percent compared to 2011), coinciding with a new period of heightened polit ical instability and armed conf lict in the Near East – notably in Iraq, the Syrian Arab Republic and Yemen (Figure 17).
Among refugees and IDPs, protracted displacement – being displaced for at least three years – is an increasing problem. Data from
1978–2014 f inds that more than 80 percent of refugee crises last for ten years or more, with two in f ive lasting 20 years or more. At the end of 2014, two-thirds of all refugees, or 12.9 million people, were stranded in protracted displacement – a slightly lower proportion as a result of new refugees from the Syrian Arab Republic. In two-thirds of countries monitored for conf lict-induced displacement in 2014, at least 50 percent of IDPs had been displaced for more than three years.48
Rural populations often bear the brunt of the crisis situations that lead to forced displacement.
An individual who is forced to leave his/her home because of armed conflict, persecution, or natural and human-made disasters could remain within the borders of his/her country or search for protection abroad. In the first case, the individual is an IDP. In the second case, he/she usually applies for the status of refugee in a host country. The main difference between the two is that an IDP has no specific legal status, and thus may not claim any additional rights to those shared by his/her co-citizens. The status of refugee, on the other hand, is a legal status with specific rights and international protection.41 The notion of “refugee” as defined in the 1951 Geneva Convention Relating to the Status of Refugees refers to a person leaving his/her country of residence due to a “well-founded fear of being persecuted for reasons of race, religion, nationality, membership of a particular social group or political opinion”.i Natural disasters, or abrupt environmental and climatic events, are not covered by this definition.42,43 Similarly, individuals fleeing from extreme poverty are considered economic migrants and not refugees.
BOX 9REFUGEES AND INTERNALLY DISPLACED PERSONS (IDPs): BASIC CONCEPTS AND LEGAL IMPLICATIONS
i Geneva Convention Relating to the Status of Refugees, 189 UNTS 150, 28 Jul. 1951 (entry into force: 22 Apr. 1954), Art. 1 A(2).
| 42 |

THE STATE OF FOOD AND AGRICULTURE 2018
However, due to data limitations the current displacement estimates do not reveal to what extent refugees or IDPs were forced to leave rural areas. Nonetheless, as will be discussed further in Chapter 3, many of the countries affected by conf lict and protracted crises are largely rural, with the rural population amounting to over half of the total. For those in protracted crises, on average rural populations amount to 62 percent of the total population, although in some cases this can exceed 80 percent.40
The number of international refugees has increased over the last decadeInternational refugees represent a significant component of international migrants. According to the United Nations, after declining between
1990 and 2005 the number of international refugees increased again, reaching 25.3 million people in 2015 ( Table 2), corresponding to 10 percent of all international migrants. Both developed and developing regions have received higher numbers of refugees in recent years. However, the number of refugees hosted by developed countries is dwarfed by the number found in developing countries – 3.6 million versus 21.7 million people in 2015 (14.3 percent and 85.7 percent, respectively) – with the number of refugees in developing regions having doubled from 2005 to 2015. The increase in the number of refugees over the last decade has been mainly due to the steady rise in the number coming from Near East and North Africa and from sub-Saharan Africa, beginning in 2012 and 2013, respectively. Over one-half of the world’s
0
10
20
30
40
50
60
70
2000 2001 2002 2003 2004 2005 2006 2007 2008 2009 2010 2011 2012 2013 2014 2015 2016
MIL
LION
S
Refugees and asylum seekers Conflict-IDPs
NOTE: The estimates include individuals who were forcibly displaced worldwide as a result of persecution, conflict, violence, or human rights violations. The total number of displaced people of 65.6 million as of 2016 includes 17.2 million refugees under UNHCR’s mandate, 5.3 million Palestinian refugees registered by the United Nations Relief and Works Agency for Palestine Refugees (UNRWA), 2.8 million asylum seekers and 40.3 million internally displaced persons (IDPs). Due to changes in classifications and estimation methodologies in a number of countries, figures as of 2007 are not fully comparable with pre-2007 figures.SOURCES: FAO elaboration based on UNHCR 2017, Global Trends in Forced Displacement in 2016, Figure 1, and data from UNHCR 2017 Annex Table 2544 and UNHCR 2016, Global Trends in Forced Displacement in 2015,45 Annex Table 25 (years 2004 and 2005) for refugees and asylum seekers under UNHCR's mandate; UNRWA In Figures yearly publication (2000 to 2017)46 for Palestinian refugees; Internal Displacement Monitoring Centre (IDMC) Displacement Data website for conflict-IDPs.47
FIGURE 17TRENDS IN GLOBAL DISPLACEMENT DUE TO CONFLICT, 2000–2016
| 43 |

CHAPTER 2 TRENDS AND PATTERNS OF RURAL MIGRATION
refugees come from only three countries: the Syrian Arab Republic, Afghanistan, and South Sudan.44
The top ten countries hosting refugees are Turkey, Pakistan, Lebanon, the Islamic Republic of Iran, Uganda, Ethiopia, Jordan, Germany, the Democratic Republic of the Congo, and Kenya.44 Clearly, developing
countries carry the biggest burden of hosting displaced populations. At the end of 2016, Turkey, Lebanon, and Jordan were hosting 28 percent of all refugees worldwide, primarily from the Syrian Arab Republic.44 Lebanon hosts over 1 million refugees, most from the Syrian Arab Republic and a small number from Iraq.44 This means that in Lebanon, one in every six people is a refugee.
TABLE 2NUMBERS OF REFUGEES BY HOSTING REGION – 1990, 1995, 2000, 2005, 2010 AND 2015
Region of destination 1990 1995 2000 2005 2010 2015
Total numbers (million)
WORLD 18.8 17.9 15.8 13.3 15.4 25.3
Developed regions 2.0 3.6 3.0 2.4 2.0 3.6
Developing regions 16.8 14.2 12.8 10.9 13.3 21.7
NOTE: Refugee stocks are estimated at mid-year for both sexes. See Statistical Annex Table A6 for details by country.SOURCE: FAO elaboration on data from UN DESA, 2017, Table 6.1
0 20 40 60 80 100
CENTRAL ASIA (5)
LATIN AMERICA AND THE CARIBBEAN (32)
EUROPE (42)
NEAR EAST & NORTH AFRICA (22)
SOUTH AND SOUTHEAST ASIA (17)
SUB-SAHARAN AFRICA (43)
GLOBAL
PERCENTAGE
Rural Urban Unknown
NOTE: In the parentheses are the number countries for each region. Global estimate includes North America (2) and Oceania (8). See Statistical Annex Table A6 for details by country.SOURCE: FAO elaboration based on data from UNHCR, 2017,44 Annex Table 19.
FIGURE 18DISTRIBUTION OF REFUGEE POPULATION BY TYPE OF LOCALITY, GLOBALLY, AND BY SELECTED REGIONS, 2016
| 44 |

THE STATE OF FOOD AND AGRICULTURE 2018
No data are available on whether refugees originate from rural or urban areas, but information on the locality of settlement is available, albeit with some gaps. According to data from UNHCR, globally at least one-third of the refugee population in 2016 was found in rural areas (Figure 18). However, these averages mask large regional differences. In the Near East and North Africa, 84 percent of refugees are resettled in urban areas, while in sub-Saharan Africa 84 percent are found in rural areas.
Internally displaced people largely outnumber refugeesDespite the global attention on refugees and international migrants, IDPs outnumber refugees by a large margin (Figure 17). By the end of 2017 there were 40 million people displaced as a result of armed conflict and generalized violence.49 Of these, 11.8 million were new displacements in 2017 – almost double the 6.9 million in 2016. Most new displacements associated with conflict and generalized violence occurred in the Near East and sub-Saharan Africa. The Syrian Arab Republic and the Democratic Republic of the Congo ranked the highest in new displacements in 2017, with 2.9 million and 2.2 million respectively. For total displacements, the Syrian Arab Republic ranked the highest (more than 6.7 million) with Colombia second (more than 6.5 million).49
For people internally displaced due to disasters, protracted displacement is a huge problem, but estimates exist only for the number of new displacements. The total number of people displaced by natural disasters remains unknown due to diff iculties in collecting relevant data. However, the notion that displacement after a disaster is short-lived is a false assumption fostered by only occasional reporting of ongoing cases, such as the anniversary of a particular disaster.41 Between 2008 and 2017 more people were newly displaced by disasters brought on by sudden-onset natural hazards than by conf lict. Of the displacements induced by disasters in 2017, approximately 18 million were brought on by weather-related hazards and 700 000 by geophysical hazards.49 The likelihood of being displaced by a disaster increased by 60 percent from 1970 to 2014 and is expected to continue growing as a consequence of projected climate
change.50 Low-income countries usually bear the greatest disaster displacement risk – the highest risk is concentrated in f ive countries in South and Southeast Asia and the Pacific, which have high shares of vulnerable coastal populations coupled with relatively low capacity to invest in measures of both disaster risk reduction and assistance to IDPs.49
Whether displaced by conf lict or natural disaster, IDPs’ destinations can vary depending on a number of factors. However, data on such destinations are scarce and in many cases are unavailable due to the diff iculties encountered in tracing people’s mobility under such diff icult conditions. A study by FAO reports that in 2016 the rural areas of the Syrian Arab Republic hosted some 2 million IDPs, amounting to one-third of their total number that year.51 n
CONCLUSIONSThe trends and patterns of migration presented in this chapter reveal that these movements are much more nuanced and complex than their portrayal under the international spotlight would suggest. This chapter has challenged the most commonly-held perceptions of migration and presented new evidence revealing the intensity and significance of movements within countries, as well as the connections between internal and international migration. As we have shown, rural areas are well represented in internal and international migration, both as areas of origin and of destination.
The first major misconception is that international migration consists largely of movements from developing to developed countries. Since 2010, migration from developing to developing countries has surpassed migration from developing to developed countries. Furthermore, data show the importance of intra-regional migration in a majority of regions around the world. In this context, varying patterns of economic and social progress in developing regions will have an impact on future trends in international migration. In terms of magnitude of migration f lows, as highlighted in Chapter 1 the empirical evidence tends to show that economic development has thus far been
| 45 |

CHAPTER 2 TRENDS AND PATTERNS OF RURAL MIGRATION
associated initially with increasing levels of emigration, then followed by lower levels of out-migration only later, once countries have reached upper-middle-income status. The effect of development on future patterns of international migration will therefore depend on the point at which different countries f ind themselves in the process of economic development. Destinations are likely to evolve as they have done in the past. As countries develop, they may become aspirational destinations and regional hubs for receiving migrants. Looking forward, the role of transitioning countries with economic momentum as destinations for immigrants should not be ignored.
A key dimension in economic transformation is that of internal migration, which is often given short thrift especially as concerns migration to and from rural areas. Using Demographic and Health Surveys, this chapter has shown that in our sample of 31 developing countries, approximately 40 percent of the population moves internally, affecting rural areas (rural–rural, rural–urban and urban–rural migration). These movements can represent an asset in times of economic transformation, to the extent that labour is mobile enough to meet demand where it arises. The relative importance of rural–rural versus rural–urban migration evolves as countries transition in terms of their level of development, with rural–urban migration becoming more important as countries develop, urbanize, and diversify their economic activity. Another aspect to consider is that of return migration. In some countries, depending on gender, 30 percent or more of rural–urban migrants return to rural areas, with the number decreasing as countries develop.
Patterns of rural migration observed in the past will be important in informing policy-makers as they move forward in the coming decades. Population pressures in rural areas will continue to be a challenge and a potential driver of migration in certain regions, such as sub-Saharan Africa, where the rural population is projected to continue increasing dramatically, and South Asia, where the total rural population is not projected to decline significantly in the coming decades. For these regions, and in particular for sub-Saharan Africa, these rural demographic trends
represent a major challenge for economic development and employment generation, which are essential conditions for achieving the SDGs of ending hunger and poverty by 2030. Progress in rural development and employment creation –necessary for achieving the SDGs – will certainly have major repercussions on future patterns of rural out-migration.
As this chapter has demonstrated, internal and international migration are not separate processes. Surely individuals may decide to migrate from their place of birth directly to an international destination, for example if they have an existing support network at destination. However, data appear to indicate that migration is often stepwise. Before investing in an international move, a f irst step may be to move internally, for example from a rural to an urban area. Findings from the Gallup World Poll show that across all country income groups, individuals who have migrated internally are more inclined to move abroad than those who have not (Figure 9). Among internal migrants, in all but the high-income country grouping more urban internal migrants are planning to move abroad than rural internal migrants (Figure 10). These interconnections are important for migration f lows and for the path of economic development that countries undertake, as they affect the allocation of human resources inside and outside national borders, as well as remittances coming from migrants liv ing abroad.
This chapter has discussed how significant levels of forced migration – both by refugees and IDPs – are driven by crisis situations, including conf licts and natural disasters, both of which are on the rise. In some instances, migration is driven by slow-onset crises, such as cases of environmental degradation. The World Bank projects that the slow-onset impacts of climate change could force just over 143 million people in sub-Saharan Africa, South Asia, and Latin America to migrate within their own country by 2050.52 How crisis situations will shape future patterns of migration is impossible to foresee. One growing concern is that conf licts, resource scarcity, and advancing climate change will lead to an increase in f lows of internal and international migration in the future.
| 46 |

THE STATE OF FOOD AND AGRICULTURE 2018
It is impossible to understand the trends and patterns of migration without recognizing the gradual transformation of rural and urban spaces, a process that is ongoing and expected to continue. Most debates in economic development have treated rural and urban spaces as dichotomous, and mainly propose separate agendas and priorities for the two. This view does not allow for a comprehensive understanding of the increasingly complex interactions between areas and people across the rural–urban continuum. Neither does it ref lect the changing urbanization landscape, which has been blurring the divide between rural and urban spaces, chief ly through the increasing role of small cities and rural towns in recent urbanization trends, and facilitated by the development of transportation and communication infrastructure. This means that previous longer-term migratory movements
between rural and urban areas are increasingly being replaced by the mobility of people across this rural–urban continuum. Thanks to improved transportation networks more people are commuting, while seasonal migration is becoming more prevalent. These changing patterns call for a more nuanced understanding of the diversity that exists across the rural–urban spectrum, in order to achieve the balanced and integrated spatial planning and policies required to effectively achieve sustainable and inclusive rural development.53
The issues described above summarize the potential scenarios that will play out in the coming decades. To address the different dimensions of these scenarios, the following chapters look at the drivers of rural migration and the impacts that migration has on areas of both origin and destination. n
| 47 |
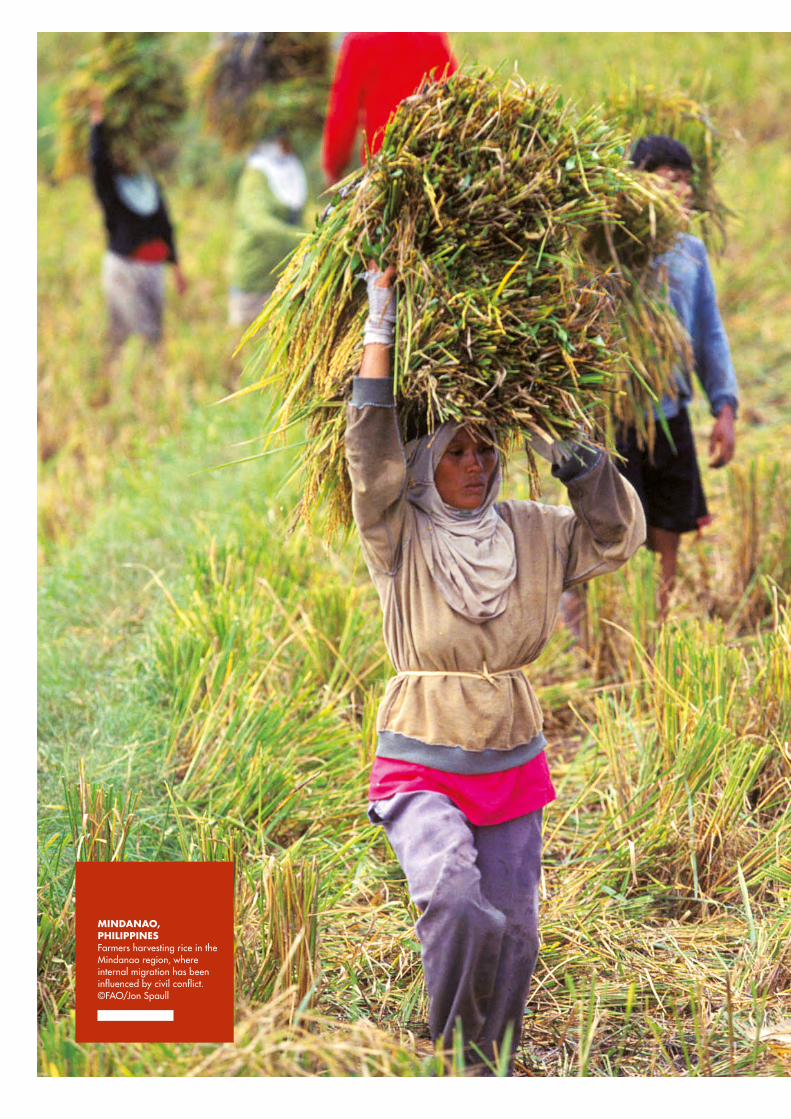
MINDANAO, PHILIPPINESFarmers harvesting rice in the Mindanao region, where internal migration has been influenced by civil conflict.©FAO/Jon Spaull

Key messages
1Rural migration is driven by unequal opportunities, often due in part to the
structural transformation of economies.
2 Rural migration is also driven by natural resource constraints and
environmental factors, often in combination with demographic pressures.
3Migrants tend to be younger and better educated than non-migrants. It is
common to see distinct gender patterns of rural migration by country, although they tend to diminish as countries develop.
4 Rural people typically face higher constraints to migration due to poor
infrastructure, lack of financial means and lack of information, with the poorest the least likely to migrate.
5 Under slow-onset environmental stressors, rural out-migration can be a
risk-management or adaptation strategy, albeit one that is not generally available to the poorest.
6 Protracted crises affect migration drivers by worsening conditions in
areas of origin and by facilitating migration through new diaspora networks and humanitarian interventions.
CHAPTER 3WHAT DRIVES
RURAL MIGRATION:
DETERMINANTS, CONSTRAINTS
AND MIGRANT CHARACTERISTICS

As indicated in Chapter 1, migration within and between territories, regions and continents has always been an important factor in the transformation of human societies from agriculture-dominated communities towards more industrialized economies and urbanized societies. Historically, the development of agricultural technologies allowed for a gradual release of human resources. Attracted by the growth of manufacturing and services, mostly located in urban areas, large numbers of people have chosen to migrate in search of new opportunities. This continuous process of rural–urban migration has been one of the factors fuelling economic development.
However, in certain circumstances migration is not a choice but the result of conditions that have rendered it impossible for people to sustain their livelihoods where they live. Poverty and food insecurity – often brought on by armed conf licts or other types of crises – as well as exposure to natural disasters or adverse environmental conditions continue to drive large-scale migration f lows.
This chapter discusses the different motivations – or “drivers” – for rural migration, from broader economic differentials to the various demographics of individual migrants and their households. It also looks at the constraints that might prevent people from migrating in spite of worsening conditions at home, as well as the effect of protracted crises on their decisions to migrate. n
CONCEPTUAL FRAMEWORK FOR MIGRATION DRIVERSMigration drivers can be defined as the forces that engender and perpetuate migration f lows.1 Building on Lee’s push-pull model and on its further extensions, in particular those articulated by Van Hear, Bakewell, and Long,1 this section develops a comprehensive framework for explaining rural migration drivers. Some of these drivers may be external to prospective migrants, involving structural and institutional factors that create the incentives to migrate and that enable or constrain people’s movements. In this case, drivers create the conditions under which people decide whether to move or stay.1
Migration is also driven by people’s agency (their ability to make and act on their own free choices), how they process information and social experiences, and their ability to improve their life conditions or cope with life challenges – even under coercive circumstances.1,2 These individual and collective capabilities and capacities,3 which are shaped by socio-economic characteristics such as age, gender, wealth, and education, ref lect the extent to which people can exert agency and take advantage of emerging opportunities both in their areas of origin and/or elsewhere.
The framework presented and discussed in this section builds on the celebrated Lee model of push-pull factors. However, it emphasizes that push and pull factors do not work in isolation in the decision-making process of prospective migrants, unless people are under extreme conditions (Box 3). The incentive to migrate is therefore created by the differentials in
CHAPTER 3
WHAT DRIVES RURAL MIGRATION: DETERMINANTS, CONSTRAINTS AND MIGRANT CHARACTERISTICS
| 50 |
THE STATE OF FOOD AND AGRICULTURE 2018
conditions between areas of origin and potential destinations. For instance, lack of employment opportunities in a given area of origin can push people to migrate only if employment is available at a potential destination. A similar reasoning applies to differentials in quality of the environment, education facilities and other services. Potentially important factors driving rural–urban migration include differentials between rural and urban areas in terms of: poverty, food security, productivity, employment opportunities, impacts of climate-related events, and access to markets (infrastructure) – including capital markets –as well as to services and education.
While the above-mentioned differentials – hereafter referred to as macrofactors – may well determine the desire to migrate, migration decisions are also affected by a set of intermediate conditioning factors that can either constrain or facilitate migration. A typical constraint is the distance between the destination and origin and the cost of migrating, which tends to be higher the greater the distance is to be travelled. This tends to favour migration between locations that are in close proximity, particularly for poor households who cannot afford the cost of international or long-distance migration. There may also be physical or legal constraints to migration, the latter typically restricting international movements. Other conditioning factors can facilitate migration, such as the presence of recruitment agencies at the origin or social networks at the destination. These can help overcome bureaucratic procedures and obstacles, provide information, and assist in f inding housing and jobs, among other things. Conditioning factors may also push people who, based only on macrofactors, would not otherwise have migrated. For example, institutional and market failures leading to lack of access to credit
in rural areas could convince some households to send a family member to the city to f inance investments in the farm through remittances.
The two sets of migration drivers discussed above are both largely external to the actors. Yet migration decisions are ultimately made by individuals or households, and thus depend on personal factors, hereafter referred to as microfactors. No two potential migrants perceive macrofactors or interact with conditioning factors in the same way, as they have unique individual, household and even community capabilities and capacities. Therefore, age, gender, education and other factors matter, and when the decision to migrate is made collectively by the whole household, the characteristics of the household also matter, such as the number of youth and the gender and power distribution within the household. Furthermore, previous migration by a household member may affect other household members’ future decisions to migrate.
Macrofactors can have differing impacts on various social groups according to gender, age, wealth, language, and personal considerations. For example, the establishment of a new university in a small town may increase rural–urban migration to that town, mainly by youth1 who are generally more inclined than older people to migrate. People with higher levels of education also tend to migrate more, typically towards areas experiencing growth in formal job opportunities that require skilled labour.
Figure 19 i l lustrates the framework and how macrofactors, intermediate conditioning factors and microfactors interact, leading to a decision to migrate or to stay. On the left side of the diagram, a range of macrofactors – differential conditions in locations of origin and potential destination – create the incentives to migrate
| 51 |

CHAPTER 3 WHAT DRIVES RURAL MIGRATION: DETERMINANTS, CONSTRAINTS AND MIGRANT CHARACTERISTICS
voluntarily. Intermediate conditioning factors act to increase or reduce these incentives and/or the ability to migrate, i.e. they either facilitate or constrain people’s mobility, and hence they determine the financial costs of migration, as well as the social, cultural and physiological costs. In the end, migration decisions are based on people’s interactions with external factors as well as on their individual and household characteristics, including age, gender, education level, wealth, employment status, household composition, distribution of power within the household, and personal preferences.
Voluntary migration is therefore driven by the interaction between migration incentives, costs and potential migrant characteristics. While the combination of macrofactors and the intermediate conditioning factors determines the pool of potential migrants, i.e. those who consider migration as one option among others, individual and household characteristics (microfactors) determine those who eventually overcome constraints to migration and/or take advantage of facilitating factors. This is why actual migrants are far fewer than potential migrants, as shown in Box 10. »
MIGRATION DRIVERS: A CONCEPTUAL FRAMEWORK
MIGRANTS
POTENTIAL MIGRANTSWHO DECIDE TO STAY
MIGRANTS
POTENTIAL MIGRANTSWHO DECIDE TO STAY
MACROFACTORS
Differentials in:•Economic opportunities and well-being, socio-political conditions
INTERMEDIATE CONDITIONING
FACTORS
MICROFACTORS
Macrofactors create incentives to migrate that may be restricted or eased by conditioning factors, but migration decisions are ultimately made by individuals and households.
Shocks due to protracted crises affect the sphere of influence of each driver.
Only part of total population would consider migration as a viable strategy, but an even smaller portion would actually migrate.
Under protracted crises, the pool of potential migrants increases and so do the migration flows.
• CONFLICTS
• ENVIRONMENTAL DEGRADATION
• NATURAL HAZARDS
• FOOD CRISES
•Network & diaspora•Institutions & laws•Local factor market failures•Discrimination based on gender, ethnicity, religion, etc.
•Personal characteristics and preferences: age, gender, education, marital status, risk preferences
•Demographics•Environment•Risk differences between economic activities
•Distance/moving costs•Technology
•Household characteristics: wealth, religion, ethnicity, language
FIGURE 19RELATIONSHIP BETWEEN MIGRATION DRIVERS AND POOLS OF ACTUAL AND POTENTIAL MIGRANTS
SOURCE: FAO.
| 52 |

CHAPTER 3 WHAT DRIVES RURAL MIGRATION: DETERMINANTS, CONSTRAINTS AND MIGRANT CHARACTERISTICS THE STATE OF FOOD AND AGRICULTURE 2018
The Gallup® World Poll (GWP) is an annual, nationally representative survey of individuals, covering urban and rural residents from over 150 developing and developed countries.4 The GWP data include several questions related to international migration, of which two are relevant to the conceptual framework presented in Figure 19. The first one expresses a desire to migrate and asks, “Ideally, if you had the opportunity, would you like to move permanently to another country, or would you prefer to continue living in this country?” The second question, which is asked only to those who answered “yes” to the previous one, asks, “Are you planning to move permanently to another country in the next 12 months, or not?”
Broadly speaking and with reference to the conceptual framework, the first question measures potential migrant status (represented by the blue bubbles in Figure 19), while the second question can be taken as a rough proxy of actual migrants. It could be that some of those who plan to migrate in the following 12 months may not end up migrating, or at least not during that specified time frame. However, migration planning in a specific and relatively short time frame indicates that a migration decision has been taken.
The figure shows the shares of the total population of those who answered “yes” to the first question (represented by the entire columns), by country income group. This is in turn split relative to the answers to the second question: those who answered “yes” are shown in orange and those who said “no” are shown in blue.
The data in the figure confirm the conceptual framework presented in Figure 19. Although all people,
living in any location, are exposed to the same macrofactors and conditioning factors, they perceive these differently (due to differences in socio-economic and demographic characteristics at individual and household levels), and thus only a portion of them will consider migration as a viable option to improve their livelihoods and living conditions. The figure also shows that low-income countries have the highest shares of potential migrants (27 and 35 percent of rural and urban populations respectively), reflecting larger differentials between local conditions and potential destinations compared to other country income groups. Another interesting observation is that the shares of potential migrants are higher in urban areas than in rural areas across income groups, which may reflect urban dwellers’ greater access to information affecting their perceptions of alternative opportunities abroad.
The picture becomes considerably different when looking at shares of those who are actively planning to migrate: these shares are much smaller, reflecting the complex considerations and consequent costs of transitioning from migration as an option (among other options) to the decision to migrate. The large differences between the shares of those desiring to migrate and those actively planning to migrate reflect how only a small proportion of potential migrants are empowered to overcome migration constraints and to take advantage of facilitating conditions. In this regard, individual and household characteristics, including education, wealth, and access to information, must be a factor in influencing migration decisions.
BOX 10INTERNATIONAL MIGRATION: FEW POTENTIAL MIGRANTS ENVISION MIGRATING WITHIN A YEAR
SHARES OF POTENTIAL MIGRANTS OVER TOTAL POPULATION, SPLIT BETWEEN THOSE WHO ARE ACTIVELY PLANNING TO MIGRATE INTERNATIONALLY AND THOSE WHO ARE NOT, BY COUNTRY INCOME GROUP – AVERAGE IN 2013
0
5
10
15
20
25
30
35
40
Rural Urban Rural Urban Rural Urban Rural Urban
HIGH-INCOME COUNTRIES UPPER-MIDDLE-INCOME COUNTRIES LOWER-MIDDLE-INCOME COUNTRIES LOW-INCOME COUNTRIES
PERC
ENTA
GE
Potential migrants who are notplanning to leave within a year
Potential migrants who planto leave within a year
NOTE: See Statistical Annex Table A4 for country-level data.SOURCE: FAO elaboration based on data from Gallup® World Poll, 2017.4
| 53 |

CHAPTER 3 WHAT DRIVES RURAL MIGRATION: DETERMINANTS, CONSTRAINTS AND MIGRANT CHARACTERISTICS
The lower-left portion of Figure 19 l inks each of the three categories of drivers to an associated share of the population in question. A share of the population (shown in dark blue) perceive an incentive to migrate due to macrofactors. Another share of the population (in light blue) would be able to migrate because they are facilitated, or at least not constrained, by intermediate conditioning factors. This share of the population may overlap only partially with those perceiving an incentive to migrate due to the differentials between conditions of origin and destination, as some people may be induced to migrate simply by conditioning factors such as credit market failures in rural areas. Finally, a subset of the people who would be able to migrate actually decide to do so based on their individual or household characteristics. This share of the population (shown in green) represents the actual migrants. It should be emphasized, however, that individual and household characteristics simultaneously affect not only migration decisions, but also the way in which people perceive opportunities and constraints to migration (as clarif ied in Box 10).
The right-hand portion of Figure 19 i l lustrates the effect of protracted crises within this conceptual framework. While the basic framework remains valid, a protracted crisis, whether due to natural disasters or armed conf licts, represents an external shock that inf luences the drivers at all three levels – macro, intermediate and micro. This is the case for fragile and conf lict-affected states in the country profiles in Figures 3 and 4. In addition to being under direct physical threat, people in such situations still perceive macrofactors (i.e. differentials between areas of origin and potential destination) as an incentive to migrate, but these differentials widen dramatically as the crisis reduces opportunities and worsens services in the area of origin. At the same time, the crisis modifies existing intermediate conditioning factors and creates new ones. For example, new diaspora networks might be established and the crossing of borders may become easier due to, inter alia, the efforts of humanitarian agencies and the establishment of institutions to deal with the crisis. Finally, the considerations of the same individuals and households and their possible acceptance of migration as a livelihood strategy change when
they face protracted crises. As a consequence of the impacts of the crisis on the drivers at all three levels, the pool of potential migrants increases along with, ultimately, migration outf lows.
However, it should be emphasized that the various levels of migration drivers il lustrated in Figure 19 do not work in isolation from each other; rather, they work in combination, forming “driver complexes” that shape the specific form and structure of population movements observed in specific contexts. In these cases, drivers operate as more than the sum of the individual drivers.1
The following three sections discuss the theoretical foundations and empirical evidence on each set of drivers: macrofactors, intermediate conditioning factors, and the microfactors, i.e. individual and household characteristics. The discussion focuses on rural areas, shedding light on how these drivers can act differently for agriculture or rural populations. A fourth section focuses on the impacts of protracted crises on the other migration drivers and on the consequent migratory f lows, particularly from rural areas. n
MACROFACTORS CREATE INCENTIVES FOR RURAL MIGRATIONThe macrofactors described in Figure 19 create the fundamental incentives for migration. They include differences in several categories of factors. With respect to rural migration, key factors are differences in employment opportunities between agriculture and other sectors and the seasonality of agricultural activ ities. Other categories include the availability of social services, such as (but not limited to) education and health facilities, which tend to be of lower quality in rural than urban areas. Differentials in demographic density and composition and natural resource endowments are also factors, as they substantially affect rural livelihoods.
»
| 54 |

CHAPTER 3 WHAT DRIVES RURAL MIGRATION: DETERMINANTS, CONSTRAINTS AND MIGRANT CHARACTERISTICS THE STATE OF FOOD AND AGRICULTURE 2018
Rural migration is primarily driven by differentials in wages and employment opportunitiesInternal rural–urban migration is mostly driven by economic differentials within the broader process of structural transformation. Productiv ity differences and corresponding income and employment gaps between agriculture and other sectors of the economy (such as manufacturing and services) result in rural–urban migration, leading to increased urbanization and declining shares of agriculture in GDP and employment.5
Historically, development paths characterized by fast growth rates in non-agricultural sectors have resulted in robust rural–urban migration f lows. For example in China, large rural–urban income gaps have been the major incentive for rural workers to migrate to cities.6,7 Based on in-depth interviews conducted in 2007 with migrant workers in Guangzhou, China, it was found that high wage differentials between non-agricultural and farm activities was a major motivating factor for those exiting agriculture and migrating to cities.8
The unequal distribution of employment opportunities between rural areas and urban centres is also a strong motivation for rural–urban migration. Data from South Africa’s National
Income Dynamics Survey show a significant increase in employment due to migration to urban centres, compared to the situation among people who remain in rural areas (see Table 3). Among people who were economically inactive or unemployed in 2008 and remained in rural areas (rural non-migrants), only 27 and 41 percent respectively became employed in 2014. These shares are much higher for those who migrated to urban centres, amounting to 59 and 76 percent in 2014, respectively. By the same token, a total of 40 percent of rural non-migrants who were employed in 2008 became economically inactive or unemployed in 2014, compared to only 21 percent among those who migrated.
There are large differences in labour returns between sectors in developing countries, so that moving labour and resources from low-productivity activ ities to others with higher returns can be an important engine of growth as overall productivity rises and incomes expand.9 Across countries, returns to agriculture are consistently lower than other sectors. With rapid economic growth, the gap in returns between rural and urban areas tends to be the most powerful incentive for internal migration. For example in Asia, as agricultural productivity growth during the Green Revolution freed up labour, followed by the development of industrialized urban areas, this prompted large movements of people from rural areas into cities in the late 1970s.10
TABLE 3PERCENTAGE CHANGE IN EMPLOYMENT STATUS FOR RURAL–URBAN MIGRANTS AND RURAL NON-MIGRANTS BASED ON PREVIOUS STATUS – SOUTH AFRICA, 2008–2014
2014
Rural non-migrants Rural–urban migrants
Economically inactive
Unemployed Employed Economically inactive
Unemployed Employed
2008
Economically inactive 49 24 27 23 18 59
Unemployed 35 25 41 14 10 76
Employed 31 9 60 14 7 79
NOTE: Rural non-migrants refers to individuals living in a rural household in 2008 who either did not change their place of residence or who moved to a new place of residence that was still in a rural area. SOURCE: National Income Dynamics Study Waves 1 (2008)11 and 4 (2014)12 as presented in Daniels et al., 2013.13
| 55 |

CHAPTER 3 WHAT DRIVES RURAL MIGRATION: DETERMINANTS, CONSTRAINTS AND MIGRANT CHARACTERISTICS
However, in many countries in the regions of South Asia, sub-Saharan Africa, and the Near East and North Africa, increased urbanization has not been associated with sustained growth in labour-intensive manufacturing and associated services.14 As a consequence, growth in non-farm sectors has not been sufficient to keep pace with population growth or societal needs, and thus rural–urban migration has been slow in spite of the lower returns to labour in agriculture and rural areas compared to other sectors. This is the case for several developing countries across the world, such as Egypt, India and many countries in sub-Saharan Africa.15-17
Nevertheless, due to a lack of opportunities in rural areas, rural out-migration will l ikely continue to accelerate. In sub-Saharan Africa for instance, the share of rural youth in vulnerable employment (i.e. own-account work or contributing family work) ranges from 68.1 percent in Zambia to 93.7 percent in Benin.18 This is one reason why, in rural economies, youth are the most likely to migrate to urban areas in response to the lack of remunerative employment or entrepreneurial opportunities in the agricultural sector.14 The development paths in these countries are also giving rise to increased levels of survival migration from rural areas (Figure 1); in these instances, rural people leaving agriculture move mostly into low-productivity informal service jobs and risk joining the already growing numbers of urban poor.
Income differentials between countries are also the primary engine of international migration. Evidence shows that in the 2002–2006 period the probability of migrating from Mexico to the United States of America increased by 2.5 percentage points due to the increase in the average wage differential by 100 percentage points.19 In the case of Ecuador, a study on drivers of international migration found that differentials in earnings significantly shape individual migration decisions. For example, between 1999 and 2005 a 10 percent increase in expected earnings in the United States of America was associated with a 17 percent increase in the probability of migrating there from Ecuador.20
Differentials in public and social services also drive rural out-migrationIn rural areas of developing countries, the lack of social services is often an incentive to migrate. Transport services, processing and storage facilities are often poor, and rural communities and farming households are disconnected, at least partially, from input and output markets. The availability of quality social infrastructure such as roads, schools and hospitals tends to be low. In Thailand for example, poor access to social and physical infrastructure at district or provincial levels are identif ied as strong drivers of rural out-migration.21 In rural areas of Egypt and Ghana, the persistent scarcity of quality education institutions is one of the drivers cited.22 In Senegal, Herrera and Sahn find that access to primary education in rural areas decreases the likelihood of migrating to urban centres. They also f ind that internal migrants mainly come from areas with lower access to nearby schools and hospitals.23
Differentials in educational opportunities also drive international migration. It was estimated that in 2007 approximately 2.8 million students moved to another country to study – a figure that had increased by around 5.5 percent per year since 1999.24 For some cultures, migration to urban areas or abroad is seen as part of social and cultural development, such as in Cabo Verde25 and Mexico.26 In the Mexican state of Oaxaca, Cohen describes migration as a way of life for many individuals and families, driven by socio-cultural as well as economic reasons.19,26
Environmental differentials affect migration flows, mainly through their impacts on agricultural productivityMigration from one rural location to another that is better developed or more productive is also common in many developing countries, as it is often less costly than international or rural–urban migration and requires less investment in education and skills.27 In Ghana, migration to the Brong Ahafo region from the north of the country is a well-established strategy to increase access to fertile land and promote food security. In a survey among 203 migrants from the Dagara
| 56 |

CHAPTER 3 WHAT DRIVES RURAL MIGRATION: DETERMINANTS, CONSTRAINTS AND MIGRANT CHARACTERISTICS THE STATE OF FOOD AND AGRICULTURE 2018
region in the north, most respondents stated that they had left their homes because of low crop yields, food security problems and the scarcity of fertile land. Of the 203 respondents, 48 emphasized hunger and food scarcity as the main causes of migration.28
A recent study finds a significant positive association between temperature and rural out-migration. It shows that a 1 °C increase in temperature is associated with a 5 percent increase in the number of international migrants, but only from agriculture-dependent countries.29 This indicates that environmental differentials may drive migration through their impacts on agricultural productivity. In this context, a study in South Africa indicates that climate variability tends to reduce the share of people employed in agriculture, which in turn boosts inter-district migration.30 Similarly, a study on migration in India shows that a 1 percent decline in rice (wheat) yields leads to an approximately 2 percent (1 percent) increase in the rate of internal migration between states in the country.31
A georeferenced review of studies concluded that water stresses such as drought, dry spells, precipitation variability, and weather extremes inf luence migration, mainly through their effects on agricultural production and productivity.32 The same applies to high and sustained temperatures, although the latter have a stronger association with migration.32 Another recent study shows that drought and water scarcity affect the largest numbers of people compared to other environmental stressors. It f inds that two-thirds of the global population (around 4 billion people) are affected by severe water scarcity for at least one month per year.33
The seasonality of agricultural incomes also creates incentives for various patterns of internal migration. Circular, temporary and seasonal migration is common across the world. These migration f lows may be rural-to-rural, practised by both nomads and casual agricultural workers, or rural-to-urban, often involving migrants who work in the construction sector (as do most short-term migrants in India).16 Circular and seasonal migration is also practised by migrant f ishers who adapt to the natural movement of targeted species and to management
arrangements in the countries of origin and destination.34
A recent report by the World Bank focusing on sub-Saharan Africa, South Asia, and Latin America (representing 55 percent of the developing world’s population), f inds that climate change will exacerbate environmental differentials within many developing countries in these three regions. These differentials, it is estimated, are likely to push tens of millions of people from their home areas by 2050. It projects that without concrete climate and development action, over 143 million people – or around 2.8 percent of the population of these three regions – will migrate within their countries from less viable areas with lower water availability and crop productivity and from areas affected by rising sea levels and storm surges.35
Demographic differentials interact with other drivers to influence migration flowsThe demographic characteristics of a region, such as high population density or rapid population growth, can inf luence migration mainly through their interaction with other drivers. Larger shares of youth coupled with low employment prospects accelerate the pressure on natural resources, which is likely to be aggravated by climate change. It is therefore not just the size of a population that triggers out-migration but rather the size and characteristics of that population, in conjunction with the availability of natural resources and employment opportunities.36 In sub-Saharan Africa for example, in order to accommodate the rapid population growth projected for the 2010–2035 period, an average of 18 million new jobs will need to be created every year.37
Consequently, the interaction of demographic differentials with other drivers of internal and international rural migration is relevant for countries experiencing rural employment challenges in fragile contexts (Figure 3), as is the case for many sub-Saharan African countries. This is also relevant for countries with development momentum, most of which are located in Asia, where pressure on natural resources is significant (Figure 3). Demographic differentials are also important with regard to
| 57 |

CHAPTER 3 WHAT DRIVES RURAL MIGRATION: DETERMINANTS, CONSTRAINTS AND MIGRANT CHARACTERISTICS
migration. However, migration also involves social and cultural costs: migrant ties to social networks in their areas of origin typically become weaker, and migrants may struggle with new cultural norms in the area of destination. These costs are particularly relevant for international migration to countries with a language that is different from the one prevailing in the country of origin.
Furthermore, there may be indirect socio-economic costs that overlap with cultural and legal factors. Weak land property rights are common in many developing countries and increase the risk of losing land following migration.43 There is also the risk of losing access to informal rural institutions, such as burial societies in Ethiopia and the United Republic of Tanzania44 and caste-based networks in India,45 which function as informal insurance for rural communities.
The ability of potential migrants to overcome such costs depends on their individual and household characteristics and on intermediate conditioning factors, as indicated in Figure 19. These factors may either constrain or facilitate migration, and thus increase or reduce the incentive or the ability to migrate. In some cases, they may even push people who, based only on macrofactors, would not necessarily migrate (for example, the absence of crucial insurance markets for agricultural products in most developing countries, given the high uncertainty of agricultural production in these regions). Common examples of conditioning factors include legal frameworks; prevailing norms and traditions; the presence or absence of social networks in potential destinations; the distances between origin and destination countries; the extent of cultural differences between origin and destination societies; and the performance of factor markets, such capital markets. The following section discusses how these factors combine to determine the financial, social, cultural and physiological costs of migration.
Legal frameworks and public policies can encourage or reduce rural migrationNational or targeted policies and legal frameworks can have direct effects on migration
migration from most countries of Central Asia – where populations are growing quickly – to the Russian Federation and Kazakhstan, which are both experiencing negative population growth.38 This is particularly significant for the Russian Federation, where the working-age population is expected to decline by 18 million (20 percent) by 2030.38,39
Scarcity of farmland and natural resources is often a decisive factor in determining how demographic differentials affect the propensity of youth to migrate.40 When land is available, the prospect of inheriting it may dissuade young people from rural out-migration and motivate them to work in agriculture. Evidence from rural Ethiopia, for example, suggests that expectations of land inheritance significantly lower the likelihood of both internal and international youth migration.41 On the other hand, as land fragmentation continues, at least within family farms,14 demographic pressure on land will increase and may induce many, especially young people, to migrate. In Central Asia, land, water, and energy resources are limited, making extensive agricultural growth unattainable in the long term, while countries in the region are expected to experience an average decline of 19 percent in agricultural land per capita by 2025. Coupled with the fact that economic policies aiming to boost agricultural productivity have reduced rural employment opportunities, this situation has led to high rates of internal and external migration, a trend which is expected to continue in the future.42 n
INTERMEDIATE CONDITIONING FACTORS CAN INFLUENCE THE MAGNITUDE OF RURAL MIGRATIONThe costs of migration can be very high, making it an unviable option for many. The primary costs are f inancial, involving the expenses of travelling and resettling in the destination area. These costs increase with the distance to be travelled, making them even more significant for international
| 58 |

CHAPTER 3 WHAT DRIVES RURAL MIGRATION: DETERMINANTS, CONSTRAINTS AND MIGRANT CHARACTERISTICS THE STATE OF FOOD AND AGRICULTURE 2018
decisions. In some countries, legal restrictions on internal mobility (such as the household registration system in China) impede rural–urban migration.6 As we know, international migration is typically restricted and regulated through legal frameworks and bilateral agreements. But when mutual interests between countries are recognized, international migration can instead be facilitated through these agreements. Given the nature of seasonal work in agriculture, bilateral agreements are used by some developed countries to hire agricultural workers from developing countries to f il l labour shortages in peak seasons, as frequently occurs in Spain and Italy.46
Moreover, public policies may affect rural migration indirectly through a variety of channels. The most prominent example is policies that aim to promote agricultural productivity by adopting mechanisation. As agricultural machinery often requires less labour, this can increase rural–urban migration as workers seek employment in other sectors. Another example is rural development policies involving agri-territorial planning, which aims to expand food systems and create non-farm employment in rural areas. This can curtail rural out-migration by offering people opportunities to improve their incomes and diversify their livelihoods close to their homes.14 At the same time, by improving rural incomes these policies could also increase migration by helping prospective migrants to overcome financial constraints. For agricultural subsidy policies, the effects are mixed. For example, results from a study on Armenia suggest that households receiving agricultural subsidies are less likely to have a member with plans to emigrate than households that do not. In Georgia on the other hand, agricultural vouchers seem to increase the likelihood of emigration, as the additional f inancial resources help make it more feasible economically.47
Land-related policies can also have mixed impacts on rural migration. In Georgia, households that have benefited from agricultural land reforms are less likely to receive remittances – indicating that the acquisition of land has perhaps boosted incomes and lessened the need for these. At the same time, those possessing official land titles issued by the Government are
more likely to have a household member planning to emigrate. This is in line with other research suggesting that securing land property rights can promote emigration.47
The literature also shows that social and employment policies affect migration, depending on the local and national context.48-50 For example, social protection policies affect rural migration directly and indirectly according to their eligibility criteria.51 When access to social protection is conditional on the physical presence of recipients, this can increase the opportunity costs of migration52 while simultaneously reducing the incentive to migrate.53 On the other hand, if beneficiaries are constrained by a lack of f inances to cover migration costs, social protection in the form of unconditional cash transfers can help overcome this constraint.50,54
Credit policies can also affect migration decisions, for example if households face f inancial or liquidity constraints. In a study in rural Bangladesh, a lump sum of USD 8.50 was given to households as an incentive to out-migrate temporarily during the lean season, when agricultural tasks are minimal.55 This incentive resulted in 22 percent of households sending away seasonal migrants, leading to substantial improvements in food security among these households. After it was removed, seasonal migration remained 8–10 percentage points higher among those who had migrated because of the incentive. Hence when designed to help households overcome certain types of migration constraints, public interventions can also lead to welfare improvements.
Social networks and recruitment agencies can facilitate rural migrationMigrants’ social networks in areas of destination play a central role in fuelling rural migration. The network theory highlights the role of diaspora communities or networks at areas of destination in facilitating and sometimes perpetuating migration.56 As network sizes increase, potential migrants in rural areas are more likely to receive information and assistance in their search for jobs and housing, which reduces the costs and risks of migration. Networks can also inf luence views on migration and encourage others to
| 59 |
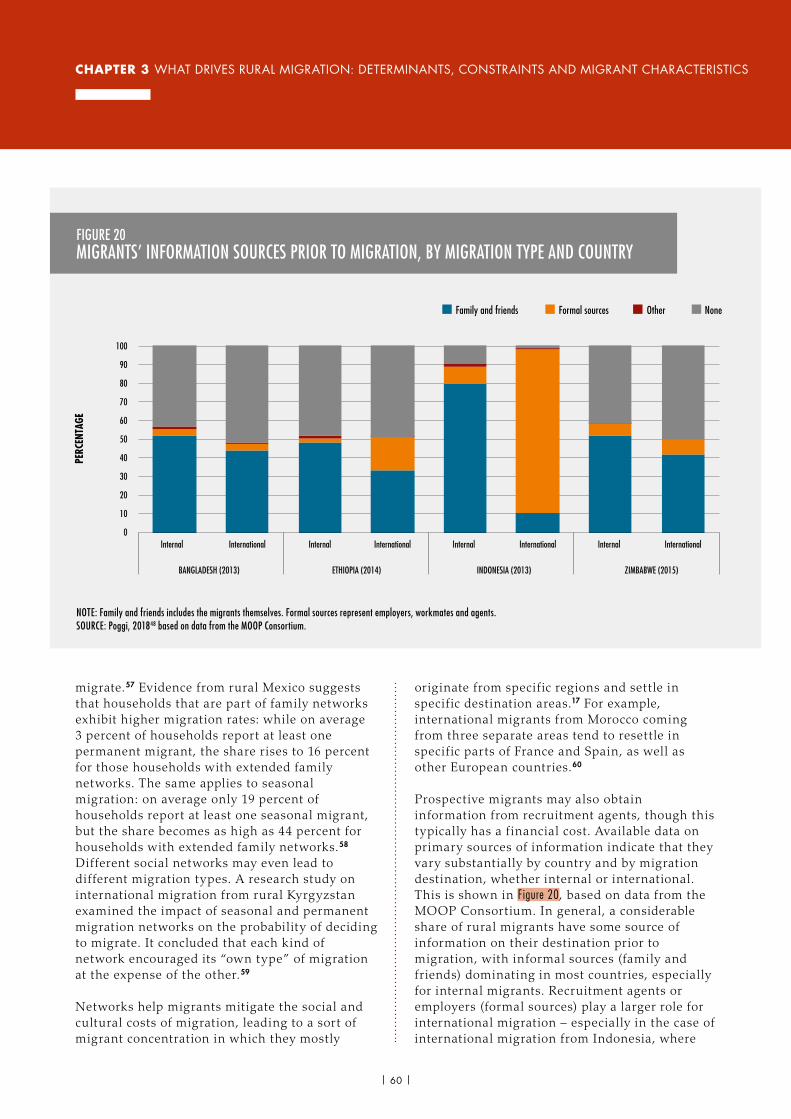
CHAPTER 3 WHAT DRIVES RURAL MIGRATION: DETERMINANTS, CONSTRAINTS AND MIGRANT CHARACTERISTICS
migrate.57 Evidence from rural Mexico suggests that households that are part of family networks exhibit higher migration rates: while on average 3 percent of households report at least one permanent migrant, the share rises to 16 percent for those households with extended family networks. The same applies to seasonal migration: on average only 19 percent of households report at least one seasonal migrant, but the share becomes as high as 44 percent for households with extended family networks.58 Different social networks may even lead to different migration types. A research study on international migration from rural Kyrgyzstan examined the impact of seasonal and permanent migration networks on the probability of deciding to migrate. It concluded that each kind of network encouraged its “own type” of migration at the expense of the other.59
Networks help migrants mitigate the social and cultural costs of migration, leading to a sort of migrant concentration in which they mostly
originate from specific regions and settle in specific destination areas.17 For example, international migrants from Morocco coming from three separate areas tend to resettle in specific parts of France and Spain, as well as other European countries.60
Prospective migrants may also obtain information from recruitment agents, though this typically has a f inancial cost. Available data on primary sources of information indicate that they vary substantially by country and by migration destination, whether internal or international. This is shown in Figure 20, based on data from the MOOP Consortium. In general, a considerable share of rural migrants have some source of information on their destination prior to migration, with informal sources (family and friends) dominating in most countries, especially for internal migrants. Recruitment agents or employers (formal sources) play a larger role for international migration – especially in the case of international migration from Indonesia, where
0
10
20
30
40
50
60
70
80
90
100
Internal International Internal International Internal International Internal International
PERC
ENTA
GE
Family and friends Formal sources Other None
BANGLADESH (2013) ETHIOPIA (2014) INDONESIA (2013) ZIMBABWE (2015)
FIGURE 20MIGRANTS’ INFORMATION SOURCES PRIOR TO MIGRATION, BY MIGRATION TYPE AND COUNTRY
NOTE: Family and friends includes the migrants themselves. Formal sources represent employers, workmates and agents.SOURCE: Poggi, 201848 based on data from the MOOP Consortium.
| 60 |

CHAPTER 3 WHAT DRIVES RURAL MIGRATION: DETERMINANTS, CONSTRAINTS AND MIGRANT CHARACTERISTICS THE STATE OF FOOD AND AGRICULTURE 2018
information comes predominantly from formal sources (mainly agents). However, across all four countries (Bangladesh, Ethiopia, Indonesia and Zimbabwe) it is clear that social networks (family and friends) are more important for internal than for international migration.48
Where available, the role of recruitment agencies extends also to contracting, which is a further step towards migration. For example, Spain is the main destination country for circular migration from Morocco thanks to recruitment programmes administered by the Moroccan National Agency for Promoting Employment and Qualif ications. Under this programme, 89 percent of migrants go to Spain, of which 75 percent – mainly young rural women with accompanying children – work in agriculture.61 Internal circular migration in developing countries is also facilitated by mostly informal recruitment agents. For example, the so-called traditional contractors in the Syrian Arab Republic will pool casual agricultural labourers, mainly female, from various rural areas and make them available in different locations according to peak labour seasons.62,63
Migration can be a strategy of risk management As mentioned earlier, the costs of migration can be high. In addition to the direct costs of moving and resettling in destination areas there are implicit long-term costs due to the loss of social networks in the area of origin. Yet migration can also be an important risk-management strategy, often used by farming households to diversify income sources and hedge against income uncertainty and food insecurity.
Agriculture is subject to f luctuations in production, income and employment due to climatic factors and its seasonal nature. Non-farm employment opportunities are typically limited in rural areas.64 Sending one or more family members to cities to work in sectors other than agriculture can reduce the risk of extreme poverty and food insecurity among households and help them cope with possible adverse shocks that they might face, especially those who are poor. This is typically true in most developing countries, where rural credit markets do not function well.
The empirical literature contains several examples of migration being used as a risk-management strategy. In the Sidama district in southern Ethiopia, households whose members were anxious about food supply, food quality/quantity and missed meals were more likely to send adult members in search of employment in other areas.65 Moreover, for households without migrant members, the inability to feed the family – relative to neighbouring households with migrants – increased by four times their propensity to send a member out as a migrant.66 Likewise in Thailand, evidence suggests that rural households with lower resource endowments are the most likely to send younger family members away for work in the Greater Bangkok area.21 n
WHO ARE THE MIGRANTS AND HOW ARE THEY DIFFERENT FROM NON-MIGRANTS?To understand migration phenomena one must look not only at the magnitude of migration f lows, but also at the characteristics of those who migrate. People liv ing under the same macrofactors and exposed to similar conditioning factors have different personal and household characteristics, and thus may have different attitudes towards migration (as highlighted in Figure 19). These differences are crucial for understanding why some individuals decide to migrate and others do not.
While international migration is restricted by national legal frameworks and/or regulated by bilateral agreements, this is not the case for internal migration across the world, with very few exceptions (the hukou registration system in China, for example). In most countries, rural people can move and resettle freely within their national borders. As discussed earlier in this chapter, large differences in the returns to labour between sectors in developing countries should move workers from the low-productiv ity farming sector to the industrial and serv ices sectors;9 this is the most powerful incentive for internal rural–urban migration. As people move
| 61 |

CHAPTER 3 WHAT DRIVES RURAL MIGRATION: DETERMINANTS, CONSTRAINTS AND MIGRANT CHARACTERISTICS
out of agriculture, they become employed in higher productiv ity sectors, while the labour productiv ity of those who keep farming also increases due to the adoption of labour-saving technologies. As a consequence, the productiv ity gap across sectors tends to diminish.
However, development economics literature provides clear evidence that a significant labour productivity gap persists between agricultural and non-agricultural sectors in developing countries.67,68 Such a gap can be attributed to constraints that prevent prospective migrants from taking advantage of opportunities available elsewhere, as discussed earlier. Yet it has also been argued that at least a portion of that gap can be accounted for by selectiv ity of migrants out of agriculture and rural areas, favouring those with higher abilities or more aptitude to take on the risk of moving.69,70
In this section the discussion revolves around the characteristics of migrants and how they differ from those who stay behind. Are migrants the best suited in terms of matching labour skills to urban demand? Are those who stay behind in rural areas better suited for rural jobs? Are there any gender differences? What are the characteristics of migrant households? These questions and others are still open to empirical research, with different answers depending on local, cultural and socio-economic contexts.
Migrants are generally younger and more educated than non-migrantsThere are consistent f indings across most contexts (both developed and developing) that age and education predict migration. Typically, people reach their highest peak probability to migrate when they are in their mid- to late-twenties. Also, within each age group the probability of migrating tends to rise with education. Less is known about whether these patterns relate to all types of migration (such as temporary, circular, return or permanent). But there is some evidence that short-term migration is less related to current human capital (age and education) and more to savings-target strategies, such as investments for marriage, education, land, home, capital or retirement.71
Data on internal and international out-migration from Burkina Faso, Ghana, Nigeria, Senegal, and Uganda indicate that youth are always dominant among migrants, with their share exceeding 55 percent in all f ive countries and reaching 70 percent in Ghana, with very slight differences between national and rural shares (Figure 21).
In rural economies, evidence shows that youth are the group most likely to migrate from rural to urban areas, mainly in response to the lack of gainful employment and entrepreneurial opportunities in the agricultural sector. A survey in rural areas of eight countries in sub-Saharan Africa shows that three in four (75.4 percent) working youth are in vulnerable employmentvii – of which 45.6 percent in agriculture and 29.8 percent outside agriculture. Considering those employed in agriculture only, the share of rural youth in vulnerable employment ranges from 68.1 percent in Zambia to 93.7 percent in Benin.18 As mentioned earlier, scarcity of farmland is a contributing factor to this rural youth out-migration.40 However, where land is available, the prospect of land as an inheritance may incentivize young people to work in agriculture and dissuade them from migrating, as evidence from Ethiopia has shown.41
As for education levels, both migrants themselves and their households tend to be better educated than non-migrant households.74 Several studies have indicated that higher education, especially among youth, inf luences rural out-migration to cities or other countries. In China, higher education levels have been a strong factor driving youth out of agriculture in search of higher-paid employment in the cities.8 Rural migrants have lower levels of school attainment than their urban counterparts but tend to spend more years in school than non-migrants, as evidenced in Ethiopia, Ghana, Malawi and Mali.75
In a prominent paper using DHS data from 65 developing countries, Young shows that rural–urban migrants on average have higher education levels than rural non-migrants, but lower education levels than urban residents.
vii Vulnerable employment in the study refers to work in small, unincorporated family businesses as self-employed workers or as contributing family workers without pay.
| 62 |
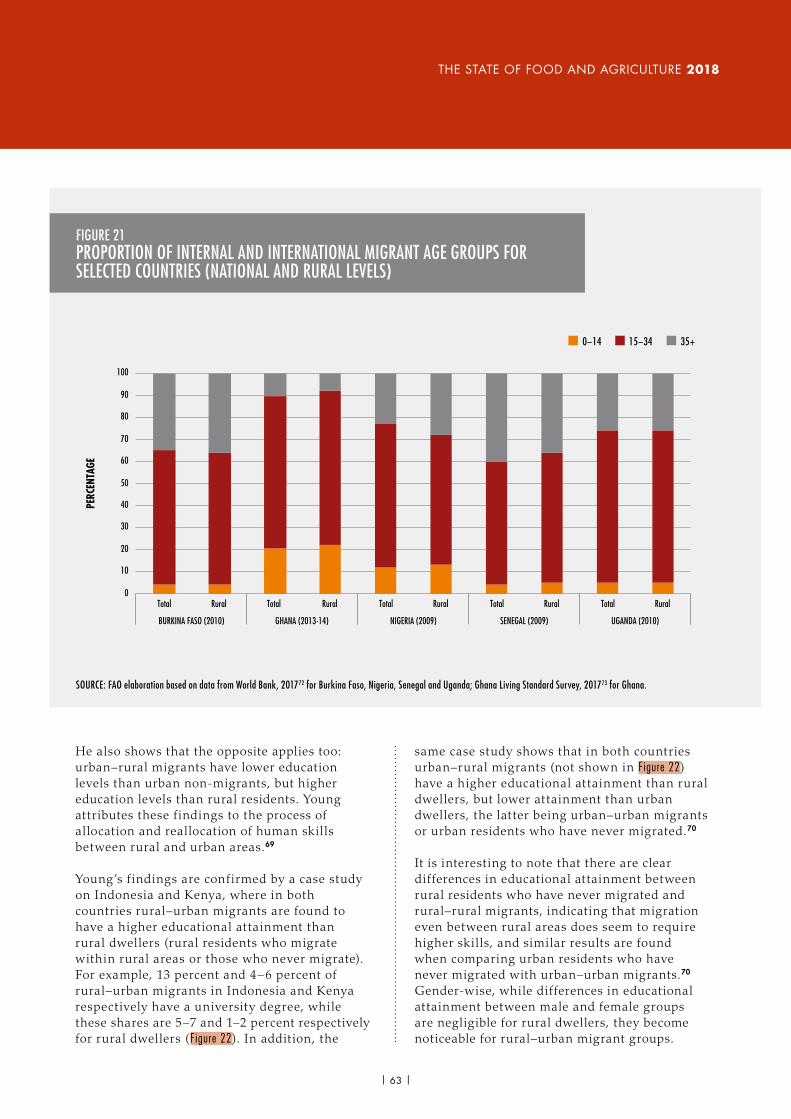
CHAPTER 3 WHAT DRIVES RURAL MIGRATION: DETERMINANTS, CONSTRAINTS AND MIGRANT CHARACTERISTICS THE STATE OF FOOD AND AGRICULTURE 2018
He also shows that the opposite applies too: urban–rural migrants have lower education levels than urban non-migrants, but higher education levels than rural residents. Young attributes these findings to the process of allocation and reallocation of human skills between rural and urban areas.69
Young’s f indings are confirmed by a case study on Indonesia and Kenya, where in both countries rural–urban migrants are found to have a higher educational attainment than rural dwellers (rural residents who migrate within rural areas or those who never migrate). For example, 13 percent and 4–6 percent of rural–urban migrants in Indonesia and Kenya respectively have a university degree, while these shares are 5–7 and 1–2 percent respectively for rural dwellers (Figure 22). In addition, the
same case study shows that in both countries urban–rural migrants (not shown in Figure 22) have a higher educational attainment than rural dwellers, but lower attainment than urban dwellers, the latter being urban–urban migrants or urban residents who have never migrated.70
It is interesting to note that there are clear differences in educational attainment between rural residents who have never migrated and rural–rural migrants, indicating that migration even between rural areas does seem to require higher skills, and similar results are found when comparing urban residents who have never migrated with urban–urban migrants.70 Gender-wise, while differences in educational attainment between male and female groups are negligible for rural dwellers, they become noticeable for rural–urban migrant groups.
0
10
20
30
40
50
60
70
80
90
100
Total Rural Total Rural Total Rural Total Rural Total Rural
BURKINA FASO (2010) GHANA (2013-14) NIGERIA (2009) SENEGAL (2009) UGANDA (2010)
PERC
ENTA
GE
0−14 15−34 35+
FIGURE 21PROPORTION OF INTERNAL AND INTERNATIONAL MIGRANT AGE GROUPS FOR SELECTED COUNTRIES (NATIONAL AND RURAL LEVELS)
SOURCE: FAO elaboration based on data from World Bank, 201772 for Burkina Faso, Nigeria, Senegal and Uganda; Ghana Living Standard Survey, 201773 for Ghana.
| 63 |

CHAPTER 3 WHAT DRIVES RURAL MIGRATION: DETERMINANTS, CONSTRAINTS AND MIGRANT CHARACTERISTICS
According to survey results from Ethiopia, households with at least some secondary education are 2.5 times more likely to have a migrant compared to those with no or only primary education. Similarly, a long-term migrant is 3.7 times more likely to have partial or full secondary education. However, education appears to play no significant role in short-term migration decisions.66 Further evidence suggests that individuals who are more educated are more likely to migrate internationally.76 Hence international labour migration seems to have two prominent features: (i) positive selection, i.e. individuals who are more educated are more likely to emigrate, and (ii) positive sorting, i.e. migrants who are more educated are more likely to settle in destination countries that reward skills highly.77 In brief, migrants are generally more educated than non-migrants, although the importance of education and skills in the migration process may vary substantially by migration type, duration and destination, which
together affect migrant selectiv ity based on skills. While education and skills are of low relevance for internal rural–rural migration (occurring frequently as seasonal and circular processes), they become highly important when the change of residence is associated with sectoral employment shifts.
Gender differences still exist in rural migration Women’s participation in international migration has been increasing, and they now represent approximately half of the stock of international migrants.78 This varies by region however, as males constitute the majority of international migrants in sub-Saharan Africa – from 60 percent in Eastern Africa to 80 percent in Western Africa. It varies by age as well: in Western Africa, boys younger than age 15 rarely migrate but young girls often do, frequently seeking employment as housemaids.75
0
10
20
30
40
50
60
70
80
90
100
Male Female Male Female Male Female
RURAL – NEVER MIGRATED RURAL–URBAN
PERC
ENTA
GE
No education Primary education Secondary education University
KENYA
RURAL–RURAL
Male Female Male Female Male Female
RURAL – NEVER MIGRATED RURAL–RURAL RURAL–URBAN
INDONESIA
FIGURE 22EDUCATION LEVELS OF RURAL MIGRANT GROUPS COMPARED TO THOSE WHO REMAIN IN RURAL AREAS, INDONESIA AND KENYA
SOURCES: FAO elaboration based on data from Indonesia Family Life Survey Waves I (1993) and V (2015) and Kenya Life Panel Survey Rounds I (2003-05) and II (2011-14), as presented in Hamory Hicks et al. 2017.70
| 64 |

CHAPTER 3 WHAT DRIVES RURAL MIGRATION: DETERMINANTS, CONSTRAINTS AND MIGRANT CHARACTERISTICS THE STATE OF FOOD AND AGRICULTURE 2018
While comparable estimates do not exist for internal migration by gender at the global level, country-level estimates show that the propensity to migrate often differs between men and women, although not uniformly across contexts. In Ghana for example, internal migrants account for over 50 percent of the population; slightly less than half are women, but women and girls are increasingly moving independently, often from rural to urban areas.79 In Senegal, rural women are 6.4 percent more likely than men to move to other rural areas, while no gender difference exists for moves to urban areas. However, the likelihood of a woman moving to an urban area increases with the level of education of her father, possibly indicating paternal support for women’s educational attainment in urban centres.23
Different social traditions among countries lead to different patterns of gender disparities in access to resources (such as land) and in mobility constraints, which may contribute to migration decisions that vary by gender. For instance, in northern parts of the United Republic of Tanzania, where young women contribute unpaid labour to family farms that they cannot inherit, a growing number of these women are seeking wage opportunities in urban centres far away from their areas of origin. On the other hand, young men usually move shorter distances and for shorter periods of time, and then return home during the farming season.80 In many other rural societies, women’s mobility itself is constrained by social norms, and so migrants tend to be mostly male. In Tajikistan for instance, internal rural-to-urban labour migration and international migration are a predominantly male phenomenon, with men constituting about 80 percent of labour migrants.81 Customary systems of decision-making often restrict women’s mobility, especially for young women in multi-generational families in rural areas, who are commonly excluded from decision-making processes.82
Evidence on migration decisions in Bangladesh, Ethiopia, Indonesia and Zimbabwe reveals that employment is the main reason for migrating (Figure 23), exceeding 70 percent in all four countries and reaching 98 percent in Indonesia. However, there are noticeable differences
between women and men who migrate: a higher proportion of men do so for employment reasons, while a higher proportion of women do so for family reasons. This is seen in all countries except Indonesia, where the shares are very close for both women and men – probably a ref lection of the fact that gender differences tend to diminish as countries develop and become more urbanized. Indeed, among the four countries in Figure 23, Indonesia had the highest share of urban population as of 2015 (54 percent, compared to 35 percent in Bangladesh, 36 percent in Zimbabwe and only 20 percent in Ethiopia).83
Migration for family reasons also occurs frequently, and in some countries is the most prevalent form of migration for women. According to the 1998 Living Standards Measurement Survey in Ghana, approximately 60 percent of rural-to-urban migration occurred for family-related reasons, including dependents of those who initially migrated for economic reasons.84 In rural societies, migration for family reasons seems to be more prevalent for women than men, as shown in Figure 23 for Bangladesh, Ethiopia and Zimbabwe. This may partially explain why female rural–urban migrants have on average lower educational attainment than their male counterparts, as seen in Indonesia and Kenya (Figure 22). In India, a country with a dominant rural population (65 percent), two-thirds of all women have migrated for marriage reasons and approximately 20 mill ion women move each year because of marriage.85 In Burkina Faso, between 1970 and 1998 almost 80 percent of women moved for family reasons (65 percent for marriage), while only 14 percent did so for economic motives.86 Similar shares prevail in Senegal.87
Differences in legal frameworks and cultural contexts, as well as gender discrimination, perpetuate the differentials in opportunities presented to men and women. These will affect the preferences of men and women regarding employment, and also their decisions to migrate. The impacts of these gender imbalances on migration patterns are likely to have notable social and economic implications for rural communities in the coming decades.88
| 65 |

CHAPTER 3 WHAT DRIVES RURAL MIGRATION: DETERMINANTS, CONSTRAINTS AND MIGRANT CHARACTERISTICS
The poorest have greater incentives to migrate, but also greater mobility constraints More and more ev idence points to a non-l inear relat ionship between migrat ion and income,89 as well as other measures such as level of wealth/poverty and consumption. Migrat ion is mostly motivated by economic factors, so the poor may feel the strongest motivat ions to migrate. However, their economic status leaves them at great pains to undertake migrat ion as they lack the f inancial resources to cover migrat ion costs. Conversely, wel l-off households can afford these costs, but because of their level of wealth they may not feel the same motivat ion to migrate.
A study analysing migration in Mexico emphasized the costs of international migration and found that only those belonging to the
middle class could have both the means and the incentive to migrate. Accordingly, the probabil ity of migration has an inverse U-shaped relationship with wealth.90 At one extreme are the wealthy, who lack the economic motivation to migrate; at the other are the poor, who may be the most in need of migration to exit poverty and improve their food security, but who lack the means to do so. The constraining effects of migration costs on the mobility of the poor are confirmed by empirical ev idence from Gallup World Poll data (see Box 11). It should come as no surprise then to learn that international migration is dominated by people with higher education: these indiv iduals are less l ikely to be poor, especially when multi-dimensional poverty is considered.
Poverty and lack of f inances can also have constraining effects on internal migration. In a study on the relat ionship between migration,
0
10
20
30
40
50
60
70
80
90
100
Female Male Female Male Female Male Female Male
BANGLADESH (2013) ETHIOPIA (2014) INDONESIA (2013) ZIMBABWE (2015)
PERC
ENTA
GE
Work Study Family Other
FIGURE 23REASONS FOR OUT-MIGRATION FROM RURAL AREAS IN SELECTED COUNTRIES, BY GENDER
NOTE: Reasons for migration include work, school, family (marriage, to help members or be helped), and other (e.g. climatic shock, change in lifestyle). SOURCE: Poggi, 201848 based on data from the MOOP Consortium.
| 66 |

CHAPTER 3 WHAT DRIVES RURAL MIGRATION: DETERMINANTS, CONSTRAINTS AND MIGRANT CHARACTERISTICS THE STATE OF FOOD AND AGRICULTURE 2018
poverty and remoteness of rural areas from six Indian v i l lages, the authors found that in remote v i l lages with the highest incidence of migration, migration involved al l but the poorest and the r ichest households.92 This explains why the poor usually move only short distances and for short-term periods, in the form of “surv ival migration” dictated by l i fe necessit ies, as indicated earl ier. For example, in Mali during the severe droughts of 1983–85 there was a decl ine in permanent migration from rural areas and a r ise in circular and short-distance migration (especial ly for women and children) alongside a r ise in rural poverty. Such a shif t in migration patterns is explained by severe l iquidity constraints that prevent people from
meeting permanent and long-distance migration costs, leav ing them in a serious poverty trap with extreme food insecurity.93 Ev idence from India also shows that short-term migration regards mostly the poorest. Analysis by Chandrasekhar, Das and Sharma reveals that households with a short-term migrant have lower monthly per capita consumption expenditure than households without a short-term migrant, suggesting that short-term migrants are from the bottom end of the consumption distr ibution.94 n
As indicated in Box 10, the Gallup World Poll (GWP) annual survey asks two questions related to international migration. The first question measures potential migrants, while the second asks whether an individual is actively planning to leave within a year, and can be taken as a proxy of actual migrants. Using an empirical econometric analysis, a background paper to this report assesses the drivers of (1) potential migration (first question), i.e. what drives people's desire to migrate; and (2) eventual migration decisions (second question). The paper empirically links participants’ answers to each of the migration questions with a combination of socio-economic and demographic variables that are said to be relevant for migration decisions.
With regard to the first question, the results show significant effects for the main variables such as gender, marital status, education, employment status, social networks and satisfaction with local services. Individuals in the poorest income quintile tend to have the highest desire to migrate, and this tends to decrease for individuals belonging to higher income quintiles.
For the second question, a non-linear relationship is found between income and individuals planning to
migrate. There is an "individual mobility transition" according to which cross-border migration intentions rise sharply with income when respondents get richer in low-income and lower-middle-income countries. Income profiles depict an inverted U-shaped function, which is more pronounced for poorer countries. Intentions to migrate fall only for individuals in the very highest income bracket, accounting for less than half of a percent of the total population in these countries. The U-shaped relationship between migration intentions and individual income is much weaker in richer (upper-middle- and high-income) countries where even people in lower income quantiles can cover financial costs of migrating. Overall, this evidence is consistent with the macro- and micro-level determinants of migration and shows that individuals with binding liquidity constraints, especially in lower income countries, are limited in their ability to make the necessary preparations for migrating internationally. This reaffirms the importance of migration costs and constraints for those with little or no access to resources, who remain the least mobile even if they may have the greatest desire to migrate to improve their livelihood opportunities.
BOX 11EMPIRICAL EVIDENCE INDICATES THAT THOSE WITH LITTLE OR NO ACCESS TO RESOURCES ARE THE LEAST MOBILE
SOURCE: Mendola, 2018.91
| 67 |

CHAPTER 3 WHAT DRIVES RURAL MIGRATION: DETERMINANTS, CONSTRAINTS AND MIGRANT CHARACTERISTICS
PROTRACTED CRISES CAUSE LARGE HUMAN DISPLACEMENTS AND ALTER MIGRATION SYSTEMS Voluntary migration happens in the absence of coercive forces as people search for better economic opportunities and improved liv ing standards elsewhere. When coercive factors come into play, migration becomes less voluntary. As depicted in Figure 1 in Chapter 1, as these factors increase, so does the vulnerability of rural l ivelihoods. Income distress, poverty, food insecurity, natural hazards and environmental degradation, among others, push rural people to migrate short or long distances and for varying lengths of t ime in search of better l ivelihoods. In extreme situations, people are forced to migrate to escape an unsafe situation due to conf lict, state fragil ity, polit ical unrest or environmental disasters. People may be forced to leave their homes either because of an immediate and intense risk or threat to their safety, including from violence, conf lict and war (e.g. the Syrian Arab Republic, Afghanistan), or because of sudden-onset natural disasters such as earthquakes and f loods.95 When occurring on a large scale and lasting for a long time, such events can give rise to protracted crises. In protracted crises, conf licts are often compounded by drought and other climate shocks, exacerbating the impacts on rural food security and livelihoods. The combination of cl imatic events and other natural, social, polit ical and economic factors can affect populations l iv ing in already fragile and vulnerable contexts. This section discusses what drives protracted crises and how they change the ordinary migration system and consequent migratory f lows and patterns.
Fragility, protracted crises, and how they affect migration driversThe term “fragile states” is generally used to describe countries with weak institutions and a lack of capacity to respond to conf licts; by extension, it also refers to these countries’ potential resilience to shocks and stressors. The concept also captures existing violence, latent political instability and overall high risk of conf lict.96 All countries and societies across different levels of economic development fall somewhere along the fragility spectrum.97
The 2016 OECD fragility framework analyses f ive dimensions of fragility – economic, environmental, political, security and societal ( Table 4). For each dimension, the framework looks at the accumulation and combination of risks, together with the capacity of the state, system and/or communities to manage, absorb or mitigate the consequences of those risks. The results show that over 1.6 billion people, or 22 percent of the world’s population, live in fragile contexts where population growth is among the fastest in the world.97
Extreme fragility can lead to protracted crises, which are characterized by conditions and environments in which a significant proportion of the population is acutely vulnerable to death, disease and disruption of livelihoods over a prolonged period. The governance of these environments is usually very weak, with the state having a limited capacity to respond to and mitigate the threats to the population or provide adequate levels of protection.98-100
In 2017, 19 countries were identif ied as being in a protracted crisis situation in the UN report on The State of Food Security and Nutrition in the World. Almost all have experienced periods of v iolent conf lict, which cause higher death rates, greater numbers of refugees and IDPs, and destruction of infrastructure, housing, economy, livelihoods and culture. However, most protracted crises are also characterized by very weak governance, breakdown of local institutions, poor health of the affected populations, and higher prevalence of natural disasters.100 Natural disasters and protracted crises often
| 68 |

CHAPTER 3 WHAT DRIVES RURAL MIGRATION: DETERMINANTS, CONSTRAINTS AND MIGRANT CHARACTERISTICS THE STATE OF FOOD AND AGRICULTURE 2018
overlap, further aggravating the impacts.101 Under such conditions, the worst affected are generally the poorest and most vulnerable of society. The World Bank and OECD estimate that by 2030 high population growth rates and weak economic development could mean the poor will come to represent half or more of the total population liv ing in fragile and conf lict-affected situations.viii
Migration triggered by protracted crises can consist of population displacement due to slow-onset shocks and stressors – such as variable/low rainfall or drought and long-term civil unrest that may sporadically manifest into localized violence – or displacement brought on by strong, sudden-onset natural disasters, which when coupled with poor governance can have long-lasting repercussions. This includes conditions that are not immediately life-threatening but that nonetheless pose sufficient risk to people’s long-term well-being. When the risks of staying outweigh the risks of migrating, households may feel compelled – or forced – to migrate. Such migration, which has sometimes been referred to as “survival migration”,103 may have less urgency
viii The World Bank Group estimates that, by 2030, the share of the poor in the global population living in fragile and conflict-affected situations will be 46 percent, while the OECD estimate is 60 percent. Estimates are different because both sources use different definitions of fragility and violence. For the World Bank estimates see, World Bank. 2017.102 For the OECD estimates, see OECD. 2016.97
or happen at a slower pace than forced displacement from immediate, and especially violent, threats.
As discussed above and illustrated in Figure 19, protracted crises inf luence migration through their effects on all three levels of ordinary drivers of migration: macrofactors, intermediate conditioning factors and microfactors. They augment the incentive to migrate by dramatically widening differentials between conditions in areas of origin and potential destination, and they interact with intermediate conditioning factors, for example humanitarian action and the development of diaspora networks. Not least however, at the level of microfactors, protracted crises alter the degree of uncertainty and risk that individuals and households are willing to accept. Thus people seeking safety and survival tend to accept higher degrees of uncertainty and risk than they would under normal conditions. In brief, under protracted crises and facing the loss (or potential loss) of their assets, l ivelihoods and even some of their family members and with little or nothing left to lose, many people decide to embark on the risky endeavour of migrating as either IDPs or asylum seekers.
TABLE 4FIVE DIMENSIONS OF THE 2016 OECD FRAGILITY FRAMEWORK
Dimension Description
Economic Vulnerability to risks stemming from weaknesses in economic foundations and human capital, including macroeconomic shocks, unequal growth and high youth unemployment.
Environmental Vulnerability to environmental, climatic and health risks that affect citizens’ lives and livelihoods. These include exposure to natural disasters, pollution and disease epidemics.
PoliticalVulnerability to risks inherent in political processes, events or decisions; lack of political inclusiveness (including of elites); transparency, corruption and societal ability to accommodate change and avoid oppression.
Security Vulnerability of overall security to violence and crime, including both political and social violence.
SocietalVulnerability to risks affecting societal cohesion that stem from both vertical and horizontal inequalities, including inequality among culturally defined or constructed groups and social cleavages.
Source: OECD, 2016,97 Table 3.1.
| 69 |

CHAPTER 3 WHAT DRIVES RURAL MIGRATION: DETERMINANTS, CONSTRAINTS AND MIGRANT CHARACTERISTICS
Conflicts, environmental factors and poor governance are the major determinants of protracted crises Protracted crises are generally driven by multiple factors and conditions that are often interlinked and interdependent. Armed conf licts, environmental factors – including degradation of natural resources and the environment, natural disasters, high exposure and sensitiv ity to climate-adverse shocks and climate change – and poor governance are the most significant causes of protracted crises and migration, with varying degrees of inf luence from one context to another.
Conflict and war, particularly prolonged conf licts, are key drivers of the current global levels of human displacement. The large-scale armed conf lict in the Syrian Arab Republic has displaced nearly 12 million people: more than 6 million IDPs and 5.5 million refugees have sought safety internally or across international borders.104 The 2016 Global Peace Index suggests that the world has become less peaceful over the last decade.105 Since 2010, state-based conf licts have increased by 60 percent, while conf licts between non-state actors have risen by 125 percent.100
The relationship between environmental degradation and natural disasters – especially in the context of climate change – and displacement/migration is complex and not yet well understood. Their role as drivers of conf licts and migration has been the subject of discussion since the 1980s,106,107 but recently there has been more attention from scholars and governments, as the topic is increasingly viewed as a security issue by policy-makers across the globe. This “securitization” of climate change108
has led to an important renewal of the topic, as well as claims partly attributing the outbreak of the Syrian conf lict to the extreme drought of 2007–2009.109
A number of different pathways leading from climate change to conf lict have been proposed and discussed in the literature. One in particular, the climate-migration-conf lict pathway, has garnered increased attention from policy-makers and the media,110 although it has
been challenged by some scholars. It argues that climate variability and change bring the risk of serious negative impacts on environmental and human systems. However, while these events can lead to population displacement, there is disagreement surrounding the specific ways in which climate change will impact migration. Furthermore, current literature surrounding migration and conf lict increasingly suggests that climate change and climate-related migration will not cause conf lict independently of other important political and economic factors.111-113 It is therefore agreed that climate change alone will not necessarily lead to conf lict,109 although it is acknowledged almost universally that it has the potential to exacerbate or catalyze conf lict in conjunction with other factors.110,113
Regarding the specific case of the Syrian Arab Republic, the 2007–2009 drought has been analysed by academics and frequently used as a relevant example to support the proposition that climate change is likely to induce or exacerbate conf licts. 114,115 However, as others have argued, while the drought hit the entire Near East region, only in the Syrian Arab Republic was there a subsequent humanitarian crisis, pointing to the lack of proper governance and responsive institutions to manage risks and cope with shocks116-118 (Box 12).
Rapid-onset natural disasters have the most direct impacts on displacement/migration. Earthquakes, volcanic eruptions, tropical storms, f loods and droughts may all cause sudden, large-scale displacements because of economic disruption or loss of homes.121 The human displacement caused by such rapid-onset events is the easiest to identify, since the underlying environmental climatic events can be clearly observed. In these situations, people must f lee to save their lives, but whether they return depends on the strength of the event and the local adaptive capacity. If the recovery of social, economic and physical characteristics of the affected area is rapid and effective, people mostly return. If it is ineffective or slow, the situation becomes a protracted crisis, and the involuntary displacement develops into long-term or permanent migration.122
| 70 |

CHAPTER 3 WHAT DRIVES RURAL MIGRATION: DETERMINANTS, CONSTRAINTS AND MIGRANT CHARACTERISTICS THE STATE OF FOOD AND AGRICULTURE 2018
In addition, slow but long-term environmental changes such as sea-level rises, coastal erosion, desertif ication, or loss of agricultural productivity can also develop into a protracted crisis and can lead to a significant increase in rural migration f lows.123 In fact, a large number of people are estimated to migrate as a result of gradual environmental degradation that leads to serious detriments in livelihood patterns and production systems.
Reliable estimates of long-term or permanent migration due to environmental degradation or climate change are lacking. This may be because displacement caused by single-episode natural disasters (such as earthquakes, landslides, or f loods) is often temporary. However, in contexts of limited economic resources and weak governance, as is the case for many developing countries, such events may cause large-scale damage to people’s livelihoods that is irreversible in the short term, thus leading to conditions of protracted crisis and migration. For example,
most people displaced by the 2010 f loods in Colombia and Pakistan were still displaced at the end of 2014. The 2010 earthquake in Haiti displaced nearly 1.5 million people, 62 600 of whom were still l iv ing in IDP camps in 2015,124 and as of 2018 an estimated 20 percent of the country’s population were still in need of humanitarian assistance.125
Most displacements due to conf licts and natural disasters occur in low- and middle-income developing countries. These tend to be particularly vulnerable because their economies depend in large part on climate-sensitive sectors such as agriculture and livestock, and because they tend to have low adaptive capacity in terms of human capital, f inancial resources, institutional resilience or technological progress.126
As highlighted in Chapter 2, conf licts displaced more than 65 million people in 2016: of these 40.3 million were IDPs, 22.5 million were
Different governance structures and response capacities help explain why the same or similar type of shock can result in a crisis in one country but not in another. The impact of any shock and the available coping strategies depend largely on adaptive capacity, which is shaped by a combination of technological, socio-economic and political factors. For example, the prolonged and severe drought that hit some countries in the Near East in 2007–2009 had varied consequences in terms of displacement and food insecurity. While it caused a large-scale displacement crisis in the Syrian Arab Republic owing to an alarming level of food insecurity and malnutrition, the same drought had negligible impacts on other nations in the region.117,118
In the Syrian Arab Republic, public intervention policies played an important role in the degradation of natural resources. Before the crisis, the Syrian Government had encouraged grain farming to the
detriment of pasture areas. Crop extension in arid or semi-arid regions, where rainfall is hardly over 200mm, resulted in continued yield degradation.62 In addition, several studies highlight how government policies favouring irrigation-intensive crops (wheat and cotton) resulted in the collapse of the groundwater levels.116,119
This significantly limited the coping capacity of Syrian farmers when the Near East was hit by severe drought in 2007–2009. Conditions were further worsened during the drought when the Government lifted subsidies on diesel fuel (the main fuel used in irrigation) in 2008, triggering an overnight price jump of 300 percent.117-119 As a consequence, while the same drought had negligible impacts on other countries in the region,117,118 in 2009 it caused the displacement of about 300 000 people in the Syrian Arab Republic from rural areas towards cities, leaving 60–70 percent of villages in the regions of Hassakeh and Deir ez-Zor deserted.120
BOX 12NEXUS OF POOR GOVERNANCE, ENVIRONMENTAL DEGRADATION AND RURAL MIGRATION: THE EXAMPLE OF THE SYRIAN ARAB REPUBLIC
| 71 |

CHAPTER 3 WHAT DRIVES RURAL MIGRATION: DETERMINANTS, CONSTRAINTS AND MIGRANT CHARACTERISTICS
refugees, and 2.8 million were seeking asylum.104 These numbers suggest that most migrants stay close to home when forcibly displaced, principally as IDPs. A survey by the World Food Programme shows that the majority of Syrian refugees in Jordan, Turkey and Lebanon were displaced several times within the country before they crossed the border.127 Even if forced to f lee across international borders, refugees mostly stay in neighbouring countries, either because they prefer to remain in places where the customs and culture are more similar to those of their areas of origin, or because they cannot afford to undertake long-distance international migration.
According to UNHCR, protracted refugee situations across the globe now last an estimated 26 years on average,128 and in 2014 more than 50 countries were reported to have people liv ing in internal displacement for more than 10 years.129 Many of the countries affected by conf licts and protracted crises are largely rural, with the rural population amounting to over half of the total population and often bearing the brunt of these conf licts.100 In turn, high levels of poverty, lack of or contested access to natural resources, and associated food insecurity can contribute to conf lict. Self-reinforcing downward spirals can therefore occur as more and more people become food-insecure and unable to escape poverty, often resulting in protest and violence. These conditions for the poor are likely to continue: according to the World Bank, the proportion of the global population of poor who live in fragile and conf lict-affected states is expected to reach 46 percent by 2030.102 n
CONCLUSIONS AND POLICY IMPLICATIONSThis chapter has shown how rural migration and rural and structural transformations complement each other in the process of economic and social development. Shifting labour from low-productivity sectors to those with higher productivity levels can contribute to raising incomes and GDP. Migration both within and between countries is part of this process. In most developing countries there is still a major productivity gap between agriculture – and rural areas in general – and other sectors of the
economy, such as manufacturing and services. This suggests that there is major potential for gains to be made in incomes and economy-wide productivity by shifting labour out of agriculture and into other sectors, largely through rural out-migration.
The theoretical and empirical literature points to two interpretations of the productivity gap. One emphasizes the existence of barriers that prevent potential migrants from taking advantage of better opportunities through migration. The other argues that gaps are due to labour selectiv ity on the basis of the characteristics of the migrants. In other words, the workers who do make the move are more productive because of their individual characteristics in terms of ability, skills, education levels and aptitude to take risks. The empirical evidence seems to suggest that both explanations concur in accounting for the productivity gap. The two call for policy interventions to address different levels of the migration drivers within our conceptual framework (Figure 19). However, if the objective is to turn migration into an effective instrument of development, interventions at both levels are needed.
To the extent that the productivity gap is caused by barriers to migration, this calls for policy interventions addressing the intermediate conditioning factors in Figure 19. This may involve reducing restrictions or costs to migration – be they explicit, l ike China’s hukou system, or implicit, such as poor road linkages to urban areas, inadequate communications infrastructure, or weakly defined land rights. It might also involve enabling migrants to overcome the financial cost of migrating, for example through portable social protection programmes. Another policy area could aim at strengthening facilitating factors, for example through the creation of mechanisms – including recruitment agencies – that promote information about opportunities available in different locations.
To the extent that the gap is the result of labour selectiv ity, this calls for policy interventions addressing the microfactors that intervene at the level of individuals and households. This would include investments in improving human capital in order to boost returns to labour. Key
| 72 |
CHAPTER 3 WHAT DRIVES RURAL MIGRATION: DETERMINANTS, CONSTRAINTS AND MIGRANT CHARACTERISTICS THE STATE OF FOOD AND AGRICULTURE 2018
recommendations include improvements in schooling and measures to improve other types of human capital, such as soft skills training.
While the policy implications discussed above refer to migration that is essentially voluntary, forced migration presents much broader and more intractable policy challenges. However, the types of policy interventions outlined above would also contribute to strengthening the resilience of rural households and their capacity to confront the challenges caused by crises. It has been highlighted that good governance and policies that promote sustainable agricultural practices can be decisive not only for managing protracted crises and coping with their consequences, but also for preventing them in the first place.
The discussion so far notwithstanding, rural development policies are st i l l relevant. When focused on promoting income-generating act iv it ies in rural areas, these policies wil l have impacts on migration as they affect the dif ferentials in l ivel ihood and employment opportunit ies between rural and urban areas (the macrofactors shown in Figure 19). This wil l
prov ide potential rural migrants more attract ive choices based on opportunit ies in both areas of orig in and destination. However, it is important to consider that migration is often the result of perceived deprivations and perceived causes of such deprivations being l inked to the place in which one l ives. These deprivations may not be purely economic, but rather l inked to social serv ices and overal l quality of l i fe. This implies that agricultural and rural development policies should be integrated into more holist ic approaches that take into account terr itorial aspects of development. A terr itorial development approach14 that transforms the rural–urban landscape by fostering the development of small cit ies and towns can play a key role by faci l itat ing structural transformation and the associated shif t of labour from agriculture to other sectors. As a consequence, it can make the transformation of rural areas smooth and inclusive, reducing the need for rural out-migration by promoting commuting. Furthermore, when needed it can reduce the costs of migration for rural residents, thus benef it ing them and the economy as a whole. n
| 73 |

SOUTH SUDANMigrants entering the Abyei Area Administration.©FAO/Marco de Gaetano

Key messages
1Although rural out-migration results in the loss of family labour, the final
impact on agricultural production depends on how important family labour is for farm work and how remittances are spent.
2 Remittances from out-migration allow rural households to diversify their
income sources and livelihoods, and can provide an important insurance against risk.
3 The movement of labour and migrant remittances can significantly affect
child nutrition and education, housing, and investments in agricultural or non-agricultural activities, with a myriad of potential indirect effects.
4 The potential challenges and negative effects of forced migration for rural
areas of origin and host countries and communities can be transformed into development outcomes that benefit both the displaced people and the host areas.
5 Developed countries benefit from migrants working in high-value
agriculture activities that are difficult to mechanize, but working conditions and labour protection are often in need of improvement.
CHAPTER 4IMPACTS OF
MIGRATION ON AGRICULTURE
AND RURAL AREAS

Rural migration – in particular out-migration – can have profound effects on rural development, food security and nutrition, and poverty, affecting agricultural production, rural households and the broader rural economy. The impacts of migration are felt both in migrants’ areas of origin and in their areas of destination. Understanding these impacts is important from an economic development perspective, not least because the implications of migration are often the subject of much heated debate. Negative perceptions of migration often result in policies that either explicitly or implicitly attempt to hinder or reduce migration. However, these policies risk restricting labour allocation in countries and markets that need it the most.
A significant strand of literature highlights the largely beneficial effects of migration on those who migrate,1 along with the benefits that can accrue for local communities and the economy as a whole. At the same time, a portion of the development economics literature also considers the positive and negative effects of migration on remaining households and communities. These effects are particularly exacerbated in the case of forced migration, which is on the rise – from 33.9 million individuals in 1997 to 65.6 million in 2016.2 Among other things, this is due to the protracted nature of contemporary crises and conf licts and to growing fragility, which includes the frequency and intensity of climate-related events.
This chapter reviews empirical evidence on the impacts of migration on rural areas. It f irst looks at the channels through which migration affects rural areas of origin and the different types of impacts that can be expected. It then reviews evidence on impacts of migration at the household level, as well as on broader impacts seen in rural communities and the wider
economy. This is followed by a discussion on the impacts of fragility and protracted crises on rural areas and how they interact with rural migration, agricultural and rural livelihoods, and food insecurity and malnutrition. Finally the chapter broadens the discussion to look at the effects of international migration on destination countries, in particular the agricultural sector and rural areas. n
MIGRATION IMPACT CHANNELSThe impacts of migration on rural communities will vary depending on the type of migration (e.g. short- or long-term, internal or international, voluntary or forced) and the context in which it occurs. These impacts are delivered through three main channels (as shown in Figure 24), which are particularly relevant for areas of origin, but also to some extent for those of destination. The first channel involves the migrant f lows themselves – i.e. people moving from one area to another. This can change the structure and composition of households of origin, including household labour supply, and affect rural labour markets (also in areas of destination) more broadly. The second involves f inancial transfers, or remittances, sent back by migrants to their households. Finally, there may be non-monetary transfers, often referred to as “social remittances”: ideas, skills and social patterns brought or transmitted back by migrants from their place of destination to their households and home communities.3,4
It is generally diff icult in practice to identify the unique contribution of each channel to the observed impacts, and empirically establishing and measuring the effects caused by migration also presents particular challenges (Box 13).
CHAPTER 4
IMPACTS OF MIGRATION ON AGRICULTURE AND RURAL AREAS
| 76 |

THE STATE OF FOOD AND AGRICULTURE 2018
Therefore, studies often analyse the effects of migration in a broad sense without being able to attribute the impacts to any precise causes. ix In protracted crises –whether brought on by conf licts, natural disasters or a combination thereof – where migration is mostly involuntary, mass displacements of people and the associated loss of assets can severely impact rural development, not only in the country from which people f lee but also in host countries. In these cases, while the three main channels il lustrated by Figure 24 remain valid, it can be extremely diff icult to distinguish between the impacts of migration per se and those of the crisis.
ix A recent paper by Romano and Traverso disentangles the various impact channels of international migration on household food and nutrition security in Bangladesh, providing empirical estimates of each.5
Migration can have different types of impacts on agriculture and on agricultural and rural households. If farm labour cannot be replaced after individuals migrate, households may choose to move out of labour-intensive activ ities or to rent out some of their land. Decisions on which crops to grow and which inputs or techniques to use may also shift from migrants to other household members. Looking at the long term, migrants may send back remittances, allowing households to make investments in the family farm (to increase productivity or to adapt the farming system) or in household enterprises; these may or may not be linked to agriculture. Remittances may also be used for non-farm investments, thus allowing households to diversify their income or to leave farming altogether. Under protracted crises however, remittances are likely to be
Movement of people
Financial transfers
Non-monetary transfers
CHANNELSMIGRATIONS
Short-term
Long-term
Internal
International
Seasonal
Circular
Return
COUNTRY
RURAL COMMUNITY
RURAL HOUSEHOLD
SOURCE: FAO.
FIGURE 24IMPACT CHANNELS OF MIGRATION
| 77 |

CHAPTER 4 IMPACTS OF MIGRATION ON AGRICULTURE AND RURAL AREAS
used mainly for survival purposes, for example for buying food or items to produce food, mostly for household consumption.
As shown in Figure 25 for the selected countries, significant shares of both rural and urban populations receive international remittances. In most but not all cases the share is higher for the urban population. According to the International Fund for Agricultural Development, at the global level around 40 percent of international remittances are sent to rural areas.6 On the other hand, rural households are probably much more likely to receive internal remittances, although these are generally not well-documented.
Remittances provide opportunities for households to make investments in other areas as well. Households can use them to improve nutrition (especially for children), for children’s education, and/or for investments in housing, durable goods or productive assets. Improving child nutrition is likely to be a priority in protracted crises or fragile contexts, where the prevalence of poverty and food insecurity is high. On the other hand,
investment choices depend on expected returns to alternative investments. Migration can stimulate productive investments if the rural investment climate is favourable. This is more likely for transitioning countries (see typology in Figure 3), although countries with development momentum may also be able to attract investments if concerted efforts are made (priorities on how to achieve this are discussed in more detail in Chapter 5). Finally, as discussed earlier in Chapter 3, migration offers households a type of informal insurance against income risk. The correlation between migrant income and agricultural income is likely to be much lower than the correlation between local off-farm wage labour and agricultural income, particularly if a given migrant moves a sufficient distance from his or her origin.8,9
In sum, depending on the context, migration can have various positive or negative impacts on agriculture or agricultural households. Although voluntary migration based on positive incentives is likely to bring gains to migrants through higher incomes and to the overall economy »
A major challenge when conducting research on t he impacts of migration is that the migration process is affected by factors that are difficult to observe. Migrants are likely to be different from non-migrants in both observable and unobservable ways, and naturally the benefits resulting from migration are not observable in advance. Moreover, households must choose which individual or individuals should migrate, or whether any should migrate at all. Migration is clearly a consequence of choice made by migrants and/or their households, and as such is not external to the household. Thus it cannot be established whether some of the observed factors are the result or the cause of migration. For example, it is difficult to isolate and measure the impacts of migration on agricultural production, as the latter may
have been affected by unobservable factors that also affect migration. So when attempting to establish a direct causal relationship between migration and agricultural production, the analyst may actually capture an association between the two factors rather than finding causality, given that both migration and agricultural production are affected by one or more unobservable factors.
However, despite the limitations of the empirical research, migration studies can be valuable in shedding light on migration drivers and impacts. This is especially true for context-specific case studies. More accurate data, information, improved analytical frameworks and refined methodologies will greatly help empirical analyses to overcome the existing knowledge gaps in migration studies.
BOX 13ESTABLISHING THE CAUSAL EFFECTS OF MIGRATION: THE LIMITATIONS OF EXISTING EVIDENCE
| 78 |

CHAPTER 4 IMPACTS OF MIGRATION ON AGRICULTURE AND RURAL AREAS THE STATE OF FOOD AND AGRICULTURE 2018
Rural Urban
0 5 10 15 20 25 30 35
Peru (2015)
Panama (2008)
Nicaragua (2013)
Mexico (2013)
Guatemala (2014)
Ecuador (2014)
Bolivia (Plurinational State of) (2008)
Serbia (2007)
Bulgaria (2007)
Albania (2005)
Kyrgyzstan (2013)
Iraq (2012)
Armenia (2013)
Pakistan (2014)
Nepal (2011)
India (2012)
Bangladesh (2010)
Viet Nam (2010)
Timor-Leste (2007)
Mongolia (2014)
Cambodia (2009)
United Republic of Tanzania (2010/2011)
Uganda (2013)
Sierra Leone (2011)
Senegal (2011)
Rwanda (2013)
Nigeria (2013)
Niger (2014)
Mozambique (2009)
Mali (2014)
Malawi (2013)
Kenya (2005)
Ghana (2013)
Ethiopia (2015)
Côte d'Ivoire (2002)
Cameroon (2014)
Burkina Faso (2014)
LATIN
AME
RICA
AND
THE
CARI
BBEA
NEU
ROPE
WEST
ERN
AND
CENT
RAL A
SIASO
UTH
ASIA
SUB-
SAHA
RAN
AFRI
CAEA
ST A
NDSO
UTHE
AST A
SIA
PERCENTAGE
FIGURE 25SHARE OF HOUSEHOLDS IN RURAL AND URBAN AREAS THAT RECEIVE INTERNATIONAL REMITTANCES
Source: FAO, 2018.7
| 79 |

CHAPTER 4 IMPACTS OF MIGRATION ON AGRICULTURE AND RURAL AREAS
through improved allocation of labour across economic sectors, there may be costs, particularly in the communities of origin. Some of these costs are likely to be borne publicly while many of the benefits accrue for individuals or businesses. It is therefore important for policy-makers to embrace migration and find ways to mitigate the associated costs. n
IMPACTS OF RURAL MIGRATION ON COMMUNITIES OF ORIGIN ARE SIGNIFICANT, BUT MIXEDMigration can affect household farm and non-farm production through remittances and changes in labour dynamicsThe impacts of migration on household farm and non-farm production are conveyed through the three channels il lustrated in Figure 24:
i. Migration of household members reduces the number of members remaining to work on the household farm. This also alters the age, gender and skill composition of the household, which can have implications for agricultural activ ities.
i i. Remittances can be used to increase household consumption, expand agricultural production, reshape farming systems and/or open a business in the non-farm sector, thus contributing to livelihood resilience through diversif ication.
ii i. Migrants may return with knowledge of new modern farming practices as well as information about income-generating activ ities outside of agriculture.
Coping with the reduction in family labour can be challenging for households when it cannot be replaced either by another family member, by hired labour, or through capital services. The loss of able-bodied labour can also affect the workload of the remaining women, children and elderly in the household, with various
implications for productivity. For example, women’s participation in the various steps of the agricultural production process could increase (Box 14). A study in northern Ghana showed that the loss of labour due to migration tends to keep households in poverty,10 while in China rural households that have lost labourers to migration have been found to have lower agricultural productivity than those who have not.11 Farmland is often under-cultivated or abandoned as a consequence of household labour shortages.12 Evidence also suggests that rural households whose main income comes from farming suffer more from losing labour to migration.13-15
The time spent by male and female household members on various activ ities, including agricultural work, is necessarily re-adjusted when a household member leaves. Data from the MOOP Consortium for Bangladesh, Ethiopia and Indonesia provide evidence on the household activ ities previously undertaken by migrants (Figure 26). Clearly, the tasks differ widely across countries and by gender. In Bangladesh and Ethiopia the largest share of male migrants were engaged in farm or business work. This share is significantly smaller for migrant women, who were mainly involved in household maintenance (in Bangladesh) and cleaning or cooking (in Ethiopia).
Migration may also lead to changes in intra-household div ision of labour along generational l ines. Rural–urban migration is dominated by young people, which can leave the burden of farm work to remaining elderly farmers. In China, migration of young people leads to an increased agricultural workload for those remaining in the household (the elderly and children) although it also results in the mechanization of some farm tasks.26,20 For some households, migrant remittances may afford them the option of hir ing more labour to cope with this increased workload. For instance, in Northeast Thailand remittances allow households to overcome labour constraints by hir ing non-household labourers.27 Similar results have been found in rural Ecuador28 and in the Todgha valley in Morocco.23 In Bangladesh, the abil ity to hire labour is reported to have prevented the decline of agricultural production in migrants’ areas of orig in.29
»
| 80 |
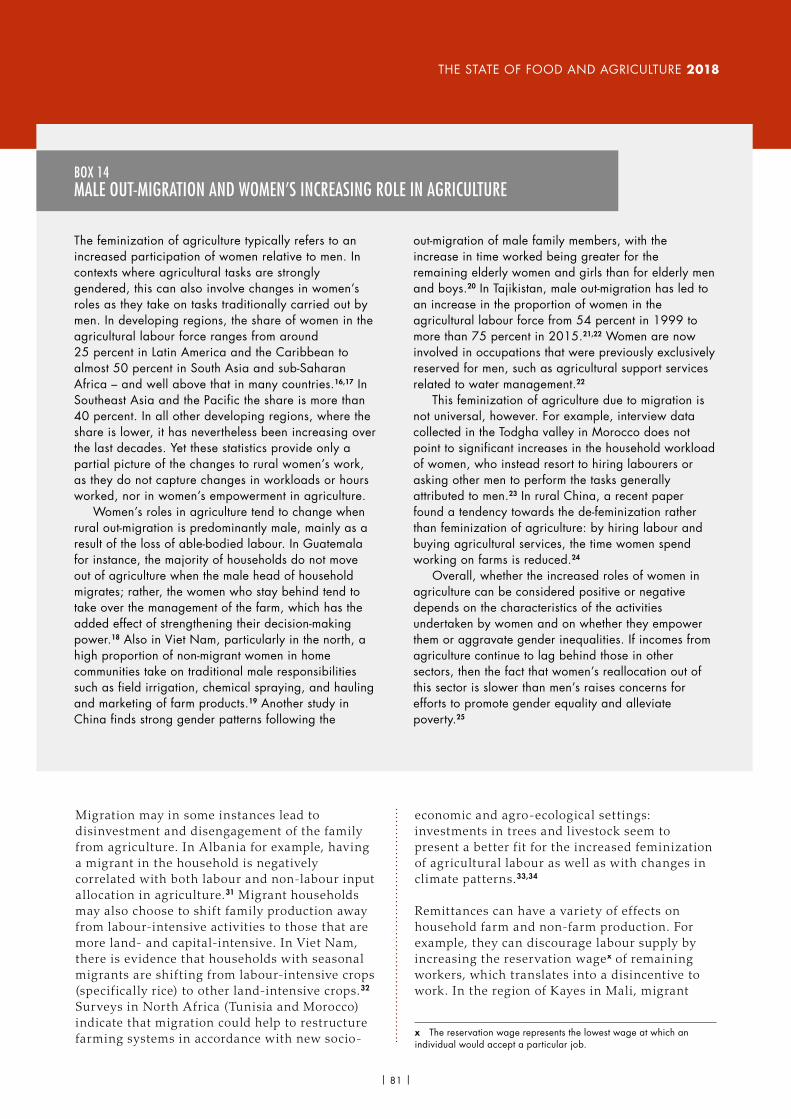
CHAPTER 4 IMPACTS OF MIGRATION ON AGRICULTURE AND RURAL AREAS THE STATE OF FOOD AND AGRICULTURE 2018
Migration may in some instances lead to disinvestment and disengagement of the family from agriculture. In Albania for example, having a migrant in the household is negatively correlated with both labour and non-labour input allocation in agriculture.31 Migrant households may also choose to shift family production away from labour-intensive activ ities to those that are more land- and capital-intensive. In Viet Nam, there is evidence that households with seasonal migrants are shifting from labour-intensive crops (specifically rice) to other land-intensive crops.32 Surveys in North Africa (Tunisia and Morocco) indicate that migration could help to restructure farming systems in accordance with new socio-
economic and agro-ecological settings: investments in trees and livestock seem to present a better f it for the increased feminization of agricultural labour as well as with changes in climate patterns.33,34
Remittances can have a variety of effects on household farm and non-farm production. For example, they can discourage labour supply by increasing the reservation wagex of remaining workers, which translates into a disincentive to work. In the region of Kayes in Mali, migrant
x The reservation wage represents the lowest wage at which an individual would accept a particular job.
The feminization of agriculture typically refers to an increased participation of women relative to men. In contexts where agricultural tasks are strongly gendered, this can also involve changes in women’s roles as they take on tasks traditionally carried out by men. In developing regions, the share of women in the agricultural labour force ranges from around 25 percent in Latin America and the Caribbean to almost 50 percent in South Asia and sub-Saharan Africa – and well above that in many countries.16,17 In Southeast Asia and the Pacific the share is more than 40 percent. In all other developing regions, where the share is lower, it has nevertheless been increasing over the last decades. Yet these statistics provide only a partial picture of the changes to rural women’s work, as they do not capture changes in workloads or hours worked, nor in women’s empowerment in agriculture.
Women’s roles in agriculture tend to change when rural out-migration is predominantly male, mainly as a result of the loss of able-bodied labour. In Guatemala for instance, the majority of households do not move out of agriculture when the male head of household migrates; rather, the women who stay behind tend to take over the management of the farm, which has the added effect of strengthening their decision-making power.18 Also in Viet Nam, particularly in the north, a high proportion of non-migrant women in home communities take on traditional male responsibilities such as field irrigation, chemical spraying, and hauling and marketing of farm products.19 Another study in China finds strong gender patterns following the
out-migration of male family members, with the increase in time worked being greater for the remaining elderly women and girls than for elderly men and boys.20 In Tajikistan, male out-migration has led to an increase in the proportion of women in the agricultural labour force from 54 percent in 1999 to more than 75 percent in 2015.21,22 Women are now involved in occupations that were previously exclusively reserved for men, such as agricultural support services related to water management.22
This feminization of agriculture due to migration is not universal, however. For example, interview data collected in the Todgha valley in Morocco does not point to significant increases in the household workload of women, who instead resort to hiring labourers or asking other men to perform the tasks generally attributed to men.23 In rural China, a recent paper found a tendency towards the de-feminization rather than feminization of agriculture: by hiring labour and buying agricultural services, the time women spend working on farms is reduced.24
Overall, whether the increased roles of women in agriculture can be considered positive or negative depends on the characteristics of the activities undertaken by women and on whether they empower them or aggravate gender inequalities. If incomes from agriculture continue to lag behind those in other sectors, then the fact that women’s reallocation out of this sector is slower than men’s raises concerns for efforts to promote gender equality and alleviate poverty.25
BOX 14MALE OUT-MIGRATION AND WOMEN’S INCREASING ROLE IN AGRICULTURE
| 81 |

CHAPTER 4 IMPACTS OF MIGRATION ON AGRICULTURE AND RURAL AREAS
households tend to give up their income-generating activ ities and rely almost exclusively on remittances.35 The same has been found in Sri Lanka.36 Similar results are also observed in rural Armenia, where labour market participation by both men and women decreases when households receive remittances from abroad.37 In rural Georgia, however, only the share of female labour supply decreases.38
On the other hand, remittances can also be used as insurance against income risk. This can encourage households to adopt high-return agricultural production technologies or to launch non-farm entrepreneurial businesses. In rural Ecuador for example, migrant households spend more on fertilizers and are more likely to accumulate cattle than their non-migrant counterparts.28 In Sri Lanka, rural remittance recipient households tend to have improved recourse to farm inputs (seeds and fertilizers) and benefit from better equipment (such as farm
storage facilities and post-harvest equipment, tractors, feed choppers, tube-wells and water pumps) than non-migrant households.36
Remittances from migration can also help households overcome credit constraints to invest in new technologies, or to meet the fixed costs involved in launching non-farm businesses.39,40 For instance, in rural Bangladesh a positive correlation has been found between international migration and the adoption of high-yield crop varieties.41 In the Philippines, households receiving higher remittances are more likely to start capital-intensive household enterprises.42 In some contexts, remittances can also have gender-sensitive impacts. In rural Armenia for example, women seem to engage more in self-employment when their households receive remittances or have return migrants.37
Notably, the role of remittances differs according to the socio-economic status of recipient
0
10
20
30
40
50
60
70
80
90
100
Male Female Male Female Male Female
BANGLADESH (2013) ETHIOPIA (2014) INDONESIA (2013)
PERC
ENTA
GE
Child or elderly care Household maintenance, cleaning and cooking Work on farm/business Other
FIGURE 26HOUSEHOLD ACTIVITIES PREVIOUSLY UNDERTAKEN BY MALE AND FEMALE MIGRANTS
NOTES: Share of reported unpaid household activity previously done by migrants includes: child or elderly care; household maintenance, cleaning and cooking; work on household farm or business; and other. The Indonesia survey only has two activity options: child or elderly care and household maintenance. The sample has a high level of non-response in Ethiopia and Indonesia (observations: Bangladesh m:871, f:159; Ethiopia m:289, f:290; Indonesia m:75, f:174).SOURCE: Poggi, 201830 based on MOOP Consortium data.
| 82 |

CHAPTER 4 IMPACTS OF MIGRATION ON AGRICULTURE AND RURAL AREAS THE STATE OF FOOD AND AGRICULTURE 2018
households. In rural China, increased village-level migration was found to lead to increased levels of productive investment among richer households but not among poorer ones.43 This suggests that in some contexts remittance rates may be too low to generate sufficient capital for investment, as was also found to be the case for internal migrants in several African countries.44 Data for f ive countries from MOOP Consortium surveys reveal that expenses in agriculture by rural migrant households only represent a small share of total remittance use (Figure 27). In all cases, the largest share of remittances (30–40 percent) is dedicated to daily consumption. Agriculture accounts for a substantial share only in Ethiopia (12 percent), while the shares in the other countries are below 4 percent and close to zero in Zimbabwe.
Ultimately, the impact of migration on household agricultural production is seen in the net effect of the loss of family labour and the
positive impact of receiving remittances. For example, a negative net effect is seen in Nepal, where migration induced a labour shortage while remittance-receiving agricultural households did not invest in improving agriculture productiv ity.45 In other cases, the negative effect of migration on labour availability can be offset by reinvestment of remittances.46 In northwest China, the loss of family labour in lower-return grain crop production is l ikely to be balanced by the gain from investing in capital-intensive and profitable cash-crop production.47 Further evidence from China shows that remittances partially compensate for the lost-labour effect, contributing to household incomes directly as well as indirectly by stimulating maize production.11,48 Similar results have been found for maize production in the southern Ecuadorian Andes.49 Likewise, f indings by Taylor and Lopez-Feldman show a positive effect of remittances on land productiv ity in rural areas of Mexico.50
0
10
20
30
40
50
60
70
80
90
100
BANGLADESH(2013)
ETHIOPIA(2014)
GHANA(2013)
INDONESIA(2013)
ZIMBABWE(2015)
PERC
ENTA
GE
Daily consumption Education Health Business Other Agriculture
FIGURE 27HOUSEHOLD USE OF CASH REMITTANCES
NOTES: MOOP household-level data (sample observations: Bangladesh 746; Ethiopia 485; Ghana 338; Indonesia 524; Zimbabwe 512). Weighted share of cash remittance (weighted by the number of reported uses, between 1 and 4 per household) for the following uses: daily consumption (food, clothing, drinks, tobacco); education; health; agriculture (production, equipment, land mortgage or purchase); business (transport, equipment, stock or commercial land); other (special or religious occasions, home land or construction, durables, savings, insurance, charity, loan repayment, future migration). SOURCE: Poggi, 201830 based on MOOP Consortium data.
| 83 |

CHAPTER 4 IMPACTS OF MIGRATION ON AGRICULTURE AND RURAL AREAS
consideration.54 However, the relationship between the impacts of migration on rural households and agricultural production and the contextual factors that affect those impacts remains under-studied.55-58
Out-migration from rural areas can lead to improved food security and nutritionRural out-migration can present food security and nutrition challenges for those who stay behind in rural areas. Shortages of able-bodied workers can reduce farm productivity and ultimately increase food insecurity, as has been documented in Zimbabwe.59 Changes in household dynamics can disrupt care arrangements for family members, which can have a negative effect on their health and well-being. However, either seasonal or long-term migration can also help households support basic subsistence consumption,60 which can lead to improvements in food security and nutrition.
Evidence from Bangladesh shows that seasonal migration stabilizes food security and increases protein consumption during the famine season (see Box 15).61 Likewise in Viet Nam, short-term migration has improved household food security through increased food expenditures and calorie consumption per capita.62 In the Lao People’s Democratic Republic, long-term migration of younger household members to neighbouring Thailand plays a large role in helping households meet consumption needs.63 Similar results are seen in other countries as well, with a study in India suggesting that remittances improve the purchasing power of households and contribute positively to household food security,64 while in northern and central Malawi the household Food Insecurity Experience Scale (FIES) indicates that households with migrant members are less likely to be food-insecure.65 xi
Similar effects are also seen in terms of child nutrition and health. A positive correlation was found between migration from Guatemala to the United States and child height, along with a negative correlation between migration and the prevalence of stunting.67 In El Salvador, while the
xi Further discussion on the impact of migration on food security can be found in a joint report by FAO and other technical agencies.66
In addition to remittances migrants can also bring in non-monetary transfers, such as knowledge about improved techniques in farming that can enhance production in rural areas. For example, interviews and focus group participants from Jamaica report that migrants have introduced farm workers to the use of certain types of equipment and to greenhouse and hydroponics technology for growing crops.51 And in Burkina Faso return migrant households are more likely to have made agricultural asset expenditures over the past 12 months compared to those without a return migrant.15
As seen in this chapter, the concrete effects of migration on rural livelihoods and economic activ ities are diverse and context-specific. They depend on the type of migration, who migrates and who remains, the development level of the community, and the period for which the effects of migration are assessed. In rural Ethiopia, on average migration has a positive impact on rural liv ing standards, but the gains are not evenly distributed; poorer households with migrants actually experience a decline in liv ing standards.52 In rural Bangladesh, households that engage in more costly cross-border migration are more likely to employ modern farming technology and thereby achieve higher productivity. Poorer households, however, are unable to overcome the entry costs of international migration and must fall back on domestic migration with lower net returns.41
Drawing on evidence from China, Croll and Ping identify a range of conditions under which migration can either supplement income-generating activ ities, subsidize the investment cost of agriculture or substitute for village agriculture. Their results suggest that migration can be a supplement to agricultural and non-agricultural activ ities in richer regions, a subsidy to agricultural and non-agricultural activ ities in mid-income regions, and a substitute for agriculture in poor and remote regions.53 Similarly, a recent study on the contextual effects of migration on rural livelihoods in China concluded that the effects are contingent on the specific configuration of a rural community’s level of economic development, geographic locality, land resources and level of dependence on agriculture, as well as on the period under
| 84 |

CHAPTER 4 IMPACTS OF MIGRATION ON AGRICULTURE AND RURAL AREAS THE STATE OF FOOD AND AGRICULTURE 2018
prevalence of stunting for children increased during the 2008 food price crisis, children in households with international migrants experienced less stunting.68 In Tajikistan, migration appears to have similar effects on children – in this case, improved physical growth.69 Additionally, in some contexts where out-migration particularly concerns men, women who are left behind may experience increased decision-making power regarding health, care and intra-household allocation of food, allowing them to improve the nutrition of young children in the household.70
However, the potential benefits of out-migration listed above could be offset by the substantial disruptions it can cause in household and childcare arrangements.71-73 These changes in
household dynamics can negatively impact spouses and elderly parents who are left behind. For example, in rural China married individuals whose spouses have migrated and the elderly parents of migrants fare worse in terms of physical health than those whose spouses or adult children have not migrated.74,75 Studies from four Asian countries – China, Indonesia, the Philippines and Viet Nam – found that adults in migrant households are more likely to report depressive symptoms, although they also found that receiving monetary remittances helps mitigate these mental health costs.76-78
The famine season in Bangladesh – the monga – occurs annually between the post-planting and pre-harvest periods. During this “hungry” season, which is also experienced in agrarian areas throughout South Asia and sub-Saharan Africa, work opportunities are scarce and grain prices rise, thereby destabilizing income and consumption. In this context, Bryan, Chowdhury and Mobarak conducted the first randomized controlled trial to test the effects of induced out-migration on households of origin across different dimensions of food security, nutrition, education, labour force participation and agricultural investment.61
In the experiment, participants were given cash to cover a little more than the round-trip cost of safe travel from two seasonal famine-prone districts in the Rangpur region of northwestern Bangladesh to four nearby towns, where non-farm jobs are much more abundant. Participants were also given information on the types of jobs available (such as rickshaw-pulling and construction), the chances of getting them, and the average wages associated with each type. Data on
consumption, income, assets, credit, savings and migration experiences were collected before and after the onset of the 2008 monga season.
The results reveal that out-migration increased the food and non-food expenditure of migrants’ households by 30–35 percent and boosted consumption of protein and calorie intake by 550–700 calories per person per day. Educational expenditure on children also increased significantly. Regarding female labour force participation, school attendance and agricultural investment, no changes were observed.
Although seasonal out-migration has been shown to improve livelihoods, the incidence of seasonal out-migration from monga-prone districts is particularly low due to credit constraints faced by people living very close to the subsistence level. The high risk of investing in migration creates a poverty trap in which the extreme poor fail to take advantage of migration opportunities. The authors suggest conditional transfers to address this constraint and generate efficiency gains.
BOX 15STABILIZING FOOD SECURITY AND INCREASING PROTEIN CONSUMPTION THROUGH MIGRATION: THE MONGA SEASON IN BANGLADESH
SOURCE: Bryan et al., 2014.61
| 85 |

CHAPTER 4 IMPACTS OF MIGRATION ON AGRICULTURE AND RURAL AREAS
Rural out-migration affects education and employment aspirations for children and youth Remittances from migration allow households to make investments in improving children’s education. Moreover, children’s educational aspirations can be inf luenced by migrant success stories, including the importance of the education they receive while liv ing in more developed societies. Throughout the 1990s in El Salvador, following the massive war-related emigration of the 1980s the probability of leaving school in rural areas was lower for individuals in households receiving remittances, irrespective of the amounts.79 In the Philippines, Theoharides f inds that a 1 percent increase per year in international migration results in a 3.5 percent increase in secondary school enrolment.80 And in Egypt, remittances have been shown to have a strong positive effect on attendance among university-age boys and young girls and boys.81
However, migration can also negatively inf luence the decision to invest further in schooling. Examining the overall impact of migration on educational attainment in rural Mexico, McKenzie and Rapoport found that liv ing in a migrant household reduces school enrolment among boys aged 12–18 in junior high school and high school and girls aged 16–18 in high school.82 Similar results were found in China,83 Tunisia and Romania.84
Migration might influence aspirations towards agricultural jobs among young adults: causal links have been found between migrant remittances and youth aspirations towards education, migration and employment in agriculture. Using qualitative data on Bangladeshi youth in migrant-intensive villages, Rashid and Sikder found that having migrants in the same family pushes youth to consider education and migration highly and therefore to leave agriculture.85 However, as found in some ethnographic studies in West Africa, local customs also play a role in the way youth view agriculture and migration as part of their future.86,87 Gaibazzi shows that in the Soninke population from the Upper River valley in the Gambia (a migration-intensive rural area), young men are trained to embody an agrarian ethos,
reinforced by migratory dynamics, in order for them to be able to pursue both agricultural and migratory livelihoods.86 These examples suggest that the topic of youth employment aspirations warrants more qualitative and quantitative research to determine its significance for rural migration and agriculture.
Remittances allow rural households to build wealth and invest in assets The cost of sending one member to migrate may initially reduce household wealth and assets, however the return on the investment is expected to offset this initial cost. In the absence of adequate social insurance, migration thus becomes part of the income diversif ication strategy of the rural household. In the Philippines, international remittances act as social insurance in the face of negative income shocks: roughly 60 percent of reductions in household income are compensated for by remittance inf lows from overseas.88 Also in India, Rosenzweig and Stark have identif ied an implicit strategy of marrying off daughters to distant locations to mitigate income risks.89
Remittances from migration are largely used to improve households’ durable assets such as housing, vehicles, televisions and radios, as shown by evidence from China,43 Egypt,90 Nigeria,91 Malawi,92 and the Philippines.93 In a systematic review of 18 studies on internal migration in developing countries, Housen, Hopkins and Earnest reveal overwhelming evidence of the positive impacts of internal remittances on source households’ livelihoods – namely a reduction in the depth of household poverty and an increase in household investments in housing and education.56 Evidence from Asian countries confirms these findings, revealing that remittances help ensure food security, reduce poverty, provide more education for children, ease credit constraints in farming, pay for farm inputs, and repay debts.19,94 In Egypt, Adams has found that the number of poor households declines by 9.8 percent when remittances are included in household income;95 this is further substantiated by Arouri and Nguyen, who conclude that international migration helps migrant households increase their wealth index.90 Finally, in Ghana
| 86 |

CHAPTER 4 IMPACTS OF MIGRATION ON AGRICULTURE AND RURAL AREAS THE STATE OF FOOD AND AGRICULTURE 2018
households receiving remittances have a lower probability of falling into poverty and devote less money to food items and more to education, housing or health.96 n
RURAL MIGRATION HAS INDIRECT IMPACTS ON RURAL COMMUNITIES AND THE BROADER ECONOMYPositive impacts of out-migration can spread to entire rural communities Households are part of local, regional and national economies. Remittances from migration have immediate impacts on household welfare and livelihoods, but these impacts can also spread to other members of the community of origin through local market linkages. The spillover effects of migration include changes in wages and prices, dynamic effects resulting from investments, and the response in terms of supply and demand for labour, goods and services. These indirect effects are likely to be substantially greater than the direct effects on which researchers and policy-makers normally focus.97
Key channels through which the effects of migration are propagated to rural communities are local markets for labour, food, and other locally-produced goods and services for which demand may increase as a result of remittances. However, capturing and measuring the exact market wage and price effects in rural settings is a complex task, and only a few empirical studies have attempted to do so.
A paper by Akram, Chowdhury and Mobarak presents an experiment that offers a clear example of the village-level wage effects of seasonal migration in Bangladesh (see Box 16).98 The experiment offers incentives for landless labourers to pursue seasonal migration, as their wages can be accurately measured in the market. The findings indicate that emigration increases the male agricultural wage rate in
villages of origin, although agricultural prices in the villages remain unchanged.
Rural return migrants usually exhibit high economic performance, which benefits their communities of origin. In China, return migrants with working experience outside their original hometown are likely to bring back accumulated human, social and financial capital that can enable them to start their own businesses. Urban sojourns afford migrants the opportunity to accumulate funds, gain management experience, and forge business contacts in cities – which translates into social capital that they can mobilize upon their return.99-101 For example, return migrants in China invest twice as much in productive farm assets as non-migrants.102 Investing remittances into agricultural development projects can also be encouraged through pilot programmes or other initiatives (see example in Box 17).
Return migrants in China are also more likely to be engaged in non-farm work, which contributes to rural development and helps to revitalize rural economies and alleviate poverty in less-developed areas of the country.100,101,103-105 Similar results are found in Georgia, where 8 percent of households with a return migrant operate a non-agricultural business, versus 2 percent of those households without.38 In Egypt return migrants have been found to accumulate savings and experience overseas, which increases their chances of becoming entrepreneurs.106 However, evidence shows that this mostly involves migrants acquiring the capital or skills to invest in urban areas, while those who are less successful during their period of migration return to their v illages of origin.107
Migrants can contribute to improving rural communities through monetary remittances and involvement in community development projects, as is the case for rural–urban migrants in two states of southeastern Nigeria.108 Similar examples are found in Mexico109 and China. Interestingly, Pizzi shows that Chinese villages with higher rates of migration are more likely to have access to public drinking water, which is probably explained by the fact that migration increases the chance that a village will have access to external support for water provision.110
| 87 |
CHAPTER 4 IMPACTS OF MIGRATION ON AGRICULTURE AND RURAL AREAS
Migrant contributions can also affect social capital and social norms in communities of origin. In rural Kyrgyzstan for example, migrant households are more likely than non-migrant households to provide financial assistance to others and receive labour contributions in return.111 Households that receive remittances in Mozambique have been found to show greater commitment to cooperative arrangements in the community.112 And having out-migrating relatives and friends is positively associated with pro-social behaviour and active civic engagement for individuals who remain in rural communities in Bulgaria and Romania.113
In terms of income inequality, the impacts of migration on communities of origin is ambiguous; they depend on migrant characteristics and on the development level of
communities. Household survey data from several countries show that in most countries there are proportionately fewer households receiving remittances among those that engage the most in agriculture (Figure 28). This may indicate that migration affords a pathway out of agriculture, but it could also indicate that those most involved in agriculture are the least likely to migrate, due to f inancial constraints, among others. In such contexts, the most vulnerable households, which may not have access to migration opportunities, may see their relative positions worsen. For example in a high-migration community of Nicaragua, remittances are found to increase income inequality among households.114 Likewise in the Todgha Oasis valley in Morocco, international migrant households have purchased twice as much agricultural land as non-migrant households.115
Given the scant research conducted on the impacts of out-migration beyond migrants and their immediate families, a study by Akram, Chowdhury and Mobarak stands out for its evidence showing the effects of migration on the broader rural labour and food markets.98 Building on the design of a previous study discussed in Box 15,61 it also analyses the spillover effects of increased emigration on non-beneficiaries.
In this study, a subsidy of 1 000 Taka (USD 13) was offered to 5 792 potential seasonal migrants across 133 villages in Bangladesh during the 2014 lean agricultural season (between September and December) to cover the round-trip cost of travel to nearby cities with job opportunities. The results show that seasonal migration not only benefits migrants and their families but also indirectly improves the welfare of the broader rural economy.
The results shed light on the functioning of the country’s rural labour and food markets:
� Migration leads to higher income earned at home due to an increase in the village-level
wage rate and in available work hours. Non-beneficiary households also benefit from this. For beneficiary households migration opens up new labour market opportunities at both origin and destination, allowing them to diversify their income sources.
� The results suggest that a 10 percent increase in the out-migration rate leads to a 2.8 percent increase in wages in the village.
� The study found that the wage bill for agricultural employers increases, which reduces their profit with no significant change in yield.
� Although most of the migration income is used for consumption, there is no systematic effect seen on food prices, suggesting that food markets are better integrated than labour markets across villages.
� An increase in the number of people planning to migrate increases the take-up rate of the migration offer, and also increases migration from non-beneficiary households.
BOX 16IMPACTS OF MIGRATION ON RURAL LABOUR AND FOOD MARKETS IN BANGLADESH
SOURCE: Akram et al., 2017.98
| 88 |

CHAPTER 4 IMPACTS OF MIGRATION ON AGRICULTURE AND RURAL AREAS THE STATE OF FOOD AND AGRICULTURE 2018
In contrast, Zhu and Luo found evidence in China that migration reduces rural inequality as it benefits poorer households to a larger extent than rich households.116 They emphasize that migration offers opportunities to diversify sources of income for households with little comparative advantage in farming. Similar results are found by de Brauw and Giles while studying the effects of village-level migration on a large number of households in rural China.43 They used village-level data to take account of both the direct effects of migration on migrant households and the indirect effects on other households in the village. They found that increased migration from rural villages led to a significant reduction in inequality for villages of origin due to increases in per capita income, especially for poorer households. This is partly a
consequence of the direct impact on incomes of remittances received by migrant households, mostly from the poorest tercile, but also of the impact of out-migration on local labour markets. The reduction in local labour supply caused by out-migration leads to increased wages: as employment opportunities are created by investing remittances in local production, increased demand for labour – which is mostly supplied by poorer households – pushes wages up even further.
Migration can raise overall productivity and foster tradeMigration contributes to the broader economic development of regions and countries and can encourage positive long-term structural changes
Tajikistan is a major recipient of remittances, mainly from the Russian Federation and Kazakhstan. Depending on the year, personal remittances can vary from 20 to 40 percent of GDP, although the figure could be even higher as remittances can be sent home through informal channels as well. The vast majority of remittance flows (up to 90 percent) at destination are spent on primary needs (food consumption, housing, education, etc.) while a much smaller portion go to savings and investments in rural areas. However, these funds can be put to even greater use by channelling them into agriculture, the country’s second-largest sector but which has been suffering from low productivity. This would catalyse rural development by promoting food security and nutrition, employment creation, and inclusive growth.
An FAO pilot programme aims to mobilize the human and financial resources of migrant workers and their families in order to contribute to the development of agriculture and the sustainable development of Tajikistan in general.i Through this programme, FAO assists migrants and their families and communities in formulating small- and medium-scale projects in fruit
and vegetable farming, livestock production and agribusiness. The project uses the “1+1 approach”: for every dollar invested by migrant workers from remittances, an additional dollar is made available from project funds. Furthermore, capacity development programmes enable migrant families to build skills in small and medium business development in the agricultural sector.
To be eligible for participation in the pilot programme applicants must be migrants or returnees, women with household responsibilities receiving remittances from a first-degree relative, or forced returnees with proven ineligibility to migrate abroad. The inclusion of returnees and forced returnees is vital, as migrants are increasingly returning to their home countries and their successful reintegration into society requires a broadening of employment opportunities. The applicants receive support from specialists to further develop eligible ideas into business plans. An Oversight Committee evaluates the final applications and assigns the grants, which are delivered in cash. The pilot includes capacity development programmes to build skills in small and medium business development.
BOX 17PROMOTING INCLUSIVE ECONOMIC GROWTH BY MATCHING GRANTS FOR AGRICULTURE AND AGRIBUSINESS IN THE REPUBLIC OF TAJIKISTAN
i The pilot is being implemented in the Hissor and Jaloliddin Balkhii districts in Tajikistan in collaboration with the Ministry of Labour, Migration and Employment of the Population; the Ministry of Agriculture; the Ministry of Economic Development and Trade and Finance; the International Organization for Migration; and the National Farmers' Association.
| 89 |

CHAPTER 4 IMPACTS OF MIGRATION ON AGRICULTURE AND RURAL AREAS
0 5 10 15 20 25 30 35 40
Peru (2015)
Panama (2008)
Nicaragua (2013)
Mexico (2013)
Guatemala (2014)
Ecuador (2014)
Bolivia (Plurinational State of) (2008)
Serbia (2007)
Bulgaria (2007)
Albania (2005)
Kyrgyzstan (2013)
Iraq (2012)
Armenia (2013)
Pakistan (2014)
Nepal (2011)
India (2012)
Bangladesh (2010)
Viet Nam (2010)
Timor-Leste (2007)
Cambodia (2009)
United Republic of Tanzania (2010-2011)
Uganda (2013)
Sierra Leone (2011)
Senegal (2011)
Rwanda (2013)
Nigeria (2016)
Niger (2014)
Mozambique (2009)
Mali (2014)
Malawi (2013)
Kenya (2005)
Ghana (2013)
Ethiopia (2015)
Côte d'Ivoire (2008)
Cameroon (2014)
Burkina Faso (2014)
LATIN
AME
RICA
AND
THE C
ARIB
BEAN
EURO
PEWE
STER
N AN
DCE
NTRA
L ASIA
SOUT
H AS
IAEA
STER
N AN
D SO
UTHE
AST A
SIASU
B-SA
HARA
N AF
RICA
PERCENTAGE
Greater than or equal to 30 percent of income from agriculture Less than 30 percent of income from agriculture No agricultural income
Mongolia (2014)
FIGURE 28SHARE OF RURAL HOUSEHOLDS RECEIVING INTERNATIONAL REMITTANCES, BY PARTICIPATION IN AGRICULTURE
SOURCE: FAO, 20187
| 90 |

CHAPTER 4 IMPACTS OF MIGRATION ON AGRICULTURE AND RURAL AREAS THE STATE OF FOOD AND AGRICULTURE 2018
» in their economies. Labour scarcity caused by rural out-migration can encourage agricultural mechanization and technological improvements in areas of origin. Following the out-migration that ensued from the 1927 Great Flood in the Mississippi Delta of the United States of America, Hornbeck and Naidu show how the economy had to restructure itself around labour scarcity, with landowners increasing their capital equipment and machinery as a result.117 The authors suggest that by decreasing agricultural labour availability, rural out-migration has the potential to encourage subsequent agricultural development. A similar trend can be observed in China, where between 1993 and 2009 labour input in agriculture fell substantially due to rural out-migration, both in terms of the share of households engaged in farming and in the number of hours of farm work (Figure 29).118 In spite of this, according to national statistics, during the same period the value of agricultural
production rose by 297 percent in real terms, while cereal y ields grew by 19.5 percent. The power (measured in kilowatts) used by agricultural equipment increased by 175 percent over the same period.119 These statistics suggest that capital is beginning to supplant labour in Chinese agriculture.
Out-migration from rural areas can contribute to productivity growth at the national level and lead to potentially large economic gains as labour is allocated to other high income-generating activities in the non-farm sector. The resulting labour scarcity can also motivate adoption of labour-saving agricultural technologies, allowing for further redirection of labour to activ ities with higher returns. In addition, remittances can allow rural households to engage in higher-return, non-farm businesses in rural areas themselves. The results of a study by Dinkelman et al. on the long-term effects of migrant capital on rural labour markets in Malawi indicate that districts
0
10
20
30
40
50
60
70
80
90
100
0
500
1 000
1 500
2 000
2 500
3 000
1993 1997 2000 2004 2006 2009
SHARE OF RURAL HOUSEHOLDS IN AGRICULTUREHO
URS
OF F
ARM
WOR
K
Hours of farm work Share of rural households in agriculture
FIGURE 29HOURS OF FARM WORK AND SHARE OF RURAL HOUSEHOLDS IN AGRICULTURE IN CHINA, BY SURVEY ROUND
SOURCE: de Brauw et al., 2013, Table 1.118
»
| 91 |
CHAPTER 4 IMPACTS OF MIGRATION ON AGRICULTURE AND RURAL AREAS
receiving higher remittances have more investments in manufacturing or services. These districts tend to urbanize faster and become more prosperous than other districts that receive less migrant capital.92
Out-migration can enable economies of scale in agriculture by relieving pressure on land, leading to more land consolidation. Additionally, as agriculture becomes more capital-intensive, productivity increases, allowing farming to be operated on larger plots. For example, Boyer et al. suggest that the massive emigration of Irish labourers to the New World after the Great Famine of 1845–1852 reduced the strain on land and permitted long-term growth of real agriculture wages.120 Furthermore, Adamapolous et al. argue that in China restrictions on land use and land rights have led to both more land fragmentation and more labour use in agriculture than what would be optimal.121 Their analysis suggests that if such restrictions were lifted, there would be a substantial reallocation of labour into non-agricultural activities, with a concurrent rise in real GDP per worker of 75 percent.
International migrant diaspora communities can also facil itate trade between origin and host countries. In particular, migrants’ consumption of products from their country of origin and their business knowledge of both markets can foster exports of agricultural products. A survey conducted among immigrants in the United States of America coming from 14 Latin American countries revealed that on average more than 70 percent of immigrants buy home-country goods.122 In El Salvador, exports of traditional foods such as tortil la f lour and red beans account for at least 10 percent of total exports to the United States of America.123 Businesses are established in both countries to trade agricultural products: Salvadorean producers open stores in the United States of America to serve the migrant community, and the migrants set up export-led f irms in their home countries.122 The demand for traditional food crops (cassava and yams) among migrants in New Zealand, Australia and the United States of America has also been shown to boost exports from Tonga.124 Information from immigrant
diasporas from 12 countries in South Asia and Latin America and the Caribbean shows that migrants’ average expenses on so-called “nostalgia goods” in the United States of America are about USD 750 per person per year, and may amount to over twenty bill ion dollars annually.125 Trade in foods and artisanal products by migrants helps countries of origin to integrate into international value chains and the global marketplace. The home-country products are produced to meet foreign safety standards and marketed to reach non-diaspora consumers as well.126
However, there may also be negative effects on exports – including possibly agricultural exports – from countries of out-migration. This can happen in particular for countries where remittance inf lows are quite large relative to GDP, for those with significant levels of agricultural exports and for those that lack the capacity to absorb foreign exchange inf lows (e.g. in the form of remittances) without leading to a large appreciation of the real exchange rate. There is evidence that in many such countries (for example in Central America127), this appreciation has led to higher consumption of non-tradable goods while simultaneously penalizing exports. n
FORCED MIGRATION DUE TO PROTRACTED CRISES DISRUPTS RURAL LIVELIHOODS, BUT ALSO OFFERS POTENTIAL BENEFITS TO HOST COMMUNITIESMass displacements of people and the associated loss of assets can severely impact economic development, including rural development, not only in the country from which people f lee but also in host countries. Most displacement crises persist for many years. More than 80 percent of refugee crises last for 10 years or more, while two in f ive last 20 years or more. The persistence of crises in
| 92 |

CHAPTER 4 IMPACTS OF MIGRATION ON AGRICULTURE AND RURAL AREAS THE STATE OF FOOD AND AGRICULTURE 2018
countries with internal displacement is also significant: in 2014 more than 50 countries were reported to have people liv ing in internal displacement for more than 10 years.128
Extreme fragility can lead to a deterioration in people’s livelihoods: it l imits economic opportunity, reduces access to land and natural resources, stif les investment opportunities and depletes household assets.129 Local and national economies can shrink, making it increasingly diff icult to earn a liv ing. Protracted crises undermine household and community resilience and force people to adopt increasingly negative coping strategies, the result of which puts their livelihoods and food security at risk.130 However, understanding these impacts, both in the short and longer term, is not easy. As mentioned earlier in Chapter 3, it can be particularly diff icult to distinguish between the impacts of migration per se and those of the crises that lead people to migrate in the first place.
Protracted crises disrupt food systems and rural livelihoods and threaten food security and nutritionIn most protracted crisis situations the majority of the population is rural and therefore largely dependent on agriculture, livestock, f isheries, and other natural resources for their livelihoods. In extremely fragile contexts the contribution of agriculture to GDP is two to four times higher than in the rest of the world, and in 2015 agriculture accounted for more than 37 percent of GDP in countries characterized by extreme fragility (Figure 30). In the same year, agriculture accounted for an average of 35 percent of GDP for countries in protracted crisis.131 Both migrating (e.g. IDPs or refugees) and non-migrating individuals in these challenging contexts depend on access to productive resources such as land and inputs in order to engage in agriculture for survival.
0
5
10
15
20
25
30
35
40
45
2002 2003 2004 2005 2006 2007 2008 2009 2010 2011 2012 2013 2014 2015
PERC
ENTA
GE
Extreme fragility Fragile Rest of the world
FIGURE 30AGRICULTURAL VALUE ADDED AS A PERCENTAGE OF GDP, BY FRAGILITY LEVEL, 2002–2015
NOTES: Data is based on OECD’s multidimensional fragility framework.131
SOURCE: OECD, 2016131 Figure 3.8.
| 93 |
CHAPTER 4 IMPACTS OF MIGRATION ON AGRICULTURE AND RURAL AREAS
The impacts of protracted crises on food systems are felt across the entire food value chain, including production, harvesting, processing, transportation, financing, and marketing.130 They disrupt food production by delaying or preventing crop planting and destroying fields, crops, pastures, and orchards. They damage food preparation and storage facilities and irrigation infrastructure and machinery. Finally, these crises disrupt markets and availability of input supplies and labour and can ultimately depopulate rural areas as people are forced to move.
For example, the crop and livestock sectors in the Syrian Arab Republic have suffered greatly from the ongoing conflict, with costs to these sectors amounting to an estimated USD 16 billion in damage and losses. Displacement has resulted in fewer rural workers available for livestock rearing or crop production. Many households have sold their livestock to generate income – as much to support the cost of migration as to buy food. In pastoral areas of Africa protracted crises are having a profound effect on livelihoods and on long-standing livestock migration and trade routes.130,132 Conflicts in Ethiopia, Kenya and Uganda have contributed to the breakdown of traditional systems governing the mobility of herds seeking pasture and water and contributed to conflict both within and between countries. Consecutive years of below-average rainfall, El Niño-induced drought, and concentration of livestock onto increasingly smaller areas of land (due to constrained mobility) have resulted in significant degradation of the environment, including soil erosion, overgrazing, loss of soil fertility, deforestation, and bush encroachment. Taken together, the result is an erosion of self-sufficiency and resilience, putting at tremendous risk the long-term viability of pastoral livelihoods.
The proportion of undernourished people liv ing in countries in conf lict and protracted crisis is almost three times higher than in other developing countries.133 Moreover, particularly in settings affected by conf licts and protracted crises, multiple forms or burdens of malnutritionxii can co-exist simultaneously in the
xii Malnutrition manifests itself in the following forms: undernutrition (including stunting, wasting and underweight), overweight and obesity, and micronutrient deficiencies.
same community, household and individual. For instance, Grijalva-Eternod et al. found a high prevalence of both undernutrition and obesity among refugee households of the Western Sahara.134 Recent studies also show that children can suffer simultaneously from wasting and stunting, and the prevalence of this concurrence tends to be higher in countries suffering from conf lict or protracted crises.135
Refugees present challenges for host countries, but also opportunities for beneficial economic interactions with local communities Large inf luxes of refugees and/or IDPs can create serious political and economic challenges for host countries and communities. Both host countries and countries of origin tend to be developing, often with limited resources to address the specific needs of large numbers of displaced people. As seen in Chapter 2, globally at least one-third of refugees are found in rural areas, and in sub-Saharan Africa the share is more than 80 percent. Inf lows can swell populations, straining basic social services, labour and housing markets, as well as governance systems.129 Increased competition for natural resources, jobs and housing can destabilize what may already be a fragile or unstable situation.
The humanitarian crisis in the Syrian Arab Republic has had a significantly negative impact on Lebanon’s economy.136 For example, many of the 1.5 million Syrian refugees have brought substantial numbers of unvaccinated livestock into the country. The potential impact on local agriculture is particularly worrisome, as livestock is the mainstay of Lebanon’s rural economy; this could also have a significant impact on rural well-being, particularly in areas bordering the Syrian Arab Republic. In 2015 FAO supported the Lebanese Veterinary Department in implementing a two-year blanket vaccination campaign to control the spread of transboundary animal diseases, which included the livestock of Syrian refugees.137
Whether through an inf lux or an exodus of people, forced migration often further impacts markets. In Cox’s Bazar, Bangladesh, where
| 94 |
CHAPTER 4 IMPACTS OF MIGRATION ON AGRICULTURE AND RURAL AREAS THE STATE OF FOOD AND AGRICULTURE 2018
vulnerability to f luctuations in food prices and food availability is high, the large-scale inf lux of refugees from Rakhine state in Myanmar has been a major source of strain.138,139 Households in Cox’s Bazar on average allocate around two-thirds of their monthly budget to food expenditures. With the arrival of over 650 000 refugees since August 2017, host communities have reported a significant rise in the price of staple foods. In the Lake Chad Basin, years of insurgent activ ities have led to population displacements and also to reduced areas for cultivation and lower agricultural productivity, as well as disrupted supply routes and market closures. Displacement and the looting and destruction of crops, infrastructure and productive assets have damaged household assets and livelihoods as well as overall food availability and access.139
However, there is also an increasing body of evidence showing the benefits that can be secured by engaging refugees in local economies. Well-managed inflows of displaced people can provide a boost to the economic development trajectories of host countries or communities (Box 18). They can help fill labour shortages, promote knowledge sharing and increase GDP.129 In Uganda, a study found that refugee economies have become nested within local Ugandan economies, attracting goods, people and capital from outside and increasing productivity and economic benefits inside.140 And in Kenya’s remote Turkana region, the refugee presence has had a beneficial effect,141 with increases in both overall income and total employment.
Resettlement options for refugeesThe search for protection and resettlement options for refugees is more urgent and challenging than ever before. As of 2018 there are an estimated 1.2 million people in need of resettlement, including those who have been liv ing in protracted refugee situations where resettlement has already been envisioned over a period of several years.143 Options currently being implemented include local integration in the country of f irst asylum, voluntary repatriation, and resettlement in a third country. All three are regarded as durable because they promise an end to refugees’ suffering and their
dependence on international protection and humanitarian assistance.
The beneficial effects of promoting economic linkages between refugees and host communities were illustrated in the preceding section. To complement this, there is increasing acknowledgement of the importance of legal frameworks and policies that facilitate the ability of refugees to earn an income in host countries. The Comprehensive Refugee Response Framework (CRRF), a key commitment under the 2016 New York Declaration,xiii calls for a more comprehensive, predictable and sustainable response that benefits both refugees and their hosts, rather than responding to refugee displacement through a purely (often underfunded) humanitarian lens. The overall objectives of the CRRF are four-fold: to ease pressure on countries that host large numbers of refugees, to enhance refugees’ self-reliance, to expand access to third-country solutions, and to improve conditions in countries of origin so refugees can return in safety and dignity.
The opportunities for voluntary repatriation and local integration of refugees in the current global landscape are increasingly limited. Accordingly, the option of resettlement to a third country has become critical for many vulnerable refugees whose protection needs cannot otherwise be met. With today’s unprecedented levels of global forced displacement, third-country resettlement also serves as a show of solidarity and burden-sharing with countries that host large numbers of refugees.143 In 2016, 37 countries participated in UNHCR’s resettlement programme, taking in about 126 300 people – or less than 1 percent of the world’s refugee population. However in 2017 the number of refugees resettled fell by nearly half, to just over 65 000. Resettlement entails more than merely relocating to a new country – it also involves integrating refugees into society to enhance their productive capacities and self-reliance144 (see Box 19), with the participation of governments, NGOs, volunteers, the local population, and the refugees themselves.145 »
xiii On 19 September 2016, the United Nations General Assembly adopted a set of commitments to enhance the protection of refugees and migrants. These commitments are known as the New York Declaration on Refugees and Migrants.
| 95 |

CHAPTER 4 IMPACTS OF MIGRATION ON AGRICULTURE AND RURAL AREAS
BOX 18THE ECONOMIC BENEFITS OF CAMP-BASED REFUGEES FOR SURROUNDING COMMUNITIES
THE IMPACTS OF ONE ADDITIONAL REFUGEE ON INCOME WITHIN A 10 KM RADIUS OF EACH CAMP, AND ON TRADE WITH THE REST OF RWANDA
Evidence from sub-Saharan Africa shows that newcomers can positively impact the local economy in rural areas. The magnitude of the economic benefits depends on the rules and regulations governing refugees, their interactions with the host country, the structure of host economies, the characteristics of refugees (such as language and human capital), and the type of assistance received.
In Kenya’s Turkana region, which hosts a refugee camp with about one-third of Kenya’s total refugees, the refugee presence has had an overall – albeit not uniform – beneficial effect. According to a joint World Bank–UNHCR report, the presence of refugees has increased Turkana’s Gross Regional Product by over
3 percent and total employment has risen by about 3 percent,141 with increases in both overall income and income per “local” person.
In Uganda, refugees conduct a high volume of business with local Ugandans, which has resulted in new employment for them as well. This spillover effect is only partly due to humanitarian assistance: most refugees rely on social relationships and other forms of support when engaging in new livelihoods.140
In Rwanda, where refugees are free to engage in economic activity with the host country, food aid (either cash or in-kind) provided by the World Food Programme (WFP) has had a positive economic impact within a 10 km radius of three Congolese refugee camps.
Trade with rest of Rwanda
USD 127 USD 120 USD 135
WFP aid other transfers
10 km radius
Local economy
USD 55 USD 49 USD 35
Refugeecamp
Refugee’s interaction with host country
Local income spillover
USD 70 USD 126
USD 25
One additional refugeeRefugee camps
Gihembe Nyabiheke Kigeme
Cashaid
Cashaid
In-kingaid
Total local-economy impact
USD 205USD 253
USD 145
SOURCE: FAO elaboration based on Taylor, et al., 2016, Figure 2.142
| 96 |

CHAPTER 4 IMPACTS OF MIGRATION ON AGRICULTURE AND RURAL AREAS THE STATE OF FOOD AND AGRICULTURE 2018
In the United States of America, engaging refugees in agriculture and in the local food economy brings numerous benefits, including income generation, expanded access to nutritious food, and cultural awareness. Support through collective action and from refugee support agencies is key to expanding these opportunities.
When Hmong refugees from Southeast Asia began resettling in the United States of America in the 1970s, a large share went to the state of Minnesota where they revitalized local farmers’ markets. Many of these refugees already had experience growing produce and flowers in Thailand and the Lao People’s Democratic Republic. Today, Hmong American farmers make up more than 50 percent of all farmers in metropolitan farmers’ markets and are central to the state’s local food economy, generating over USD 250 million in annual sales.146 Despite this success, Hmong American farmers continue to face barriers to accessing land, financing, training, research, markets, and building sustainable family businesses.
The Hmong American Farmers Association (HAFA) was formed in 2011 to create a more equitable environment and tackle the kinds of issues that these farming families had been facing for decades. Its integrated approach to community wealth-building involves management of a 155-acre farm, where
members can lease land and improve their businesses and agricultural practices. Members have the option to sell their produce to the HAFA Food Hub, which sells the aggregated products through community-supported agriculture shares, schools and grocery stores.146,147
For recent arrivals interested in agricultural and community gardening, several refugee support agencies provide access to land and training. Across the country, a variety of refugee-focused food security and farm training initiatives have been funded by the American Government’s Refugee Agricultural Partnership Program, with the objective of creating supplemental and often sustainable income for families, providing an adequate supply of healthy foods, supporting better physical and mental health, and encouraging greater community integration.148 One such initiative is New Roots, implemented by the International Rescue Committee and which helps refugees to find their first job in the agricultural sector, connects families with community garden plots, and provides comprehensive grocery store orientation and farm-based business training.149
Farmer-training projects working with culturally and linguistically diverse farmers may find guidance, teaching tips and tools in the Teaching Handbook – Refugee Farmer Training, from the Institute for Social and Economic Development.
BOX 19ENGAGING REFUGEES IN AGRICULTURE IN THE UNITED STATES OF AMERICA
BOX 18(CONTINUED)
Host country businesses and household incomes have benefited from the refugees’ cash assistance. When one additional adult refugee receives cash assistance of between USD 127 and USD 135, the annual real income in the local economy increases by USD 205 to USD 253 (see Figure). Meanwhile trade between the local economy and the rest of Rwanda increases by USD 49 to USD 55. However, in-kind food aid – such as maize, beans, cooking oil and salt – has less of a positive effect (leading to a total local-economy impact of USD 145 and an increase of trade with the rest of Rwanda by
USD 35). Because converting in-kind food aid entails a transaction cost, this reduces the value of the food package and thus the refugees’ demand for local goods and services.142 Whether rural or urban, location may also determine the level of engagement with the surrounding community. Urban refugees are more likely to be more economically integrated.142 Nonetheless, this emerging data challenges the five popular myths about refugee communities: that they are 1) isolated, 2) a burden, 3) homogenous, 4) technologically illiterate, and 5) dependent on humanitarian assistance.140
| 97 |

CHAPTER 4 IMPACTS OF MIGRATION ON AGRICULTURE AND RURAL AREAS
In 2016, the number of refugees returning to their countries of origin increased compared with previous years.2 Most strikingly, the number more than doubled from 201 400 in 2015 to 552 200 in 2016, the highest since 2008. For refugees, the presence of sustainable livelihood options is an important factor in their decision to return, and also in their successful reintegration into their communities of origin. These livelihood options are equally valuable for communities as a whole. In post-conf lict settings – which may have large numbers of returning IDPs and refugees – reviving the agricultural sectors and improving livelihoods requires bridging humanitarian, development and peacebuilding assistance to not only meet immediate needs, but to ensure returns are safe and dignified. At the same time, this helps secure sustainable peace, which is particularly critical given the fragile nature of post-conf lict situations. Nearly half of all civ il wars are due to post-conf lict relapses,150 and countries with high levels of food insecurity are 40 percent more likely to relapse into conf lict within a ten-year time span than those with lower levels.130 n
IMMIGRANTS PLAY A CRUCIAL ROLE IN MAINTAINING AGRICULTURE AND RURAL LIVELIHOODS IN DEVELOPED COUNTRIESRural areas in developed countries are undergoing significant transformation, involving out-migration to larger cities and increasingly ageing populations. Young people tend to reject careers in agriculture. There have been counter-urbanization trends, albeit mostly in the form of retirement- and amenity-led migration restricted to particularly scenic areas. This poses challenges for the generational renewal of the rural population, threatening the sustainability of agriculture, food systems and rural lifestyles. In these contexts, inf lows of foreign migrants are key to maintaining agricultural activ ities and revitalizing rural livelihoods.151,152
In Europe there is a large body of ev idence on the presence of internat ional migrants in rural areas and in agr icultural act iv it ies, especial ly in high-value, labour-intensive crop industr ies and hort icultural value chains.153 The presence of foreign farm workers is especial ly signif icant in southern Europe (const itut ing around one-third of the salar ied agr icultural workforce in Spain, Italy, Greece and Portugal in 2013), where the role of the agr icultural sector remains important.154,155 Most migrants come from Eastern Europe, North Afr ica and South Asia.155,156 Their labour input should be seen as complementary, as they do not compete with nat ive workers but rather f i l l the gaps lef t in rural labour markets. These migrants have enabled the surv ival of many farms and agricultural enterprises, contr ibuting to the resi l ience of agr iculture in the European Union.157
Foreign labour also constitutes the backbone of agricultural production in Canada and the United States of America. In Canada, migrant workers have played a fundamental role in helping the country’s horticultural industry to compete in the global food economy.158 In the United States of America, agricultural labour shortages, mainly the result of a substantial reduction in migrant Mexican farm workers, have resulted in significant losses to American farmers.159 During the 2005–2014 period, fewer Mexicans immigrated into the country due to stricter border controls, a lower birth rate and an increasingly robust economy in Mexico. As approximately 70 percent of farm workers in the United States of America are Mexican (the figure is almost 90 percent in California), this downward trend has severely affected farms in the country (Box 20). According to the New American Economy, the reduction in immigration from Mexico resulted in revenue losses amounting to USD 3 billion for each year between 2002 and 2014. American farmers responded to this labour shortage by raising wages, investing in machinery and employing foreign workers through the H-2A visa programme. Since 1986, this programme has allowed farmers struggling to f ind labour to hire foreign guest-workers temporarily, providing them with »
»
| 98 |

CHAPTER 4 IMPACTS OF MIGRATION ON AGRICULTURE AND RURAL AREAS THE STATE OF FOOD AND AGRICULTURE 2018
Migration has become a major issue of controversy in many developed countries, especially for those in Europe and for the United States of America. Large inflows of immigrants from developing countries have ignited fears of “national” workers being displaced from their jobs, abuse of social welfare schemes, loss of national identity and cultural values, and increased crime rates. At the same time, many countries have also instated policies promoting immigration to fill gaps in the labour market, be it to attract high-skilled workers to high-technology sectors, to meet demand for low-paid jobs (such as in agriculture and construction) that have become unattractive to local workers, or to meet the need for additional workers in health care and other services due to an ageing population. It is not easy to assess the economic costs and benefits of increased flows of migrants, given the many aspects at play. One way of addressing this is to estimate the potential effects of stricter immigration policies, including the possible large-scale repatriation of migrants. Recent studies suggest that more restrictive policies would hurt the American and European Union economies, implying that current migratory flows have beneficial impacts on their economies by filling labour market gaps.
A recent study by Robinson et al. assesses the potential implications of such scenarios for the economy of the United States of America.160 The study focuses on the economy-wide effects of a smaller immigrant labour force, including on agriculture.i The
country has an estimated 11 million undocumented immigrants, a large share of whom come from Mexico and Central America. About 8 million of the 11 million undocumented immigrants have a job, accounting for about 5 percent of the total American labour force. About half of these work in agriculture, construction and services. In the labour market, adjustment to reduced labour supplies will involve major movements of labour across sectors. Studies indicate that migrant workers are complementary to, rather than competitive with, native workers in many industries and job classifications, as they take jobs that American workers are unlikely to accept.ii In this labour market environment, any reduction in the supply of immigrant labour will lead to additional frictional unemploymentiii as American workers will find it difficult to reallocate across the affected sectors and job categories. In addition, the reduced labour supply will decrease the utilization (and hence the efficiency) of existing production capacity in many industries. Using a computable general equilibrium model for the American economy, Robinson et al. find that under such a scenario all economic sectors will lose, and aggregate GDP could fall by as much a 6 percent as a one-off negative shock. The loss of sectoral employment would be very high in agriculture, a sector with a very high share (26 percent) of undocumented labour, but the reductions in employment and income would spread across the entire economy.
BOX 20IS RESTRICTING IMMIGRATION GOOD FOR HIGH-INCOME COUNTRIES?
i One complicating factor for these assessments is that about 40 percent of immigration into OECD countries is based on family ties. According to the OECD (2017 International Migration Outlook; 2017), family migration comprised about 2 million of the almost 5 million migrants in 2016. Children under 15 accounted for more than one-quarter of all family migrants.
ii See a report by the New American Economy (2017).161 Likewise, Peri (2008)162 and Peri and Sparber (2008)163 analyse occupation data and find that immigrant and less-educated native workers specialize in different tasks in production (i.e. they are complementary inputs): immigrants specialize in manual tasks, native workers specialize in communication tasks. The authors find that increased immigration with specialization in production means that the presence of immigrants has little effect on wage reduction for native workers.
iii Frictional unemployment is the unemployment that results from time spent between jobs when a worker is searching for a job or moving from one job to another.
| 99 |

CHAPTER 4 IMPACTS OF MIGRATION ON AGRICULTURE AND RURAL AREAS
housing, food, and transport to work. Although applications to the H-2A programme are costly, in 2016 H-2A visas were granted to 134 000 people, up from 55 000 in 2011.159
In developing countries as well, foreign workers are often part of the agricultural workforce. Cross-border movements during harvest seasons are sometimes historically rooted in colonial times, as in the case of sub-Saharan Africa.164 In ten developing countries throughout Asia, sub-Saharan Africa and Latin America and the Caribbean, even though immigrants increasingly work in the service sector and paid employment, agriculture still employs the largest number of workers in most countries.165
Despite the important contribution of foreign workers to agriculture in high-income countries, regulatory schemes protecting their labour rights and working conditions still remain scarce and law enforcement poorly implemented. In many rural areas, a new form of social class has appeared, which has been referred to as the “agricultural proletariat”, or “rural precariat”.166,167 These labourers often work informally with less than legal salaries, and are subject to exploitation.168,169 n
CONCLUSIONS AND POLICY IMPLICATIONSMigration can make crucial contributions to economic development in rural areas. There are potentially large gains to be made, including increases in GDP and workers’ incomes, by reallocating labour from low-productivity sectors such as agriculture to high-productivity sectors. International migration can also have beneficial effects on host communities, not least for agriculture and rural areas in high-income countries, where immigrants increasingly constitute a significant component of the agricultural labour force.
However, for rural areas of origin and destination migration presents certain challenges. Paramount among these is the physical arrival or departure of large numbers
of people, which can affect labour markets and economic growth, as well as labour dynamics at the household level. The impacts of out-migration on rural areas of origin depend on a number of factors, including the characteristics of migrants and remaining household members, migrant skill levels, the type of migration involved, and the level of development in the area.
For rural households, in the short term out-migration can result in a reduction in the labour force and a potential increase in the feminization of agriculture, with both negative (e.g. increased work burden) and positive (e.g. increased decision-making power) consequences for women. In the longer term, migrants’ remittances and knowledge can have a profound impact on rural areas in terms of nutrition and education of children, housing, and investments in agricultural or non-agricultural activ ities. However, the evidence of these effects and the net balance between them is mixed, and depends very much on local contexts.
Migration can also have broader impacts on rural communities of origin. This includes higher local wages, technological improvements in agriculture, increased demand for local goods and services, and increased funding sources for investment. However, in some contexts rural out-migration may lead to the depopulation of rural areas, with implications for agricultural productivity and posing challenges for the provision of public services.
Forced migration, especially in situations of protracted crises, creates particular challenges. It can severely disrupt food systems and rural livelihoods in places of origin, although the impacts of out-migration per se can be diff icult to disentangle from those of the crises that cause people to f lee. Forced migration also poses major challenges in host countries, although efforts to integrate refugees into host community economies can bring mutual benefits. Durable solutions to refugee crises typically involve integration in the country of asylum, resettlement in a third country, or voluntary repatriation.
»
| 100 |

CHAPTER 4 IMPACTS OF MIGRATION ON AGRICULTURE AND RURAL AREAS THE STATE OF FOOD AND AGRICULTURE 2018
In many developed countries experiencing depopulation in rural areas, international immigrants can contribute to the development of rural host communities by f il l ing labour shortages in agriculture. In turn, agriculture has the potential to foster the economic and social integration of immigrants. On the other hand, agricultural work is often seasonal and unstable in nature. Providing decent work conditions for migrant agricultural workers, especially seasonal workers, can therefore ensure that the migration experience is positive for migrants and host countries.
Government policies and programmes in areas of both origin and destination play a key role in determining the final impact of migration on development in these areas. Foremost among these are regulatory policies that protect migrant labour, but programmes to promote social integration in host communities are also important for ensuring that the situation is mutually beneficial. The key policy challenge is to further the positive contribution of migration to growth and development while at the same time minimising the cost and negative impacts on areas and communities of origin. n
| 101 |

SAGAING REGION, MYANMARA woman ploughing a field in the Sagaing region, where natural disasters often lead to the temporary displacement of many people.©FAO/Hkun Lat

Key messages
1Renewed international and national efforts – tailored to national contexts of rural
migration and policy priorities – can harness remittances and diaspora investments for farm and non-farm activities as well as facilitating the incorporation of migrants and returnees’ knowledge and skills.
2 Countries at different levels of development face different challenges in
relation to rural migration and as a result will have different policy priorities.
3 Countries with development momentum can focus on creating employment
opportunities by strengthening agricultural value chains and promoting the development of regional urban centres.
4 For countries where youth employment is a challenge, it is essential to create
decent on- and off-farm employment opportunities for people in rural areas while at the same time facilitating orderly migration.
5 In protracted crisis situations, the needs of both host communities and displaced
people will only be adequately addressed through strategies that integrate humanitarian and development approaches to support self-reliance and resilience.
6 For transitioning countries at an intermediate level of development that
are on their way to becoming destinations for international migrants, national development strategies need to prioritize rural–urban connectivity in order to expand economic opportunities and reduce rural “survival” out-migration.
7Developed countries in need of agricultural workers should promote the social
integration of immigrants and ensure their rights are protected. Policy coherence, inter alia between migration and agriculture and rural development, is essential for enhancing positive impacts through safe, orderly and regular migration.
CHAPTER 5MIGRATION AND
ECONOMIC TRANSFORMATION:
AN INTEGRATED POLICY APPROACH
The preceding chapters have shown that rural areas are both a major source of migratory movements and a common destination for migration. In some cases migration occurs stepwise, such as when internal migration from rural areas to cities is followed by migration to another country. Internal migration is generally a much larger phenomenon than international migration, with a large portion of this comprising human movement from rural areas to cities, but also to other rural areas. Migration can also be circular, where migrants move regularly as job opportunities appear in different locations at different times. This includes seasonal migration – a particularly important form linked to agricultural production cycles.
The vastly unequal distribution of opportunities in the world – with differences within and between countries – is bound to continue driving both internal and international migration as people seek to improve their livelihoods and liv ing conditions. These differences in opportunities also imply that migration has a high potential to contribute to economic, social and human development. Rural–urban migration in particular has always been, and will continue to be, an integral part of this process. Gradually shifting labour out of low-productivity employment into more productive activ ities in other sectors, mostly in urban areas, offers huge potential for economic gains. However, migration is also frequently constrained by barriers that prevent people from exploiting the opportunities available elsewhere. This implies costs not just for the potential migrants themselves, but also for their households, communities, and for society as a whole.
Internal and international migratory f lows are generally the result of decisions by households and individuals based on perceived differences in
opportunities between areas of origin and destination, taking into account the costs of migration as well as potential facilitating factors. However, large numbers of people worldwide – refugees and IDPs – are forced to migrate involuntarily to escape unsafe and dangerous conditions due to conf lict, political unrest and natural disasters. In reality, as emphasized earlier the distinction between voluntary and forced migration is not clear-cut. Elements of choice and coercion co-exist to different degrees on a continuum, with the two extremes of totally voluntary and totally forced migration lying at opposite ends. In particular, slow-onset crises such as those linked to climate change might not be immediately life-threatening, but they could at some point induce people to move as the risks of staying outweigh those of migrating.
The preceding chapters have also shown how migration affects both areas of origin and of destination. Migration from rural areas may have significant impacts, both positive and negative, on the areas of origin. These impacts may be felt at different levels, from the household on out to community and at national levels. Migration can also have significant impacts on rural areas of destination, especially in cases of forced migration due to crises.
This f inal chapter presents the main policy implications of the analysis and discussion of the preceding chapters. After a discussion of the fundamental policy objectives and challenges related to rural development and migration, the chapter addresses the question of how policies can be designed to harness the development benefits of rural migration. Building on the typology of country profiles for drivers of rural migration (from Chapter 1), it outlines policy strategies tailored to specific situations. The chapter concludes with cross-cutting policy
CHAPTER 5
MIGRATION AND ECONOMIC TRANSFORMATION: AN INTEGRATED POLICY APPROACH
| 104 |
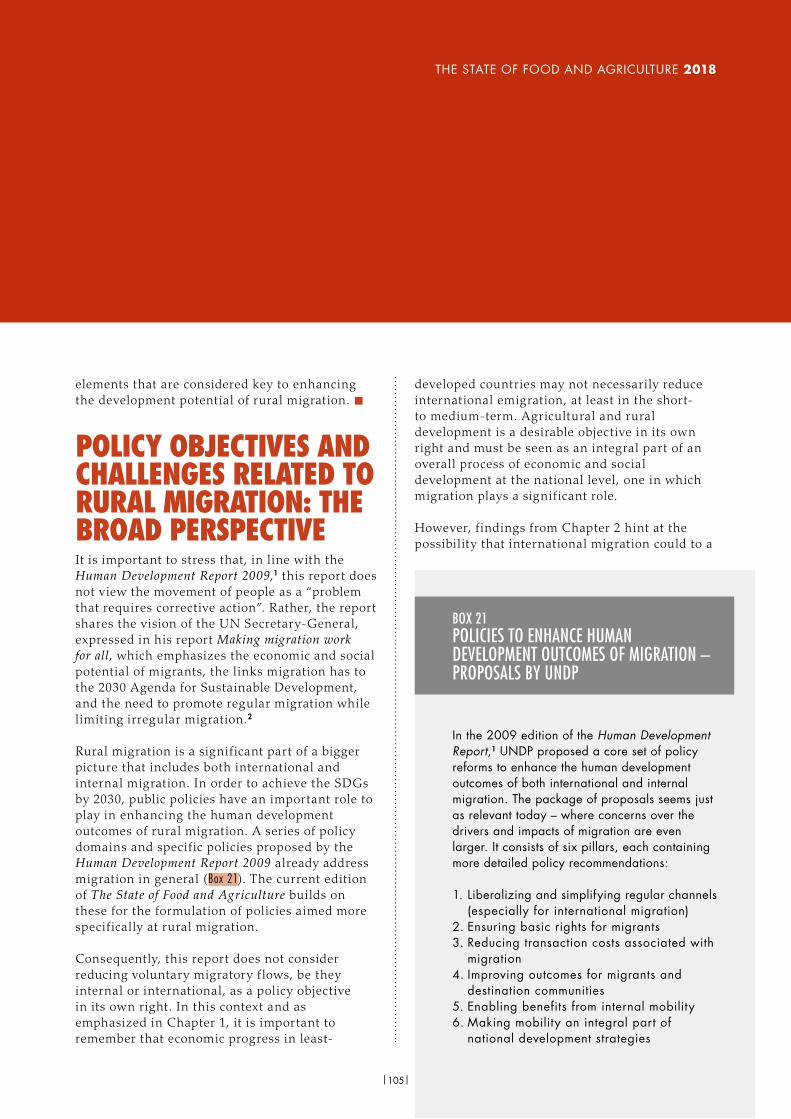
THE STATE OF FOOD AND AGRICULTURE 2018
elements that are considered key to enhancing the development potential of rural migration. n
POLICY OBJECTIVES AND CHALLENGES RELATED TO RURAL MIGRATION: THE BROAD PERSPECTIVEIt is important to stress that, in line with the Human Development Report 2009,1 this report does not view the movement of people as a “problem that requires corrective action”. Rather, the report shares the vision of the UN Secretary-General, expressed in his report Making migration work for all, which emphasizes the economic and social potential of migrants, the links migration has to the 2030 Agenda for Sustainable Development, and the need to promote regular migration while limiting irregular migration.2
Rural migration is a significant part of a bigger picture that includes both international and internal migration. In order to achieve the SDGs by 2030, public policies have an important role to play in enhancing the human development outcomes of rural migration. A series of policy domains and specific policies proposed by the Human Development Report 2009 already address migration in general (Box 21). The current edition of The State of Food and Agriculture builds on these for the formulation of policies aimed more specifically at rural migration.
Consequently, this report does not consider reducing voluntary migratory f lows, be they internal or international, as a policy objective in its own right. In this context and as emphasized in Chapter 1, it is important to remember that economic progress in least-
developed countries may not necessarily reduce international emigration, at least in the short- to medium-term. Agricultural and rural development is a desirable objective in its own right and must be seen as an integral part of an overall process of economic and social development at the national level, one in which migration plays a significant role.
However, f indings from Chapter 2 hint at the possibility that international migration could to a
In the 2009 edition of the Human Development Report,1 UNDP proposed a core set of policy reforms to enhance the human development outcomes of both international and internal migration. The package of proposals seems just as relevant today – where concerns over the drivers and impacts of migration are even larger. It consists of six pillars, each containing more detailed policy recommendations:
1. Liberalizing and simplifying regular channels (especially for international migration)
2. Ensuring basic rights for migrants3. Reducing transaction costs associated with
migration4. Improving outcomes for migrants and
destination communities5. Enabling benefits from internal mobility 6. Making mobility an integral part of
national development strategies
BOX 21POLICIES TO ENHANCE HUMAN DEVELOPMENT OUTCOMES OF MIGRATION – PROPOSALS BY UNDP
| 105 |

CHAPTER 5 MIGRATION AND ECONOMIC TRANSFORMATION: AN INTEGRATED POLICY APPROACH
certain degree be determined by development type. The key finding is that the share of people planning to migrate internationally is clearly higher for internal migrants than for non-migrants across all income groups. This is understandable: because social ties to places of origin typically weaken after an initial migration, migrating a second time, whether internally or internationally, becomes an easier decision. The implication then is that unequal opportunities within a country’s borders lead to internal migration, which may spill over into more international migration. Therefore, pursuing development policies that provide inclusive economic growth through a territorial perspective – already an end goal in itself – may have the added effect of decreasing internal migration, which may then translate into lower international migration relative to other development paths.
The report also acknowledges the urgency of addressing the growing problem of forced migration. As many migrants are refugees or IDPs, this presents particular challenges for areas of both origin and destination. While protecting the lives of forced migrants is v ital, this by itself is not sufficient. Humanitarian efforts to protect and assist refugees need to be accompanied by measures to address the causes of forced migration, and this requires improved cooperation across political, development, humanitarian and peace-building efforts. Furthermore, the rural dimension must not be overlooked, as rural populations often bear the brunt of the impacts during these crises. Globally at least one-third of the refugee population is located in rural areas, with the share exceeding 80 percent in the case of sub-Saharan Africa. Therefore, going beyond mere humanitarian assistance requires a development strategy tailored to rural areas that receive large inf lows of refugees (see Box 18).
The overarching rural migration objective must be to ensure that migration represents a voluntary decision by migrants and their families – one based on informed choices between different options and real opportunities, and one that contributes to sustainable economic and social development. This implies mitigating as much as possible any element of coercion, so that people who are not well-positioned to migrate are
not compelled to because they have no other option. At the same time, this also implies reducing constraints for those migrants who are well-positioned to take advantage of the opportunities afforded by migration. To meet this goal, policies should address a set of basic challenges, taking into consideration each country’s specif ic priorities, conditions and available resources:
1. Create opportunities for rural livelihoods that are as attractive and sustainable as possible (ideally in places of origin of potential migrants) and remedy infrastructural, institutional and policy failures in rural areas (and related secondary cities and rural towns) to reduce the push factors driving rural migration.
2. Remove constraints to rural migration and overcome information gaps by providing information services.
3. Develop human capital in rural areas through education and training opportunities, and remove gender-related constraints so that rural residents, regardless of their gender, can take advantage of opportunities available through migration.
4. Manage the effects of climate change on agriculture and rural areas by developing risk-management strategies for agriculture and related sectors, including investments to prevent, mitigate and cope with the negative impacts of extreme weather events.
5. Prevent crises, especially those of a protracted nature; promote resilience in agriculture and rural areas to reduce the need to resort to migration in crisis situations; and limit the negative impacts on migrants and their host communities.
6. Mitigate the possible negative impacts of migration on rural areas of origin – such as the loss of a productive workforce and shortages of agricultural labour, especially at peak times; increased burdens on those who remain; dependency on remittances; reduction of land used for agricultural production; and loss of y ields.
7. Enhance the positive impact of migration on rural areas of origin – for example by facilitating direct investment in rural development projects and agricultural enterprises of diaspora members and
| 106 |

CHAPTER 5 MIGRATION AND ECONOMIC TRANSFORMATION: AN INTEGRATED POLICY APPROACH THE STATE OF FOOD AND AGRICULTURE 2018
associations, and by enhancing opportunities for productive re-insertion of returnees, including those who have acquired skills and capital that can be invested in agriculture.
These points address the drivers of migration discussed in Chapter 3 and laid out in the conceptual framework in Figure 19 (points 1–5), as well as the impacts of migration discussed in Chapter 4 (points 6–7). The remainder of this chapter addresses policy areas relating to these challenges, l inking them to the country typology presented in Chapter 1 (Figure 3), before discussing policies relating more specif ically to maximizing the development impacts of migration as a part of rural development strategies. These policy areas are especially relevant for rural migration and fall within FAO’s area of competence and its mandate. Many of them are not aimed specif ically at migration but have signif icant implications for it, as they address the various challenges outlined above. n
SETTING PRIORITIES FOR POLICY AREAS RELEVANT TO RURAL MIGRATIONA wide variety of policies can affect rural migration through their impacts on poverty, inequality, governance and, more generally, on agricultural and rural development. Policy objectives must be prioritized in order to direct limited resources to where they are most needed and can be most effective. To help do so, this section follows the typology presented in Chapter 1, which distinguishes between five country profiles: (i) fragile and conf lict-affected states, (ii) rural youth employment challenges in fragile contexts, (ii i) countries with development momentum, (iv) transitioning countries, and (v) aspirational destinations.
The following section presents policy priorities for countries in each category. The premise is that countries in these different categories have different priorities in terms of what they need to continue along their path of economic development, and this will inform how they deal with migration. This is not to say that policies listed for one category of countries cannot be
relevant for others, but only that they are more likely to constitute a priority for countries in the category under which they are listed. The discussion begins with the policies that are relevant to developing countries with large agricultural bases, where rural migration for economic reasons is the most common, and which also constitute a major source of international migrants originating from rural areas. This group includes three categories: development momentum and youth employment challenges in fragile contexts, to be followed by discussion of the priorities of fragile and conf lict-affected states (as an extreme case for rural migration). The discussion then turns to policy priorities tailored to categories of transitioning countries and aspirational destinations.
A. Development momentum: leveraging the food system for employment generation in rural areasAs mentioned in Chapter 1, this profile includes countries that have a large pool of youth in rural areas, coupled with reasonable economic momentum to generate employment for these youth. It includes the majority of developing countries where net rural–urban migration is positive but rural–rural migration is also very relevant, as many countries of this category stil l have a considerable agricultural base. In such contexts, policies may focus on investing more specif ically in generating off-farm employment through the forward and backward linkages between agriculture and the broader food system. This was a central theme of the 2017 edition of The State of Food and Agriculture. This focus could allow countries with high densities of rural youth to reap demographic dividends – i.e. to use this particular demographic to their advantage. A territorial development approach that focuses on rural–urban linkages could be helpful in achieving this objective. Improved territorial planning of metropolitan areas, small cities and towns, together with improvements in connective infrastructure, can slow rates of out-migration to overburdened large cities or other countries by generating opportunities in closer proximity to rural areas.
| 107 |
CHAPTER 5 MIGRATION AND ECONOMIC TRANSFORMATION: AN INTEGRATED POLICY APPROACH
Strengthen value chains linked to agriculture and promote value-chain employment opportunities for rural residents Strengthening agricultural value chains will create more employment and livelihood opportunities beyond primary agriculture in rural areas and nearby urban areas. As the share of agriculture in income and employment generation declines, typically the relative share of other parts of the value chain increases. In addition, increased urbanization and dietary changes result in signif icant modifications to food systems. For low-income countries where industrialization is lagging, agro-industrial development and strengthened rural–urban linkages have great potential to improve livelihoods and offer opportunities to rural residents. To exploit this potential, it is necessary to promote non-farm activ ities associated with agricultural value chains and invest in the infrastructure necessary to l ink farmers and rural residents effectively to these value chains. Where local jobs are lacking, investments in connective infrastructure specif ic to the food system – such as warehousing, cold storage, and wholesale markets – can generate employment in both agriculture and the non-farm economy. In this way, the needs of potential migrants can be met before they leave.
This must be combined with effective promotion of education and development of skills that enhance the employability of rural residents – in particular youth – in value chains and food systems beyond primary agriculture. Where rural people are attracted by more prosperous conditions in urban centres, investments in “agglomeration” services (such as education, health, communication and leisure facilities) in small cities and towns in proximity to rural areas can curb rates of out-migration to overburdened larger cities.
Promote development of regional urban centres (small cities and towns)Stronger links between rural and urban areas and small cities and towns can lead to more dynamic economic growth. As points of intermediation and agro-industrial development, small cities and towns can stimulate non-farm economic growth, which broadens opportunities for the farming sector and other economic
activ ities in rural areas. This growth also creates more opportunities in urban areas not too far removed from rural areas, thus providing options for both permanent and circular migration that are closer to the place of origin and less costly for rural populations. Rural–urban connectiv ity can be strengthened by combining sectoral and territorial development approaches and by ensuring a balanced mix of infrastructure development and policy interventions across the rural–urban spectrum. Another particularly important policy area is the facilitation of circular – including seasonal – migration along the rural–urban spectrum.
Support human capital development in rural areasDeveloping human capital in rural areas is crucial, not only for rural areas themselves but also for providing their residents with skills and abilit ies that enhance their employability in other sectors of the economy, as well as internationally. This calls for investments in education – primary and secondary – in rural areas and for further promoting the employability of rural youth through training and skills development. It is also extremely important to remove any gender-related constraints that may prevent women from taking advantage of opportunities deriv ing from migration and increased mobility.
Facilitate migration of prospective migrants residing in rural areasIn countries with a high proportion of rural youth, it is important to improve their access to information on opportunities elsewhere, by promoting social networks and recruitment agencies that can make the process of migration easier and less risky. To this end, among other things governments can provide comprehensive information on employment opportunities to rural people, especially for youth, and promote well-regulated recruitment agencies and organizations to help match labour demand with supply and provide information and assistance to prospective migrants. An important role can be played here by programmes and arrangements that facilitate circular and seasonal migration, both domestic and international and involving both rural and urban areas.
| 108 |

CHAPTER 5 MIGRATION AND ECONOMIC TRANSFORMATION: AN INTEGRATED POLICY APPROACH THE STATE OF FOOD AND AGRICULTURE 2018
B. Rural youth employment challenges in fragile contexts: laying the foundations for demographic dividendsCurrently, 22 percent of the world’s population live in fragile contexts. This constitutes a large and growing share of developing countries, especially given that population growth in these countries is among the fastest in the world. In such situations of political and economic fragility, youth face enormous diff iculties in f inding jobs: employment generation does not keep up with population growth, and there are fundamental bottlenecks that impede development. This is most often the case for countries at the lower end of the Human Development Index, where rural poverty is most prevalent and agriculture still plays a major role in the economy, or in countries that have experienced protracted crises where fragility persists due to the effects of the crisis. Those who do exit low-productivity agriculture move mostly into low-productivity informal services, usually in urban areas, leading to only modest economic benefits. With the large increases in youth populations predicted for many of these countries, particularly in sub-Saharan Africa, the challenge of f inding them jobs will only increase.
Promote rural livelihood options in rural areasTo ensure that rural migration represents an informed decision based on real opportunities requires providing attractive livelihood options in rural areas. Policies and programmes aimed at fostering agricultural and broader rural development can help ensure better economic options for rural residents to choose from, including but not confined to migration; this in turn reduces the push factors for migration from rural areas. However, it should be acknowledged that the precise impacts on migration may be diff icult to predict and are likely to be context-specific, depending both on the country and on the location in question.
The broad policy toolbox for promoting rural development is well known and has been emphasized by FAO, independently of the migration debate. Key elements include ensuring access to markets by farmers for both marketable produce and inputs, for example by investing in
rural infrastructure. This must be combined with safe and secure property and tenure rights to land and natural resources. At the same time, agricultural productivity growth must be supported by agricultural research and extension that is relevant and accessible also for small-scale farmers. Access to credit and insurance by farmers and rural residents is also fundamental for promoting rural livelihoods. Social protection programmes can play a key role in helping farmers and rural residents to cope with shocks and invest in productive activ ities and human resources. Finally, implementing policies aimed at promoting youth employment in rural areas as well as employability of youth through education and training is particularly important from a migration perspective.
The territorial approach to rural development is also relevant for this category of countries. Strengthening the forward and backward linkages between agriculture and the broader food system is essential to increasing agricultural productivity and creating broader market integration opportunities for smallholder farmers. In addition, this can create off-farm employment and allow the absorption of rural youth into the expanding food system, as well as to the rest of the economy.
Support productive capacity and livelihoods in areas subject to out-migrationOut-migration can have negative impacts in rural areas, particularly on the labour force. Migrants typically come from the youngest and most productive segment of the rural and agricultural labour force, and their departure can therefore affect overall productivity in rural areas, including agriculture. When out-migration is predominantly male, this increases the feminization of agriculture. This in turn increases labour demands on women and may affect agricultural productivity to the extent that women tend to have less access to productive resources, markets and credit. Furthermore, as women are often already burdened with household-related activ ities, children’s nutrition, health and education can also be affected.
Policies should actively assist rural communities in addressing these potentially negative impacts of out-migration. It is important to enhance
| 109 |
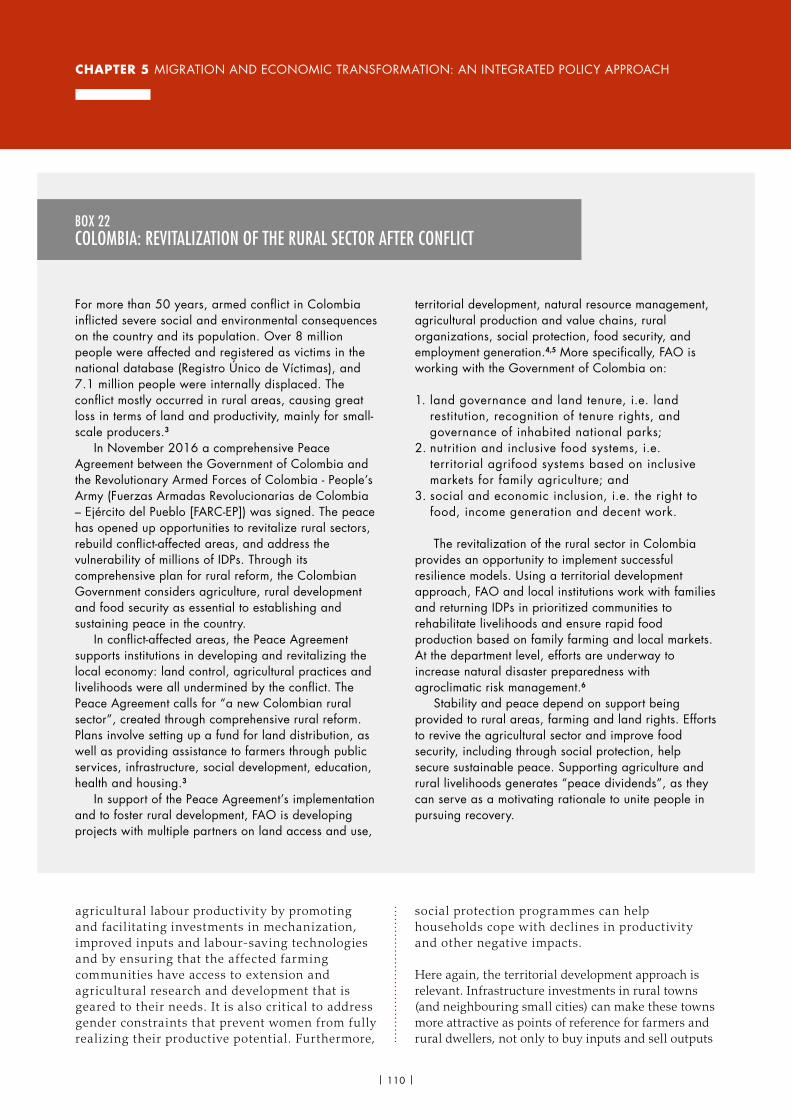
CHAPTER 5 MIGRATION AND ECONOMIC TRANSFORMATION: AN INTEGRATED POLICY APPROACH
agricultural labour productivity by promoting and facilitating investments in mechanization, improved inputs and labour-saving technologies and by ensuring that the affected farming communities have access to extension and agricultural research and development that is geared to their needs. It is also critical to address gender constraints that prevent women from fully realizing their productive potential. Furthermore,
social protection programmes can help households cope with declines in productivity and other negative impacts.
Here again, the territorial development approach is relevant. Infrastructure investments in rural towns (and neighbouring small cities) can make these towns more attractive as points of reference for farmers and rural dwellers, not only to buy inputs and sell outputs
For more than 50 years, armed conflict in Colombia inflicted severe social and environmental consequences on the country and its population. Over 8 million people were affected and registered as victims in the national database (Registro Único de Víctimas), and 7.1 million people were internally displaced. The conflict mostly occurred in rural areas, causing great loss in terms of land and productivity, mainly for small-scale producers.3
In November 2016 a comprehensive Peace Agreement between the Government of Colombia and the Revolutionary Armed Forces of Colombia - People’s Army (Fuerzas Armadas Revolucionarias de Colombia – Ejército del Pueblo [FARC-EP]) was signed. The peace has opened up opportunities to revitalize rural sectors, rebuild conflict-affected areas, and address the vulnerability of millions of IDPs. Through its comprehensive plan for rural reform, the Colombian Government considers agriculture, rural development and food security as essential to establishing and sustaining peace in the country.
In conflict-affected areas, the Peace Agreement supports institutions in developing and revitalizing the local economy: land control, agricultural practices and livelihoods were all undermined by the conflict. The Peace Agreement calls for “a new Colombian rural sector”, created through comprehensive rural reform. Plans involve setting up a fund for land distribution, as well as providing assistance to farmers through public services, infrastructure, social development, education, health and housing.3
In support of the Peace Agreement’s implementation and to foster rural development, FAO is developing projects with multiple partners on land access and use,
territorial development, natural resource management, agricultural production and value chains, rural organizations, social protection, food security, and employment generation.4,5 More specifically, FAO is working with the Government of Colombia on:
1. land governance and land tenure, i.e. land restitution, recognition of tenure rights, and governance of inhabited national parks;
2. nutrition and inclusive food systems, i.e. territorial agrifood systems based on inclusive markets for family agriculture; and
3. social and economic inclusion, i.e. the right to food, income generation and decent work.
The revitalization of the rural sector in Colombia provides an opportunity to implement successful resilience models. Using a territorial development approach, FAO and local institutions work with families and returning IDPs in prioritized communities to rehabilitate livelihoods and ensure rapid food production based on family farming and local markets. At the department level, efforts are underway to increase natural disaster preparedness with agroclimatic risk management.6
Stability and peace depend on support being provided to rural areas, farming and land rights. Efforts to revive the agricultural sector and improve food security, including through social protection, help secure sustainable peace. Supporting agriculture and rural livelihoods generates “peace dividends”, as they can serve as a motivating rationale to unite people in pursuing recovery.
BOX 22COLOMBIA: REVITALIZATION OF THE RURAL SECTOR AFTER CONFLICT
| 110 |

CHAPTER 5 MIGRATION AND ECONOMIC TRANSFORMATION: AN INTEGRATED POLICY APPROACH THE STATE OF FOOD AND AGRICULTURE 2018
but also to access more general services. This can open up a wider range of opportunities for rural dwellers, who may then choose to commute rather than out-migrating to other areas.
Provide support to returnees and communities of origin In post-conf lict settings, reviving the agricultural sectors and improving livelihoods calls for bridging humanitarian, development and peacebuilding assistance (see Box 22). Recovery and revitalization initiatives should focus on increasing food production as well as income-generating activ ities for ex-combatants, returnees, and populations who remained. It is therefore fundamental to rehabilitate agricultural and food production systems, along with markets and related infrastructure. Secure land tenure and access to natural resources are also important for re-establishing livelihoods. This can be greatly facilitated through measures to ensure social protection for returnees and for those who did not leave, with a special focus on women and young people.
C. Fragile and conflict-affected states: addressing the needs of migrants and host communities in protracted crises while fostering preventive measuresConditions of extreme fragility can lead to protracted crises, as mentioned in Chapters 2 and 3. Over the last ten years, the world has witnessed a sharp rise in crises due to acute climate events or armed conf licts, with the number of internal conf licts growing dramatically since 2010. In 2017, 19 countries were considered to be in a state of protracted crisis in the report on The State of Food Security and Nutrition in the World. Needless to say, addressing the forced migration associated with fragility and protracted crises involves a different set of intertwined priorities: saving lives, facilitating self-reliance on the part of displaced people and those suffering the effects of protracted crises, and supporting resilience to future shocks. A number of actions can be identif ied that, by providing livelihood support and improving food security and nutrition, will also help prevent conf lict and address some of the underlying causes of forced migration.
Strengthen resilience by linking emergency and development programmes to help countries and households to prevent, anticipate, prepare for, cope with, and recover from conflictsIn protracted crisis contexts, resilience must be strengthened at the household and community levels, where humanitarian aid can be integrated with social protection programmes targeted at those with the greatest need. National systems must be strengthened as well, with the aim of “shift[ing] from delivering aid to ending need.”7 Building resilience in crisis-prone countries requires holistic, integrated, and collaborative approaches that enable households and individuals to reduce risk and better manage and recover from natural disasters and human-induced crises. This involves reconciling short- and long-term approaches to assist the people liv ing in crises and those who are forced to f lee, as well host communities. The recovery of local agricultural and food economies and markets can help vulnerable individuals and households to move beyond subsistence agriculture and rejoin markets. It can also enhance their resilience to future economic, environmental and political shocks, including through climate change adaptation, thus allowing them to remain on their land when it is safe to do so.
Strengthen livelihoods and food security in neighbouring countries hosting refugees Providing support to areas bordering conf lict-affected countries can be a cost-effective means of restoring refugees’ livelihoods while bringing economic and social benefits in the long term for host countries, as well as for home countries when migrants return. Creating economic opportunities and allowing migrants access to labour opportunities can have a profound impact. Jobs and livelihoods will reduce the fiscal pressure and burden on host countries, and can help the conf lict-affected countries recover and rebuild more quickly.
Focus on agricultureAgriculture is a fundamental pillar in the resilience-building process. Agriculture must be a priority when addressing the immediate and longer-term needs of forcibly displaced people and their host communities, as it remains the backbone of rural livelihoods even in the face of
| 111 |

CHAPTER 5 MIGRATION AND ECONOMIC TRANSFORMATION: AN INTEGRATED POLICY APPROACH
D. Transitioning countries: ensuring a smooth transitionCountries that are at an intermediate level of development, are urbanizing beyond their capital city, and have undergone a demographic transition due to lower birth rates will l ikely want to advance the policies proposed in the previous sub-section for employment generation. However, as they are on the path to becoming higher income countries, they should also seek to increase mobility in the labour market – including by encouraging alternatives to migration such as commuting – and to strengthen rural–urban linkages using a territorial approach.
Remove constraints to rural migrationAs labour markets expand and diversify and employment opportunities increase, the removal of constraints for people who wish to migrate and take advantage of opportunities elsewhere becomes more important from a development perspective. This allows residents in rural areas to undertake migration when they consider it to be in their best interest. Typically, these constraints are also significant for less-developed contexts, but at this stage of the development process they assume particular importance.
It is crucial to remove legal or administrative barriers that prevent or discourage migratory movements within countries, including by ensuring portability of social protection programmes so they do not act as a disincentive to migration. The latter can also help overcome financial constraints for prospective migrants Furthermore, secure property and tenure rights to land resources can ensure that potential migrants are not deterred from migrating by the fear of losing their rights when they leave.
Develop education and public services in rural areas before depopulation takes holdAs rural out-migration advances with expanding opportunities in urban areas and increasing mobility, rural areas risk rapid depopulation. The paucity of public services in rural areas can act as a strong push factor accelerating this process. Developing public services in rural areas or in smaller towns close to rural areas can contribute to avoiding excessive and rapid depopulation of
enormous challenges. For people liv ing in or f leeing from fragile contexts, maintaining food production and rebuilding the agricultural sector are fundamental conditions for stabilization and recovery.
Manage inflows of displaced people and migrants into rural areas in a systematic way Inf lows can have a positive impact on the rural economy if they are managed effectively. Migrants and displaced people can fill labour shortages, promote knowledge diffusion and increase GDP. A stimulus to the local economy, particularly in situations of protracted displacement, will help integrate migrants not only into the economy, but also into the broader social fabric.
Increase investment in conflict prevention and peacebuilding The current humanitarian response system is not able to handle the scale or scope of the types of crises that dominate in today’s world, especially as most involve violent conf lict. Investments in conf lict mitigation and peacebuilding therefore need to be significantly scaled up. This includes fostering inclusive governance mechanisms and participatory processes on access to and use of natural resources. Reducing competition or grievances related to resource use can increase social cohesion and alleviate tension, including between displaced people and host communities.
Support risk-informed, shock-responsive social protection and early warning early action (EWEA) systems EWEA and risk-informed, shock-responsive social protection systems can mitigate some of the dynamics underlying crises and forced migration, by enhancing risk management capacities and early responsiveness to shocks and crises. Social protection systems are critical not only for providing short-term relief in the aftermath of crises: they can also be important for preventing asset depletion at the household level and improving infrastructure, irrigation systems, storage space and other shared assets at the community level.
| 112 |

CHAPTER 5 MIGRATION AND ECONOMIC TRANSFORMATION: AN INTEGRATED POLICY APPROACH THE STATE OF FOOD AND AGRICULTURE 2018
these areas. To this end, governments can develop education and health services in towns near rural areas, and facilitate access to services and facilities in small towns by developing adequate infrastructure and promoting the mobility of rural residents.
E. Developed countries as aspirational destinations Many international migrants seek work in developed countries, where higher average incomes offer the prospect of sending home
greater remittances. At the same time, lack of labour supply for specif ic tasks in sectors such as agriculture has created a demand for migrants in these countries. In this respect, public policies can play a mutually beneficial role by easing the integration process so that labour gaps are f il led in a seamless manner. Poor integration can pose major challenges in terms of the social cohesion required for migrants to succeed in their host country. Policy-makers should therefore aim to protect immigrant rights and promote the inclusion of immigrants in society.
Agriculture has the potential to foster the economic and social integration of migrants, asylum seekers and refugees. People from developed countries are often uninterested in agricultural work as it is often seasonal and thus unstable, thereby creating an opportunity for migrant workers in the sector. Providing decent work conditions to seasonal migrant agricultural workers ensures that the migration experience is a positive one for both migrants and host countries. In this regard, it is important that seasonal work schemes take into consideration the agricultural calendars of both countries of origin and destination.10 Seasonal agricultural work arrangements for migrants – similar to the scheme in place in the United Kingdom of Great Britain and Northern Ireland until 2013 or those currently in place in Australia, Canada and New Zealand – can provide insight for policy-makers on how to legislate seasonal migration and respond to labour needs in agriculture.
New Zealand’s policy allows companies in the agricultural sector to apply for the Recognized Seasonal Employer Scheme once labour shortages are demonstrated.11,12 This scheme has served to supply labour to agriculture, promote international collaboration in the Pacific, and contribute to income generation and the development of selected Small Island Developing States.13
Australia’s Seasonal Worker Programme is similar to that of New Zealand.14 It also establishes a list of
companies pre-authorized to hire seasonal workers in agriculture and has recently launched a pilot programme to extend the scheme to the tourism sector in northern Australia. In Canada, the Seasonal Agricultural Worker Programme differs in that the recruitment of a Temporary Foreign Worker is the responsibility of the governments of the countries that participate in the programme, and employers are not allowed to use private recruiting companies to choose workers.15,16 A Memorandum of Understanding is agreed between Canada and the partner government, which stations an agent in Canada to assist in the administration of the programme.17
In February 2014, the Council of the European Union adopted Directive 2014/36/EU on the conditions of entry and stay of third-country nationals for the purpose of employment as seasonal workers, mostly concerning the agricultural and tourism sectors.18 The Directive provides the overarching regulatory framework for seasonal migration in the European Union and establishes the rights to which seasonal workers are entitled during their stay. To a certain extent, the Directive allows for individual Members of the European Union to tailor implementation to their specific national needs. For instance, Member states keep the right to determine the volumes of admission, and also to reject applications if workers of the European Union would instead be available.19
BOX 23COORDINATION TO FACILITATE SEASONAL INTERNATIONAL MIGRATION
| 113 |

CHAPTER 5 MIGRATION AND ECONOMIC TRANSFORMATION: AN INTEGRATED POLICY APPROACH
Facilitate the social and economic integration of immigrantsThe positive impacts of immigration on destination countries can be maximized through public policies that ease the integration process and foster inclusion. Language training is one key to migrants’ social and economic integration: without mastering the host language, skilled migrants will be less likely to f ind a job that corresponds to their competences. Another key area for policy intervention is that of information systems, which can be strengthened through an extended network of employment agencies to help match workers’ skills to appropriate jobs. Restrictions on labour mobility should be avoided, allowing immigrants to change employers. Immigrants should also be allowed to establish businesses and receive assistance in doing so. Finally, integration can also be facilitated through the provision of universal and non-discriminatory coverage for education, social protection, and health services, along with the protection of immigrants’ private, social and economic rights, regardless of their migratory status.
Promote international cooperation International cooperation to remove work barriers can promote a better allocation of labour and help smooth out business cycles.8 Given the nature of seasonal work in agriculture, bilateral agreements between countries of destination and origin can be used to encourage circular mobility, thus giving migrants the opportunity to cross the border multiple times.9 These agreements can ensure implementation of standardized contracts for migrant workers that cover basic rights while promoting skills certif ication and portability, as well as technology transfer back to their home countries (see Box 23 for examples of such programmes). Regional mobility can be promoted by eliminating barriers to work and by ensuring the transferability of social protection across countries. It is l ikewise important to invest in the economic and social integration of migrants in countries hosting large numbers of refugees, and to contribute to sharing the burden of hosting refugees through resettlement agreements and other pathways for admission. n
ENHANCING THE DEVELOPMENT POTENTIAL OF MIGRATIONIn addition to addressing the different drivers of migration and related policy areas, a further key challenge is to maximize the potential of migration by enhancing its positive development impacts also on areas of origin, while minimizing or mitigating the negative impacts of out-migration. In addition to the relevant policy areas mentioned above, the following are also important:
Enhance the contribution of migrants to the development of their areas of origin Strengthening linkages between migrants and areas of origin can have pronounced positive impacts on rural areas of out-migration. Several policy areas can contribute to enhancing the development potential of out-migration, including facilitating and reducing the cost of sending remittances and promoting their investment in rural areas (for example by providing matching funds). The promotion and facilitation of circular (including seasonal) migration can help increase rural residents’ incomes, allowing for both higher levels of consumption and investment.
Promote return migration – both national and international – as a resource for developmentMigrants returning to rural areas often bring with them human capital and financial resources that can become an important source of development and of economic diversif ication for many countries. As seen in Chapter 2, up to 30 percent of rural–urban migrants return to rural areas.xiv The development potential of return migrants strongly depends on the economic, social and institutional environment they encounter back home.20 For international returnees however, reintegration into the economic, social and political life of their countries of origin may be diff icult.
xiv In a set of studies conducted by OECD, the share of migrant households with return migrants ranges from 13 percent to 65 percent, depending on the country.
| 114 |

CHAPTER 5 MIGRATION AND ECONOMIC TRANSFORMATION: AN INTEGRATED POLICY APPROACH THE STATE OF FOOD AND AGRICULTURE 2018
Understanding why they decide to return home will be key in determining how to leverage return migration for economic development. In some cases, international migrants do not return due to lack of investment and employment opportunities in their home countries, while in other cases it is because they are not aware of existing opportunities. Policies can address both reasons and thus should create
an enabling environment for business in areas of origin, including legal frameworks that encourage migrants to return or at least invest in their areas of origin (see Box 24 for a concrete example). Providing information on local networks can help them reintegrate into local labour markets, while rural development policies that build on their skills can ensure they don’t remain underutilized.
In Moldova, high levels of rural out-migration by young people looking for better employment opportunities abroad have threatened the country’s prospects for sustainable development. With an estimated one-third of its population residing temporarily or permanently abroad, it has become ever more important for the Moldovan Government to establish a solid institutional framework in the area of migration policy and management. Over the last decade, Moldova has aimed to integrate migration in national policies and development planning, with the involvement of a large number of institutional stakeholders.
The return and reintegration of Moldovan migrants is a major objective in the National Strategy on Migration and Asylum 2011–2020 and its corresponding action plan. The focus has been on facilitating the integration of return migrants into labour market, health insurance and social protection schemes, and on developing migrants’ entrepreneurial skills to encourage them to invest in the Moldovan economy using their income earned abroad.
This last aspect feeds into the country’s broader effort to “shift from the consumption-based economy development model to a new paradigm focused on exports, investments and innovations”, and to create an enabling environment for business development, particularly in the agrifood sector. This resulted, inter alia, in the development of the Strategy for the Small- and Medium-sized Enterprise Sector Development for 2012–2020. The National Programme for Youth Economic Empowerment and the Programme for
Attracting Remittances into the Economy are examples of tools that are used to enable and boost investment for rural economic development in order to “create a future at home”.
In particular, the Programme for Attracting Remittances into the Economy exemplifies how Moldova has dealt with migration in an integrated and sustainable manner. It offers funding to complement migrants’ financial resources and provides entrepreneurial training to migrants and their relatives for business development. By linking Programme beneficiaries to those of other programmes in the agricultural sector, the opportunities to invest are multiplied and continue after the Programme expires.
Another key element of the Programme aims at making beneficiaries aware of the existing possibilities for business development in the country and providing them with specific information on particularly profitable opportunities. Diaspora networks constitute an important channel for distributing information about the Programme; this is crucial given that one of the main reasons migrants do not invest is that they are unaware of investment opportunities in their home countries.
Since 2010 the Programme has had substantial impacts on the national economy. Training has been provided for 1 875 people, and 1 348 businesses have been established and/or expanded, of which 60 to 70 percent are related to the agrifood sector. These include 681 enterprises in agriculture, 320 in services and 347 in industry.
BOX 24MOBILIZING THE HUMAN AND FINANCIAL RESOURCES OF RETURN MIGRANTS FOR AGRICULTURAL DEVELOPMENT IN MOLDOVA
Sources: IOM, 201721 and Martinez et al., 2015.22
| 115 |

CHAPTER 5 MIGRATION AND ECONOMIC TRANSFORMATION: AN INTEGRATED POLICY APPROACH
Build data on rural migration and how it links to economic transformationExisting data that can be leveraged for analysing internal and international migration in the context of rural transformation are not consistent, nor are they harmonized across countries and regions. In particular, there is limited data on the socio-economic conditions associated with migration, broken down by age, sex, origin and destination of the migrants. There is also little information on temporary and seasonal migration (which is a significant phenomenon in many rural areas) and how it affects labour markets and the labour participation of household members, including child labour. Overcoming these limitations will be key in designing, implementing and monitoring policies in support of the migration of people from and within rural areas, and for ensuring a better functioning of labour markets in the context of agricultural and rural transformation (as shown in Box 25).
Ensure effective coordination and cooperation on policies related to migrationAddressing the rural migration challenges and implementing the policy areas laid and listed in this chapter requires various levels of coordination. Migration is not simply driven by developments and policies concerning specific sectors of the economy; rather, it is driven by the interaction between these two areas. Whether and to what extent people migrate depends on economic conditions or developments not only in the area of origin, but also in potential areas of destination. Likewise, policies with implications for migration depend on numerous different actors, institutions and organizations at different country levels.
Therefore, policy coherence and effective coordination of policies and interventions are needed across sectors, geographic areas and among actors. For this purpose, migration issues
The main data gaps regarding rural migration include:
� Nationally representative data on internal movements by urban and rural area of origin and destination, for detailed time periods, such as months and agricultural seasons.
� Data on socio-economic characteristics of migrants’ households, particularly in rural areas and in relation to agricultural activities.
� Individual- level information on the socio-economic characteristics of migrants before migration, especially in rural areas and with reference to employment and education.
� Information on the reasons for migration, including shocks, and both the direct and indirect costs associated with migration in terms of livelihood strategies.
What is the most effective approach to address these data gaps? As seen before, most of the demographic-based data sources can only offer information on origins and destinations in terms of what countries label
as rural and urban areas. Information concerning labour markets collected by the ILO and the GWP can probably supplement the demographic information to some extent, but more specific data need to be collected in surveys that target households and their livelihoods. So far, the datasets that seem to come closest to this approach are from the household survey promoted by the LSMS of the World Bank. However, even within this pool of surveys, information on migration is collected in different forms depending on the country and on the importance of mobility and migration. In this respect, a standardized pool of questions would be useful for gathering comparable data across surveys while at the same time addressing internal and international as well as temporary and permanent migration.
Information on migration could potentially be obtained through innovative channels, such as big data tracing population movements and consumer behaviour, data from mobile phones or social media, or the tracking of online payment services. However, as yet there is hardly any systematic information source of this kind that could be used for policy formulation.
BOX 25WHAT CAN BE DONE TO ADDRESS THE DATA GAPS IN THE STUDY OF RURAL MIGRATION?
| 116 |
CHAPTER 5 MIGRATION AND ECONOMIC TRANSFORMATION: AN INTEGRATED POLICY APPROACH THE STATE OF FOOD AND AGRICULTURE 2018
need to be integrated into national development strategies. Coordination must be improved across different agencies at the sub-national and national levels and between government and non-state level actors. Finally, strengthened international cooperation on issues related to migration, for example through agreements between a given country of origin and that of destination, is critical for investing in the human capital of migrants, particularly those from rural areas. n
CONCLUSIONSRural migration will continue to be an important component of processes of economic transformation and social development. However, it will assume different forms and present different challenges depending on the context, as described in the various chapters of this report.
Internal rural–rural migration and increasing rural–urban migration will continue to shape the development process in countries at lower levels of development. Migration is essential to the process of reallocation of labour from less productive to more productive sectors of the economy. The large f lows of internal migration described in this report indicate that reallocation of labour resources in many developing countries is contributing to economic transformation and development, and is likely to continue.
Internal migration will continue to be accompanied by international migration however, as potential migrants are particularly attracted to the opportunities in countries with higher levels of income and overall development. While this can contribute to advancing the prospects of international migrants and their own human
development, there are also negative aspects to this process. Indeed, in the context of economic transformation, migrants can be seen as productive resources that are being diverted out of areas of origin. Likewise, international migrants – although they may provide remittances and other benefits – also represent resources that are being diverted out of their countries of origin.
Just as European countries, after a long history of being sources of migration, have now become destination countries, emerging countries are likely to become regional hubs and receive more immigrants as they advance in their development. This is particularly true in light of the rapidly increasing populations in many developing countries, their limited capacity to absorb the increases, and the importance of intra-regional migration. As income differentials between developing countries widen, the successful countries will attract migrants from less-advanced neighbouring countries.
Managing these processes of migration – both internal and international – presents major challenges. Most developing countries will f ind it diff icult to develop and implement comprehensive strategies to deal with migration. Although lessons can be learned from the experience of developed countries, developing countries have different priorities, are more financially constrained and rely substantially on a large informal sector, which may fail to provide the sustainable economic opportunities necessary to integrate even internal migrants, not to mention international ones. Developing clear and coherent policies, both for migration and for economic development more broadly, is essential for a successful process of economic development and migration. n
| 117 |
STATISTICAL ANNEXNOTES ON THE STATISTICAL ANNEX
KEYThe following conventions are used in the tables:
.. = data not available
0 or 0.0 = nil or negligible
blank cell = not applicable
Numbers presented in the tables may differ from the original data sources because of rounding or data processing. To separate decimals from whole numbers a full point (.) is used.
TECHNICAL NOTES TABLE A1 Stocks of international emigrants from origin countries, regions and continents and their shares at intra-regional, intra-continental and intercontinental levels in 1995 and 2015Source: UN DESA. 2017. Trends in International Migrant Stock: The 2017 revision (United Nations database, POP/DB/MIG/Stock/Rev.2017). New York, United Nations, Department of Economic and Social Affairs. Population Division.
Stock of international emigrants is the number of emigrants liv ing outside their country of origin, estimated as of July 1st of a given year.
Share of international emigrant stock over total population is the share of the international emigrants from a given country, region or continent in the total population of that country, region or continent.
Intra-regional emigrants refers to the share of total international emigrant stock that goes to the same region of the country, in the total stock of international emigrants of a given country or region.
Intra-continental emigrants refers to the share of total international emigrant stock that goes to the same continent of the country – excluding countries in the same region – in the total stock of international emigrants of a given country or region.
Inter-continental emigrants refers to the share of total international emigrant stock that goes to other continents, in the total stock of international emigrants of a given country or region.
TABLE A2 Stocks of international immigrants in destination countries, regions and continents and their shares at intra-regional, intra-continental and inter-continental levels in 1995 and 2015Source: See Table A1.
Stock of international immigrants is the number of immigrants present in a given country, region or continent, estimated as of July 1st of a given year.
Share of international immigrant stock over total population is the share of the international immigrants in a given country, region or continent in the total population of that country, region or continent.
Intra-regional immigrants refers to the share of total international immigrant stock that comes from the same region of the country, in the total stock of international immigrants of a given country or region.
Intra-continental immigrants refers to the share of total international immigrant stock that comes from the same continent of the country – excluding countries in the same region – in the total stock of international immigrants of a given country or region.
Inter-continental immigrants refers to the share of total international immigrant stock that comes from
| 118 |

outside the continent of the country in the total stock of international immigrants of a given country, region or continent.
Other immigrants refers to the share of total immigrant stock, whose country, region and continent are unknown, in the total stock of international immigrants of a given country or region.
TABLE A3 Data used to construct the country profile typology based on drivers of rural migration in 2015Sources: FAO. 2018. FAOSTAT, Online statistical database (available at http://faostat.fao.org)
UN DESA. 2017. World Population Prospects: The 2017 Revision (available at https://esa.un.org/unpd/wpp/). New York, UN Department of Economic and Social Affairs, Population Division.
UNDP. 2018. Human Development Data (1990-2015), online statistical database (available at http://hdr.undp.org/en/data)
The composite Human Development Index is obtained from the UNDP database. It integrates three dimensions of human development: (1) life expectancy at birth, which ref lects the ability to lead a long and healthy life; (2) average years of schooling, which ref lect the ability to acquire knowledge; and (3) per capita Gross National Income, which ref lects the ability to achieve a decent standard of liv ing.
The rural youth density on agricultural land is calculated as the ratio of the total number of youth residing in rural areas over total available agricultural land (measured in hectares). Youth represent indiv iduals aged 15 to 29 years, the data for which is obtained from UN DESA.
Due to a lack of population data by age categories at the rural level, the distribution of youth between rural and urban areas is assumed to follow that of the national population distribution. The area of agricultural land was obtained from FAOSTAT and represents the sum of areas l isted as “arable land”, “permanent crops” and “permanent pastures”.
TABLE A4 Data on international and internal migration based on the Gallup World Poll database in 2013Source: Gallup®. 2018. Gallup World Poll dataset for the following years: 2007, 2008, 2009, 2010, 2011, 2012, 2013, 2014, 2015, 2016, and 2017.
Internal migrants to rural areas refers to the share of the total population that declared they have moved to a rural area from another rural or urban area within the country during the five years preceding the survey.
Internal migrants to urban areas refers to the share of the total population that declared they have moved to an urban area from another rural or urban area within the same country during the five years preceding the survey.
International potential migrants from rural areas is the share of the rural population that declared they would ideally migrate to another country but do not plan to do so in the following 12 months, over the rural population of the country.
International potential migrants from urban areas is the share of the urban population that declared they would ideally migrate to another country but do not plan to do so in the following 12 months, over the urban population of the country.
| 119 |

STATISTICAL ANNEX
Potential migrants planning to migrate internationally from rural areas is the share of the rural population that declared they would ideally migrate to another country and are planning to do so in the following 12 months, over the rural population of the country.
Potential migrants planning to migrate internationally from urban areas is the share of the urban population that declared they would ideally migrate to another country and are planning to do so in the following 12 months, over the urban population of the country.
TABLE A5 Links between internal and international migration based on the Gallup World Poll database in 2013Source: See Table A4.
Total internal migrants planning to migrate internationally is the share of f ive-year internal migrants, i.e. those who declared they had moved from another city or area within their country during the five years preceding the survey, who planned to migrate internationally in the following 12 months, with respect to the total number of f ive-year internal migrants.
Total non-migrants planning to migrate internationally is the share of people who did not move in the five years preceding the survey and planned to migrate internationally in the following 12 months, with respect to the total number of people who did not move during the five years preceding the survey.
Rural internal migrants planning to migrate internationally is the share of rural people who declared they had moved from another rural or urban area within the same country during the five years preceding the survey and planned to migrate internationally in the following 12 months, with respect to the total number of f ive-year internal migrants to rural areas.
Urban internal migrants planning to migrate internationally is the share of urban people who declared they had moved from another rural or urban area within the same country during the five years preceding
the survey and planned to migrate internationally in the following 12 months, with respect to the total number of f ive-year internal migrants to urban areas.
TABLE A6 Stocks and shares of refugees in receiving countries in 2015 and 2016 Sources: UN DESA. 2017. Trends in International Migrant Stock: The 2017 revision (United Nations database, POP/DB/MIG/Stock/Rev.2017). New York, United Nations, Department of Economic and Social Affairs. Population Division.
UNHCR. 2017. Global trends in forced displacement in 2016. Geneva.
Stock of refugees is the number of refugees and asylum seekers by receiving country, region, and continent, estimated as of July 1st of 2015 by UN DESA.
Share of refugees in total population is the share of refugees and asylum seekers over total population in the receiving countries, regions and continents.
Share of refugees in total immigrant stock is the share of refugees and asylum seekers over the total stock of international immigrants in the receiving countries, regions, and continents (see definitions in Table A2 technical notes for more information).
Refugee distribution by locality type refers to the shares of refugees residing in rural or urban areas, over the total number of refugees, in 2016 as provided by UNHCR. When information on locality is lacking, it is referred to as unknown.
COUNTRY GROUPS AND REGIONAL AGGREGATESRegional groupings and the designation of developing and developed regions follow a similar classif ication to the UNSD M49 classif ication of the United Nations Statistics Division, available at: unstats.un.org/unsd/methods/m49/m49.htm
| 120 |

TABLE A1 STOCKS OF INTERNATIONAL EMIGRANTS FROM ORIGIN COUNTRIES, REGIONS AND CONTINENTS AND THEIR SHARES AT INTRA-REGIONAL, INTRA-CONTINENTAL AND INTERCONTINENTAL LEVELS IN 1995 AND 2015
COUNTRY/TERRITORY OF ORIGIN
1995 2015
STO
CK O
F IN
TERN
ATIO
NA
L EM
IGRA
NTS
SHA
RE O
VER
TO
TAL
POPU
LATI
ON
INTR
A-R
EGIO
NA
L EM
IGRA
NTS
INTR
A-C
ON
TIN
ENTA
L EM
IGRA
NTS
INTE
R-CO
NTI
NEN
TAL
EMIG
RAN
TS
STO
CK O
F IN
TERN
ATIO
NA
L EM
IGRA
NTS
SHA
RE O
VER
TO
TAL
POPU
LATI
ON
INTR
A-R
EGIO
NA
L EM
IGRA
NTS
INTR
A-C
ON
TIN
ENTA
L EM
IGRA
NTS
INTE
R-CO
NTI
NEN
TAL
EMIG
RAN
TS
Share in stock of international emigrants
Share in stock of international emigrants
Thousands Percentage Thousands Percentage
AFRICA 22 021 3 34 591 3
Sub-Saharan Africa 17 115 3 78 0 22 25 658 3 65 1 34
East Africa 7 664 3 47 37 16 9 744 2 46 24 30
Burundi 544 9 75 24 1 379 4 80 13 7
Comoros 51 11 56 6 38 116 15 62 6 33
Djibouti 7 1 27 16 57 16 2 24 12 64
Eritrea 325 11 11 74 16 546 11 39 30 30
Ethiopia 820 1 7 62 31 753 1 10 9 81
Kenya 267 1 25 5 70 459 1 19 7 74
Madagascar 67 0 31 1 68 171 1 20 1 79
Malawi 139 1 77 14 9 332 2 64 31 5
Mauritius 111 10 2 4 94 162 13 4 9 87
Mayotte 4 3 99 0 1 7 3 99 0 1
Mozambique 809 5 48 42 10 904 3 18 72 9
Réunion 3 0 36 21 42 3 0 27 17 56
Rwanda 2 066 35 44 55 0 514 4 32 63 6
Seychelles 19 25 2 2 97 38 41 1 4 95
Somalia 899 12 73 6 21 1 925 14 55 9 36
South Sudan* 438 8 66 32 2 1 419 12 80 19 2
Uganda 469 2 66 17 17 732 2 79 2 18
United Republic of Tanzania 232 1 69 2 29 306 1 52 6 41
Zambia 141 2 62 15 23 264 2 33 40 27
Zimbabwe 253 2 32 44 24 698 4 12 55 34
Middle Africa 1 838 2 37 38 25 3 874 3 43 35 22
Angola 668 5 44 27 29 611 2 38 23 39
Cameroon 136 1 42 11 48 326 1 25 12 63
Central African Republic 49 1 42 38 20 693 15 94 3 3
Chad 267 4 40 54 6 226 2 42 50 8
Congo 111 4 12 32 56 244 5 12 46 43
Democratic Republic of the Congo 529 1 28 56 15 1 535 2 30 57 13
Equatorial Guinea 42 8 79 0 21 93 8 66 12 22
Gabon 16 2 11 33 56 65 3 8 54 39
Sao Tome and Principe 19 15 35 17 49 81 41 74 2 24
| 121 |

TABLE A1 (CONTINUED)
COUNTRY/TERRITORY OF ORIGIN
1995 2015
STO
CK O
F IN
TERN
ATIO
NA
L EM
IGRA
NTS
SHA
RE O
VER
TO
TAL
POPU
LATI
ON
INTR
A-R
EGIO
NA
L EM
IGRA
NTS
INTR
A-C
ON
TIN
ENTA
L EM
IGRA
NTS
INTE
R-CO
NTI
NEN
TAL
EMIG
RAN
TS
STO
CK O
F IN
TERN
ATIO
NA
L EM
IGRA
NTS
SHA
RE O
VER
TO
TAL
POPU
LATI
ON
INTR
A-R
EGIO
NA
L EM
IGRA
NTS
INTR
A-C
ON
TIN
ENTA
L EM
IGRA
NTS
INTE
R-CO
NTI
NEN
TAL
EMIG
RAN
TS
Share in stock of international emigrants
Share in stock of international emigrants
Thousands Percentage Thousands Percentage
North Africa 5 652 4 5 7 88 10 809 5 3 11 86
Algeria 965 3 3 1 97 1 786 4 2 1 97
Egypt 1 491 2 2 0 97 3 201 3 1 0 98
Libya 77 2 13 9 78 154 2 13 4 84
Morocco 1 905 7 9 0 90 3 040 9 6 1 93
Sudan 746 3 6 51 44 1 876 5 3 57 40
Tunisia 468 5 1 0 99 753 7 1 0 99
Southern Africa 622 1 38 12 51 1 515 2 45 7 48
Botswana 23 1 72 14 14 76 3 87 6 7
Eswatini 30 3 96 0 4 87 7 96 0 4
Lesotho 138 8 96 4 0 309 14 97 3 0
Namibia 28 2 86 6 7 180 7 92 4 3
South Africa 402 1 8 15 77 863 2 7 10 83
Western Africa 6 245 3 80 5 15 8 649 2 66 6 28
Benin 273 5 85 9 6 609 6 86 9 5
Burkina Faso 1 214 12 99 0 1 1 451 8 98 0 2
Cabo Verde 108 28 1 11 88 223 42 0 32 68
Côte d'Ivoire 453 3 86 1 14 841 4 79 1 21
Gambia 38 4 51 0 48 84 4 21 0 79
Ghana 429 3 57 2 41 827 3 47 2 51
Guinea 365 5 94 1 5 417 3 76 3 21
Guinea-Bissau 67 6 63 1 36 96 5 55 2 44
Liberia 549 26 94 0 6 253 6 58 2 40
Mali 789 8 89 4 7 1 057 6 82 8 10
Mauritania 151 7 88 2 9 119 3 69 5 25
Niger 166 2 96 2 2 354 2 93 4 3
Nigeria 521 0 24 31 45 1 181 1 24 15 61
Saint Helena 2 45 0 6 94 3 85 0 10 90
Senegal 357 4 54 6 40 545 4 34 8 58
Sierra Leone 457 11 92 0 7 150 2 38 1 61
Togo 306 7 89 3 8 438 6 84 4 12
ASIA 58 800 2 101 614 2
Central Asia 6 161 12 7 2 91 7 449 11 7 2 92
Kazakhstan 3 296 21 3 1 97 3 906 22 1 1 98
Kyrgyzstan 550 12 5 1 94 745 13 3 1 96
Tajikistan 526 9 4 8 88 584 7 5 3 92
Turkmenistan 244 6 2 3 96 241 4 1 5 94
Uzbekistan 1 546 7 19 5 76 1 973 6 19 4 77
| 122 |

TABLE A1 (CONTINUED)
COUNTRY/TERRITORY OF ORIGIN
1995 2015
STO
CK O
F IN
TERN
ATIO
NA
L EM
IGRA
NTS
SHA
RE O
VER
TO
TAL
POPU
LATI
ON
INTR
A-R
EGIO
NA
L EM
IGRA
NTS
INTR
A-C
ON
TIN
ENTA
L EM
IGRA
NTS
INTE
R-CO
NTI
NEN
TAL
EMIG
RAN
TS
STO
CK O
F IN
TERN
ATIO
NA
L EM
IGRA
NTS
SHA
RE O
VER
TO
TAL
POPU
LATI
ON
INTR
A-R
EGIO
NA
L EM
IGRA
NTS
INTR
A-C
ON
TIN
ENTA
L EM
IGRA
NTS
INTE
R-CO
NTI
NEN
TAL
EMIG
RAN
TS
Share in stock of international emigrants
Share in stock of international emigrants
Thousands Percentage Thousands Percentage
East Asia 8 201 1 39 11 50 14 214 1 36 9 55
China 5 663 0 41 14 44 10 847 1 40 9 51
Democratic People's Republic of Korea 53 0 0 68 32 108 0 1 66 34
Japan 657 1 4 6 90 801 1 6 10 85
Mongolia 27 1 3 0 97 66 2 38 0 62
Republic of Korea 1 800 4 46 2 52 2 392 5 32 3 65
Southeast Asia 9 461 2 24 28 48 20 190 3 33 28 39
Brunei Darussalam 35 12 9 68 24 45 11 14 57 30
Cambodia 417 4 36 4 60 1 035 7 66 4 31
Indonesia 1 952 1 24 58 17 3 975 2 32 58 11
Lao People's Democratic Republic 547 11 39 11 50 1 276 19 71 7 22
Malaysia 864 4 56 19 26 1 796 6 66 14 21
Myanmar 911 2 49 45 6 2 798 5 75 18 7
Philippines 2 505 4 6 27 68 5 423 5 3 36 62
Singapore 168 5 24 15 61 316 6 34 9 58
Thailand 415 1 21 15 64 862 1 13 17 70
Timor-Leste 79 9 90 0 10 38 3 60 0 40
Viet Nam 1 569 2 8 5 87 2 627 3 6 10 84
South Asia 22 277 2 59 25 17 38 337 2 31 45 24
Afghanistan 3 626 21 90 6 5 4 855 14 82 9 9
Bangladesh 5 425 5 76 19 5 7 247 4 44 46 9
Bhutan 118 23 100 0 0 44 6 81 0 19
India 7 234 1 42 34 24 15 860 1 16 55 29
Iran (Islamic Republic of) 748 1 1 18 81 1 112 1 0 9 90
Maldives 2 1 72 0 28 3 1 56 0 44
Nepal 856 4 70 28 2 1 668 6 35 51 14
Pakistan 3 344 3 50 32 18 5 922 3 25 51 24
Sri Lanka 926 5 26 37 37 1 626 8 10 46 44
Western Asia 12 700 8 37 8 55 21 424 8 57 2 42
Armenia 902 28 23 4 73 946 32 17 3 80
Azerbaijan 1 713 22 35 5 61 1 146 12 11 8 81
Bahrain 26 5 38 40 22 56 4 25 54 21
Cyprus 163 19 6 0 94 156 13 7 0 93
Georgia 954 19 13 1 86 833 21 15 1 84
Iraq 1 329 7 15 63 22 1 668 5 42 5 52
Israel 289 5 34 0 66 338 4 20 0 80
| 123 |

COUNTRY/TERRITORY OF ORIGIN
1995 2015
STO
CK O
F IN
TERN
ATIO
NA
L EM
IGRA
NTS
SHA
RE O
VER
TO
TAL
POPU
LATI
ON
INTR
A-R
EGIO
NA
L EM
IGRA
NTS
INTR
A-C
ON
TIN
ENTA
L EM
IGRA
NTS
INTE
R-CO
NTI
NEN
TAL
EMIG
RAN
TS
STO
CK O
F IN
TERN
ATIO
NA
L EM
IGRA
NTS
SHA
RE O
VER
TO
TAL
POPU
LATI
ON
INTR
A-R
EGIO
NA
L EM
IGRA
NTS
INTR
A-C
ON
TIN
ENTA
L EM
IGRA
NTS
INTE
R-CO
NTI
NEN
TAL
EMIG
RAN
TS
Share in stock of international emigrants
Share in stock of international emigrants
Thousands Percentage Thousands Percentage
Jordan 339 7 70 1 29 699 8 76 2 22
Kuwait 97 6 45 13 42 198 5 47 4 49
Lebanon 531 18 16 0 84 773 13 26 0 74
Oman 14 1 71 2 27 20 0 50 4 46
Qatar 13 3 76 1 23 24 1 60 2 38
Saudi Arabia 131 1 40 8 53 270 1 16 3 80
Palestine 2 275 87 86 0 14 3 732 80 86 0 14
Syrian Arab Republic 661 5 69 0 31 6 238 33 91 0 9
Turkey 2 677 5 3 1 96 3 100 4 3 2 95
United Arab Emirates 98 4 71 13 17 136 1 48 10 42
Yemen 486 3 91 0 9 1 089 4 90 0 10
EUROPE 48 695 7 58 564 8
Eastern Europe 23 936 8 50 15 34 29 212 10 35 37 28
Belarus 1 740 17 78 10 11 1 474 16 74 12 14
Bulgaria 653 8 6 15 79 1 167 16 3 45 53
Czechia 334 3 18 44 38 857 8 13 73 14
Hungary 404 4 10 39 52 587 6 7 65 28
Poland 1 798 5 3 49 48 4 258 11 2 79 19
Republic of Moldova 620 14 84 5 11 924 23 63 28 10
Romania 977 4 20 46 34 3 412 17 7 81 12
Russian Federation 11 612 8 46 12 42 10 355 7 40 17 43
Slovakia 192 4 60 31 8 336 6 29 64 7
Ukraine 5 606 11 77 4 19 5 843 13 68 13 19
Northern Europe 6 213 7 22 19 59 7 745 8 25 23 53
Channel Islands 16 11 99 0 1 16 10 99 0 1
Denmark 209 4 37 24 38 251 4 42 26 32
Estonia 130 9 15 68 17 191 15 41 47 11
Faroe Islands 10 22 97 0 3 15 30 98 0 2
Finland 289 6 69 13 18 289 5 64 19 17
Iceland 21 8 54 16 30 39 12 64 16 20
Ireland 864 24 65 4 30 766 16 52 9 39
Isle of Man 9 13 92 0 8 9 10 96 0 4
Latvia 229 9 11 64 25 359 18 42 46 12
Lithuania 342 9 11 70 19 568 19 47 42 11
Norway 151 3 44 16 40 189 4 44 23 33
Sweden 227 3 37 28 35 328 3 45 28 27
United Kingdom of Great Britain and Northern Ireland
3 715 6 7 13 80 4 726 7 9 19 71
TABLE A1 (CONTINUED)
| 124 |

TABLE A1 (CONTINUED)
COUNTRY/TERRITORY OF ORIGIN
1995 2015
STO
CK O
F IN
TERN
ATIO
NA
L EM
IGRA
NTS
SHA
RE O
VER
TO
TAL
POPU
LATI
ON
INTR
A-R
EGIO
NA
L EM
IGRA
NTS
INTR
A-C
ON
TIN
ENTA
L EM
IGRA
NTS
INTE
R-CO
NTI
NEN
TAL
EMIG
RAN
TS
STO
CK O
F IN
TERN
ATIO
NA
L EM
IGRA
NTS
SHA
RE O
VER
TO
TAL
POPU
LATI
ON
INTR
A-R
EGIO
NA
L EM
IGRA
NTS
INTR
A-C
ON
TIN
ENTA
L EM
IGRA
NTS
INTE
R-CO
NTI
NEN
TAL
EMIG
RAN
TS
Share in stock of international emigrants
Share in stock of international emigrants
Thousands Percentage Thousands Percentage
Southern Europe 11 958 8 19 48 33 12 674 8 24 45 31
Albania 500 16 90 4 6 1 138 39 84 6 10
Andorra 4 7 63 32 6 8 10 84 15 1
Bosnia and Herzegovina 1 374 36 63 27 10 1 611 46 56 31 13
Croatia 705 15 45 39 16 872 21 44 32 24
Gibraltar 10 34 0 93 7 10 31 0 91 9
Greece 1 017 9 6 44 50 862 8 6 40 54
Holy See 0 5 67 3 31 0 22 99 0 1
Italy 3 266 6 2 50 49 2 872 5 5 53 43
Malta 110 29 1 30 70 100 23 2 32 66
Montenegro 146 24 55 43 3 136 22 69 28 3
Portugal 1 929 19 3 59 38 2 209 21 6 61 34
San Marino 2 9 86 13 2 2 7 84 13 3
Serbia 921 9 12 81 7 932 11 16 70 14
Slovenia 109 5 39 39 22 134 6 30 49 21
Spain 1 371 3 5 55 40 1 289 3 6 58 37
The former Yugoslav Republic of Macedonia 491 25 25 42 33 497 24 28 24 48
Western Europe 6 589 4 28 25 47 8 933 5 31 31 38
Austria 490 6 52 16 32 533 6 58 18 24
Belgium 376 4 59 18 23 542 5 52 29 20
France 1 329 2 25 30 45 2 124 3 24 33 43
Germany 3 281 4 20 27 53 4 033 5 25 33 42
Liechtenstein 3 10 89 5 6 4 10 82 15 3
Luxembourg 30 7 70 19 11 58 10 69 24 6
Monaco 5 15 76 15 9 29 76 89 8 3
Netherlands 738 5 33 12 55 962 6 37 19 44
Switzerland 337 5 36 32 32 649 8 32 49 19
LATIN AMERICA AND THE CARIBBEAN 19 776 4 36 642 6
Caribbean 5 125 14 10 2 88 8 102 19 9 2 90
Anguilla 3 26 65 2 33 2 16 68 3 30
Antigua and Barbuda 28 38 26 0 74 49 49 16 0 84
Aruba 11 13 43 7 50 17 16 27 5 68
Bahamas 30 11 6 0 94 40 10 3 0 97
Barbados 90 34 6 1 94 95 33 5 0 95
British Virgin Islands 4 23 91 0 9 5 15 88 0 12
| 125 |

TABLE A1 (CONTINUED)
COUNTRY/TERRITORY OF ORIGIN
1995 2015
STO
CK O
F IN
TERN
ATIO
NA
L EM
IGRA
NTS
SHA
RE O
VER
TO
TAL
POPU
LATI
ON
INTR
A-R
EGIO
NA
L EM
IGRA
NTS
INTR
A-C
ON
TIN
ENTA
L EM
IGRA
NTS
INTE
R-CO
NTI
NEN
TAL
EMIG
RAN
TS
STO
CK O
F IN
TERN
ATIO
NA
L EM
IGRA
NTS
SHA
RE O
VER
TO
TAL
POPU
LATI
ON
INTR
A-R
EGIO
NA
L EM
IGRA
NTS
INTR
A-C
ON
TIN
ENTA
L EM
IGRA
NTS
INTE
R-CO
NTI
NEN
TAL
EMIG
RAN
TS
Share in stock of international emigrants
Share in stock of international emigrants
Thousands Percentage Thousands Percentage
Caribbean Netherlands 5 32 14 19 67 9 36 38 12 50
Cayman Islands 1 3 1 10 88 1 2 2 8 90
Cuba 935 9 3 3 93 1 511 13 2 4 95
Curaçao 49 34 7 1 92 70 44 12 0 88
Dominica 45 63 42 1 57 70 95 30 1 69
Dominican Republic 675 9 11 3 86 1 403 13 6 2 92
Grenada 54 54 32 1 67 65 61 16 1 83
Guadeloupe 7 2 64 32 4 10 2 75 19 5
Haiti 663 8 37 2 61 1 245 12 32 2 66
Jamaica 720 28 2 0 98 1 073 37 3 0 97
Martinique 13 3 59 38 2 14 4 76 20 4
Montserrat 12 113 20 0 80 16 319 19 0 81
Puerto Rico 1 407 38 1 0 99 1 867 51 1 0 99
Saint Kitts and Nevis 26 61 42 0 58 37 69 32 0 68
Saint Lucia 31 21 36 6 57 53 30 22 3 75
Saint Vincent and the Grenadines 46 42 40 1 60 59 54 26 1 73
Sint Maarten (Dutch part) 17 55 4 0 95 24 61 8 0 92
Trinidad and Tobago 251 20 5 1 94 361 27 3 1 95
Turks and Caicos Islands 2 10 84 0 16 2 5 86 0 14
United States Virgin Islands 3 3 94 0 6 3 3 92 0 7
Central America 9 285 7 7 1 93 16 827 10 4 0 96
Belize 42 20 7 3 90 61 17 8 2 90
Costa Rica 85 2 16 8 76 139 3 17 5 78
El Salvador 933 17 24 0 75 1 510 24 4 0 95
Guatemala 457 4 17 1 82 1 081 7 9 0 91
Honduras 247 4 15 1 83 700 8 9 1 90
Mexico 6 949 7 0 0 99 12 547 10 0 0 99
Nicaragua 438 10 51 1 48 645 11 52 1 47
Panama 133 5 17 6 77 145 4 10 5 84
South America 5 366 2 42 3 55 11 713 3 35 3 62
Argentina 482 1 39 3 58 954 2 28 3 70
Bolivia (Plurinational State of) 283 4 78 1 21 796 7 65 1 35
Brazil 750 0 24 1 75 1 557 1 14 1 85
Chile 495 3 55 2 43 611 3 45 2 53
| 126 |

TABLE A1 (CONTINUED)
COUNTRY/TERRITORY OF ORIGIN
1995 2015
STO
CK O
F IN
TERN
ATIO
NA
L EM
IGRA
NTS
SHA
RE O
VER
TO
TAL
POPU
LATI
ON
INTR
A-R
EGIO
NA
L EM
IGRA
NTS
INTR
A-C
ON
TIN
ENTA
L EM
IGRA
NTS
INTE
R-CO
NTI
NEN
TAL
EMIG
RAN
TS
STO
CK O
F IN
TERN
ATIO
NA
L EM
IGRA
NTS
SHA
RE O
VER
TO
TAL
POPU
LATI
ON
INTR
A-R
EGIO
NA
L EM
IGRA
NTS
INTR
A-C
ON
TIN
ENTA
L EM
IGRA
NTS
INTE
R-CO
NTI
NEN
TAL
EMIG
RAN
TS
Share in stock of international emigrants
Share in stock of international emigrants
Thousands Percentage Thousands Percentage
Colombia 1 216 3 54 4 42 2 672 6 46 5 50
Ecuador 326 3 15 2 83 1 105 7 8 1 92
French Guyana 3 2 23 76 2 4 2 21 77 2
Guyana 296 39 5 6 89 473 62 6 7 87
Paraguay 336 7 94 0 6 844 13 87 0 13
Peru 508 2 26 3 72 1 430 5 33 2 66
Suriname 193 44 9 2 89 278 50 13 2 86
Uruguay 234 7 69 2 29 349 10 50 1 49
Venezuela (Bolivarian Republic of) 243 1 20 12 68 641 2 11 8 81
NORTH AMERICA 2 959 1 36 64 4 267 1 28 72
Bermuda 43 68 24 76 16 26 70 30
Canada 1 068 4 75 25 1 313 4 66 34
Greenland 11 20 0 100 18 32 0 100
Saint Pierre and Miquelon 0 8 82 18 0 7 74 26
United States of America 1 836 1 14 86 2 919 1 10 90
OCEANIA 1 074 4 1 806 5
Australia/ New Zealand 761 3 51 3 45 1 318 5 55 2 43
Australia 344 2 21 5 74 521 2 15 3 82
New Zealand 417 11 77 2 21 797 17 82 1 17
Melanesia 123 2 6 55 39 230 2 3 61 36
Fiji 106 14 0 56 43 207 23 0 62 38
New Caledonia 5 2 6 90 4 6 2 5 92 3
Papua New Guinea 4 0 29 41 30 4 0 15 34 51
Solomon Islands 3 1 41 51 8 4 1 28 64 9
Vanuatu 6 3 69 24 7 9 3 62 24 14
Micronesia 29 6 6 62 32 42 8 51 10 39
Guam 2 1 0 95 5 2 1 47 5 48
Kiribati 4 5 40 58 3 5 4 27 68 6
Marshall Islands 4 8 0 10 90 7 14 5 1 94
Micronesia (Federated States of) 12 11 0 59 41 20 19 61 0 39
Nauru 2 15 0 98 2 2 20 64 32 4
Northern Mariana Islands 3 5 0 89 11 3 5 96 0 4
Palau 3 16 0 99 1 3 12 90 0 10
| 127 |

COUNTRY/TERRITORY OF ORIGIN
1995 2015
STO
CK O
F IN
TERN
ATIO
NA
L EM
IGRA
NTS
SHA
RE O
VER
TO
TAL
POPU
LATI
ON
INTR
A-R
EGIO
NA
L EM
IGRA
NTS
INTR
A-C
ON
TIN
ENTA
L EM
IGRA
NTS
INTE
R-CO
NTI
NEN
TAL
EMIG
RAN
TS
STO
CK O
F IN
TERN
ATIO
NA
L EM
IGRA
NTS
SHA
RE O
VER
TO
TAL
POPU
LATI
ON
INTR
A-R
EGIO
NA
L EM
IGRA
NTS
INTR
A-C
ON
TIN
ENTA
L EM
IGRA
NTS
INTE
R-CO
NTI
NEN
TAL
EMIG
RAN
TS
Share in stock of international emigrants
Share in stock of international emigrants
Thousands Percentage Thousands Percentage
Polynesia 161 28 0 0 100 216 32 0 0 100
American Samoa 3 5 57 4 39 2 4 78 20 2
Cook Islands 17 90 0 100 0 22 123 0 100 0
French Polynesia 4 2 2 93 5 1 0 13 71 16
Niue 6 258 0 99 1 5 329 0 99 1
Samoa 82 48 20 62 18 114 59 14 69 16
Tokelau 2 119 9 91 0 2 180 6 94 0
Tonga 38 40 4 58 38 58 55 3 62 35
Tuvalu 3 30 5 90 4 3 32 6 76 19
Wallis and Futuna Islands 7 49 0 93 7 8 65 0 99 0
* Data for South Sudan in 1995 was imputed by UN DESA.
TABLE A1 (CONTINUED)
| 128 |
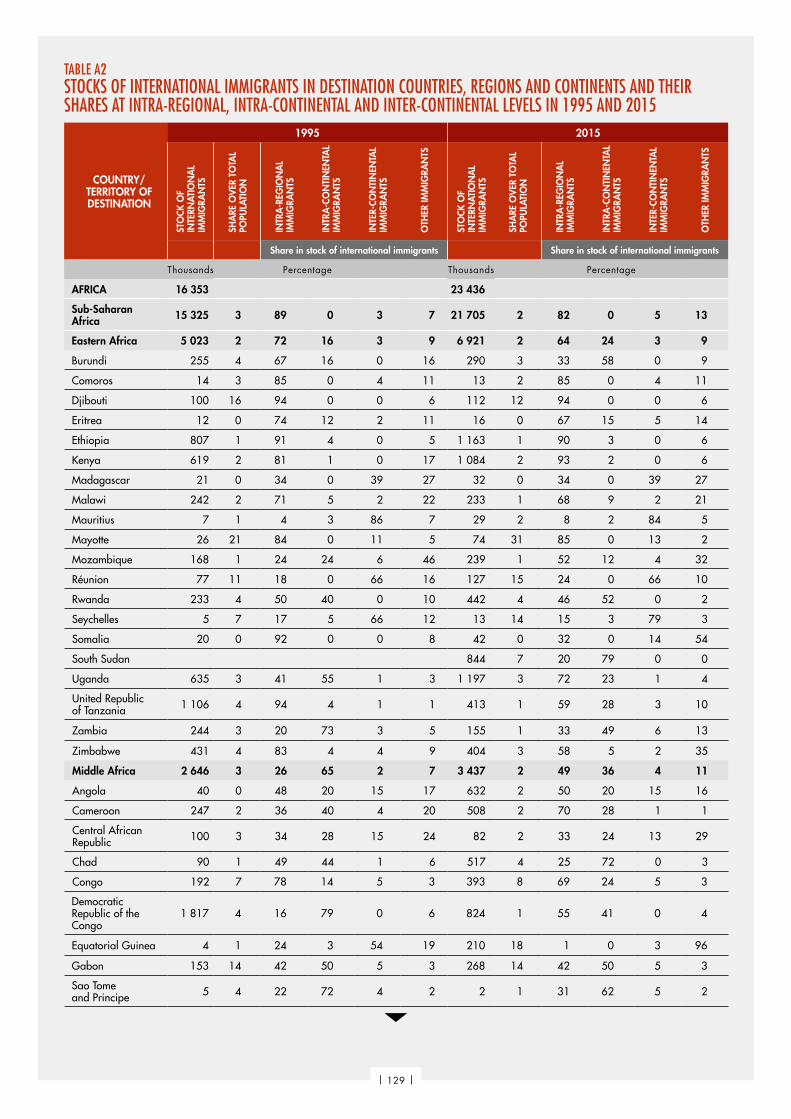
TABLE A2 STOCKS OF INTERNATIONAL IMMIGRANTS IN DESTINATION COUNTRIES, REGIONS AND CONTINENTS AND THEIR SHARES AT INTRA-REGIONAL, INTRA-CONTINENTAL AND INTER-CONTINENTAL LEVELS IN 1995 AND 2015
COUNTRY/TERRITORY OF DESTINATION
1995 2015
STO
CK O
F IN
TERN
ATIO
NA
L IM
MIG
RAN
TS
SHA
RE O
VER
TO
TAL
POPU
LATI
ON
INTR
A-R
EGIO
NA
L IM
MIG
RAN
TS
INTR
A-C
ON
TIN
ENTA
L IM
MIG
RAN
TS
INTE
R-CO
NTI
NEN
TAL
IMM
IGRA
NTS
OTH
ER IM
MIG
RAN
TS
STO
CK O
F IN
TERN
ATIO
NA
L IM
MIG
RAN
TS
SHA
RE O
VER
TO
TAL
POPU
LATI
ON
INTR
A-R
EGIO
NA
L IM
MIG
RAN
TS
INTR
A-C
ON
TIN
ENTA
L IM
MIG
RAN
TS
INTE
R-CO
NTI
NEN
TAL
IMM
IGRA
NTS
OTH
ER IM
MIG
RAN
TS
Share in stock of international immigrants Share in stock of international immigrants
Thousands Percentage Thousands Percentage
AFRICA 16 353 23 436
Sub-Saharan Africa 15 325 3 89 0 3 7 21 705 2 82 0 5 13
Eastern Africa 5 023 2 72 16 3 9 6 921 2 64 24 3 9
Burundi 255 4 67 16 0 16 290 3 33 58 0 9
Comoros 14 3 85 0 4 11 13 2 85 0 4 11
Djibouti 100 16 94 0 0 6 112 12 94 0 0 6
Eritrea 12 0 74 12 2 11 16 0 67 15 5 14
Ethiopia 807 1 91 4 0 5 1 163 1 90 3 0 6
Kenya 619 2 81 1 0 17 1 084 2 93 2 0 6
Madagascar 21 0 34 0 39 27 32 0 34 0 39 27
Malawi 242 2 71 5 2 22 233 1 68 9 2 21
Mauritius 7 1 4 3 86 7 29 2 8 2 84 5
Mayotte 26 21 84 0 11 5 74 31 85 0 13 2
Mozambique 168 1 24 24 6 46 239 1 52 12 4 32
Réunion 77 11 18 0 66 16 127 15 24 0 66 10
Rwanda 233 4 50 40 0 10 442 4 46 52 0 2
Seychelles 5 7 17 5 66 12 13 14 15 3 79 3
Somalia 20 0 92 0 0 8 42 0 32 0 14 54
South Sudan 844 7 20 79 0 0
Uganda 635 3 41 55 1 3 1 197 3 72 23 1 4
United Republic of Tanzania 1 106 4 94 4 1 1 413 1 59 28 3 10
Zambia 244 3 20 73 3 5 155 1 33 49 6 13
Zimbabwe 431 4 83 4 4 9 404 3 58 5 2 35
Middle Africa 2 646 3 26 65 2 7 3 437 2 49 36 4 11
Angola 40 0 48 20 15 17 632 2 50 20 15 16
Cameroon 247 2 36 40 4 20 508 2 70 28 1 1
Central African Republic 100 3 34 28 15 24 82 2 33 24 13 29
Chad 90 1 49 44 1 6 517 4 25 72 0 3
Congo 192 7 78 14 5 3 393 8 69 24 5 3
Democratic Republic of the Congo
1 817 4 16 79 0 6 824 1 55 41 0 4
Equatorial Guinea 4 1 24 3 54 19 210 18 1 0 3 96
Gabon 153 14 42 50 5 3 268 14 42 50 5 3
Sao Tome and Principe 5 4 22 72 4 2 2 1 31 62 5 2
| 129 |
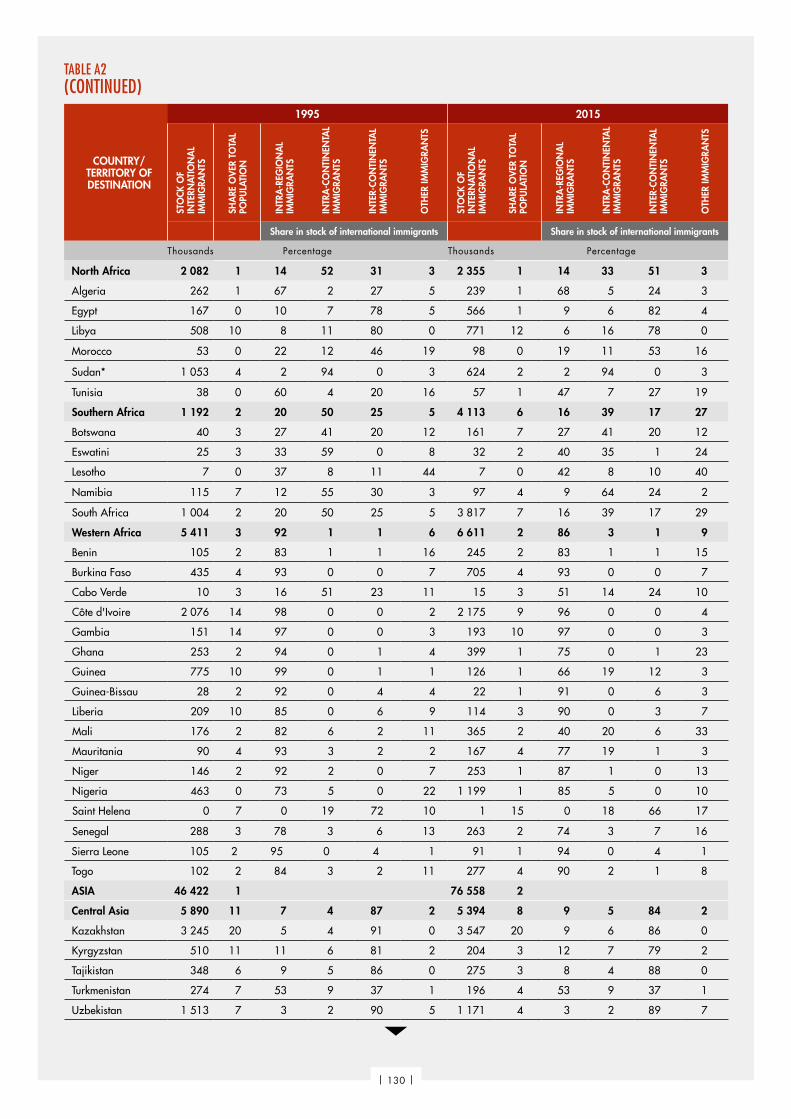
TABLE A2 (CONTINUED)
COUNTRY/TERRITORY OF DESTINATION
1995 2015
STO
CK O
F IN
TERN
ATIO
NA
L IM
MIG
RAN
TS
SHA
RE O
VER
TO
TAL
POPU
LATI
ON
INTR
A-R
EGIO
NA
L IM
MIG
RAN
TS
INTR
A-C
ON
TIN
ENTA
L IM
MIG
RAN
TS
INTE
R-CO
NTI
NEN
TAL
IMM
IGRA
NTS
OTH
ER IM
MIG
RAN
TS
STO
CK O
F IN
TERN
ATIO
NA
L IM
MIG
RAN
TS
SHA
RE O
VER
TO
TAL
POPU
LATI
ON
INTR
A-R
EGIO
NA
L IM
MIG
RAN
TS
INTR
A-C
ON
TIN
ENTA
L IM
MIG
RAN
TS
INTE
R-CO
NTI
NEN
TAL
IMM
IGRA
NTS
OTH
ER IM
MIG
RAN
TS
Share in stock of international immigrants Share in stock of international immigrants
Thousands Percentage Thousands Percentage
North Africa 2 082 1 14 52 31 3 2 355 1 14 33 51 3
Algeria 262 1 67 2 27 5 239 1 68 5 24 3
Egypt 167 0 10 7 78 5 566 1 9 6 82 4
Libya 508 10 8 11 80 0 771 12 6 16 78 0
Morocco 53 0 22 12 46 19 98 0 19 11 53 16
Sudan* 1 053 4 2 94 0 3 624 2 2 94 0 3
Tunisia 38 0 60 4 20 16 57 1 47 7 27 19
Southern Africa 1 192 2 20 50 25 5 4 113 6 16 39 17 27
Botswana 40 3 27 41 20 12 161 7 27 41 20 12
Eswatini 25 3 33 59 0 8 32 2 40 35 1 24
Lesotho 7 0 37 8 11 44 7 0 42 8 10 40
Namibia 115 7 12 55 30 3 97 4 9 64 24 2
South Africa 1 004 2 20 50 25 5 3 817 7 16 39 17 29
Western Africa 5 411 3 92 1 1 6 6 611 2 86 3 1 9
Benin 105 2 83 1 1 16 245 2 83 1 1 15
Burkina Faso 435 4 93 0 0 7 705 4 93 0 0 7
Cabo Verde 10 3 16 51 23 11 15 3 51 14 24 10
Côte d'Ivoire 2 076 14 98 0 0 2 2 175 9 96 0 0 4
Gambia 151 14 97 0 0 3 193 10 97 0 0 3
Ghana 253 2 94 0 1 4 399 1 75 0 1 23
Guinea 775 10 99 0 1 1 126 1 66 19 12 3
Guinea-Bissau 28 2 92 0 4 4 22 1 91 0 6 3
Liberia 209 10 85 0 6 9 114 3 90 0 3 7
Mali 176 2 82 6 2 11 365 2 40 20 6 33
Mauritania 90 4 93 3 2 2 167 4 77 19 1 3
Niger 146 2 92 2 0 7 253 1 87 1 0 13
Nigeria 463 0 73 5 0 22 1 199 1 85 5 0 10
Saint Helena 0 7 0 19 72 10 1 15 0 18 66 17
Senegal 288 3 78 3 6 13 263 2 74 3 7 16
Sierra Leone 105 2 95 0 4 1 91 1 94 0 4 1
Togo 102 2 84 3 2 11 277 4 90 2 1 8
ASIA 46 422 1 76 558 2
Central Asia 5 890 11 7 4 87 2 5 394 8 9 5 84 2
Kazakhstan 3 245 20 5 4 91 0 3 547 20 9 6 86 0
Kyrgyzstan 510 11 11 6 81 2 204 3 12 7 79 2
Tajikistan 348 6 9 5 86 0 275 3 8 4 88 0
Turkmenistan 274 7 53 9 37 1 196 4 53 9 37 1
Uzbekistan 1 513 7 3 2 90 5 1 171 4 3 2 89 7
| 130 |

TABLE A2 (CONTINUED)
COUNTRY/TERRITORY OF DESTINATION
1995 2015
STO
CK O
F IN
TERN
ATIO
NA
L IM
MIG
RAN
TS
SHA
RE O
VER
TO
TAL
POPU
LATI
ON
INTR
A-R
EGIO
NA
L IM
MIG
RAN
TS
INTR
A-C
ON
TIN
ENTA
L IM
MIG
RAN
TS
INTE
R-CO
NTI
NEN
TAL
IMM
IGRA
NTS
OTH
ER IM
MIG
RAN
TS
STO
CK O
F IN
TERN
ATIO
NA
L IM
MIG
RAN
TS
SHA
RE O
VER
TO
TAL
POPU
LATI
ON
INTR
A-R
EGIO
NA
L IM
MIG
RAN
TS
INTR
A-C
ON
TIN
ENTA
L IM
MIG
RAN
TS
INTE
R-CO
NTI
NEN
TAL
IMM
IGRA
NTS
OTH
ER IM
MIG
RAN
TS
Share in stock of international immigrants Share in stock of international immigrants
Thousands Percentage Thousands Percentage
East Asia 4 658 0 69 12 10 9 7 601 0 68 18 9 5
China 3 111 0 71 12 4 13 4 159 0 77 13 5 5
Democratic People's Republic of Korea
35 0 71 11 7 10 48 0 71 14 11 4
Japan 1 381 1 65 10 23 2 2 232 2 57 21 18 4
Mongolia 7 0 31 11 48 10 18 1 68 5 24 3
Republic of Korea 124 0 47 30 19 5 1 143 2 57 29 9 5
Southeast Asia 3 700 1 60 26 3 11 9 610 2 69 22 2 6
Brunei Darussalam 85 29 82 14 3 1 103 25 82 14 3 1
Cambodia 92 1 90 3 1 6 74 0 92 3 1 4
Indonesia 379 0 21 54 9 16 338 0 22 47 19 11
Lao People's Democratic Republic
24 0 73 16 0 11 45 1 59 31 0 10
Malaysia 937 5 69 20 1 10 2 651 9 63 29 1 8
Myanmar 114 0 0 88 0 12 73 0 0 87 0 13
Philippines 207 0 22 41 20 17 212 0 3 38 33 26
Singapore 991 29 48 32 1 20 2 544 46 52 36 1 11
Thailand 810 1 94 4 2 0 3 487 5 96 3 1 0
Timor-Leste 10 1 62 14 12 12 12 1 62 14 12 12
Viet Nam 51 0 87 6 4 3 73 0 56 29 8 7
South Asia 15 343 1 85 12 1 3 14 174 1 85 9 1 6
Afghanistan 72 0 24 54 0 22 490 1 71 3 0 26
Bangladesh 935 1 3 76 6 14 1 423 1 5 67 8 20
Bhutan 28 5 89 2 1 8 51 6 89 2 1 8
India 6 952 1 95 2 1 2 5 241 0 95 2 0 2
Iran (Islamic Republic of) 2 938 5 69 28 0 2 2 726 3 87 4 0 9
Maldives 19 7 88 3 6 4 64 15 89 2 2 7
Nepal 690 3 91 4 0 6 510 2 94 4 0 3
Pakistan 3 669 3 100 0 0 0 3 629 2 100 0 0 0
Sri Lanka 41 0 88 4 3 4 40 0 36 34 25 5
Western Asia 16 830 10 28 40 24 8 39 780 15 30 49 16 4
Armenia 694 22 86 2 7 6 191 7 70 6 13 11
Azerbaijan 344 4 78 9 12 1 264 3 76 10 13 1
Bahrain 206 37 10 72 16 2 704 51 8 77 14 1
Cyprus 62 7 14 14 71 1 192 17 14 14 71 1
| 131 |

COUNTRY/TERRITORY OF DESTINATION
1995 2015
STO
CK O
F IN
TERN
ATIO
NA
L IM
MIG
RAN
TS
SHA
RE O
VER
TO
TAL
POPU
LATI
ON
INTR
A-R
EGIO
NA
L IM
MIG
RAN
TS
INTR
A-C
ON
TIN
ENTA
L IM
MIG
RAN
TS
INTE
R-CO
NTI
NEN
TAL
IMM
IGRA
NTS
OTH
ER IM
MIG
RAN
TS
STO
CK O
F IN
TERN
ATIO
NA
L IM
MIG
RAN
TS
SHA
RE O
VER
TO
TAL
POPU
LATI
ON
INTR
A-R
EGIO
NA
L IM
MIG
RAN
TS
INTR
A-C
ON
TIN
ENTA
L IM
MIG
RAN
TS
INTE
R-CO
NTI
NEN
TAL
IMM
IGRA
NTS
OTH
ER IM
MIG
RAN
TS
Share in stock of international immigrants Share in stock of international immigrants
Thousands Percentage Thousands Percentage
Georgia 152 3 7 11 80 2 77 2 24 4 67 4
Iraq 199 1 56 23 10 12 359 1 83 4 6 7
Israel 1 792 34 11 7 69 13 2 012 25 8 6 56 30
Jordan 1 537 34 81 3 16 0 3 112 34 92 2 5 0
Kuwait 922 57 9 72 16 3 2 866 73 7 72 17 4
Lebanon 608 20 79 3 18 1 1 973 34 95 1 4 0
Oman 540 24 3 85 8 3 1 815 43 2 88 5 4
Qatar 362 70 29 62 6 2 1 688 68 7 79 12 2
Saudi Arabia 5 123 27 15 69 12 3 10 771 34 15 70 12 3
Palestine 282 11 83 0 9 8 256 5 81 0 11 9
Syrian Arab Republic 831 6 35 0 0 65 994 5 88 0 0 12
Turkey 1 216 2 5 3 80 12 4 131 5 69 1 28 2
United Arab Emirates 1 824 74 9 73 16 2 7 995 87 7 76 14 3
Yemen 137 1 8 0 69 24 380 1 4 0 84 11
EUROPE 52 867 7 74 502 10
Eastern Europe 21 344 7 57 4 37 2 19 881 7 52 5 40 2
Belarus 1 186 12 85 3 12 0 1 083 11 85 3 12 0
Bulgaria 32 0 46 22 26 6 134 2 38 35 26 1
Czechia 166 2 85 8 7 0 416 4 67 9 24 0
Hungary 322 3 67 22 9 3 476 5 58 25 13 4
Poland 965 3 61 31 3 5 612 2 53 39 7 1
Republic of Moldova 367 8 91 0 6 3 143 4 90 1 6 3
Romania 135 1 73 9 9 9 281 1 53 36 7 4
Russian Federation 11 929 8 40 4 57 0 11 643 8 38 3 59 0
Slovakia 69 1 81 13 5 0 178 3 77 16 6 1
Ukraine 6 172 12 79 1 14 6 4 915 11 75 1 16 9
Northern Europe 7 195 8 19 31 48 2 13 189 13 14 32 53 1
Channel Islands 61 42 91 7 0 2 82 50 77 19 0 4
Denmark 303 6 21 29 51 0 596 10 18 30 52 0
Estonia 316 22 3 92 5 0 195 15 5 90 6 0
Faroe Islands 3 6 86 1 9 3 6 11 76 5 14 6
Finland 100 2 32 44 22 2 315 6 32 19 49 0
Iceland 13 5 42 29 29 0 39 12 27 47 25 0
Ireland 227 6 60 19 21 0 750 16 43 33 24 0
TABLE A2 (CONTINUED)
| 132 |

TABLE A2 (CONTINUED)
COUNTRY/TERRITORY OF DESTINATION
1995 2015
STO
CK O
F IN
TERN
ATIO
NA
L IM
MIG
RAN
TS
SHA
RE O
VER
TO
TAL
POPU
LATI
ON
INTR
A-R
EGIO
NA
L IM
MIG
RAN
TS
INTR
A-C
ON
TIN
ENTA
L IM
MIG
RAN
TS
INTE
R-CO
NTI
NEN
TAL
IMM
IGRA
NTS
OTH
ER IM
MIG
RAN
TS
STO
CK O
F IN
TERN
ATIO
NA
L IM
MIG
RAN
TS
SHA
RE O
VER
TO
TAL
POPU
LATI
ON
INTR
A-R
EGIO
NA
L IM
MIG
RAN
TS
INTR
A-C
ON
TIN
ENTA
L IM
MIG
RAN
TS
INTE
R-CO
NTI
NEN
TAL
IMM
IGRA
NTS
OTH
ER IM
MIG
RAN
TS
Share in stock of international immigrants Share in stock of international immigrants
Thousands Percentage Thousands Percentage
Isle of Man 37 53 93 0 2 4 45 54 92 0 3 5
Latvia 538 21 5 92 3 0 265 13 9 85 6 0
Lithuania 274 8 5 84 7 5 136 5 9 83 7 0
Norway 233 5 29 17 50 4 746 14 22 31 46 1
Sweden 936 11 31 22 38 9 1 603 16 19 23 53 5
United Kingdom of Great Britain and Northern Ireland
4 155 7 15 18 66 1 8 411 13 9 30 60 0
Southern Europe 5 986 4 37 21 39 2 15 830 10 19 34 47 0
Albania 71 2 79 0 10 11 52 2 79 0 10 11
Andorra 41 63 80 15 2 2 42 54 76 14 5 6
Bosnia and Herzegovina 69 2 87 12 0 2 39 1 84 13 0 2
Croatia 674 15 81 2 0 16 576 14 86 9 1 3
Gibraltar 8 28 27 40 19 15 11 32 19 51 9 21
Greece 858 8 29 29 42 0 1 243 11 36 31 32 0
Holy See 1 100 0 0 0 100 1 100 0 0 0 100
Italy 1 775 3 20 23 57 0 5 805 10 12 43 46 0
Malta 18 5 6 42 51 1 42 10 8 47 41 5
Montenegro .. .. .. .. .. .. 83 13 92 6 1 1
Portugal 533 5 3 25 71 1 865 8 2 31 66 0
San Marino 4 14 90 4 3 3 5 16 88 5 2 5
Serbia 630 6 96 3 1 0 807 9 93 6 1 0
Slovenia 174 9 88 9 1 2 238 11 62 9 28 0
Spain 1 020 3 6 40 53 1 5 891 13 4 34 61 0
The former Yugoslav Republic of Macedonia
109 6 83 1 14 1 131 6 81 1 17 1
Western Europe 18 343 10 10 42 45 3 25 602 13 11 41 47 1
Austria 895 11 15 59 26 0 1 492 17 17 56 26 0
Belgium 910 9 23 41 31 4 1 252 11 29 38 26 7
France 6 088 10 7 38 55 0 7 918 12 7 27 66 0
Germany 7 464 9 6 50 40 4 10 220 13 6 53 40 1
Liechtenstein 13 43 62 29 8 0 24 64 79 12 6 3
Luxembourg 126 31 34 61 5 0 261 46 31 66 3 0
Monaco 21 69 35 20 0 45 21 55 30 21 0 49
Netherlands 1 346 9 14 12 73 0 1 996 12 11 20 69 0
Switzerland 1 479 21 25 41 23 11 2 416 29 26 44 25 5
| 133 |

TABLE A2 (CONTINUED)
COUNTRY/TERRITORY OF DESTINATION
1995 2015
STO
CK O
F IN
TERN
ATIO
NA
L IM
MIG
RAN
TS
SHA
RE O
VER
TO
TAL
POPU
LATI
ON
INTR
A-R
EGIO
NA
L IM
MIG
RAN
TS
INTR
A-C
ON
TIN
ENTA
L IM
MIG
RAN
TS
INTE
R-CO
NTI
NEN
TAL
IMM
IGRA
NTS
OTH
ER IM
MIG
RAN
TS
STO
CK O
F IN
TERN
ATIO
NA
L IM
MIG
RAN
TS
SHA
RE O
VER
TO
TAL
POPU
LATI
ON
INTR
A-R
EGIO
NA
L IM
MIG
RAN
TS
INTR
A-C
ON
TIN
ENTA
L IM
MIG
RAN
TS
INTE
R-CO
NTI
NEN
TAL
IMM
IGRA
NTS
OTH
ER IM
MIG
RAN
TS
Share in stock of international immigrants Share in stock of international immigrants
Thousands Percentage Thousands Percentage
LATIN AMERICA AND THE CARIBBEAN
6 695 1 9 272 1
Caribbean 1 155 3 45 9 42 5 1 386 3 51 9 34 7
Anguilla 3 34 50 7 17 26 5 37 50 7 17 26
Antigua and Barbuda 18 24 57 20 20 3 28 28 57 23 18 1
Aruba 22 28 27 37 21 15 36 35 29 44 22 4
Bahamas 32 11 67 3 28 3 59 15 65 4 29 2
Barbados 26 10 44 11 22 23 34 12 26 19 14 41
British Virgin Islands 10 55 63 10 15 12 19 64 58 12 15 15
Bonaire, Sint Eustatius and Saba
42 280 60 13 24 2 13 53 59 13 24 5
Cayman Islands 14 45 47 15 37 1 24 40 46 14 40 0
Cuba 26 0 10 11 65 14 13 0 11 12 71 6
Curaçao .. .. .. .. .. .. 38 24 40 24 34 1
Dominica 3 4 56 4 27 13 7 9 51 4 26 19
Dominican Republic 323 4 70 12 17 0 416 4 82 4 12 2
Grenada 6 6 53 9 3 36 7 7 55 10 3 32
Guadeloupe 75 19 34 1 58 6 99 22 31 2 62 6
Haiti 22 0 27 28 38 7 40 0 27 28 38 7
Jamaica 23 1 27 4 58 11 23 1 28 4 58 11
Martinique 47 13 15 3 78 3 62 16 16 3 78 3
Montserrat 2 16 45 18 19 18 1 26 45 18 19 17
Puerto Rico 338 9 22 5 71 3 280 8 26 6 61 8
Saint Kitts and Nevis 4 10 37 10 0 53 7 14 37 10 0 53
Saint Lucia 7 5 27 19 19 35 13 7 27 19 19 35
Saint Vincent and the Grenadines 4 4 60 5 28 6 5 4 60 5 28 6
Sint Maarten (Dutch part) 0 0 .. .. .. .. 27 70 72 9 10 9
Trinidad and Tobago 46 4 65 13 15 8 50 4 36 23 26 15
Turks and Caicos Islands 7 46 67 0 17 16 23 66 69 0 8 23
United States Virgin Islands 54 51 62 0 28 10 57 54 68 0 30 2
| 134 |

TABLE A2 (CONTINUED)
COUNTRY/TERRITORY OF DESTINATION
1995 2015
STO
CK O
F IN
TERN
ATIO
NA
L IM
MIG
RAN
TS
SHA
RE O
VER
TO
TAL
POPU
LATI
ON
INTR
A-R
EGIO
NA
L IM
MIG
RAN
TS
INTR
A-C
ON
TIN
ENTA
L IM
MIG
RAN
TS
INTE
R-CO
NTI
NEN
TAL
IMM
IGRA
NTS
OTH
ER IM
MIG
RAN
TS
STO
CK O
F IN
TERN
ATIO
NA
L IM
MIG
RAN
TS
SHA
RE O
VER
TO
TAL
POPU
LATI
ON
INTR
A-R
EGIO
NA
L IM
MIG
RAN
TS
INTR
A-C
ON
TIN
ENTA
L IM
MIG
RAN
TS
INTE
R-CO
NTI
NEN
TAL
IMM
IGRA
NTS
OTH
ER IM
MIG
RAN
TS
Share in stock of international immigrants Share in stock of international immigrants
Thousands Percentage Thousands Percentage
Central America 1 299 1 48 7 32 13 2 043 1 31 13 55 1
Belize 33 16 83 1 12 3 55 15 82 1 14 3
Costa Rica 364 10 47 4 5 44 412 9 80 10 7 3
El Salvador 40 1 71 5 23 0 42 1 76 6 19 0
Guatemala 156 2 92 2 6 0 78 0 72 6 20 3
Honduras 149 3 94 2 4 0 38 0 64 10 26 1
Mexico 459 0 17 8 74 0 1 193 1 8 9 83 0
Nicaragua 27 1 69 7 20 4 40 1 71 7 17 5
Panama 71 3 20 45 35 1 185 5 17 50 32 0
South America 4 241 1 53 3 40 4 5 843 1 70 2 25 3
Argentina 1 596 5 57 0 38 5 2 088 5 81 0 16 2
Bolivia (Plurinational State of)
84 1 66 13 19 1 143 1 66 9 22 2
Brazil 742 0 18 1 78 4 717 0 29 1 67 2
Chile 142 1 63 4 34 0 469 3 77 2 22 0
Colombia 107 0 54 8 37 1 139 0 56 8 35 1
Ecuador 115 1 63 3 21 13 388 2 62 3 17 18
French Guyana 70 51 36 29 30 5 106 39 51 24 22 2
Guyana 6 1 51 18 20 11 15 2 57 15 22 6
Paraguay 187 4 87 1 9 3 156 2 87 1 9 2
Peru 57 0 48 4 46 2 91 0 48 4 46 2
Suriname 22 5 40 0 19 41 47 8 40 0 19 41
Uruguay 93 3 35 1 57 7 79 2 55 1 37 8
Venezuela (Bolivarian Republic of)
1 020 5 68 4 27 0 1 404 5 79 3 18 0
NORTH AMERICA 33 341 11 55 766 16
Bermuda 17 27 35 0 61 4 19 31 30 0 64 5
Canada 4 865 17 5 0 95 0 7 561 21 4 0 96 0
Greenland 7 13 1 0 98 1 6 11 1 0 94 5
Saint Pierre and Miquelon 1 21 23 0 77 0 1 16 25 0 73 2
United States of America 28 451 11 3 0 91 7 48 179 15 2 0 93 5
OCEANIA 5 022 17 8 052 20
Australia/ New Zealand 4 742 22 8 3 88 1 7 750 27 9 4 86 1
Australia 4 153 23 7 2 90 1 6 711 28 10 2 88 0
New Zealand 589 16 9 16 69 6 1 040 23 6 15 75 4
| 135 |

COUNTRY/TERRITORY OF DESTINATION
1995 2015
STO
CK O
F IN
TERN
ATIO
NA
L IM
MIG
RAN
TS
SHA
RE O
VER
TO
TAL
POPU
LATI
ON
INTR
A-R
EGIO
NA
L IM
MIG
RAN
TS
INTR
A-C
ON
TIN
ENTA
L IM
MIG
RAN
TS
INTE
R-CO
NTI
NEN
TAL
IMM
IGRA
NTS
OTH
ER IM
MIG
RAN
TS
STO
CK O
F IN
TERN
ATIO
NA
L IM
MIG
RAN
TS
SHA
RE O
VER
TO
TAL
POPU
LATI
ON
INTR
A-R
EGIO
NA
L IM
MIG
RAN
TS
INTR
A-C
ON
TIN
ENTA
L IM
MIG
RAN
TS
INTE
R-CO
NTI
NEN
TAL
IMM
IGRA
NTS
OTH
ER IM
MIG
RAN
TS
Share in stock of international immigrants Share in stock of international immigrants
Thousands Percentage Thousands Percentage
Melanesia 97 2 9 33 50 8 115 1 8 22 61 9
Fiji 13 2 12 33 43 12 14 2 12 33 42 13
New Caledonia 44 23 8 23 63 6 64 24 8 13 69 9
Papua New Guinea 34 1 2 50 43 5 31 0 1 36 59 4
Solomon Islands 4 1 58 12 23 7 3 0 40 14 24 22
Vanuatu 2 1 17 26 16 41 3 1 21 30 20 29
Micronesia 119 26 13 3 79 6 115 22 18 2 74 6
Guam 72 49 12 0 84 4 76 47 19 0 78 3
Kiribati 2 3 44 31 3 21 3 3 50 32 2 16
Marshall Islands 1 3 16 4 69 12 3 6 16 4 70 11
Micronesia (Federated States of)
3 3 16 3 15 66 3 3 16 4 15 65
Nauru 3 26 42 29 21 8 4 33 27 18 26 29
Northern Mariana Islands 32 58 9 4 83 4 22 39 8 3 84 4
Palau 5 28 9 5 81 4 5 23 13 5 79 3
Polynesia 65 11 31 14 44 11 72 11 28 17 42 13
American Samoa 23 44 75 1 20 3 24 42 73 4 20 2
Cook Islands 3 14 3 91 3 3 4 24 4 75 4 18
French Polynesia 28 13 0 8 78 13 30 11 0 8 79 13
Niue 0 22 34 49 3 14 1 34 39 42 4 15
Samoa 5 3 38 43 13 6 5 3 38 42 12 9
Tokelau 0 18 50 41 0 9 0 39 48 45 0 8
Tonga 3 3 6 13 10 72 5 5 6 13 10 72
Tuvalu 0 3 6 56 13 25 0 1 11 55 12 21
Wallis and Futuna Islands 2 12 1 68 29 2 3 24 2 71 25 3
* Data for Sudan in 1995 includes immigrants in what is today South Sudan.
TABLE A2 (CONTINUED)
| 136 |

TABLE A3 DATA USED TO CONSTRUCT THE COUNTRY PROFILE TYPOLOGY BASED ON DRIVERS OF RURAL MIGRATION IN 2015
COUNTRY/TERRITORY
Composite Human Development Index Rural youth density on agricultural land
1995 2015 1995 2015
Value Rural youth per thousand hectares of agricultural land
DEVELOPING REGIONS
AFRICA 116 166
Sub-Saharan Africa 110 163
Eastern Africa 169 243
Burundi 0.27 0.40 638 1 331
Comoros .. 0.50 742 1 174
Djibouti 0.35 0.47 29 36
Eritrea .. 0.42 84 198
Ethiopia .. 0.45 424 638
Kenya 0.46 0.55 234 373
Madagascar .. 0.51 75 107
Malawi 0.38 0.48 547 726
Mauritius 0.65 0.78 1 777 2 026
Mayotte .. .. .. 2 590
Mozambique 0.23 0.42 64 100
Réunion .. .. .. ..
Rwanda 0.23 0.50 1 032 1 386
Seychelles .. 0.78 2 734 5 723
Somalia .. .. 31 42
South Sudan .. 0.42 .. 96
Uganda 0.32 0.49 401 640
United Republic of Tanzania 0.37 0.53 196 234
Zambia 0.41 0.58 76 110
Zimbabwe 0.47 0.52 163 187
Middle Africa 90 130
Angola .. 0.53 47 57
Cameroon 0.44 0.52 219 307
Central African Republic 0.31 0.35 112 162
Chad .. 0.40 29 59
Congo 0.49 0.59 33 40
Democratic Republic of the Congo 0.33 0.44 286 410
Equatorial Guinea .. 0.59 231 477
Gabon 0.63 0.70 13 12
Sao Tome and Principe 0.47 0.57 413 402
North Africa 99 161
Algeria 0.60 0.74 95 72
Egypt 0.58 0.69 2 961 3 361
Libya 0.71 0.72 23 24
Morocco 0.49 0.65 121 114
Sudan 0.37 0.49 34 109
Tunisia 0.61 0.72 107 92
| 137 |

TABLE A3 (CONTINUED)
COUNTRY/TERRITORY
Composite Human Development Index Rural youth density on agricultural land
1995 2015 1995 2015
Value Rural youth per thousand hectares of agricultural land
Southern Africa 40 40
Botswana 0.58 0.70 9 10
Eswatini 0.54 0.54 160 272
Lesotho 0.48 0.50 181 216
Namibia 0.59 0.64 9 10
South Africa 0.65 0.67 56 53
Western Africa 140 170
Benin 0.37 0.49 402 446
Burkina Faso .. 0.40 242 287
Cabo Verde .. 0.65 759 690
Côte d'Ivoire 0.39 0.47 113 131
Gambia 0.35 0.45 295 361
Ghana 0.47 0.58 215 221
Guinea 0.29 0.41 101 146
Guinea-Bissau .. 0.42 132 158
Liberia .. 0.43 121 224
Mali 0.25 0.44 55 62
Mauritania 0.42 0.51 9 11
Niger 0.23 0.35 54 83
Nigeria .. 0.53 287 359
Saint Helena, Ascension and Tristan da Cunha .. .. .. ..
Senegal 0.37 0.49 164 266
Sierra Leone 0.27 0.42 257 266
Togo 0.41 0.49 252 304
ASIA 376 349
Central Asia 27 38
Kazakhstan 0.67 0.79 8 9
Kyrgyzstan 0.56 0.66 73 101
Tajikistan 0.54 0.63 233 389
Turkmenistan .. 0.69 19 23
Uzbekistan 0.00 0.70 136 207
East Asia 382 222
China 0.55 0.74 461 263
Democratic People's Republic of Korea .. .. 974 860
Mongolia 0.55 0.73 2 2
Republic of Korea 0.78 0.90 1 381 993
Southeast Asia 862 648
Brunei Darussalam 0.81 0.86 2 779 1 791
Cambodia 0.38 0.56 452 661
Indonesia 0.56 0.69 878 531
Lao People's Democratic Republic 0.43 0.59 632 546
| 138 |

TABLE A3 (CONTINUED)
COUNTRY/TERRITORY
Composite Human Development Index Rural youth density on agricultural land
1995 2015 1995 2015
Value Rural youth per thousand hectares of agricultural land
Malaysia 0.68 0.79 346 293
Myanmar 0.39 0.56 926 749
Philippines 0.60 0.68 939 1 253
Singapore 0.77 0.92 .. ..
Thailand 0.61 0.74 559 308
Timor-Leste .. 0.61 522 575
Viet Nam 0.53 0.68 2 308 1 358
South Asia 773 1 007
Afghanistan 0.32 0.48 96 176
Bangladesh 0.42 0.58 2 840 3 272
Bhutan .. 0.61 195 275
India 0.46 0.62 1 055 1 292
Iran (Islamic Republic of) 0.63 0.77 105 128
Maldives 0.52 0.70 6 151 7 986
Nepal 0.41 0.56 1 233 1 627
Pakistan 0.43 0.55 605 906
Sri Lanka 0.65 0.77 1 787 1 430
Western Asia 61 75
Armenia 0.60 0.74 189 158
Azerbaijan 0.61 0.76 213 247
Bahrain 0.78 0.82 2 033 4 605
Cyprus 0.78 0.86 460 758
Georgia .. 0.77 167 159
Iraq 0.55 0.65 202 326
Israel 0.82 0.90 207 260
Jordan 0.69 0.74 272 324
Kuwait 0.75 0.80 62 81
Lebanon .. 0.76 213 272
Palestine .. 0.68 559 1 134
Oman .. 0.80 147 196
Qatar 0.78 0.86 99 88
Saudi Arabia 0.72 0.85 6 7
Syrian Arab Republic 0.58 0.54 152 184
Turkey 0.60 0.77 153 128
United Arab Emirates 0.76 0.84 396 910
Yemen 0.42 0.48 119 219
LATIN AMERICA AND THE CARIBBEAN 53 45
Caribbean 331 285
Anguilla .. .. .. ..
Antigua and Barbuda .. 0.79 1 434 1 904
Aruba .. .. 4 438 5 912
| 139 |

COUNTRY/TERRITORY
Composite Human Development Index Rural youth density on agricultural land
1995 2015 1995 2015
Value Rural youth per thousand hectares of agricultural land
Bahamas .. 0.79 1 224 1 188
Barbados 0.73 0.79 2 344 2 703
British Virgin Islands .. .. .. ..
Caribbean Netherlands .. .. .. ..
Cayman Islands .. .. .. ..
Cuba 0.65 0.77 115 83
Curaçao .. .. .. ..
Dominica .. 0.73 .. ..
Dominican Republic 0.63 0.72 362 253
Grenada .. .. 1 505 2 537
Guadeloupe 0.42 0.49 .. 25
Haiti 0.42 0.49 848 690
Jamaica 0.67 0.73 703 791
Martinique .. .. .. 231
Montserrat .. 0.00 .. ..
Puerto Rico .. 0.00 181 266
Saint Kitts and Nevis .. 0.77 .. ..
Saint Lucia .. 0.74 1 549 3 727
Saint Pierre and Miquelon .. 0.72 .. ..
Saint Vincent and the Grenadines .. 0.00 1 487 1 396
Sint Maarten (Dutch part) .. .. .. ..
Trinidad and Tobago 0.68 0.78 3 849 5 025
Turks and Caicos Islands .. .. .. ..
United States Virgin Islands .. .. 653 222
Central America 126 101
Belize 0.66 0.71 197 359
Costa Rica 0.68 0.78 203 160
El Salvador 0.51 0.64 353 613
Guatemala 0.53 0.62 262 355
Honduras 0.58 0.68 475 381
Mexico 0.67 0.76 73 66
Nicaragua 0.52 0.65 133 151
Panama 0.69 0.79 155 145
South America 37 29
Argentina 0.73 0.83 8 5
Bolivia (Plurinational State of) 0.57 0.67 23 26
Brazil 0.65 0.75 40 26
Chile 0.73 0.85 37 28
Colombia 0.63 0.73 73 65
Ecuador 0.66 0.74 172 271
TABLE A3 (CONTINUED)
| 140 |

TABLE A3 (CONTINUED)
COUNTRY/TERRITORY
Composite Human Development Index Rural youth density on agricultural land
1995 2015 1995 2015
Value Rural youth per thousand hectares of agricultural land
French Guyana .. .. .. 307
Guyana 0.58 0.64 91 93
Paraguay 0.61 0.69 38 37
Peru 0.64 0.74 92 72
Suriname .. 0.72 455 538
Uruguay 0.71 0.79 5 2
Venezuela (Bolivarian Republic of) 0.66 0.77 39 42
OCEANIA 773 999
Melanesia 794 1 023
Fiji 0.67 0.74 265 244
New Caledonia .. .. 92 100
Papua New Guinea 0.40 0.52 1 288 1 550
Solomon Islands .. 0.51 1 217 1 137
Vanuatu .. 0.60 215 282
Micronesia 464 622
Guam .. .. 152 122
Kiribati .. 0.59 345 497
Marshall Islands .. .. .. ..
Micronesia (Federated States of) .. 0.64 938 1 223
Nauru .. .. .. ..
Northern Mariana Islands .. .. .. ..
Palau .. .. .. ..
Polynesia 664 814
American Samoa .. .. .. ..
Cook Islands .. .. .. ..
French Polynesia .. .. 602 677
Niue .. .. .. ..
Samoa 0.62 0.70 741 1 147
Tokelau .. .. .. ..
Tonga 0.67 0.72 627 650
Tuvalu .. .. .. ..
Wallis and Futuna Islands .. .. .. ..
| 141 |

TABLE A3 (CONTINUED)
COUNTRY/TERRITORY
Composite Human Development Index Rural youth density on agricultural land
1995 2015 1995 2015
Value Rural youth per thousand hectares of agricultural land
DEVELOPED REGIONS
EUROPE 94 76
Eastern Europe 67 55
Belarus 0.66 0.80 72 48
Bulgaria 0.70 0.79 94 62
Czechia 0.79 0.88 142 117
Hungary 0.74 0.84 130 98
Poland 0.74 0.86 176 203
Republic of Moldova 0.59 0.70 202 189
Romania 0.69 0.80 178 132
Russian Federation 0.70 0.80 38 33
Slovakia 0.75 0.84 231 267
Ukraine 0.66 0.74 87 62
Northern Europe 111 91
Channel Islands .. .. 2 546 2 137
Denmark 0.83 0.92 61 52
Estonia 0.72 0.87 87 74
Faroe Islands .. .. .. ..
Finland 0.82 0.89 84 68
Iceland 0.82 0.92 3 2
Ireland 0.79 0.92 89 68
Isle of Man .. .. .. ..
Latvia 0.67 0.83 87 63
Lithuania 0.70 0.85 76 65
Norway 0.88 0.95 218 196
Sweden 0.86 0.91 84 88
United Kingdom of Great Britain and Northern Ireland 0.84 0.91 149 119
Southern Europe 144 121
Albania 0.63 0.76 426 270
Andorra .. 0.86 .. ..
Bosnia and Herzegovina .. 0.75 245 214
Croatia 0.70 0.83 180 203
Gibraltar .. .. .. ..
Greece 0.77 0.87 76 48
Holy See .. .. .. ..
Italy 0.80 0.89 259 214
Malta 0.76 0.86 662 386
Montenegro .. 0.81 .. 198
| 142 |

TABLE A3 (CONTINUED)
COUNTRY/TERRITORY
Composite Human Development Index Rural youth density on agricultural land
1995 2015 1995 2015
Value Rural youth per thousand hectares of agricultural land
Portugal 0.76 0.84 298 171
San Marino .. .. .. ..
Serbia 0.69 0.78 171 218
Slovenia 0.78 0.89 406 275
Spain 0.80 0.88 79 54
The former Yugoslav Republic of Macedonia .. 0.75 147 155
Western Europe 169 135
Austria 0.82 0.89 195 197
Belgium 0.85 0.90 .. 32
France 0.83 0.90 100 79
Germany 0.83 0.93 246 209
Liechtenstein .. .. .. ..
Luxembourg .. 0.91 109 78
Monaco 0.81 0.90 .. ..
Netherlands 0.86 0.92 457 159
Switzerland 0.85 0.94 234 257
NORTH AMERICA 29 29
Bermuda .. .. .. ..
Canada 0.86 0.92 20 21
Greenland .. .. .. ..
Saint Pierre and Miquelon .. 0.72 .. ..
United States of America 0.88 0.92 30 31
OTHER ASIAN COUNTRIES, AUSTRALIA AND NEW ZEALAND 14 5
Australia 0.89 0.94 1 1
Japan 0.84 0.90 1 131 272
New Zealand 0.85 0.91 8 12
| 143 |
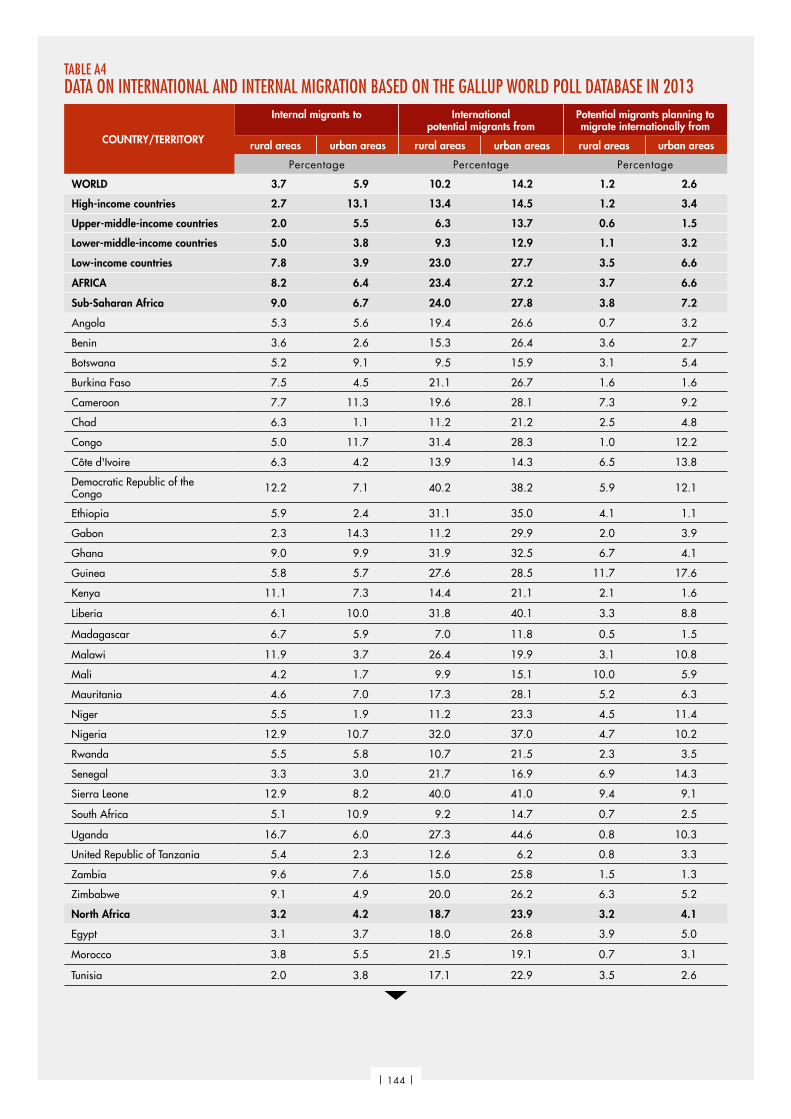
TABLE A4 DATA ON INTERNATIONAL AND INTERNAL MIGRATION BASED ON THE GALLUP WORLD POLL DATABASE IN 2013
COUNTRY/TERRITORY
Internal migrants to International potential migrants from
Potential migrants planning to migrate internationally from
rural areas urban areas rural areas urban areas rural areas urban areas
Percentage Percentage Percentage
WORLD 3.7 5.9 10.2 14.2 1.2 2.6
High-income countries 2.7 13.1 13.4 14.5 1.2 3.4
Upper-middle-income countries 2.0 5.5 6.3 13.7 0.6 1.5
Lower-middle-income countries 5.0 3.8 9.3 12.9 1.1 3.2
Low-income countries 7.8 3.9 23.0 27.7 3.5 6.6
AFRICA 8.2 6.4 23.4 27.2 3.7 6.6
Sub-Saharan Africa 9.0 6.7 24.0 27.8 3.8 7.2
Angola 5.3 5.6 19.4 26.6 0.7 3.2
Benin 3.6 2.6 15.3 26.4 3.6 2.7
Botswana 5.2 9.1 9.5 15.9 3.1 5.4
Burkina Faso 7.5 4.5 21.1 26.7 1.6 1.6
Cameroon 7.7 11.3 19.6 28.1 7.3 9.2
Chad 6.3 1.1 11.2 21.2 2.5 4.8
Congo 5.0 11.7 31.4 28.3 1.0 12.2
Côte d'Ivoire 6.3 4.2 13.9 14.3 6.5 13.8
Democratic Republic of the Congo 12.2 7.1 40.2 38.2 5.9 12.1
Ethiopia 5.9 2.4 31.1 35.0 4.1 1.1
Gabon 2.3 14.3 11.2 29.9 2.0 3.9
Ghana 9.0 9.9 31.9 32.5 6.7 4.1
Guinea 5.8 5.7 27.6 28.5 11.7 17.6
Kenya 11.1 7.3 14.4 21.1 2.1 1.6
Liberia 6.1 10.0 31.8 40.1 3.3 8.8
Madagascar 6.7 5.9 7.0 11.8 0.5 1.5
Malawi 11.9 3.7 26.4 19.9 3.1 10.8
Mali 4.2 1.7 9.9 15.1 10.0 5.9
Mauritania 4.6 7.0 17.3 28.1 5.2 6.3
Niger 5.5 1.9 11.2 23.3 4.5 11.4
Nigeria 12.9 10.7 32.0 37.0 4.7 10.2
Rwanda 5.5 5.8 10.7 21.5 2.3 3.5
Senegal 3.3 3.0 21.7 16.9 6.9 14.3
Sierra Leone 12.9 8.2 40.0 41.0 9.4 9.1
South Africa 5.1 10.9 9.2 14.7 0.7 2.5
Uganda 16.7 6.0 27.3 44.6 0.8 10.3
United Republic of Tanzania 5.4 2.3 12.6 6.2 0.8 3.3
Zambia 9.6 7.6 15.0 25.8 1.5 1.3
Zimbabwe 9.1 4.9 20.0 26.2 6.3 5.2
North Africa 3.2 4.2 18.7 23.9 3.2 4.1
Egypt 3.1 3.7 18.0 26.8 3.9 5.0
Morocco 3.8 5.5 21.5 19.1 0.7 3.1
Tunisia 2.0 3.8 17.1 22.9 3.5 2.6
| 144 |
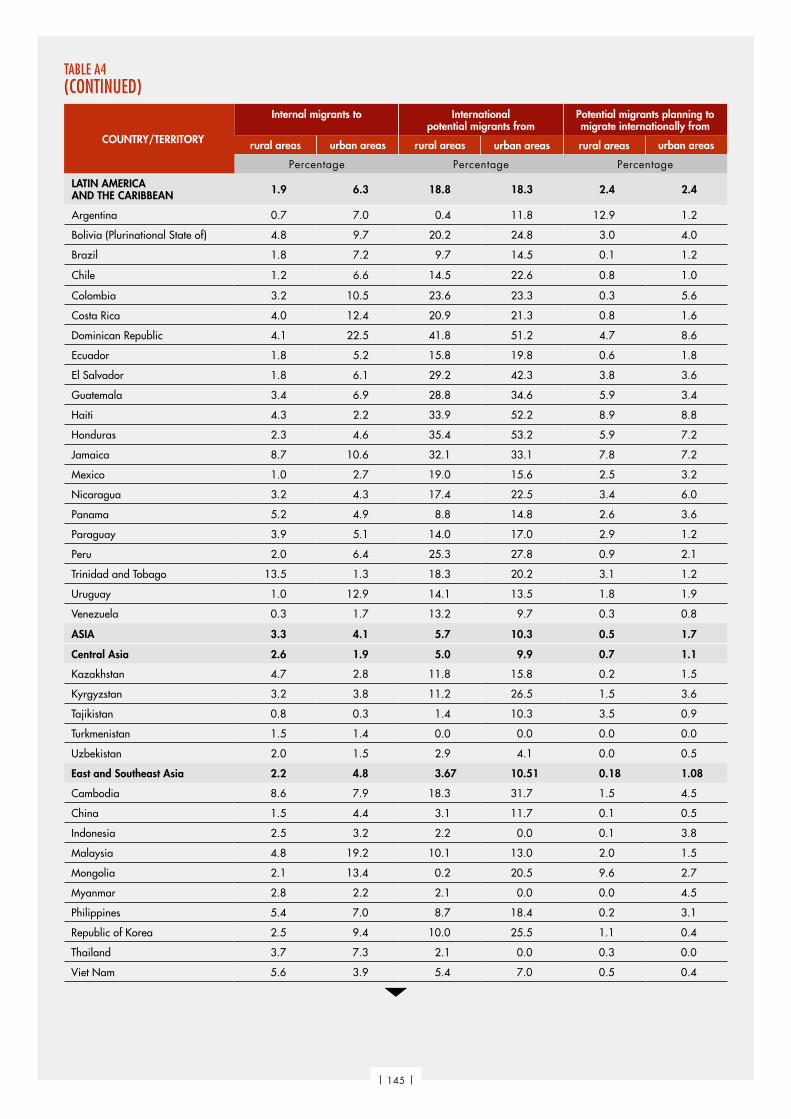
TABLE A4 (CONTINUED)
COUNTRY/TERRITORY
Internal migrants to International potential migrants from
Potential migrants planning to migrate internationally from
rural areas urban areas rural areas urban areas rural areas urban areas
Percentage Percentage Percentage
LATIN AMERICA AND THE CARIBBEAN 1.9 6.3 18.8 18.3 2.4 2.4
Argentina 0.7 7.0 0.4 11.8 12.9 1.2
Bolivia (Plurinational State of) 4.8 9.7 20.2 24.8 3.0 4.0
Brazil 1.8 7.2 9.7 14.5 0.1 1.2
Chile 1.2 6.6 14.5 22.6 0.8 1.0
Colombia 3.2 10.5 23.6 23.3 0.3 5.6
Costa Rica 4.0 12.4 20.9 21.3 0.8 1.6
Dominican Republic 4.1 22.5 41.8 51.2 4.7 8.6
Ecuador 1.8 5.2 15.8 19.8 0.6 1.8
El Salvador 1.8 6.1 29.2 42.3 3.8 3.6
Guatemala 3.4 6.9 28.8 34.6 5.9 3.4
Haiti 4.3 2.2 33.9 52.2 8.9 8.8
Honduras 2.3 4.6 35.4 53.2 5.9 7.2
Jamaica 8.7 10.6 32.1 33.1 7.8 7.2
Mexico 1.0 2.7 19.0 15.6 2.5 3.2
Nicaragua 3.2 4.3 17.4 22.5 3.4 6.0
Panama 5.2 4.9 8.8 14.8 2.6 3.6
Paraguay 3.9 5.1 14.0 17.0 2.9 1.2
Peru 2.0 6.4 25.3 27.8 0.9 2.1
Trinidad and Tobago 13.5 1.3 18.3 20.2 3.1 1.2
Uruguay 1.0 12.9 14.1 13.5 1.8 1.9
Venezuela 0.3 1.7 13.2 9.7 0.3 0.8
ASIA 3.3 4.1 5.7 10.3 0.5 1.7
Central Asia 2.6 1.9 5.0 9.9 0.7 1.1
Kazakhstan 4.7 2.8 11.8 15.8 0.2 1.5
Kyrgyzstan 3.2 3.8 11.2 26.5 1.5 3.6
Tajikistan 0.8 0.3 1.4 10.3 3.5 0.9
Turkmenistan 1.5 1.4 0.0 0.0 0.0 0.0
Uzbekistan 2.0 1.5 2.9 4.1 0.0 0.5
East and Southeast Asia 2.2 4.8 3.67 10.51 0.18 1.08
Cambodia 8.6 7.9 18.3 31.7 1.5 4.5
China 1.5 4.4 3.1 11.7 0.1 0.5
Indonesia 2.5 3.2 2.2 0.0 0.1 3.8
Malaysia 4.8 19.2 10.1 13.0 2.0 1.5
Mongolia 2.1 13.4 0.2 20.5 9.6 2.7
Myanmar 2.8 2.2 2.1 0.0 0.0 4.5
Philippines 5.4 7.0 8.7 18.4 0.2 3.1
Republic of Korea 2.5 9.4 10.0 25.5 1.1 0.4
Thailand 3.7 7.3 2.1 0.0 0.3 0.0
Viet Nam 5.6 3.9 5.4 7.0 0.5 0.4
| 145 |

TABLE A4 (CONTINUED)
COUNTRY/TERRITORY
Internal migrants to International potential migrants from
Potential migrants planning to migrate internationally from
rural areas urban areas rural areas urban areas rural areas urban areas
Percentage Percentage Percentage
South Asia 4.5 2.6 6.9 8.1 0.7 1.9
Afghanistan 4.9 2.4 17.3 30.1 2.7 1.0
Bangladesh 3.4 7.4 17.4 28.4 1.6 4.0
India 5.1 1.6 5.0 3.1 0.4 1.3
Iran (Islamic Republic of) 3.0 9.4 19.1 18.9 4.2 4.7
Nepal 7.1 2.7 10.3 13.6 0.3 1.7
Pakistan 1.2 2.7 5.9 10.1 0.6 1.2
Sri Lanka 5.3 2.1 10.7 15.4 1.0 3.4
West Asia 3.6 9.9 15.5 17.0 3.2 5.5
Armenia 1.4 4.7 34.8 45.1 4.8 7.4
Azerbaijan 3.6 5.0 21.1 18.9 2.1 2.5
Bahrain 3.5 21.9 17.5 18.7 6.5 4.3
Cyprus 1.1 3.3 30.5 28.7 5.1 3.2
Georgia 3.1 4.1 14.6 18.1 0.5 0.9
Iraq 7.2 17.5 11.3 15.6 11.0 15.0
Israel 0.9 14.1 10.7 13.8 0.9 0.6
Jordan 0.5 4.9 27.6 24.1 2.6 6.1
Kuwait 0.0 18.0 0.0 24.0 0.0 5.9
Lebanon 0.3 5.8 24.2 24.5 6.8 8.1
Palestine 1.1 3.6 11.0 16.7 5.6 3.8
Saudi Arabia 3.3 15.2 6.2 14.6 1.4 9.3
Syrian Arab Republic 10.0 15.2 41.1 45.7 3.7 7.7
Turkey 1.7 4.0 5.8 8.5 0.2 0.7
United Arab Emirates 4.1 23.6 13.4 10.0 1.7 4.9
Yemen 3.0 5.2 14.8 29.3 2.5 2.5
NORTH AMERICA 4.1 20.9 8.4 12.4 0.2 0.9
Canada 3.4 11.9 9.6 10.3 0.7 1.0
United States of America 4.2 21.9 8.3 12.6 0.1 0.9
EUROPE 2.3 7.3 18.1 19.5 1.6 1.6
Belarus 1.0 3.9 15.7 21.2 0.9 0.5
Albania 2.2 3.3 45.6 35.1 3.1 4.5
Austria 3.0 7.5 8.3 8.7 1.2 1.3
Belgium 0.3 17.2 18.3 17.0 2.1 0.6
Bosnia and Herzegovina 2.2 0.9 23.9 36.0 0.8 2.1
Bulgaria 1.2 3.7 17.5 27.9 2.3 5.5
Croatia 1.7 1.9 18.2 15.4 1.6 1.7
Czechia 2.9 5.9 12.4 14.7 0.8 0.4
Denmark 2.3 26.1 12.9 14.0 0.5 0.7
Estonia 3.3 6.2 18.9 24.6 1.6 2.7
Finland 3.1 21.5 12.8 14.4 0.2 1.3
| 146 |
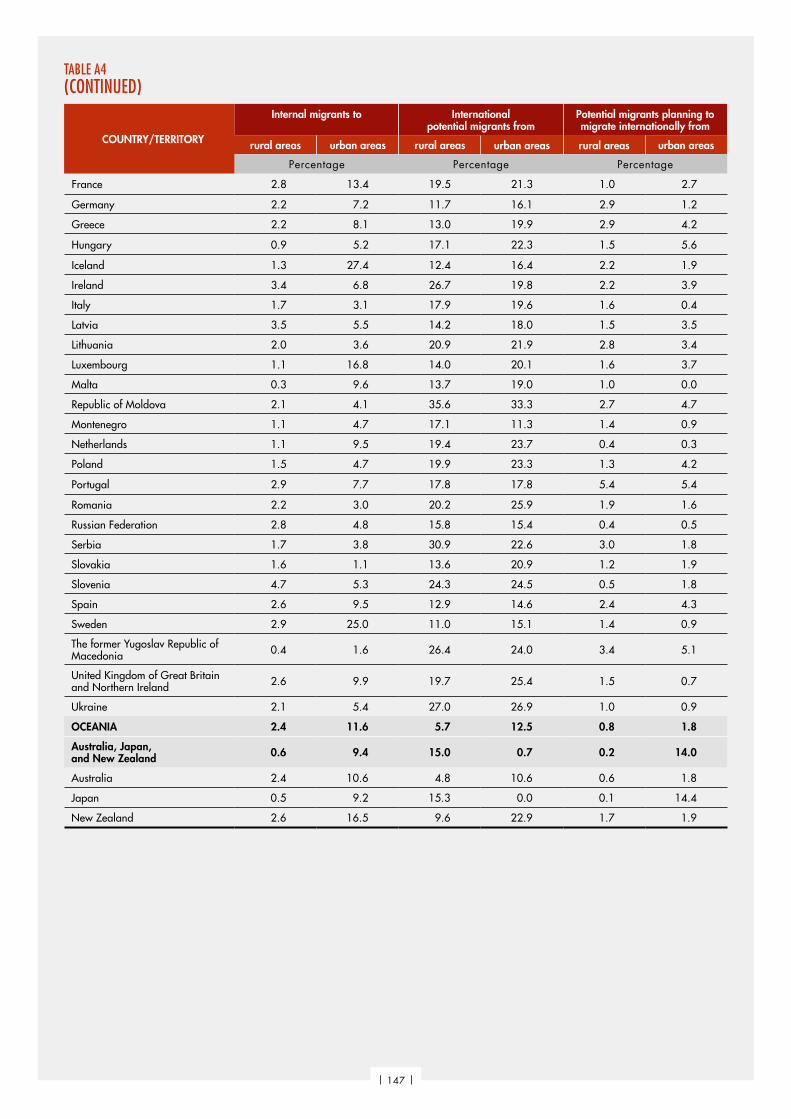
COUNTRY/TERRITORY
Internal migrants to International potential migrants from
Potential migrants planning to migrate internationally from
rural areas urban areas rural areas urban areas rural areas urban areas
Percentage Percentage Percentage
France 2.8 13.4 19.5 21.3 1.0 2.7
Germany 2.2 7.2 11.7 16.1 2.9 1.2
Greece 2.2 8.1 13.0 19.9 2.9 4.2
Hungary 0.9 5.2 17.1 22.3 1.5 5.6
Iceland 1.3 27.4 12.4 16.4 2.2 1.9
Ireland 3.4 6.8 26.7 19.8 2.2 3.9
Italy 1.7 3.1 17.9 19.6 1.6 0.4
Latvia 3.5 5.5 14.2 18.0 1.5 3.5
Lithuania 2.0 3.6 20.9 21.9 2.8 3.4
Luxembourg 1.1 16.8 14.0 20.1 1.6 3.7
Malta 0.3 9.6 13.7 19.0 1.0 0.0
Republic of Moldova 2.1 4.1 35.6 33.3 2.7 4.7
Montenegro 1.1 4.7 17.1 11.3 1.4 0.9
Netherlands 1.1 9.5 19.4 23.7 0.4 0.3
Poland 1.5 4.7 19.9 23.3 1.3 4.2
Portugal 2.9 7.7 17.8 17.8 5.4 5.4
Romania 2.2 3.0 20.2 25.9 1.9 1.6
Russian Federation 2.8 4.8 15.8 15.4 0.4 0.5
Serbia 1.7 3.8 30.9 22.6 3.0 1.8
Slovakia 1.6 1.1 13.6 20.9 1.2 1.9
Slovenia 4.7 5.3 24.3 24.5 0.5 1.8
Spain 2.6 9.5 12.9 14.6 2.4 4.3
Sweden 2.9 25.0 11.0 15.1 1.4 0.9
The former Yugoslav Republic of Macedonia 0.4 1.6 26.4 24.0 3.4 5.1
United Kingdom of Great Britain and Northern Ireland 2.6 9.9 19.7 25.4 1.5 0.7
Ukraine 2.1 5.4 27.0 26.9 1.0 0.9
OCEANIA 2.4 11.6 5.7 12.5 0.8 1.8
Australia, Japan, and New Zealand 0.6 9.4 15.0 0.7 0.2 14.0
Australia 2.4 10.6 4.8 10.6 0.6 1.8
Japan 0.5 9.2 15.3 0.0 0.1 14.4
New Zealand 2.6 16.5 9.6 22.9 1.7 1.9
TABLE A4 (CONTINUED)
| 147 |

TABLE A5LINKS BETWEEN INTERNAL AND INTERNATIONAL MIGRATION BASED ON THE GALLUP WORLD POLL DATABASE IN 2013
COUNTRY/TERRITORY
Total internal migrants Total non-migrants Rural internal migrants Urban internal migrants
planning to migrate internationally
Percentage
WORLD 3.9 1.2 3.5 4.2
High-income countries 3.0 2.0 4.1 2.7
Upper-middle-income countries 3.4 0.8 2.5 3.7
Lower-middle-income countries 3.6 1.3 2.7 4.8
Low-income countries 10.0 1.8 7.1 15.7
AFRICA 8.2 2.8 6.5 10.5
Sub-Saharan Africa 7.5 2.9 6.5 8.8
Angola 5.6 1.0 2.1 9.0
Benin 2.0 1.4 3.5 0.0
Botswana 6.9 3.2 9.5 5.4
Burkina Faso 4.3 0.5 5.8 1.7
Cameroon 8.0 5.4 5.6 9.7
Chad 3.3 1.2 2.7 6.7
Congo 13.0 7.1 4.1 16.8
Côte d'Ivoire 22.9 6.5 9.9 42.5
Democratic Republic of the Congo 13.8 5.3 10.9 18.8
Ethiopia 15.7 0.5 4.8 42.6
Gabon 5.2 3.2 4.5 5.3
Ghana 12.0 1.8 14.4 9.9
Guinea 30.4 5.3 27.4 33.5
Kenya 4.2 0.4 4.2 4.1
Liberia 9.5 3.8 4.3 12.7
Madagascar 1.2 0.6 2.3 0.0
Malawi 6.0 2.1 5.7 6.8
Mali 21.6 2.4 21.0 23.1
Mauritania 15.1 3.0 11.3 17.5
Niger 8.2 2.5 11.0 0.0
Nigeria 4.1 6.9 5.7 2.1
Rwanda 7.6 1.1 15.5 0.0
Senegal 14.5 6.4 17.7 11.0
Sierra Leone 9.8 5.3 11.6 6.9
South Africa 2.8 1.4 0.9 3.7
Uganda 10.3 0.5 5.2 24.7
United Republic of Tanzania 0.0 0.0 0.0 0.0
Zambia 1.7 0.8 3.0 0.0
Zimbabwe 8.2 2.1 8.9 7.0
North Africa 18.5 1.9 5.3 28.6
Egypt 21.1 2.0 7.8 32.2
Morocco 13.4 1.6 0.0 22.8
Tunisia 21.3 1.7 7.7 28.5
| 148 |

TABLE A5 (CONTINUED)
COUNTRY/TERRITORY
Total internal migrants Total non-migrants Rural internal migrants Urban internal migrants
planning to migrate internationally
Percentage
LATIN AMERICA AND THE CARIBBEAN 5.9 1.6 5.1 6.1
Argentina 7.6 0.8 17.3 6.6
Bolivia (Plurinational State of) 11.5 1.8 8.4 13.1
Brazil 3.1 0.9 0.0 3.9
Chile 1.5 0.9 3.9 1.0
Colombia 8.9 3.9 6.0 9.8
Costa Rica 2.6 4.1 2.1 2.8
Dominican Republic 7.5 7.1 8.9 7.3
Ecuador 4.2 1.0 5.2 3.8
El Salvador 5.8 2.3 8.6 5.0
Guatemala 4.1 2.0 8.4 2.0
Haiti 20.7 5.2 20.3 21.4
Honduras 15.5 3.4 8.3 19.2
Jamaica 10.5 4.4 13.5 8.0
Mexico 6.9 1.8 7.0 6.9
Nicaragua 5.2 3.7 5.4 5.1
Panama 3.9 3.1 7.7 0.0
Paraguay 2.2 0.9 5.2 0.0
Peru 8.8 1.0 0.0 11.6
Trinidad and Tobago 6.5 0.4 6.4 7.9
Uruguay 5.3 1.3 4.1 5.4
Venezuela 0.0 0.7 0.0 0.0
ASIA 2.5 0.7 1.7 3.2
Central Asia 1.6 0.4 0.5 3.2
Kazakhstan 0.0 0.9 0.0 0.0
Kyrgyzstan 2.2 1.4 4.8 0.0
Tajikistan 0.0 0.3 0.0 0.0
Turkmenistan 0.0 0.3 0.0 0.0
Uzbekistan 3.7 0.1 0.0 8.8
East and Southeast Asia 1.0 0.5 0.5 1.2
Cambodia 5.7 0.6 4.9 6.5
China 0.7 0.2 0.0 0.9
Indonesia 0.0 2.2 0.0 0.0
Malaysia 1.4 1.4 4.4 0.7
Mongolia 3.5 1.6 0.0 4.1
Myanmar 0.0 0.1 0.0 0.0
Philippines 2.9 1.2 0.0 5.1
Republic of Korea 2.3 0.3 8.2 0.7
Thailand 0.0 0.0 0.0 0.0
Viet Nam 1.3 0.0 0.0 3.2
| 149 |

TABLE A5 (CONTINUED)
COUNTRY/TERRITORY
Total internal migrants Total non-migrants Rural internal migrants Urban internal migrants
planning to migrate internationally
Percentage
South Asia 2.1 0.6 1.4 3.3
Afghanistan 2.0 0.4 3.0 0.0
Bangladesh 2.8 1.3 3.4 2.5
India 0.8 0.5 1.0 0.0
Iran (Islamic Republic of) 9.9 3.0 9.7 10.0
Nepal 1.7 0.2 0.4 5.0
Pakistan 5.5 0.3 0.0 8.1
Sri Lanka 3.5 0.6 2.5 5.9
West Asia 10.9 3.3 10.1 11.2
Armenia 14.6 4.2 12.8 15.1
Azerbaijan 10.2 1.3 18.2 4.4
Bahrain 6.3 3.5 5.6 6.4
Cyprus 29.9 1.1 19.1 33.4
Georgia 5.9 0.5 5.6 6.2
Iraq 20.7 9.5 15.5 22.8
Israel 1.0 0.6 4.3 0.8
Jordan 23.6 4.0 0.0 26.2
Kuwait 8.4 5.3 0.0 8.4
Lebanon 16.4 6.6 30.6 15.7
Palestine 15.2 2.6 20.8 13.4
Saudi Arabia 13.9 6.6 2.1 16.4
Syrian Arab Republic 8.5 5.2 13.1 5.5
Turkey 0.0 0.5 0.0 0.0
United Arab Emirates 4.0 4.7 0.0 4.7
Yemen 4.8 1.0 13.1 0.0
NORTH AMERICA 1.4 4.0 0.1 1.6
Canada 0.3 0.9 1.4 0.0
United States of America 1.4 4.3 0.0 1.7
EUROPE 4.5 1.0 6.9 3.8
Belarus 0.5 0.4 2.3 0.0
Albania 13.8 3.3 17.7 11.2
Austria 2.0 1.1 2.7 1.7
Belgium 2.7 0.2 3.2 2.7
Bosnia and Herzegovina 0.0 0.9 0.0 0.0
Bulgaria 12.6 3.8 10.7 13.3
Croatia 3.4 1.1 7.2 0.0
Czechia 1.3 0.4 3.9 0.0
Denmark 1.2 0.5 2.6 1.1
Estonia 1.0 2.0 0.9 1.1
Finland 2.8 0.6 0.0 3.2
France 7.8 2.3 35.2 2.0
Germany 0.6 1.0 2.7 0.0
Greece 1.8 3.6 1.8 1.8
| 150 |
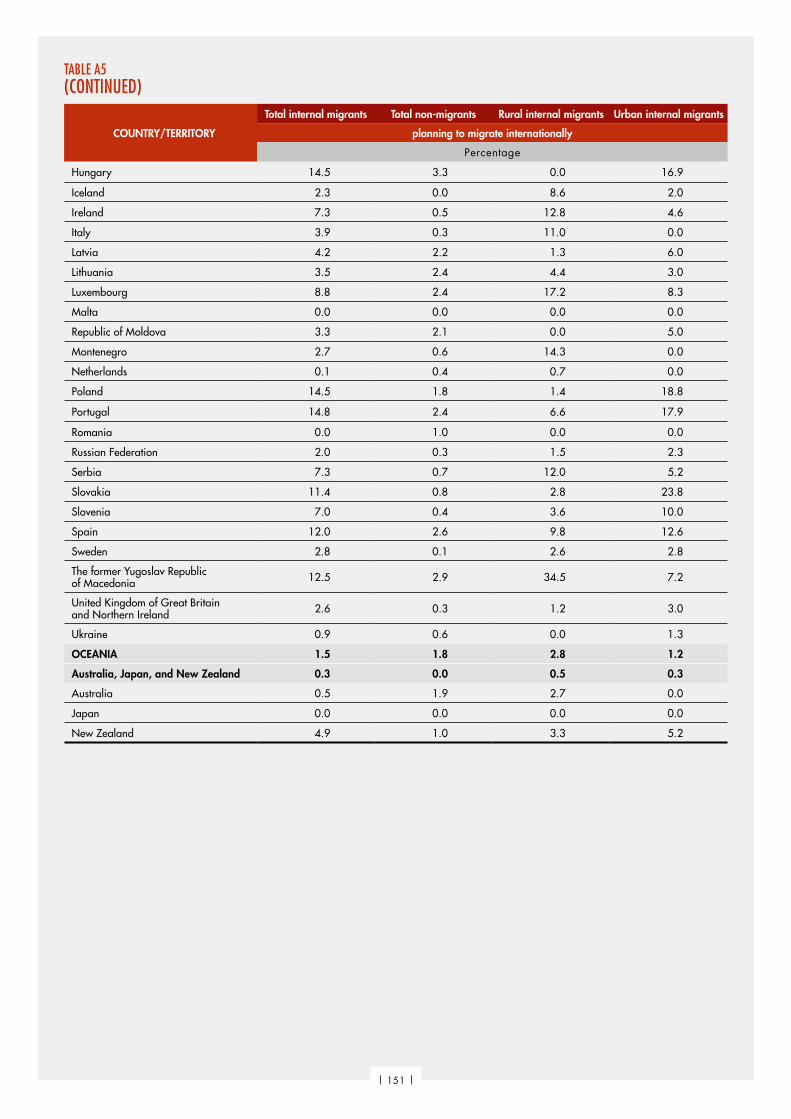
COUNTRY/TERRITORY
Total internal migrants Total non-migrants Rural internal migrants Urban internal migrants
planning to migrate internationally
Percentage
Hungary 14.5 3.3 0.0 16.9
Iceland 2.3 0.0 8.6 2.0
Ireland 7.3 0.5 12.8 4.6
Italy 3.9 0.3 11.0 0.0
Latvia 4.2 2.2 1.3 6.0
Lithuania 3.5 2.4 4.4 3.0
Luxembourg 8.8 2.4 17.2 8.3
Malta 0.0 0.0 0.0 0.0
Republic of Moldova 3.3 2.1 0.0 5.0
Montenegro 2.7 0.6 14.3 0.0
Netherlands 0.1 0.4 0.7 0.0
Poland 14.5 1.8 1.4 18.8
Portugal 14.8 2.4 6.6 17.9
Romania 0.0 1.0 0.0 0.0
Russian Federation 2.0 0.3 1.5 2.3
Serbia 7.3 0.7 12.0 5.2
Slovakia 11.4 0.8 2.8 23.8
Slovenia 7.0 0.4 3.6 10.0
Spain 12.0 2.6 9.8 12.6
Sweden 2.8 0.1 2.6 2.8
The former Yugoslav Republic of Macedonia 12.5 2.9 34.5 7.2
United Kingdom of Great Britain and Northern Ireland 2.6 0.3 1.2 3.0
Ukraine 0.9 0.6 0.0 1.3
OCEANIA 1.5 1.8 2.8 1.2
Australia, Japan, and New Zealand 0.3 0.0 0.5 0.3
Australia 0.5 1.9 2.7 0.0
Japan 0.0 0.0 0.0 0.0
New Zealand 4.9 1.0 3.3 5.2
TABLE A5 (CONTINUED)
| 151 |

TABLE A6STOCKS AND SHARES OF REFUGEES IN RECEIVING COUNTRIES IN 2015 AND 2016
COUNTRY/TERRITORY OF RESIDENCE
Stock of refugees Share of refugees in total population
Share of refugees in total
immigrant stock
Refugee distribution by locality type
Rural Urban Unknown
2015 2016
Thousands Refugee per 1 000 people
Percentage Shares over total number of refugees
GLOBAL 25 302 3.4 10.2 33 50 18
DEVELOPING REGIONS 21 674 3.5 20.2 39 52 10
AFRICA 6 623 5.5 28.3 78 15 7
Sub-Saharan Africa 6 016 6.0 27.7 84 10 6
Eastern Africa 2 805 7.0 40.5 90 10 0
Burundi 48 4.7 16.5 62 38 0
Comoros 0 0.0 0.0 0 0 0
Djibouti 22 23.7 19.6 85 15 0
Eritrea 3 0.6 18.2 96 1 3
Ethiopia 739 7.4 63.6 87 13 0
Kenya 551 11.7 50.8 90 10 0
Madagascar 0 0.0 0.1 0 100 0
Malawi 23 1.3 10.1 100 0 0
Mauritius 0 0.0 0.0 0 0 0
Mayotte 0 0.0 0.0 0 0 0
Mozambique 20 0.7 8.6 57 43 0
Réunion 0 0.0 0.0 0 0 0
Rwanda 146 12.6 33.1 80 20 0
Seychelles 0 0.0 0.0 100 0 0
Somalia 18 1.3 44.0 0 100 0
South Sudan 264 22.2 31.3 95 5 0
Uganda 693 17.3 57.9 94 6 0
United Republic of Tanzania 214 4.0 51.8 100 0 0
Zambia 52 3.2 33.6 56 25 19
Zimbabwe 11 0.7 2.6 0 100 0
Middle Africa 1 278 8.3 37.2 77 4 19
Angola 46 1.6 7.2 0 0 100
Cameroon 348 15.3 68.5 94 6 0
Central African Republic 8 1.7 9.4 87 13 0
Chad 422 30.2 81.7 99 1 0
Congo 52 10.4 13.3 72 28 0
Democratic Republic of the Congo 399 5.2 48.3 47 2 51
Equatorial Guinea 0 0.0 0.0 0 0 0
Gabon 3 1.5 1.1 0 100 0
Sao Tome and Principe 0 0.0 0.0 0 0 0
North Africa 932 4.1 39.6 37 50 12
Algeria 101 2.5 42.1 0 4 96
Egypt 463 4.9 81.8 0 99 0
Libya 37 5.9 4.8 0 100 0
Morocco 5 0.2 5.9 0 100 0
| 152 |

TABLE A6 (CONTINUED)
COUNTRY/TERRITORY OF RESIDENCE
Stock of refugees Share of refugees in total population
Share of refugees in total
immigrant stock
Refugee distribution by locality type
Rural Urban Unknown
2015 2016
Thousands Refugee per 1 000 people
Percentage Shares over total number of refugees
Sudan 326 8.4 52.2 66 34 0
Tunisia 1 0.1 1.3 0 100 0
Southern Africa 1 226 19.3 29.8 4 96 0
Botswana 2 1.4 1.4 100 0 0
Eswatini 1 0.7 3.0 0 100 0
Lesotho 0 0.0 0.5 0 100 0
Namibia 5 1.9 4.7 100 0 0
South Africa 1 218 22.0 31.9 0 100 0
Western Africa 382 1.1 5.8 86 6 8
Benin 1 0.1 0.3 0 100 0
Burkina Faso 34 1.9 4.8 94 6 0
Cabo Verde 0 0.0 0.0 0 0 0
Côte d'Ivoire 3 0.1 0.1 58 42 0
Gambia 8 4.0 4.1 85 15 0
Ghana 19 0.7 4.8 56 9 35
Guinea 9 0.7 6.9 79 21 0
Guinea-Bissau 9 5.0 39.4 93 1 6
Liberia 38 8.5 33.6 96 4 0
Mali 16 0.9 4.5 87 13 0
Mauritania 78 18.6 46.8 63 2 35
Niger 125 6.3 49.3 97 3 0
Nigeria 2 0.0 0.1 1 99 0
Saint Helena 0 0.0 0.0 0 0 0
Senegal 18 1.2 6.7 87 13 0
Sierra Leone 1 0.1 0.8 62 38 0
Togo 23 3.1 8.2 77 23 0
ASIA 14 657 3.3 19.1 14 78 8
Central Asia 5 0.1 0.1 1 90 10
Kazakhstan 2 0.1 0.0 0 100 0
Kyrgyzstan 1 0.1 0.3 0 0 100
Tajikistan 2 0.3 0.9 0 100 0
Turkmenistan 0 0.0 0.0 100 0 0
Uzbekistan 0 0.0 0.0 0 0 100
East Asia 310 0.2 5.8 0 1 99
China 304 0.2 7.3 0 0 100
Democratic People's Republic of Korea 0 0.0 0.0 0 0 0
Mongolia 0 0.0 0.1 0 87 13
Republic of Korea 7 0.1 0.6 .. .. ..
| 153 |

TABLE A6(CONTINUED)
COUNTRY/TERRITORY OF RESIDENCE
Stock of refugees Share of refugees in total population
Share of refugees in total
immigrant stock
Refugee distribution by locality type
Rural Urban Unknown
2015 2016
Thousands Refugee per 1 000 people
Percentage Shares over total number of refugees
Southeast Asia 382 0.8 4.0 50 50 0
Brunei Darussalam 0 0.0 0.0 0 0 0
Cambodia 0 0.0 0.1 0 100 0
Indonesia 14 0.1 4.0 0 100 0
Lao People's Democratic Republic 0 0.0 0.0 0 0 0
Malaysia 235 7.6 8.9 0 100 0
Myanmar 0 0.0 0.0 0 0 0
Philippines 1 0.0 0.3 0 38 62
Singapore 0 0.0 0.0 .. .. ..
Thailand 133 1.9 3.8 96 4 0
Timor-Leste 0 0.0 0.1 .. .. ..
Viet Nam 0 0.0 0.0 0 0 0
South Asia 3 433 1.9 24.2 22 66 12
Afghanistan 408 12.1 83.3 87 13 0
Bangladesh 233 1.4 16.3 12 0 88
Bhutan 0 0.0 0.0 0 0 0
India 208 0.2 4.0 32 12 56
Iran (Islamic Republic of) 982 12.4 36.0 3 97 0
Maldives 0 0.0 0.0 0 0 0
Nepal 33 1.2 6.5 98 2 0
Pakistan 1 568 8.3 43.2 32 68 0
Sri Lanka 1 0.1 3.5 0 100 0
Western Asia* 7 747 33.0 26.9 10 89 1
Armenia 19 6.6 10.1 0 94 6
Azerbaijan 1 0.1 0.5 0 100 0
Bahrain 0 0.3 0.1 0 100 0
Cyprus 15 13.2 8.0 0 100 0
Georgia 3 0.7 3.5 11 29 60
Iraq 285 7.9 79.3 0 100 0
Israel 45 5.5 2.2 0 0 100
Jordan 2 751 300.4 88.4 20 80 0
Kuwait 2 0.4 0.1 0 100 0
Lebanon 1 593 272.2 80.7 0 100 0
Oman 0 0.2 0.0 0 100 0
Qatar 0 0.1 0.0 0 0 100
Saudi Arabia 0 0.0 0.0 0 100 0
Turkey 2 754 35.2 66.7 8 92 0
United Arab Emirates 1 0.1 0.0 0 100 0
Yemen 277 10.3 72.9 61 39 0
| 154 |

COUNTRY/TERRITORY OF RESIDENCE
Stock of refugees Share of refugees in total population
Share of refugees in total
immigrant stock
Refugee distribution by locality type
Rural Urban Unknown
2015 2016
Thousands Refugee per 1 000 people
Percentage Shares over total number of refugees
LATIN AMERICA AND THE CARIBBEAN 399 0.6 4.3 3 14 83
Caribbean 2 0.0 0.2 0 100 0
Anguilla 0 0.0 0.0 0 0 0
Antigua and Barbuda 0 0.2 0.1 0 100 0
Aruba 0 0.0 0.0 0 100 0
Bahamas 0 0.2 0.2 0 100 0
Barbados 0 0.0 0.0 0 0 0
British Virgin Islands 0 0.0 0.0 0 0 0
Caribbean Netherlands 0 0.0 0.0 0 0 0
Cayman Islands 0 0.3 0.1 0 100 0
Cuba 0 0.0 2.5 0 100 0
Curaçao 0 0.5 0.2 .. .. ..
Dominica 0 0.0 0.0 0 0 0
Dominican Republic 1 0.1 0.3 0 100 0
Grenada 0 0.0 0.0 0 0 0
Guadeloupe 0 0.0 0.0 0 0 0
Haiti 0 0.0 0.0 0 100 0
Jamaica 0 0.0 0.1 0 100 0
Martinique 0 0.0 0.0 0 0 0
Montserrat 0 0.0 0.0 0 0 0
Puerto Rico 0 0.0 0.0 0 0 0
Saint Kitts and Nevis 0 0.0 0.0 0 0 0
Saint Lucia 0 0.0 0.0 0 100 0
Saint Vincent and the Grenadines 0 0.0 0.0 0 0 0
Sint Maarten (Dutch part) 0 0.3 0.0 .. .. ..
Trinidad and Tobago 0 0.1 0.4 0 100 0
Turks and Caicos Islands 0 0.0 0.0 0 100 0
United States Virgin Islands 0 0.0 0.0 0 0 0
Central America 37 0.2 1.8 0 98 2
Belize 1 2.3 1.5 .. .. ..
Costa Rica 7 1.4 1.7 0 100 0
El Salvador 0 0.0 0.1 0 0 100
Guatemala 4 0.2 4.9 0 0 100
Honduras 0 0.0 0.1 0 100 0
Mexico 4 0.0 0.4 0 100 0
Nicaragua 0 0.1 1.1 0 0 100
Panama 20 5.1 11.0 0 100 0
South America 360 0.9 6.2 3 6 91
Argentina 4 0.1 0.2 0 100 0
Bolivia (Plurinational State of) 1 0.1 0.5 0 0 100
TABLE A6 (CONTINUED)
| 155 |

COUNTRY/TERRITORY OF RESIDENCE
Stock of refugees Share of refugees in total population
Share of refugees in total
immigrant stock
Refugee distribution by locality type
Rural Urban Unknown
2015 2016
Thousands Refugee per 1 000 people
Percentage Shares over total number of refugees
Brazil 36 0.2 5.0 0 100 0
Chile 3 0.2 0.6 0 100 0
Colombia 7 0.1 5.0 0 100 0
Ecuador 133 8.2 34.4 0 0 100
French Guyana 0 0.0 0.0 0 0 0
Guyana 0 0.0 0.1 0 100 0
Paraguay 0 0.0 0.1 0 100 0
Peru 2 0.1 2.1 0 100 0
Suriname 0 0.0 0.0 0 100 0
Uruguay 0 0.1 0.5 0 100 0
Venezuela (Bolivarian Republic of) 174 5.6 12.4 5 0 95
OCEANIA 10 1.0 0.0 0 0 100
Melanesia 10 1.0 8.5 0 0 100
Fiji 0 0.0 0.1 0 100 0
New Caledonia 0 0.0 0.0 0 0 0
Papua New Guinea 10 1.2 31.6 0 0 100
Solomon Islands 0 0.0 0.1 0 0 0
Vanuatu 0 0.0 0.1 0 0 0
Micronesia 1 1.7 0.8 0 1 99
Guam 0 0.0 0.0 0 0 0
Kiribati 0 0.0 0.0 0 0 0
Marshall Islands 0 0.0 0.0 0 0 0
Micronesia (Federated States of) 0 0.1 0.5 0 100 0
Nauru 1 76.8 23.5 0 0 100
Northern Mariana Islands 0 0.0 0.0 0 0 0
Palau 0 0.0 0.0 0 100 0
Polynesia 0 0.0 0.0 0 100 0
American Samoa 0 0.0 0.0 0 0 0
Cook Islands 0 0.0 0.0 0 0 0
French Polynesia 0 0.0 0.0 0 0 0
Niue 0 0.0 0.0 0 0 0
Samoa 0 0.0 0.0 0 100 0
Tokelau 0 0.0 0.0 0 0 0
Tonga 0 0.0 0.0 0 0 0
Tuvalu 0 0.0 0.0 0 0 0
Wallis and Futuna Islands 0 0.0 0.0 0 0 0
TABLE A6 (CONTINUED)
| 156 |

TABLE A6 (CONTINUED)
COUNTRY/TERRITORY OF RESIDENCE
Stock of refugees Share of refugees in total population
Share of refugees in total
immigrant stock
Refugee distribution by locality type
Rural Urban Unknown
2015 2016
Thousands Refugee per 1 000 people
Percentage Shares over total number of refugees
DEVELOPED REGIONS 3 628 2.9 2.6 4 39 57
EUROPE 2 847 3.8 3.8 1 45 54
Eastern Europe 424 1.4 2.1 0 9 91
Belarus 4 0.4 0.4 0 28 72
Bulgaria 26 3.6 19.5 0 100 0
Czechia 4 0.4 1.0 0 100 0
Hungary 41 4.2 8.6 0 0 100
Poland 17 0.5 2.8 0 0 100
Republic of Moldova 1 0.1 0.4 0 0 100
Romania 3 0.1 1.1 0 0 100
Russian Federation 317 2.2 2.7 0 0 100
Slovakia 1 0.2 0.6 0 0 100
Ukraine 10 0.2 0.2 0 100 0
Northern Europe 652 6.3 4.9 0 92 8
Channel Islands 0 0.0 0.0 0 0 0
Denmark 42 7.4 7.1 0 0 100
Estonia 0 0.2 0.1 0 0 100
Faroe Islands 0 0.0 0.0 0 0 0
Finland 37 6.8 11.8 0 100 0
Iceland 0 1.0 0.9 0 0 100
Ireland 11 2.4 1.5 0 100 0
Isle of Man 0 0.0 0.0 0 0 0
Latvia 0 0.2 0.1 0 0 100
Lithuania 1 0.4 0.9 0 0 100
Norway 76 14.6 10.1 0 100 0
Sweden 327 33.4 20.4 0 100 0
United Kingdom of Great Britain and Northern Ireland 157 2.4 1.9 0 100 0
Southern Europe 326 2.1 2.1 8 35 57
Albania 1 0.3 1.8 3 94 3
Andorra 0 0.0 0.0 0 0 0
Bosnia and Herzegovina 7 1.9 17.6 0 100 0
Croatia 15 3.5 2.5 0 100 0
Gibraltar 0 0.0 0.0 0 0 0
Greece 51 4.5 4.1 0 100 0
Holy See 0 0.0 0.0 0 0 0
Italy 177 3.0 3.1 0 0 100
Malta 8 17.9 18.1 3 97 0
Montenegro 13 20.1 15.3 0 39 61
Portugal 1 0.1 0.2 0 0 100
| 157 |

TABLE A6 (CONTINUED)
COUNTRY/TERRITORY OF RESIDENCE
Stock of refugees Share of refugees in total population
Share of refugees in total
immigrant stock
Refugee distribution by locality type
Rural Urban Unknown
2015 2016
Thousands Refugee per 1 000 people
Percentage Shares over total number of refugees
San Marino 0 0.0 0.0 0 0 0
Serbia and Kosovo 35 4.0 4.4 55 45 0
Slovenia 0 0.2 0.2 0 100 0
Spain 17 0.4 0.3 0 100 0
The former Yugoslav Republic of Macedonia 1 0.3 0.5 0 100 0
Western Europe 1 445 7.5 5.6 0 37 63
Austria 79 9.1 5.3 0 100 0
Belgium 67 5.9 5.3 0 0 100
France 336 5.2 4.2 0 100 0
Germany 737 9.1 7.2 0 0 100
Liechtenstein 0 6.6 1.0 0 100 0
Luxembourg 4 6.6 1.4 0 0 100
Monaco 0 0.8 0.2 0 0 100
Netherlands 117 6.9 5.8 0 0 100
Switzerland 106 12.7 4.4 0 100 0
NORTH AMERICA 715 2.0 1.3 0 0 100
Bermuda 0 0.0 0.0 0 0 0
Canada 156 4.3 2.1 0 0 100
Greenland 0 0.0 0.0 0 0 0
Saint Pierre and Miquelon 0 0.0 0.0 0 0 0
United States of America 559 1.7 1.2 0 0 100
OTHER ASIAN COUNTRIES, AUSTRALIA AND NEW ZEALAND 66 0.4 0.7 0 9 91
Australia 48 2.0 0.7 0 0 100
Japan 16 0.1 0.7 0 100 0
New Zealand 2 0.4 0.2 0 100 0
* Regional average excludes Palestine and the Syrian Arab Republic.
| 158 |

REFERENCES
CHAPTER 1
1. UN General Assembly. 2017. Making migration work for all. Report of the Secretary-General (A/72/643).
2. World Inequality Lab. 2018. World Inequality Report 2018. Paris.
3. Poggi, C. 2018. Migration, its dynamics and aspirations: A review of Migrating out of Poverty. Background paper prepared for The State of Food and Agriculture 2018: Migration, agriculture and rural development. University of Sussex. Unpublished.
4. Skeldon, R. 2006. Interlinkages between internal and international migration and development in the Asian region. Population, Space and Place, 12(1): 15–30.
5. UN DESA. 2017. Trends in International Migrant Stock: The 2017 revision (United Nations database, POP/DB/MIG/Stock/Rev.2017). New York, United Nations, Department of Economic and Social Affairs. Population Division.
6. UNHCR. 2016. Global trends in forced displacement in 2015. Geneva.
7. Bell, M. & Charles-Edwards, E. 2013. Cross-national comparisons of internal migration. An update of global patterns and trends. United Nations Department of Economic and Social Affairs. Population Division. Technical Paper No 2013/1. New York, United Nations.
8. International Fund for Agricultural Development (IFAD). 2016. Rural Development Report 2016. Fostering inclusive rural transformation. Rome.
9. FAO. 2017. The State of Food and Agriculture 2017: Leveraging food systems for inclusive rural transformation. Rome (also available at http://www.fao.org/3/a-i7658e.pdf).
10. World Bank. 2007. World Development Report 2008. Agriculture for Development. Washington, DC.
11. Mercandalli, S. & Losch, B., eds. 2017. Rural Africa in motion. Dynamics and drivers of migration south of the Sahara. Rome, FAO and CIRAD. 60 pp. (also available at http://www.fao.org/3/I7951EN/i7951en.pdf).
12. Benjamin, N., Beegle, K., Recanatini, F. & Santini, M. 2014. Informal economy and the World Bank. World Bank Policy Research Working Paper No. 6888.
13. Angel-Urdinola, F. & Tanabe, K. 2012. Micro-determinants of informal employment in the Middle East and North Africa Region. Washington, DC., World Bank.
14. Chen, M. & Harvey, J. 2017. The informal economy in Arab nations: A comparative perspective. Paper for the Arab Watch Report on informal employment in MENA Region. Manchester, WIEGO Network.
15. UN DESA. 2015. Youth population trends and sustainable development. Population Facts No. 2015/1. New York.
16. Clemens, M. 2014. Does development reduce migration? IZA Discussion Paper No. 8592. Forschungsinstitut zur Zukunft der Arbeit Institute for the Study of Labor (IZA).
17. De Haas, H. 2010. Migration transitions: A theoretical and empirical inquiry into the developmental drivers of international migration. Oxford, The International Migration Institute (IMI), Oxford Department of International Development (QEH), University of Oxford.
18. Clemens, M. & Postel, H. 2018. Deterring emigration with foreign aid: An overview of evidence from low-income countries. Washington, DC., Center for Global Development.
19. International Organization for Migration (IOM). 2011. Glossary on Migration. 2nd edition. International Migration Law. Geneva, Switzerland, IOM.
20. IOM. 2015. Key Migration Terms. In: International Organization for Migration [online]. [Cited 18 January 2018]. https://www.iom.int/key-migration-terms
21. FAO, IFAD, IOM & WFP. 2018. The Linkages between Migration, Agriculture, Food Security and Rural Development. Rome.
22. Lee, E.S. 1966. A theory of migration. Demography, 3(1): 47–57.
23. Van Hear, N., Bakewell, O. & Long, K. 2018. Push-pull plus: reconsidering the drivers of migration. Journal of Ethnic and Migration Studies, 44(6): 927–944.
| 159 |

24. Brown, S.K. & Bean, F.D. 2016. Conceptualizing migration: From internal/international to kinds of membership. In A. White, ed. International Handbook of Migration and Population Distribution, pp. 91–106. International Handbooks of Population. Springer, Dordrecht.
25. King, R. & Skeldon, R. 2010. ‘Mind the Gap!’ Integrating approaches to internal and international migration. Journal of Ethnic and Migration Studies, 36(10): 1619–1646.
26. Lozano-Ascencio, F., Roberts, B. & Bean, F. 1996. The interconnectedness of internal and international migration: the case of the United States and Mexico. Texas Population Research Center Paper No. 96-97-02. Austin, University of Texas and Texas Population Research Center.
27. Durand, J. & Massey, D.S., eds. 2004. Crossing the border: Research from the Mexican Migration Project. Russell Sage Foundation. 356 pp.
28. Hugo, G.J. 2016. Internal and international migration in East and Southeast Asia: Exploring the linkages. Population, Space and Place, 22(7): 651–668.
29. UN-Habitat. 2013. State of the world’s cities 2012/2013. Prosperity of cities. New York, Routledge.
30. UN DESA PD. 2017. World Population Prospects: The 2017 Revision, Key Findings and Advance Tables. Working Paper No. ESA/P/WP/248. New York.
31. World Bank. 2017. Health Nutrition and Population Statistics database (available at http://databank.worldbank.org/data/reports.aspx?source=311).
32. UNDP. 2016. Human Development Report 2016. Human Development for Everyone. New York.
33. FAO. 2018. FAOSTAT, Online statistical database (available at http://faostat.fao.org).
34. UNDP. 2018. Human Development Data (1990–2015), Online statistical database (available at http://hdr.undp.org/en/data).
35. FAO, IFAD, UNICEF, WFP & WHO. 2017. The State of Food Security and Nutrition in the World 2017. Building resilience for peace and food security. Rome, FAO (also available at http://www.fao.org/3/a-I7695e.pdf).
36. OECD. 2016. Perspectives on Global Development. International Migration in a Shifting World. Paris.
37. Ingelaere, B., Christiaensen, L., De Weerdt, J. & Kanbur, R. 2018. Why secondary towns can be important for poverty reduction – A migrant perspective. World Development, 105: 273–282.
CHAPTER 2
1. UN DESA. 2017. Trends in International Migrant Stock: The 2017 revision (United Nations database, POP/DB/MIG/Stock/Rev.2017). New York.
2. European Union. 2018. Migration and migrant population statistics. In: Eurostat - Statistics Explained [online]. [Cited 25 April 2018]. http://ec.europa.eu/eurostat/statistics-explained/index.php?title=Migration_and_migrant_population_statistics&oldid=331044
3. Mercandalli, S. & Losch, B., eds. 2017. Rural Africa in motion. Dynamics and drivers of migration South of the Sahara. Rome, FAO and CIRAD. 60 pp. (also available at http://www.fao.org/3/I7951EN/i7951en.pdf).
4. UNSD. 2018. Standard Country or Area Codes for Statistical Use. (online version of the Methodology: Standard country or area codes for statistical use (M49) available at https://unstats.un.org/unsd/methodology/m49). New York, Statistics Division of the United Nations Secretariat (UNSD).
5. David, A. & Nilsson, B. 2017. Migration and rural development in NENA countries. Background paper prepared for The State of Food and Agriculture 2018: Migration, agriculture and rural development. Unpublished.
6. ILO. 2017. Good practice - MERCOSUR Residence Agreement. In: ILO Migrant Labour Branch [online]. [Cited 18 May 2018]. http://www.ilo.org/dyn/migpractice/migmain.showPractice?p_lang=en&p_practice_id=187
7. Khadria, B. 2005. Migration in South and South-West Asia. A paper prepared for the Policy Analysis and Research Programme of the Global Commission on International Migration. Geneva.
8. UN Economic and Social Commission for Asia and the Pacific (ESCAP). 2015. Asia-Pacific Migration Report 2015. Migrants’ Contributions to Development. Bangkok.
9. Brunarska, Z., Nestorowicz, J. & Markowski, S. 2014. Intra- vs. extra-regional migration in the post-Soviet space. Eurasian Geography and Economics, 55(2): 133–155.
10. de Brauw, A. 2017. Rural Out-Migration and Implications for Agriculture and Rural Development. Background paper prepared for The State of Food and Agriculture 2018: Migration, agriculture and rural development. Washington, DC., IFPRI.
11. US Department of Labor. 2016. Findings from the National Agricultural Workers Survey (NAWS) 2013-2014. A demographic and employment profile of United States farmworkers. Research Report No. 12. Washington, DC., US Department of Labor, Employment and Training Administration, Office of Policy Development and Research by JBS International, Inc.
REFERENCES
| 160 |

12. McGuinness, T. & Garton Grimwood, G. 2017. Migrant workers in agriculture. Briefing Paper No. 7987. London, House of Commons Library.
13. Byerlee, D. 1974. Rural-urban migration in Africa: Theory, policy and research implications. The International Migration Review, 8(4): 543–566.
14. Adepoju, A. 1979. Migration and socio-economic change in Africa. International Social Science Journal, 31(2): 207–25.
15. Baker, J. & Aina, T.A., eds. 1995. Internal non-metropolitan migration and the development process in Africa. Uppsala, Sweden, Nordiska Afrikainstitutet.
16. Eicher, C.K. & Baker, D.C. 1982. Research on agricultural development in sub-Saharan Africa; a critical survey. East Lansing, Michigan State University.
17. Nkamleu, G.B. & Fox, L. 2006. Taking stock of research on regional migration in sub-Saharan Africa [online]. [Cited 17 May 2018]. https://mpra.ub.uni-muenchen.de/15112/
18. Van der Geest, K. 2002. Internal migration and rural livelihoods in West Africa. Brighton, UK, University of Sussex. (MA dissertation)
19. Weiss, H. 2003. Migrations during times of drought and famine in early colonial northern Nigeria. Studia Orientalia Electronica, 95: 1–30.
20. Adedokun, O.A. 2003. The rights of migrant workers and members of their families: Nigeria. UNESCO Series of Country Reports on the Ratification of the UN Convention on Migrants. SHS/2003/MC/7.
21. Adepoju, A. 1988. An overview of rural migration and agricultural labour force structure in Africa. African Population Studies, 1988(1): 5–25.
22. International Labour Office (ILO). 2016. Non-standard employment around the world: Understanding challenges, shaping prospects. ILO.
23. Martin, L.P. 2016. Migrant workers in commercial agriculture labour. Geneva, International Labour Office, Sectoral Policies Department, Conditions of Work and Equality Department, ILO.
24. Poggi, C. 2018. Migration, its dynamics and aspirations: A review of Migrating out of Poverty. Background paper prepared for The State of Food and Agriculture 2018: Migration, agriculture and rural development. University of Sussex. Unpublished.
25. Gallup®. 2018. Gallup World Poll dataset for the following years: 2007, 2008, 2009, 2010, 2011, 2012, 2013, 2014, 2015, 2016, and 2017.
26. Bell, M. & Charles-Edwards, E. 2013. Cross-national comparisons of internal migration. An update of global patterns and trends. United Nations Department of Economic and Social Affairs. Population Division. Technical Paper No 2013/1. New York, United Nations.
27. Srivastava, R. & Pandey, A. 2017. Internal and International Migration in South Asia. Drivers, Interlinkages and Policy Issues. Discussion Paper. New Delhi, UNESCO.
28. Rodríguez, J. 2008. Spatial distribution of the population, internal migration and development in Latin America and the Caribbean. Paper presented at United Nations expert group meeting on population distribution, urbanization, internal migration and development, 21 January 2008, New York.
29. Cattaneo, A. & Robinson, S. 2018. Economic development and the evolution of internal migration: Moving in steps, returnees, and gender differences. Background paper prepared for The State of Food and Agriculture 2018: Migration, agriculture and rural development. Rome; Washington, DC., FAO and IFPRI.
30. Chandrasekhar, S. 2017. Mobility of workers in rural India: Estimates, implications, and knowledge gaps. Background paper prepared for The State of Food and Agriculture 2018: Migration, agriculture and rural development. Indira Gandhi Institute of Development Research. Unpublished.
31. Démurger, S. 2018. Internal migration, agriculture and rural development in China. Background paper prepared for The State of Food and Agriculture 2018: Migration, agriculture and rural development. Lyon, French National Centre for Scientific Research (CNRS).
32. Suttie, D. & Vargas-Lundius, R. 2016. Migration and Transformative Pathways. A Rural Perspective. IFAD Research Series No. 02. Rome, IFAD.
33. Martin-Gutierrez, S., Borondo, J., Morales, A.J., Losada, J.C., Tarquis, A.M. & Benito, R.M. 2016. Agricultural activity shapes the mobility patterns in Senegal. In r. Jumar, J. Caverlee, H. Tong, eds. Proceedings of the 2016 IEEE/ACM International Conference on Advances in Social Networks Analysis and Mining (ASONAM), pp. 634–641. Piscataway, USA, Institute of Electrical and Electronics Engineers.
34. Lucas, R.E.B. 2015. Internal migration in developing economies: an overview. KNOMAD Working Paper 6. Global Knowledge Partnership on Migration and Development (KNOMAD).
35. de Brauw, A., Mueller, V. & Lee, H.L. 2014. The role of rural–urban migration in the structural transformation of sub-Saharan Africa. World Development, 63: 33–42.
36. Young, A. 2013. Inequality, the urban-rural gap, and migration. The Quarterly Journal of Economics, 128(4): 1727–1785.
| 161 |
37. National Statistical Committee of the Kyrgyz Republic. 2017. Distribution of internal (interregional) migrants by flows in 2013–2016.
38. FAO. 2018. FAOSTAT Population Module, Online statistical database (available at http://faostat.fao.org).
39. Lusome, R. & Bhagat, R.B. 2006. Trends and patterns of internal migration in India, 1971–2001. p. 9. Paper presented at Annual Conference of Indian Association for the Study of Population (IASP), 7 June 2006, Thiruvananthapuram.
40. FAO, IFAD, UNICEF, WFP & WHO. 2017. The State of Food Security and Nutrition in the World 2017. Building resilience for peace and food security. Rome, FAO (also available at http://www.fao.org/ 3/a-I7695e.pdf).
41. IDMC. 2017. GRID 2016. Global report on internal displacement. Geneva, Internal Displacement Monitoring Centre (IDMC) and Norwegian Refugee Council (NRC).
42. Barnett, J.R. & Webber, M. 2010. Accommodating migration to promote adaptation to climate change. No. ID 1589284. Rochester, NY, Social Science Research Network.
43. Piguet, E., Pécoud & de Guchteneire, P. 2011. Migration and climate change: An overview. Refugee Survey Quarterly, 30(3): 1–23.
44. UNHCR. 2017. Global trends in forced displacement in 2016. Geneva.
45. UNHCR. 2016. Global trends in forced displacement in 2015. Geneva.
46. United Nations Relief and Works Agency for Palestine Refugees (UNRWA). 2017. UNRWA in Figures. Jerusalem (also available at https://www.unrwa.org/sites/default/files/content/resources/unrwa_in_figures_2017_english.pdf).
47. IDMC. 2018. Global Internal Displacement Database (GIDD). In: Internal Displacement Monitoring Center (IDMC) [online]. [Cited 29 March 2018]. http://www.internal-displacement.org/database/displacement-data
48. Crawford, N., Cosgrave, J., Haysom, S. & Walicki, N. 2015. Protracted displacement: Uncertain paths to self-reliance in exile. London, ODI Humanitarian Policy Group.
49. IDMC. 2018. GRID 2018. Global report on internal displacement. Geneva, Internal Displacement Monitoring Centre (IDMC) and Norwegian Refugee Council (NRC).
50. IDMC. 2016. GRID 2015. Global report on internal displacement. Geneva, Internal Displacement Monitoring Centre (IDMC) and Norwegian Refugee Council (NRC).
51. FAO. 2017. Counting the cost. Agriculture in Syria after six years of crisis. Rome (also available at http://www.fao.org/3/b-i7081e.pdf).
52. Rigaud, K., de Sherbinin, A., Jones, B., Bergmann, J., Clement, V., Ober, K., Schewe, J., Adamo, S., McCusker, B., Heuser, S. & Midgley, A. 2018. Groundswell: Preparing for Internal Climate Migration. Washington, DC., World Bank.
53. FAO. 2017. The State of Food and Agriculture 2017: Leveraging food systems for inclusive rural transformation. Rome (also available at http://www.fao.org/3/a-i7658e.pdf).
CHAPTER 31. Van Hear, N., Bakewell, O. & Long, K. 2018. Push-pull plus: reconsidering the drivers of migration. Journal of Ethnic and Migration Studies, 44(6): 927–944.
2. Long, N., Arce, A., Frerks, G., Hilhorst, D. & Mulder, P. 2001. Reviews-Development sociology. Actor perspectives. Sociologia Ruralis, 41(4): 486–487.
3. Sen, A. 1999. Development as Freedom. Oxford and New York, Oxford University Press. 384 pp.
4. Gallup®. 2018. Gallup World Poll dataset for the following years: 2007, 2008, 2009, 2010, 2011, 2012, 2013, 2014, 2015, 2016, and 2017.
5. Timmer, P. 2007. The structural transformation and the changing role of agriculture in economic development. Paper presented at Wendt Lecture, American Enterprise Institute, 2007, Washington, DC.
6. Démurger, S. 2018. Internal migration, agriculture and rural development in China. Background paper prepared for The State of Food and Agriculture 2018: Migration, agriculture and rural development. Lyon, French National Centre for Scientific Research (CNRS).
7. Zhu, N. 2002. The impacts of income gaps on migration decisions in China. China Economic Review, 13(2–3): 213–230.
8. Hu, X. 2012. China’s ‘New Generation’ rural-urban migrants: Migration motivation and migration patterns. Washington, DC., Migration Policy Institute.
9. McMillan, M. & Rodrik, D. 2011. Globalization, structural change and productivity growth. NBER Working Paper No. 17143. Cambridge, USA, National Bureau of Economic Research (NBER).
10. Black, R., Arnell, N.W., Adger, W.N., Thomas, D. & Geddes, A. 2013. Migration, immobility and displacement outcomes following extreme events. Environmental Science & Policy, 27: S32–S43.
REFERENCES
| 162 |

11. Southern Africa Labour and Development Research Unit (SALDRU). 2016. National Income Dynamics Study 2008, Wave 1 [dataset]. Version 6.1. (available online at http://www.nids.uct.ac.za/). Cape Town, SALDRU & DataFirst.
12. SALDRU. 2016. National Income Dynamics Study 2014 - 2015, Wave 4 [dataset]. Version 1.1. (available online at http://www.nids.uct.ac.za/). Cape Town & Pretoria, Southern Africa Labour and Development Research Unit, DataFirst & Department of Planning Monitoring and Evaluation.
13. Daniels, R., Andrew, P., Kekana, D. & Musundwa, S. 2013. Rural livelihoods in South Africa. SALDRU Working Paper Number 122/ NIDS Discussion Paper 2013/4. Cape Town, Southern Africa Labour and Development Research Unit (SALDRU), University of Cape Town.
14. FAO. 2017. The State of Food and Agriculture 2017: Leveraging food systems for inclusive rural transformation. Rome (also available at http://www.fao.org/3/a-i7658e.pdf).
15. de Brauw, A., Mueller, V. & Lee, H.L. 2014. The role of rural–urban migration in the structural transformation of sub-Saharan Africa. World Development, 63: 33–42.
16. Chandrasekhar, S. 2017. Mobility of workers in rural India: Estimates, implications, and knowledge gaps. Background paper prepared for The State of Food and Agriculture 2018: Migration, agriculture and rural development. Indira Gandhi Institute of Development Research. Unpublished.
17. David, A. & Nilsson, B. 2017. Migration and rural development in NENA countries. Background paper prepared for The State of Food and Agriculture 2018: Migration, agriculture and rural development. Unpublished.
18. Elder, S., de Haas, H., Principi, M. & Schewel, K. 2015. Youth and rural development: Evidence from 25 school-to-work transition surveys. ILO.
19. Kaestner, R. & Malamud, O. 2014. Self-selection and international migration: New evidence from Mexico. Review of Economics and Statistics, 96(1): 78–91.
20. Bertoli, S., Fernández-Huertas Moraga, J. & Ortega, F. 2013. Crossing the border: Self-selection, earnings and individual migration decisions. Journal of Development Economics, 101: 75–91.
21. Reda, M.A., Hohfeld, L., Jitsuchon, S. & Waibel, H. 2012. Rural-urban migration and employment quality: A case study from Thailand. No. ID 2094740. Rochester, NY, Social Science Research Network (also available at https://papers.ssrn.com/abstract=2094740).
22. Schoorl, J., Heering, L., Esveldt, I., Groenewold, G. & Van der Erf, R. 2000. Push and pull factors of international migration: a comparative report. Luxembourg, Office for Official Publications of the European Communities.
23. Herrera, C. & Sahn, D.E. 2013. Determinants of internal migration among Senegalese youth. Cornell Food and Nutrition Policy Program Working Paper No. 245. Ithaca, Cornell University.
24. UNESCO. 2009. Global Education Digest 2009. Comparing Education Statistics Across the World. Montreal, UNESCO Institute of Statistics.
25. Akesson, L. 2004. Making a life. Meanings of migration in Cape Verde. Sweden, University of Gothenberg, Department of Anthropology.
26. Cohen, J. 2004. The culture of migration in southern Mexico. Austin, University of Texas Press.
27. Awumbila, M. 2014. Linkages between urbanization, rural-urban migration and poverty outcomes in Africa. Background paper for the World Migration Report 2015. Migrants and cities: New partnerships to manage mobility. Geneva, International Organization for Migration.
28. van der Geest, K. 2011. North-South migration in Ghana: What role for the environment? International Migration, 49: e69–e94.
29. Cai, R., Feng, S., Oppenheimer, M. & Pytlikova, M. 2016. Climate variability and international migration: The importance of the agricultural linkage. Journal of Environmental Economics and Management, 79: 135–151.
30. Mastrorillo, M., Licker, R., Bohra-Mishra, P., Fagiolo, G., D. Estes, L. & Oppenheimer, M. 2016. The influence of climate variability on internal migration flows in South Africa. Global Environmental Change, 39: 155–169.
31. Viswanathan, B. & Kumar, K.S.K. 2015. Weather, agriculture and rural migration: evidence from state and district level migration in India. Environment and Development Economics, 20(4): 469–492.
32. Wrathall, D., Van Den Hoek, J., Walters, A. & Devenish, A. 2018. Water stress and human migration: a global, georeferenced review of empirical research. Rome, FAO; Oregon State University, Global Water Partnership (also available at http://www.fao.org/3/i8867en/I8867EN.pdf).
33. Mekonnen, M.M. & Hoekstra, A.Y. 2016. Four billion people facing severe water scarcity. Science Advances, 2(2): e1500323–e1500323.
34. Njock, J.C. & Westlund, L. 2010. Migration, resource management and global change: Experiences from fishing communities in West and Central Africa. Marine Policy, 34(4): 752–760.
| 163 |

35. Rigaud, K., de Sherbinin, A., Jones, B., Bergmann, J., Clement, V., Ober, K., Schewe, J., Adamo, S., McCusker, B., Heuser, S. & Midgley, A. 2018. Groundswell: Preparing for Internal Climate Migration. Washington, DC., World Bank.
36. Plane, D.A. 1993. Demographic influences on migration. Regional Studies, 27(4): 375–383.
37. IMF. 2015. Regional economic outlook: Sub-Saharan Africa. Navigating headwinds. World Economic and Financial Surveys. Washington, DC.
38. Abdurazakova, D. 2013. Social impact of international migration and remittances in Central Asia. Asia-Pacific Population Journal, 26(3): 29–54.
39. Zayonchkovskaya, Z. 2010. Interview by Rossiyskaya Gazeta, Federal issue No. 5220 (141).
40. Headey, D.D. & Jayne, T.S. 2014. Adaptation to land constraints: is Africa different? Food Policy, 48: 18–33.
41. Kosec, K., Ghebru, H., Holtemeyer, B., Mueller, V. & Schmidt, E. 2016. The Effect of Land Inheritance on Youth Employment and Migration Decisions: Evidence from Rural Ethiopia. Discussion paper 01594. Washington, DC., IFPRI.
42. ESCAP. 2013. Urbanization in Central Asia: Challenges, issues and prospects. Tashkent, United Nations Economic and Social Commission for Asia and the Pacific (ESCAP).
43. Jacoby, H.G., Li, G. & Rozelle, S. 2002. Hazards of expropriation: Tenure insecurity and investment in rural China. American Economic Review, 92(5): 1420–1447.
44. Dercon, S., De Weerdt, J., Bold, T. & Pankhurst, A. 2006. Group-based funeral insurance in Ethiopia and Tanzania. World Development, 34(4): 685–703.
45. Munshi, K. & Rosenzweig, M. 2016. Networks and misallocation: Insurance, migration, and the rural-urban wage gap. American Economic Review, 106(1): 46–98.
46. Molinero-Gerbeau, Y. & Avallone, G. 2018. Migration and labour force needs in contemporary agriculture: what drives states to implement temporary programs? A comparison among the cases of Huelva, Lleida (Spain) and Piana del Sele (Italy). Quality of Life, XXIX(1): 3–22.
47. OECD. 2017. Interrelations between Public Policies, Migration and Development in Georgia. Paris, OECD Publishing.
48. Poggi, C. 2018. Migration, its dynamics and aspirations: A review of Migrating out of Poverty. Background paper prepared for The State of Food and Agriculture 2018: Migration, agriculture and rural development. University of Sussex. Unpublished.
49. Kangasniemi, M., Knowles, M. & Karfakis, P. 2017. The role of social protection in inclusive structural transformation. Background paper prepared for The State of Food and Agriculture 2017: Leveraging Food Systems for Rural Inclusive Transformation. Rome, FAO. Unpublished.
50. OECD. 2016. Perspectives on Global Development. International Migration in a Shifting World. Paris.
51. Hagen-Zanker, J. & Himmelstine, C.L. 2013. What do we know about the impact of social protection programmes on the decision to migrate? Migration and Development, 2(1): 117–131.
52. Stecklov, G., Winters, P., Stampini, M. & Davis, B. 2005. Do conditional cash transfers influence migration? A study using experimental data from the Mexican PROGRESA program. Demography, 42(4): 769–790.
53. Imbert, C. & Papp, J. 2014. Short-term migration and rural workfare programs: Evidence from India. Manuscript, 1.
54. Angelucci, M. 2015. Migration and Financial Constraints: Evidence from Mexico. Review of Economics and Statistics, 97(1): 224–228.
55. Bryan, G., Chowdhury, S. & Mobarak, A.M. 2014. Underinvestment in a profitable technology: The case of seasonal migration in Bangladesh. Econometrica, 82(5): 1671–1748.
56. Massey, D.S., Arango, J., Hugo, G., Kouaouci, A., Pellegrino, A. & Taylor, J.E. 1993. Theories of international migration: A review and appraisal. Population and Development Review: 431–466.
57. Akram, A.A., Chowdhury, S. & Mobarak, A.M. 2017. Effects of emigration on rural labor markets. NBER Working Paper No. 23929. Cambridge, USA, National Bureau of Economic Research.
58. Angelucci, M., De, G.G., Rangel, M. & Rasul, I. 2009. Village economies and the structure of extended family networks. The B.E. Journal of Economic Analysis & Policy, 9(1).
59. Atamanov, A. & Berg, M. van den. 2012. International labour migration and local rural activities in the Kyrgyz Republic: determinants and trade-offs. Central Asian Survey, 31(2): 119–136.
60. De Haas, H. 2008. The Complex Role of Migration in Shifting Rural Livelihoods. A Moroccan case study. In T. van Naerssen, E. Spaan & A. Zoomers, eds. Global Migration and Development, pp. 21–42. London and New York, Routledge.
61. Haut Commissariat au Plan (HCP) – CERED. 2007. Les Marocains résidant à l’étranger – l’Enquête sur l’insertion socio-économique des MRE dans les pays d’accueil, analyse des résultats. Rabat.
REFERENCES
| 164 |

62. Wattenbach, H. 2006. Farming systems of the Syrian Arab Republic. Damascus, FAO Project GCP/SYR/006/ITA, the National Agricultural Policy Center (NAPC).
63. Forni, N. 2001. Land tenure systems: structural features and policies. FAO Project GCP/SYR/006/ITA, the National Agricultural Policy Centre (NAPC). Damascus.
64. Mutandwa, E., Taremwa, N.K., Uwimana, P., Gakwandi, C. & Mugisha, F. 2011. An analysis of the determinants of rural to urban migration among rural youths in northern and western provinces of Rwanda. Rwanda Journal, 22(1): 55–95.
65. Regassa, N. & Stoecker, B.J. 2012. Household food insecurity and hunger among households in Sidama district, southern Ethiopia. Public Health Nutrition, 15(7): 1276–1283.
66. Tegegne, A.D. & Penker, M. 2016. Determinants of rural out-migration in Ethiopia: Who stays and who goes? Demographic Research, 35: 1011–1044.
67. Restuccia, D., Yang, D.T. & Zhu, X. 2008. Agriculture and aggregate productivity: A quantitative cross-country analysis. Journal of Monetary Economics, 55(2): 234–250.
68. Gollin, D., Lagakos, D. & Waugh, M.E. 2013. The agricultural productivity gap. The Quarterly Journal of Economics, 129(2): 939–993.
69. Young, A. 2013. Inequality, the urban-rural gap, and migration. The Quarterly Journal of Economics, 128(4): 1727–1785.
70. Hicks, J.H., Kleemans, M., Li, N.Y. & Miguel, E. 2017. Reevaluating agricultural productivity gaps with longitudinal microdata. NBER Working Paper No. 23253. Cambridge, USA, National Bureau of Economic Research.
71. Lucas, R.E.B. 1997. Internal migration in developing countries. In M.R. Rosenzweig & O. Stark, eds. Handbook of Population and Family Economics, Volume 1, Part B, pp. 721–798. Amsterdam, Elsevier North Holland.
72. World Bank. 2017. Migration and remittance surveys (available online at http://www.worldbank.org/en/topic/migrationremittancesdiasporaissues/brief/migration-remittances-data ).
73. GLLS. 2017. Ghana Living Standard Survey 6th Wave In: [Cited 27 July 2017]. http://www.statsghana.gov.gh/glss6.html
74. UNDP. 2009. Human Development Report 2009. Overcoming Barriers: Human Mobility and Development. New York.
75. Mercandalli, S. & Losch, B., eds. 2017. Rural Africa in motion. Dynamics and drivers of migration south of the Sahara. Rome, FAO and CIRAD. 60 pp. (also available at http://www.fao.org/3/I7951EN/i7951en.pdf).
76. Docquier, F. & Marfouk, A. 2006. International migration by educational attainment, 1990–2000. In C. Ozden & M. Schiff, eds. International Migration, Remittances, and the Brain Drain, pp. 151–200. Washington, DC., The World Bank and Palgrave McMillan.
77. Grogger, J. & Hanson, G.H. 2011. Income maximization and the selection and sorting of international migrants. Journal of Development Economics, 95(1): 42–57.
78. Global Forum on Migration and Development. 2015. Contributions of women migrant workers to development: going beyond remittances. Paper presented as Background note prepared for the GFMD Third Thematic Meeting, 8 September 2015, Geneva.
79. Awumbila, M., Teye, J.K., Litchfield, J., Boakye-Yiadom, L., Deshingkar, P. & Quartey, P. 2015. Are migrant households better off than non-migrant households? Evidence from Ghana. Migrating out of Poverty Working Paper 28. Brighton, UK, Migrating out of Poverty Research Programme Consortium (RPC), University of Sussex.
80. Tacoli, C. & Mabala, R. 2010. Exploring mobility and migration in the context of rural-urban linkages: why gender and generation matter. Environment and Urbanization, 22(2): 389–395.
81. FAO. 2016. National Gender Profile of Agricultural and Rural Livelihoods – Tajikistan. Country Gender Assessment Series. Rome.
82. World Bank. 2013. Tajikistan Country Gender Assessment. Report No. 77920 –TJ. Washington, DC.
83. FAO. 2018. FAOSTAT Population Module, Online statistical database (available at http://faostat.fao.org).
84. Black, R., Kniveton, D. & Schmidt-Verkerk, K. 2013. Migration and climate change: Toward an integrated assessment of sensitivity. In T Faist and J. Schade, eds. Disentangling migration and climate change: Methodologies, political discourses and human rights, pp. 29–53. Springer.
85. Fulford, S. 2013. The puzzle of marriage migration in India. Boston College Working Papers in Economics No. 820. Boston, USA, Boston College Department of Economics.
86. Henry, S., Schoumaker, B. & Beauchemin, C. 2004. The impact of rainfall on the first out-migration: A multi-level event-history analysis in Burkina Faso. Population and Environment, 25(5): 423–460.
87. Safir, A. 2009. Who leaves, who moves in? The impact of positive and negative income shocks on migration in Senegal. PSE Working Paper No. 76. Paris, Paris School of Economics.
| 165 |

88. Suttie, D. & Vargas-Lundius, R. 2016. Migration and Transformative Pathways. A Rural Perspective. IFAD Research Series No. 02. Rome, IFAD.
89. Clarke, R. & Eyal, K. 2014. Microeconomic determinants of spatial mobility in post-apartheid South Africa: Longitudinal evidence from the National Income Dynamics Study. Development Southern Africa, 31(1): 168–194.
90. Mckenzie, D. & Rapoport, H. 2007. Network effects and the dynamics of migration and inequality: Theory and evidence from Mexico. Journal of Development Economics, 84(1): 1–24.
91. Mendola, M. 2018. Determinants of migration intentions in developing countries: Global evidence from the Gallup World Poll. Background paper prepared for The State of Food and Agriculture 2018: Migration, agriculture and rural development. Università of Milano Bicocca and IZA. Unpublished.
92. Deshingkar, P. 2010. Migration, remote rural areas and chronic poverty in India. Overseas Development Institute (ODI) Working Paper 323 / Chronic Poverty Research Centre (CPRC) Working Paper 163. London, ODI..
93. Findley, S.E. 1994. Does drought increase migration? A study of migration from rural Mali during the 1983–1985 drought. The International Migration Review, 28(3): 539–553.
94. Chandrasekhar, S., Das, M. & Sharma, A. 2015. Short-term migration and consumption expenditure of households in rural India. Oxford Development Studies, 43(1): 105–122.
95. Wilkinson, E., Kirbyshire, A., Mayhew, L., Batra, P. & Milan, A. 2016. Climate-induced migration and displacement: Closing the policy gap. London, ODI.
96. Holleman, C., Jackson, J., Sánchez Cantillo, M. & Vos, R. 2017. Sowing the seeds of peace for food security – Disentangling the nexus between conflict, food security and peace. FAO Agricultural Development Economics Technical Study 2. Rome, FAO. 95 pp.
97. OECD. 2016. States of Fragility 2016: Understanding Violence. Paris, OECD Publishing (also available at http://dx.doi.org/ 10.1787/9789264267213-en).
98. Harmer, A. & Macrae, J. 2004. Beyond the continuum: The changing role of aid policy in protracted crises. HPG Report 18. London, ODI.
99. FAO & WFP. 2010. The State of Food Insecurity in the World 2010. Addressing food insecurity in protracted crises. Rome (also available at http://www.fao.org/docrep/013/i1683e/i1683e.pdf).
100. FAO, IFAD, UNICEF, WFP & WHO. 2017. The State of Food Security and Nutrition in the World 2017. Building resilience for peace and food security. Rome, FAO (also available at http://www.fao.org/3/a-I7695e.pdf).
101. FAO. 2018. The impact of disasters and crises on agriculture and food security - 2017. Rome (also available at http://www.fao.org/3/I8656EN/i8656en.pdf).
102. World Bank. 2017. Fragility, Conflict and Violence. In: World Bank [online]. [Cited 17 May 2018]. http://www.worldbank.org/en/topic/fragilityconflictviolence/overview
103. Betts, A. 2013. Survival migration: Failed governance and the crisis of displacement. Ithaca and London, Cornell University Press.
104. UNHCR. 2017. Global trends in forced displacement in 2016. Geneva.
105. Institute for Economics and Peace (IEP). 2016. Global Peace Index: Ten years of measuring peace. Sydney.
106. Brzoska, M. & Fröhlich, C. 2016. Climate change, migration and violent conflict: vulnerabilities, pathways and adaptation strategies. Migration and Development, 5(2): 190–210.
107. Mathews, J.T. 1989. Redefining Security. Foreign Affairs (Spring 1989) [online]. [Cited 30 March 2018]. https://www.foreignaffairs.com/articles/1989-03-01/redefining-security
108. Scott, S. 2012. The securitization of climate change in world politics: How close have we come and would full securitization enhance the efficacy of global climate change policy? Article on Climate Action Beyond the UNFCCC. Review of European, Comparative & International Environmental Law, 21(3): 220–230.
109. Selby, J., Dahi, O.S., Fröhlich, C. & Hulme, M. 2017. Climate change and the Syrian civil war revisited. Political Geography, 60: 232–244.
110. Burrows, K. & Kinney, P.L. 2016. Exploring the climate change, migration and conflict nexus. International Journal of Environmental Research and Public Health, 13(4): 443.
111. Raleigh, C. & Urdal, H. 2007. Climate change, environmental degradation and armed conflict. Political Geography, 26(6): 674–694.
112. Barnett, J. & Adger, W.N. 2007. Climate change, human security and violent conflict. Political Geography, 26(6): 639–655.
113. Salehyan, I. 2008. From climate change to conflict? No consensus yet. Journal of Peace Research, 45(3): 315–326.
114. Gleick, P.H. 2014. Water, drought, climate change, and conflict in Syria. Weather, Climate, and Society, 6(3): 331–340.
115. Kelley, C.P., Mohtadi, S., Cane, M.A., Seager, R. & Kushnir, Y. 2015. Climate change in the Fertile Crescent and implications of the recent Syrian drought. Proceedings of the National Academy of Sciences, 112(11): 3241–3246.
REFERENCES
| 166 |
116. Ababsa, M. 2013. Crise agraire, crise foncière et sécheresse en Syrie (2000-2011). Maghreb - Machrek, 215(1): 101.
117. Weinthal, E., Zawahri, N. & Sowers, J. 2015. Securitizing water, climate, and migration in Israel, Jordan, and Syria. International Environmental Agreements: Politics, Law and Economics, 15(3): 293–307.
118. De Châtel, F. 2014. The role of drought and climate change in the Syrian uprising: Untangling the triggers of the revolution. Middle Eastern Studies, 50(4): 521–535.
119. Sadiddin, A. 2013. An assessment of policy impact on agricultural water use in the northeast of Syria. Environmental Management and Sustainable Development, 2(1): 74.
120. UN-OCHA (United Nations Office for the Coordination of Humanitarian Affairs). 2010. Syria drought response plan 2009-2010. Mid-term review. New York.
121. IPCC. 2014. Climate Change 2014: Synthesis Report. R.K. Pachauri & L.A. Meyer, eds. Geneva, Contribution of Working Groups I, II and III to the Fifth Assessment Report of the Intergovernmental Panel on Climate Change. 151 pp.
122. Warner, K. 2010. Global environmental change and migration: Governance challenges. Global Environmental Change, 20(3): 402–413.
123. Lilleør, H.B. & Van den Broeck, K. 2011. Economic drivers of migration and climate change in LDCs. Global Environmental Change, 21: S70–S81.
124. IDMC. 2016. GRID 2015. Global report on internal displacement. Geneva, Internal Displacement Monitoring Centre (IDMC) and Norwegian Refugee Council (NRC).
125. IDMC. 2018. GRID 2018. Global report on internal displacement. Geneva, Internal Displacement Monitoring Centre (IDMC) and Norwegian Refugee Council (NRC).
126. IOM. 2009. Compendium of IOM’s Activities in Migration, Climate Change and the Environment. Geneva.
127. WFP. 2017. At the root of exodus. Food security, conflict and international migration. Rome.
128. UNHCR. 2016. Global trends in forced displacement in 2015. Geneva.
129. Kälin, W. & Chapuisat, H. 2017. Breaking the impasse. Reducing protracted internal displacement as a collective outcome. OCHA Policy and Studies Series. New York, United Nations.
CHAPTER 4
1. Young, A. 2013. Inequality, the urban-rural gap, and migration. The Quarterly Journal of Economics, 128(4): 1727–1785.
2. UNHCR. 2017. Global trends in forced displacement in 2016. Geneva.
3. Levitt, P. 1998. Social remittances: Migration driven local-level forms of cultural diffusion. The International Migration Review, 32(4): 926–948.
4. Levitt, P. & Lamba-Nieves, D. 2011. Social Remittances Revisited. Journal of Ethnic and Migration Studies, 37(1): 1–22.
5. Romano, D. & Traverso, S. 2017. Disentangling the effect of international migration on household food and nutrition security. Florence, DISEI - Università degli Studi di Firenze.
6. IFAD. 2017. Sending money home: contributing to the SDGs, one family at a time. Rome, International Fund for Agricultural Development (IFAD).
7. FAO. 2018. Rural Livelihoods Information System. Statistical database. Rome, FAO Statistics Division.
8. Stark, O. 1991. The migration of labor. Oxford, Basil Blackwell.
9. de la Brière, B., Sadoulet, E., de Janvry, A. & Lambert, S. 2002. The roles of destination, gender, and household composition in explaining remittances: an analysis for the Dominican Sierra. Journal of Development Economics, 68(2): 309–328.
10. Adaku, A.A. 2013. The effect of rural-urban migration on agricultural production in the northern region of Ghana. Journal of Agricultural Science and Applications, 02(04): 193–201.
11. Rozelle, S., Taylor, J.E. & de Brauw, A. 1999. Migration, remittances, and agricultural productivity in China. American Economic Review, 89(2): 287–291.
12. Qin, H. 2010. Rural-to-urban labor migration, household livelihoods, and the rural environment in Chongqing Municipality, Southwest China. Human Ecology, 38(5): 675–690.
13. Démurger, S. & Li, S. 2013. Migration, remittances, and rural employment patterns: Evidence from China. In C. Giulietti, K.Tatsiramos & K.F. Zimmermann, eds. Labor Market Issues in China, pp. 31–63. Research in Labor Economics, Volume 37. Bingley, UK, Emerald Group Publishing Limited.
14. Lacroix, T. 2011. Migration, rural development, poverty and food security. A comparative perspective. Oxford, University of Oxford.
| 167 |

15. OECD. 2017. Interrelations between public policies, migration and development. Paris, OECD Publishing.
16. FAO. 2017. The State of Food and Agriculture 2017: Leveraging food systems for inclusive rural transformation. Rome (also available at http://www.fao.org/3/a-i7658e.pdf).
17. FAO. 2011. The State of Food and Agriculture 2010-11. Women in agriculture. Closing the gender gap for development. Rome (also available at http://www.fao.org/3/a-i2050e.pdf).
18. Stanley, V. 2015. Women in agriculture: the impact of male out-migration on women’s agency, household welfare, and agricultural productivity. Washington, DC., World Bank Group.
19. Paris, T., Rola-Rubzen, M.F., Luis, J., Chi, T., Wongsamun, C. & Villaneuva, D. 2010. The consequences of labour out-migration on income, rice productivity and gender roles: synthesis of findings in the Philippines, Thailand and Vietnam. Gender dimensions of agricultural and rural employment: Differentiated pathways out of poverty. Status, trends and gaps, pp. 185–196. Rome, FAO, IFAD & ILO.
20. Chang, H., Dong, X. & MacPhail, F. 2011. Labor migration and time use patterns of the left-behind children and elderly in rural China. World Development, 39(12): 2199–2210.
21. TAJSTAT. 2015. Gender database. Online statistical database. (available at www.stat.tj) Accessed 5 April 2015. Agency on Statistics under the President of the Republic of Tajikistan.
22. Mukhamedova, N. & Wegerich, K. 2018. The feminization of agriculture in post-Soviet Tajikistan. Journal of Rural Studies, 57: 128–139.
23. de Haas, H. & van Rooij, A. 2010. Migration as emancipation? The impact of internal and international migration on the position of women left behind in rural Morocco. Oxford Development Studies, 38(1): 43–62.
24. Su, W., Eriksson, T., Zhang, L. & Bai, Y. 2016. Off-farm employment and time allocation in on-farm work in rural China from gender perspective. China Economic Review, 41: 34–45.
25. Slavchevska, V., Susan, K. & Taivalmaa, S. 2016. Feminization of Agriculture in the Context of Rural Transformations: What is the Evidence? Washington, DC., World Bank.
26. Sando, R.A. 1986. Doing the work of two generations: The impact of out-migration on the elderly in rural Taiwan. Journal of Cross-Cultural Gerontology, 1(2): 163–175.
27. Hull, J.R. 2007. Migration, remittances and monetization of farm labor in subsistence sending areas. Asian and Pacific Migration Journal, 16(4): 451–484.
28. Vasco, C. 2011. The impact of international migration and remittances on agricultural production patterns, labor relationships and entrepreneurship: The case of rural Ecuador. Kassel, Kassel University Press GmbH.
29. Hossain, I. 2011. A rapid situation assessment of migration and remittances and their impact on food security, agriculture and rural development. Thakurgeon, Ramphal Centre, FAO.
30. Poggi, C. 2018. Migration, its dynamics and aspirations: A review of Migrating out of Poverty. Background paper prepared for The State of Food and Agriculture 2018: Migration, agriculture and rural development. University of Sussex. Unpublished.
31. Miluka, J., Carletto, G., Davis, B. & Zezza, A. 2010. The vanishing farms? The impact of international migration on Albanian family farming. The Journal of Development Studies, 46(1): 140–161.
32. de Brauw, A. 2010. Seasonal migration and agricultural production in Vietnam. The Journal of Development Studies, 46(1): 114–139.
33. David, A. & Lenoël, A. 2016. International emigration and the labour market outcomes of women staying behind – The case of Morocco. AFD.
34. FAO RYM. 2018. Rural migration in Tunisia. Drivers and patterns of rural youth migration and its impact on food security and rural livelihoods in Tunisia. FAO Research Report. Rome, FAO & European University Institute, Robert Schuman Centre for Advanced Studies, Migration Policy Centre.
35. Azam, J.-P. & Gubert, F. 2006. Migrants’ remittances and the household in Africa: A review of evidence. Journal of African Economies, 15(suppl_2): 426–462.
36. Samaratunga, P. & Jayaweera, R. 2011. Impact of migration and remittances on agriculture and food security: Case of Sri Lanka. London, Ramphal Centre, FAO.
37. OECD. 2017. Interrelations between public policies, migration and development in Armenia. Paris, OECD Publishing.
38. OECD. 2017. Interrelations between public policies, migration and development in Georgia. Paris, OECD Publishing.
39. Banerjee, A., Breza, E., Duflo, E. & Kinnan, C. 2015. Do credit constraints limit entrepreneurship? Heterogeneity in the returns to microfinance. Evanston, Northwestern University, Department of Economics.
40. Karlan, D., Osei, R., Osei-Akoto, I. & Udry, C. 2014. Agricultural decisions after relaxing credit and Risk Constraints. The Quarterly Journal of Economics, 129(2): 597–652.
REFERENCES
| 168 |

41. Mendola, M. 2008. Migration and technological change in rural households: Complements or substitutes? Journal of Development Economics, 85(1): 150–175.
42. Yang, D. 2008. International migration, remittances and household investment: Evidence from Philippine migrants’ exchange rate shocks*. The Economic Journal, 118(528): 591–630.
43. de Brauw, A. & Giles, J. 2008. Migrant labor markets and the welfare of rural households in the developing world: Evidence from China. The World Bank Economic Review, 32(1): 1–18.
44. de Brauw, A., Mueller, V. & Lee, H.L. 2014. The role of rural–urban migration in the structural transformation of sub-Saharan Africa. World Development, 63: 33–42.
45. Tuladhar, R., Sapkota, C. & Adhikari, N. 2014. Effects of migration and remittance income on Nepal’s agriculture yield. Asian Development Bank.
46. Huy, H.T. & Nonneman, W. 2016. Economic effects of labor migration on agricultural production of farm households in the Mekong River Delta region of Vietnam. Asian and Pacific Migration Journal, 25(1): 3–21.
47. Li, L., Wang, C., Segarra, E. & Nan, Z. 2013. Migration, remittances, and agricultural productivity in small farming systems in Northwest China. China Agricultural Economic Review, 5(1): 5–23.
48. Taylor, J.E., Rozelle, S. & de Brauw, A. 2003. Migration and incomes in source communities: A new economics of migration perspective from China. Economic Development and Cultural Change, 52(1): 75–101.
49. Gray, C.L. 2009. Rural out-migration and smallholder agriculture in the southern Ecuadorian Andes. Population and Environment, 30(4–5): 193–217.
50. Taylor, J.E. & Lopez-Feldman, A. 2010. Does migration make rural households more productive? Evidence from Mexico. The Journal of Development Studies, 46(1): 68–90.
51. Thomas-Hope, E. 2011. Jamaica Country Study on migration and development. London, Ramphal Centre, FAO.
52. Abdelmoneim, Y. & Litchfield, J. 2016. Does migration improve living standards of migrant-sending households? Evidence from rural Ethiopia. Working Paper 41. Brighton, Migrating out of Poverty Research Programme Consortium, University of Sussex.
53. Croll, E.J. & Ping, H. 1997. Migration for and against agriculture in eight Chinese villages. The China Quarterly, 149: 128–146.
54. Qin, H. & Liao, T.F. 2016. Labor out-migration and agricultural change in rural China: A systematic review and meta-analysis. Journal of Rural Studies, 47: 533–541.
55. de Haan, A. 1999. Livelihoods and poverty: The role of migration – a critical review of the migration literature. The Journal of Development Studies, 36(2): 1–47.
56. Housen, T., Hopkins, S. & Earnest, J. 2012. A systematic review on the impact of internal remittances on poverty and consumption in developing countries: Implications for policy. Population, Space and Place, 19(5): 610–632.
57. Mendola, M. 2010. Rural out-migration and economic development at origin: A review of the evidence. Journal of International Development, 24(1): 102–122.
58. Adams JR, R.H. 2011. Evaluating the economic impact of international remittances on developing countries using household surveys: A literature review. The Journal of Development Studies, 47(6): 809–828.
59. Tsiko. 2009. Impact of migration on food security in Chiredzi, Zimbabwe. Volens Africa.
60. Zezza, A., Carletto, C., Davis, B. & Winters, P. 2011. Assessing the impact of migration on food and nutrition security. Food Policy, 36(1): 1–6.
61. Bryan, G., Chowdhury, S. & Mobarak, A.M. 2014. Underinvestment in a profitable technology: The case of seasonal migration in Bangladesh. Econometrica, 82(5): 1671–1748.
62. Nguyen, M.C. & Winters, P. 2011. The impact of migration on food consumption patterns: The case of Vietnam. Food Policy, 36(1): 71–87.
63. Manivong, V., Cramb, R. & Newby, J. 2014. Rice and remittances: Crop intensification versus labour migration in southern Laos. Human Ecology, 42(3): 367–379.
64. Choithani, C. 2017. Understanding the linkages between migration and household food security in India. Geographical Research, 55(2): 192–205.
65. Kangmennaang, J., Bezner-Kerr, R. & Luginaah, I. 2018. Impact of migration and remittances on household welfare among rural households in Northern and Central Malawi. Migration and Development, 7(1): 55–71.
66. FAO, IFAD, IOM & WFP. 2018. The Linkages between Migration, Agriculture, Food Security and Rural Development. Rome.
67. Carletto, C., Covarrubias, K. & Maluccio, J.A. 2011. Migration and child growth in rural Guatemala. Food Policy, 36(1): 16–27.
| 169 |

68. de Brauw, A. 2011. Migration and child development during the food price crisis in El Salvador. Food Policy, 36(1): 28–40.
69. Azzarri, C. & Zezza, A. 2011. International migration and nutritional outcomes in Tajikistan. Food Policy, 36(1): 54–70.
70. Ruel, M.T. & Alderman, H. 2013. Nutrition-sensitive interventions and programmes: how can they help to accelerate progress in improving maternal and child nutrition? The Lancet, 382(9891): 536–551.
71. Gibson, J., McKenzie, D. & Stillman, S. 2011. What happens to diet and child health when migration splits households? Evidence from a migration lottery program. Food Policy, 36(1): 7–15.
72. Chikaire, J.U., Anyoha, N.O. & Atoma, C.N. 2014. Effects of male labour rural to urban migration on women farmers left-behind in Imo State Nigeria. The Journal of Agriculture and Natural Resources Sciences, 1(1): 18–27.
73. de Brauw, A. & Mu, R. 2011. Migration and the overweight and underweight status of children in rural China. Food Policy, 36(1): 88–100.
74. Chen, F., Liu, H., Vikram, K. & Guo, Y. 2015. For better or worse: The health implications of marriage separation due to migration in Rural China. Demography, 52(4): 1321–1343.
75. Song, Q. 2017. Aging, and separation from children: The health implications of adult migration for elderly parents in rural China. Demographic Research, 37: 1761–1792.
76. Lu, Y. 2012. Household migration, social support, and psychosocial health: The perspective from migrant-sending areas. Social Science & Medicine, 74(2): 135–142.
77. Lu, Y., Hu, P. & Treiman, D.J. 2012. Migration and depressive symptoms in migrant-sending areas: findings from the survey of internal migration and health in China. International Journal of Public Health, 57(4): 691–698.
78. Graham, E., Jordan, L.P. & Yeoh, B.S.A. 2015. Parental migration and the mental health of those who stay behind to care for children in South-East Asia. Social Science & Medicine, 132: 225–235.
79. Edwards, A.C. & Ureta, M. 2003. International migration, remittances, and schooling: evidence from El Salvador. Journal of Development Economics, 72(2): 429–461.
80. Theoharides, C. 2017. Manila to Malaysia, Quezon to Qatar: International migration and its effects on origin-country human capital. Journal of Human Resources: 0216–7714R1.
81. Elbadawy, A. & Roushdy, R. 2010. Impact of international migration and remittances on child schooling and child work: The case of Egypt. Washington, DC., World Bank.
82. McKenzie, D. & Rapoport, H. 2011. Can migration reduce educational attainment? Evidence from Mexico. Journal of Population Economics, 24(4): 1331–1358.
83. de Brauw, A. & Giles, J. 2017. Migrant Opportunity and the Educational Attainment of Youth in Rural China. Journal of Human Resources, 52(1): 272–311.
84. Zuccotti, C., Geddes, A., Bacchi, A., Nori, M. & Stojanov, R. 2018. Rural Migration in Tunisia. Drivers and patterns of rural youth migration and its impact on food security and rural livelihoods in Tunisia. Rome, FAO.
85. Rashid, S.R. & Sikder, J.U. 2016. Choosing a life: Remittances and youth aspirations in Bangladeshi villages. Migrating out of Poverty RPC Working Paper No. 40. Brighton, Migrating out of Poverty Consortium, University of Sussex.
86. Gaibazzi, P. 2013. Cultivating hustlers: The agrarian ethos of Soninke migration. Journal of Ethnic and Migration Studies, 39(2): 259–275.
87. Temudo, M. & Abrantes, M. 2015. The pen and the plough: Balanta Young Men in Guinea-Bissau. Development and Change, 46(3): 464–485.
88. Yang, D. & Choi, H. 2007. Are remittances insurance? Evidence from rainfall shocks in the Philippines. The World Bank Economic Review, 21(2): 219–248.
89. Rosenzweig, M.R. & Stark, O. 1989. Consumption smoothing, migration, and marriage: Evidence from rural India. Journal of Political Economy, 97(4): 905–926.
90. Arouri, M. & Nguyen, C.V. 2017. Does international migration affect labor supply, non-farm diversification and welfare of households? Evidence from Egypt. International Migration, 56(1): 39–62.
91. Osili, U.O. 2004. Migrants and housing investments: Theory and evidence from Nigeria. Economic Development and Cultural Change, 52(4): 821–849.
92. Dinkelman, T., Kumchulesi, G. & Mariotti, M. 2017. Labor migration, capital accumulation, and the structure of rural labor markets. Working Paper.
93. Quisumbing, A. & McNiven, S. 2010. Moving forward, looking back: the impact of migration and remittances on assets, consumption, and credit constraints in the rural Philippines. The Journal of Development Studies, 46(1): 91–113.
REFERENCES
| 170 |

94. Du, Y., Park, A. & Wang, S. 2005. Migration and rural poverty in China. Journal of Comparative Economics, 33(4): 688–709.
95. Adams, R.H. 1991. The economic uses and impact of international remittances in rural Egypt. Economic Development and Cultural Change, 39(4): 695–722.
96. Adams, R.H. & Cuecuecha, A. 2013. The impact of remittances on investment and poverty in Ghana. World Development, 50: 24–40.
97. Taylor, J.E. & Dyer, G.A. 2009. Migration and the sending economy: A disaggregated rural economy-wide analysis. The Journal of Development Studies, 45(6): 966–989.
98. Akram, A.A., Chowdhury, S. & Mobarak, A.M. 2017. Effects of emigration on rural labor markets. NBER Working Paper No. 23929. Cambridge, USA, National Bureau of Economic Research.
99. Murphy, R. 2002. How migrant labor is changing rural China. Cambridge University Press. 310 pp.
100. Ma, Z. 2002. Social-capital mobilization and income returns to entrepreneurship: The case of return migration in rural China. Environment and Planning A: Economy and Space, 34(10): 1763–1784.
101. Démurger, S. & Xu, H. 2011. Return migrants: The rise of new entrepreneurs in Rural China. World Development, 39(10): 1847–1861.
102. Zhao, Y. 2002. Causes and consequences of return migration: Recent evidence from China. Journal of Comparative Economics, 30(2): 376–394.
103. Chunyu, M.D., Liang, Z. & Wu, Y. 2013. Interprovincial return migration in China: Individual and contextual determinants in Sichuan Province in the 1990s. Environment and Planning A: Economy and Space, 45(12): 2939–2958.
104. Ma, Z. 2001. Urban labour-force experience as a determinant of rural occupation change: evidence from recent urban-rural return migration in China. Environment and Planning A: Economy and Space, 33(2): 237–255.
105. Murphy, R. 2000. Return migration, entrepreneurship and local state corporatism in rural China: The experience of two counties in south Jiangxi. Journal of Contemporary China, 9(24): 231–247.
106. Wahba, J. & Zenou, Y. 2012. Out of sight, out of mind: Migration, entrepreneurship and social capital. Regional Science and Urban Economics, 42(5): 890–903.
107. Collyer, M. 2004. The development impact of temporary international labour migration on southern Mediterranean sending countries: Contrasting examples of Morocco and Egypt. Brighton, Sussex Centre for Migration Research.
108. Ajaero, C.K. & Onokala, P.C. 2013. The effects of rural-urban migration on rural communities of southeastern Nigeria. International Journal of Population Research.
109. Reichert, J. 1981. The migrant syndrome: Seasonal U.S. wage labor and rural development in central Mexico. Human Organization, 40(1): 56–66.
110. Pizzi, E. 2017. Does labor migration improve access to public goods in source communities? Evidence from rural China. Journal of Chinese Political Science: 1–21.
111. Chakraborty, T., Mirkasimov, B. & Steiner, S. 2015. Transfer behavior in migrant sending communities. Journal of Comparative Economics, 43(3): 690–705.
112. Gallego, J.M. & Mendola, M. 2013. Labour migration and social networks participation in southern Mozambique. Economica, 80(320): 721–759.
113. Nikolova, M., Roman, M. & Zimmermann, K.F. 2017. Left behind but doing good? Civic engagement in two post-socialist countries. Journal of Comparative Economics, 45(3): 658–684.
114. Barham, B. & Boucher, S. 1998. Migration, remittances, and inequality: estimating the net effects of migration on income distribution. Journal of Development Economics, 55(2): 307–331.
115. de Haas, H.G. 2003. Migration and development in southern Morocco: The disparate socio-economic impacts of out-migration on the Todgha Oasis Valley. Nijmegen, Radboud University. (Dissertation)
116. Zhu, N. & Luo, X. 2010. The impact of migration on rural poverty and inequality: a case study in China. Agricultural Economics, 41(2): 191–204.
117. Hornbeck, R. & Naidu, S. 2014. When the levee breaks: Black migration and economic development in the American South. American Economic Review, 104(3): 963–990.
118. de Brauw, A., Huang, J., Zhang, L. & Rozelle, S. 2013. The feminisation of agriculture with Chinese characteristics. The Journal of Development Studies, 49(5): 689–704.
119. China Statistical Press. 2010. China Statistical Yearbook. Beijing.
120. Boyer, G.R., Hatton, T.J. & O’Rourke, K. 1994. The impact of emigration on real wages in Ireland, 1850-1914. In T.J. Hatton and J.G. Williamson, eds. Migration and the international labor market, 1850-1939, pp. 221-239, Routledge.
121. Adamopoulos, T., Brandt, L., Leight, J. & Restuccia, D. 2017. Misallocation, selection and productivity: A quantitative analysis with panel data from China. NBER Working Paper No. 23039. Cambridge, USA, National Bureau of Economic Research.
| 171 |

122. Orozco, M., Lowell, B.L., Bump, M. & Fedewa, R. 2005. Transnational engagement, remittances and their relationship to development in Latin America and the Caribbean. Washington, DC., Institute for the Study of International Migration, Georgetown University.
123. Batres-Marquez, S.P., Jensen, H. & Brester, G. 2003. Salvadoran consumption of ethnic foods in the United States. Journal of Food Distribution Research, 34(2): 1–16.
124. Rogers, T. & Morrison, J. 2010. Agriculture for Growth. Learning from experience in the Pacific. Rome, FAO.
125. Debass, T. & Orozco, M. 2008. Digesting Nostalgic Trade: A Prequel to a Value Chain Approach. Paper presented at Linking Small Firms to Competitiveness Strategies Breakfast Seminar Series sponsored by the USAID Microenterprise Development office, 20 November 2008, Inter-American Dialogue, Washington, DC. [Cited 28 March 2018]. https://www.marketlinks.org/library/digesting-nostalgic-trade-prequel-value-chain-approach-screencast-and-presentation
126. Newland, K. & Taylor, C. 2010. Heritage tourism and nostalgia trade: A diaspora niche in the development landscape. Washington, DC., USAID Diasporas & Development Policy Project, Migration Policy Institute.
127. Sánchez Cantillo, M.V. 2009. Trade policy reform and poverty: Successes and failures in Central America. CEPAL Review 98: 65–82.
128. Kälin, W. & Chapuisat, H. 2017. Breaking the impasse. Reducing protracted internal displacement as a collective outcome. OCHA Policy and Studies Series. Rome, United Nations.
129. FAO. 2016. Migration and protracted crises. Addressing the root causes and building resilient agricultural livelihoods. Rome, FAO (also available at http://www.fao.org/3/a-i6101e.pdf)
130. FAO, IFAD, UNICEF, WFP & WHO. 2017. The State of Food Security and Nutrition in the World 2017. Building resilience for peace and food security. Rome, FAO (also available at http://www.fao.org/3/a-I7695e.pdf)
131. OECD. 2016. States of Fragility 2016: Understanding Violence. Paris, OECD Publishing (also available at http://dx.doi.org/ 10.1787/9789264267213-en)
132. International Crisis Group. 2017. Herders against Farmers: Nigeria’s Expanding Deadly Conflict. In: International Crisis Group (online). [Cited 25 January 2018]. https://www.crisisgroup.org/africa/west-africa/nigeria/252-herders-against-farmers-nigerias-expanding-deadly-conflict
133. FAO. 2016. Peace and food security. Investing in resilience to sustain rural livelihoods amid conflict. Rome (also available at http://www.fao.org/3/a-i5591e.pdf)
134. Grijalva-Eternod, C.S., Wells, J.C.K., Cortina-Borja, M., Salse-Ubach, N., Tondeur, M.C., Dolan, C., Meziani, C., Wilkinson, C., Spiegel, P. & Seal, A.J. 2012. The double burden of obesity and malnutrition in a protracted emergency setting: A cross-sectional study of Western Sahara refugees. PLOS Medicine, 9(10): e1001320.
135. Khara, T., Mwangome, M., Ngari, M. & Dolan, C. 2018. Children concurrently wasted and stunted: A meta-analysis of prevalence data of children 6–59 months from 84 countries. Maternal & Child Nutrition, 14(2): 1–7.
136. Cherri, Z., Arcos González, P. & Castro Delgado, R. 2016. The Lebanese–Syrian crisis: impact of influx of Syrian refugees to an already weak state. Risk Management and Healthcare Policy, 9: 165–172.
137. FAO. 2016. Emergency vaccination against transboundary animal diseases in Lebanon. Animal disease control to support resilient livelihoods in protracted crisis. Rome (also available at http://www.fao.org/ 3/a-i5746e.pdf).
138. WFP. 2017. Refugee influx Emergency Vulnerability Assessment (REVA) – Summary Report. Cox’s Bazar, Bangladesh, December 2017. Rome.
139. FSIN. 2018. Global report of food crises 2018. Rome.
140. Betts, A., Bloom, L., Kaplan, J. & Omata, N. 2014. Refugee economies. Rethinking popular assumptions. Oxford, Humanitarian Innovation Project.
141. Sanghi, A., Onder, H. & Vemurui, V. 2016. ‘Yes’ in My Backyard? The Economics of Refugees and Their Social Dynamics in Kakuma, Kenya. Washington, DC., World Bank and UNHCR.
142. Taylor, J.E., Filipski, M.J., Alloush, M., Gupta, A., Rojas Valdes, R.I. & Gonzalez-Estrada, E. 2016. Economic impact of refugees. Proceedings of the National Academy of Sciences, 113(27): 7449–7453.
143. UNHCR. 2017. UNHCR Projected Global Resettlement Needs 2018. 23rd Annual Tripartite Consultations on Resettlement. Geneva, UNHCR Resettlement Service.
144. UNHCR. 2003. Framework for durable solutions for refugees and persons of concern. Geneva, UNHCR Core Group on Durable Solutions.
145. UNHCR. 2013. The Integration of Resettled Refugees. Essentials for establishing a resettlement programme and fundamentals for sustainable resettlement programs. Geneva, UNHCR Resettlement Service.
146. HAFA. 2018. Hmong American Farmers Association | Our Story [online]. [Cited 20 February 2018]. http://www.hmongfarmers.com/story/
REFERENCES
| 172 |

147. Mohamud, Y. 2017. How Minnesota’s Hmong American farmers got organized. In: MinnPost [online]. [Cited 20 February 2018]. https://www.minnpost.com/community-sketchbook/2017/11/how-minnesotas-hmong-american-farmers-got-organized
148. ORR. 2017. Refugee Agricultural Partnership Program. In: U.S. Department of Health & Human Services, Administration for Children & Families (ACF), Office of Refugee Resettlement (ORR) [online]. [Cited 20 February 2018]. https://www.acf.hhs.gov/orr/resource/refugee-agricultural-partnership-program
149. ORR. 2012. IRC’s New Roots: A Growing Partnership with RAPP. In: U.S. Department of Health & Human Services, Administration for Children & Families (ACF), Office of Refugee Resettlement (ORR) [online]. [Cited 20 February 2018]. https://www.acf.hhs.gov/orr/resource/ircs-new-roots-a-growing-partnership-with-rapp
150. Collier, P., Hoeffler, A. & Söderbom, M. 2008. Post-Conflict Risks. Journal of Peace Research, 45(4): 461–478.
151. Hugo, G. & Morén-Alegret, R. 2008. International migration to non-metropolitan areas of high income countries: editorial introduction. Population, Space and Place, 14(6): 473–477.
152. Nori, M., Ragkos, A. & Farinella, D. 2017. Agro-Pastoralism as an asset for sustainable Mediterranean islands. In K. Jurcevic, L.K. Lipovcan & O. Ramljak, eds. Imaging the Mediterranean: challenges and perspectives. Vis, Croatia. Institute of Social Sciences Ivo Pilar – VERN Group.
153. Frances, J., Barrientos, S. & Rogaly, B. 2005. Temporary workers in UK agriculture and horticulture: A study of employment practices in the agriculture and horticulture industries and co-located packhouse and primary food processing sectors. London, Precision Prospecting for the Department of Environment, Food and Rural Affairs (DEFRA).
154. Caruso, F. & Corrado, A. 2015. Migrazioni e lavoro agricolo: un confronto tra Italia e Spagna in tempi di crisi. In M. Colucci & S. Gallo, eds. Tempo di cambiare. Rapporto 2015 sulle migrazioni interne in Italia, pp. 58-77. Rome, Donizelli.
155. Kasimis, C. 2005. Migrants in the rural economies of Greece and southern Europe. In: Migration Policy Institute [online]. https://www.migrationpolicy.org/article/migrants-rural-economies-greece-and-southern-europe
156. Fonseca, M.L. 2008. New waves of immigration to small towns and rural areas in Portugal. Population, Space and Place, 14(6): 525–535.
157. Nori, M. 2017. The shades of green: Migrants’ contribution to EU agriculture. Context, trends, opportunities, challenges. Florence, Migration Policy Centre.
158. Preibisch, K. 2010. Pick-your-own labor: Migrant workers and flexibility in Canadian agriculture. International Migration Review, 44(2): 404–441.
159. Anonymous. 2017. If America is overrun by low-skilled migrants... - The market for lemons. The Economist [online]. [Cited 16 January 2018]. https://www.economist.com/news/united-states/21725608-then-why-are-fruit-and-vegetables-rotting-fields-waiting-be-picked-if-america
160. Robinson, S., Hinojosa-Ojeda, R. & Thierfelder, K. 2017. NAFTA and immigration: Linked labor markets and the impact of policy changes on the U.S. economy. Washington, DC., Peterson Institute for International Economics and International Food Policy Research Institute.
161. Dramski, P. 2017. On the clock. How immigrants fill gaps in the labor market by working nontraditional hours. New York, New American Economy.
162. Peri, G. 2008. Immigration accounting: U.S. States: 1960–2006. CReAM Discussion Paper No 05/08. London, Centre for Research and Analysis of Migration.
163. Peri, G. & Sparber, C. 2008. Task specialization, immigration, and wages. CReAM Discussion Paper Series 0802. London, Centre for Research and Analysis of Migration.
164. Mercandalli, S. & Losch, B., eds. 2017. Rural Africa in motion. Dynamics and drivers of migration south of the Sahara. Rome, FAO and CIRAD. 60 pp. (also available at http://www.fao.org/3/I7951EN/i7951en.pdf).
165. OECD. 2018. How Immigrants Contribute to Developing Countries’ Economies. Paris, OECD Publishing.
166. Papadopoulos, A. & Fratsea, L. 2017. Temporary migrant workers in Greek agriculture. Berlin, Heinrich Böll Foundation, International Politics.
167. Lawrence, F. 2011. Spain’s salad growers are modern-day slaves, say charities. The Guardian, 7 February 2011 (also available at https://www.theguardian.com/business/2011/feb/07/spain-salad-growers-slaves-charities).
168. Corrado, A. 2017. Migrant crop pickers in Italy and Spain. E-Paper. Heinrich Böll Foundation.
169. Semprebon, M., Marzorati, R. & Garrapa, A.M. 2017. Governing agricultural migrant workers as an ‘emergency’: Converging approaches in Northern and Southern Italian rural towns. International Migration, 55(6): 200–215.
| 173 |

CHAPTER 5
1. UNDP. 2009. Human Development Report 2009. Overcoming Barriers: Human Mobility and Development. New York.
2. UN General Assembly. 2017. Making migration work for all. Report of the Secretary-General (A/72/643).
3. FAO. 2017. Colombia Resilience Programme 2017-2020. FAO’s commitment to the Peace Agreement and resilience in Colombia. Rome (also available at http://www.fao.org/3/a-i7584e.pdf)
4. FAO. 2018. FAO Representation in Colombia raises its status [online]. [Cited 14 March 2018]. http://www.fao.org/americas/noticias/ver/pt/c/1105733/
5. FAO. 2017. FAO´s role in supporting the implementation of the peace agreement in Colombia: advances and challenges. Paper presented at Side Event during the 40th Session of the FAO Conference, 5 July 2017, Rome, FAO Headquarters.
6. Zavala Gómez Del Campo, R. 2017. Supporting the implementation of the comprehensive rural reform promoting peace-building in Colombia. Paper presented at Side Event during the 40th Session of the FAO Conference, 5 July 2017, Rome, FAO Headquarters.
7. UN General Assembly. 2016. One Humanity, Shared Responsibility. Report of the Secretary-General for the World Humanitarian Summit (A/70/709) [online]. [Cited 25 January 2018]. sgreport.worldhumanitariansummit.org/
8. OECD. 2016. Perspectives on Global Development. International Migration in a Shifting World. Paris, OECD Publishing.
9. OECD. 2011. Tackling the Policy Challenges of Migration: Regulation, Integration, Development. Paris, OECD Publishing.
10. Karfakis, P. 2017. Structural change, employment, and migration. Rome, FAO. Mimeo.
11. Immigration New Zealand. 2018. About this visa : Limited Visa [online]. [Cited 4 May 2018]. https://www.immigration.govt.nz/new-zealand-visas/apply-for-a-visa/about-visa/limited-visa
12. Immigration New Zealand. 2018. Hire a candidate [online]. [Cited 4 May 2018]. https://www.immigration.govt.nz/employ-migrants/hire-a-candidate
13. Winters, L.A. 2016. New Zealand’s recognised seasonal employer scheme: An object lesson in policy making – But for whom? Migrating out of Poverty RPC Working Paper No. 34. Brighton, Migrating out of Poverty Consortium, University of Sussex.
14. Australian Government. 2017. Frequently asked questions about the Seasonal Worker Programme. In: Department of Jobs and Small Business [online]. [Cited 4 May 2018]. https://www.jobs.gov.au/frequently-asked-questions-about-seasonal-worker-programme
15. Government of Canada. 2015. Hire a temporary foreign agricultural worker [online]. [Cited 4 May 2018]. https://www.canada.ca/en/employment-social-development/services/foreign-workers/agricultural/seasonal-agricultural.html
16. Government of Canada. 2016. Agricultural workers – Work temporarily in Canada. In: aem [online]. [Cited 4 May 2018]. https://www.canada.ca/en/immigration-refugees-citizenship/services/work-canada/permit/agricultural-workers-work-temporarily.html
17. Government of Canada. 2015. Agreement for the Employment in Canada of Seasonal Agricultural Workers from Mexico - 2016 [online]. [Cited 4 May 2018]. https://www.canada.ca/en/employment-social-development/services/foreign-workers/agricultural/seasonal-agricultural/apply/mexico.html
18. Council of the European Union. 2014. Council adopts directive on third-country seasonal workers. Brussels. Press release 65.
19. European Union. 2014. Directive 2014/36/EU of 26 February 2014 on the Conditions of Entry and Stay of Third-Country Nationals for the Purpose of Employment as Seasonal Workers. Official Journal of the European Union (also available at http://eur-lex.europa.eu/legal-content/EN/TXT/PDF/?uri=CELEX:32014L0036&from=EN).
20. OECD. 2017. Interrelations between Public Policies, Migration and Development. Paris, OECD Publishing.
21. IOM. 2017. Extended Migration Profile of the Republic of Moldova 2009-2014. Chisinau.
22. Martinez, M., Giraldo, P., Nizami, S., Castro, H., Hassan, S., Durakovic, N. & Zarul, A. 2015. PARE 1+1: Improving Moldova’s Remittance-Based Investment Program. Workshop in Development Practice Project Report. New York, School of International and Public Affairs, Columbia University.
REFERENCES
| 174 |

2018
Migration is an expanding global reality, one that allows millions of people to seek new opportunities. But it also involves challenges for migrants and for societies, both in areas of origin and of destination. This report analyses migratory flows – internal and international – and how they are linked to processes of economic development, demographic change, and natural-resource pressure. The focus is on rural migration, the many forms it takes and the important role it plays in both developing and developed countries.
The report investigates the drivers and impacts of rural migration and highlights how related policy priorities depend on country contexts that are in continuous evolution. These priorities will be different for countries in protracted crises, countries where rural youth employment is a challenge, countries in economic and demographic transition, and developed countries in need of migrant workers, not least to support agriculture and rural economies.
THE STATE OF FOOD AND
AGRICULTUREMIGRATION, AGRICULTUREAND RURAL DEVELOPMENT
THE STATE OFTHE WORLD
I9549EN/1/10.18
ISBN 978-92-5-130568-3
9 7 8 9 2 5 1 3 0 5 6 8 3
ISSN 0081-4539