THE STATE OF CANADA’S FORESTScfs.nrcan.gc.ca/pubwarehouse/pdfs/31835.pdf · ISBN...
50
THE STATE OF CANADA’S FORESTS ANNUAL REPORT ANNUAL REPORT
Transcript of THE STATE OF CANADA’S FORESTScfs.nrcan.gc.ca/pubwarehouse/pdfs/31835.pdf · ISBN...

THE STATE OF CANADA’S FORESTS
ANNUAL REPORTANNUAL REPORT

Information contained in this publication or product may be reproduced, in part or in whole, and by any means, for personal or public non-commercial purposes, without charge or further permission, unless otherwise specified.
You are asked to:
- exercise due diligence in ensuring the accuracy of the materials reproduced;
- indicate the complete title of the materials reproduced, and the name of the author organization; and
- indicate that the reproduction is a copy of an official work that is published by the Government of Canada and that the reproduction has not been produced in affiliation with, or with the endorsement of, the Government of Canada.
Commercial reproduction and distribution is prohibited except with written permission from the Government of Canada’s copyright administrator, Public Works and Government Services Canada (PWGSC). For more information, contact PWGSC at 613-996-6886 or at [email protected].
© Her Majesty the Queen in Right of Canada, 2010Cat. No. Fo1-6/2010E (Print)ISBN 978-1-100-16504-2Cat. No. Fo1-6/2010E-PDF (Online)ISBN 978-1-100-16505-9
The National Library of Canada has catalogued this publication as follows: Main entry under title: State of Canada’s Forests... Annual. Description based on 1991- Issued also in French under title: L’État des forêts au Canada. Bibliographic address varies: 1993- , Canadian Forest Service. Issued also on the Internet. Subtitle varies. ISSN 1196-1589
1. Forests and forestry—Canada—Periodicals. 2. Forest policy—Canada—Periodicals. I. Canada. Forestry Canada. II. Canadian Forest Service.
SD13.S72 634.9’0871’05
Copies of this publication may be obtained free of charge from:PublicationsNatural Resources Canadac/o St. Joseph CommunicationsOrder Processing Unit1165 Kenaston StreetPO Box 9809 Station TOttawa ON K1G 6S1Telephone: 1-800-387-2000 (toll-free)Fax: 613-740-3114TTY: 613-996-4397 (teletype for the hearing-impaired)
Email: [email protected]: canadaforests.nrcan.gc.ca
Cover and inside photos: Mike Grandmaison“Why Science Matters” photo: Canadian Space Agency“Bio-pathways Project” photo: Natural Resources Canada, CanmetENERGY
Recycled Paper

A N N U A L R E P O R T 2 0 1 0i
This edition of The State of Canada’s Forests marks a special anniversary: the twentieth year the federal government has produced an annual report on the nation’s forests and forest sector. The occasion is significant since it
demonstrates our ongoing commitments to keep Canadians fully informed about the state of our forests today, and to help shape a common vision and new approaches for tomorrow.
Each year, this authoritative report provides key facts and a complete, up-to-date collection of statistics from across the country, together with expert analysis. In addition, The State of Canada’s Forests offers an objective assessment of the strength and sustainability of our forest resources and industry.
This year, readers can learn at canadaforests.nrcan.gc.ca how the sector is reinventing itself by embracing innovative green technologies that allow more value to be extracted from the forest with less impact on the environment. This transformation is essential since, in today’s global economy, success in world markets means addressing the practical requirements of environmental responsibility.
The Government of Canada is accelerating the industry’s transformation and is supporting its workers and communities by helping to open up new paths to success. Budget 2010 dedicated $100 million to the development of advanced clean energy technologies and new bioproducts, and the $1-billion Pulp and Paper Green Transformation
Program is helping the sector improve its energy efficiency. Through these and other initiatives, our government is showing the world that environmental performance is not only good for the health of the forest but also provides a competitive advantage.
Through the Economic Action Plan, the Government of Canada is also supporting transformation by investing $170 million through the Canada Wood Export Program, the North American Wood First Initiative and the Value to Wood Program, in addition to funding large-scale wood demonstration projects in offshore and domestic markets. As well, the Community Adjustment Fund has directed more than $209 million to such projects as the First Nations Youth Forestry Training Program in British Columbia, the Community Reforestation Program in Alberta and various silviculture agreements in Quebec.
Through this government’s ongoing commitment to innovative research by Natural Resources Canada’s Canadian Forest Service, FPInnovations, the Canadian Wood Fibre Centre and other specialized agencies and partnerships, Canada is developing the technologies needed to support and drive the changes reshaping the forest sector.
Some of these changes are described in the following pages and in detail online. I sincerely hope you find The State of Canada’s Forests 2010 to be an informative overview of the nation’s forest sector—a sector that is well-equipped to compete in a constantly evolving global marketplace.
The Honourable Christian Paradis, P.C., M.P. Minister of Natural Resources
MEssAgE fROM ThE MiNisTERof Natural resources


ContentsMessage froM the Minister of natural resources ................................................ i
executive suMMary ................................................................................................. 3
Key facts .................................................................................................................. 7
statistical profiles ....................................................................................................9
sustainability indicators ...................................................................................... 21
Mill curtailMents, investMents and acquisitions in the canadian forest industry ......................................................................... 41
A n n U A L R e P o R t 2 0 1 01
W e b F e a t u r e S
At canadaforests.nrcan.gc.ca, read about “Why Science Matters.” This feature article examines the applicationof science in the forest sector; a sector which is complex and has many specialties and players involved. Science in the forest sector is solutions-oriented; it supports competitive industries, supports standards and market access and informs government decision-making and action.
“Bio-pathways Project.” This feature article introduces a project designedto explore how Canada’s forest sector can be a major player in the emerging bioeconomy. Key to the forest sector’s success will be to find the best products and technologies to invest in. “Best” means those that deliver the right mix of financial, social and environmental benefits.

t H e s t A t e o F C A n A D A ’ s F o R e s t s2
3A n n U A L R e P o R t 2 0 1 0
eXeCUtIVe sUMMARY
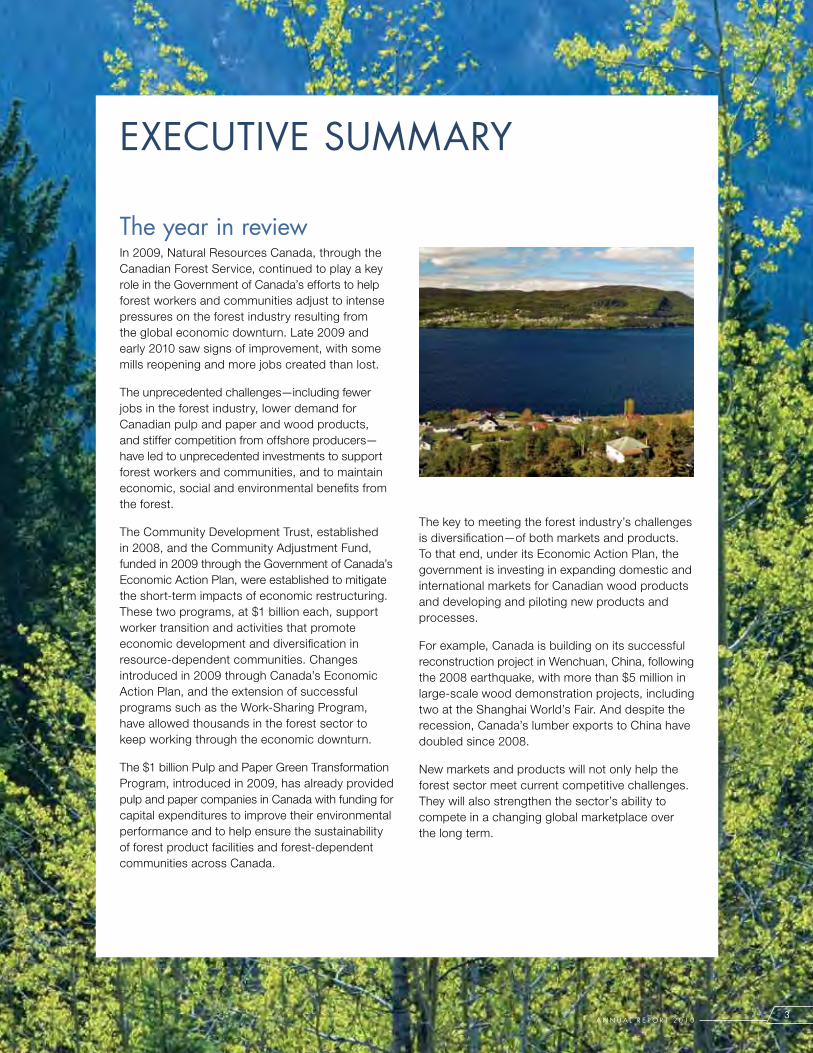
the year in reviewIn 2009, Natural Resources Canada, through the Canadian Forest Service, continued to play a key role in the Government of Canada’s efforts to help forest workers and communities adjust to intense pressures on the forest industry resulting from the global economic downturn. Late 2009 and early 2010 saw signs of improvement, with some mills reopening and more jobs created than lost.
The unprecedented challenges—including fewer jobs in the forest industry, lower demand for Canadian pulp and paper and wood products, and stiffer competition from offshore producers—have led to unprecedented investments to support forest workers and communities, and to maintain economic, social and environmental benefits from the forest.
The Community Development Trust, established in 2008, and the Community Adjustment Fund, funded in 2009 through the Government of Canada’s Economic Action Plan, were established to mitigate the short-term impacts of economic restructuring. These two programs, at $1 billion each, support worker transition and activities that promote economic development and diversification in resource-dependent communities. Changes introduced in 2009 through Canada’s Economic Action Plan, and the extension of successful programs such as the Work-Sharing Program, have allowed thousands in the forest sector to keep working through the economic downturn.
The $1 billion Pulp and Paper Green Transformation Program, introduced in 2009, has already provided pulp and paper companies in Canada with funding for capital expenditures to improve their environmental performance and to help ensure the sustainability of forest product facilities and forest-dependent communities across Canada.
The key to meeting the forest industry’s challenges is diversification—of both markets and products. To that end, under its Economic Action Plan, the government is investing in expanding domestic and international markets for Canadian wood products and developing and piloting new products and processes.
For example, Canada is building on its successful reconstruction project in Wenchuan, China, following the 2008 earthquake, with more than $5 million in large-scale wood demonstration projects, including two at the Shanghai World’s Fair. And despite the recession, Canada’s lumber exports to China have doubled since 2008.
New markets and products will not only help the forest sector meet current competitive challenges. They will also strengthen the sector’s ability to compete in a changing global marketplace over the long term.

t H e s t A t e o F C A n A D A ’ s F o R e s t s 4
the Bio-pathways ProjectOne factor driving the development of new products and processes is the growing international demand for eco-friendly sources of energy and technologies to reduce greenhouse gas emissions. Of particular interest to the forest sector are renewable energy technologies that use wood fibre. Many forest product firms are already investing in technologies that will help their mills rely less on fossil fuels and more on forest fibre as a fuel. Some firms plan to expand their revenue stream by selling green energy to local utility grids.
In 2009, the Forest Products Association of Canada, FPInnovations and the Canadian Forest Service of Natural Resources Canada, along with other partners, collaborated on the Bio-pathways Project to determine which bioenergy developments have the most potential to transform the forest industry. Partners used industry and technology expertise and economic analysis to evaluate options from three perspectives: financial, socio-economic and environmental. (For more information on the Bio-pathways Project, see the related articles on the Canada’s Forests website.)
The project confirmed, that at the heart of any bioenergy business, there must be a solid and profitable wood products industry: one business will not simply replace the other. Canada’s forest products sector will enjoy a strong future if it moves into the bioeconomy, producing bioenergy and other bioproducts.
the science behind diversificationScience underlies the diversification of both markets and products. In fact, most aspects of Canada’s forest sector, from sustainable forest management to global competitiveness, are solidly grounded in science—science that is solutions-oriented and that produces concrete benefits. (For more examples of why science matters to Canada’s forest sector, see the related articles on the Canada’s Forests website.)
Canadians expect their forests to be managed carefully and sustainably. Science plays a major role in all facets of sustainable forest management, including determining harvest schedules and silvicultural treatments, maintaining biodiversity, setting aside protected areas and addressing disturbances like wildfire and pests. Science is especially important in making decisions that will help the forest sector adapt to the uncertain effects of climate change in the future.
Science also plays a key role in Canada’s success as a trading nation. For example, countries want to ensure that any wood they import is free of pests. Canada provides science-based approaches, in compliance with international codes and standards, to ensure that wood exports are pest-free. International codes and standards, based on scientific research, require that wood products be treated to ensure that they are safe for import. In addition, in countries that rely on materials like concrete and steel for residential construction, Canadian lumber can compete only if it can be shown scientifically to meet performance standards, such as being able to withstand hurricanes or earthquakes.
The development of any new value-added product requires research and innovation. The Transformative Technologies Pilot-Scale Demonstration Program, introduced in 2009, funds demonstrations of the most promising new forest products and processes. These include breakthrough technologies in biomass harvesting and conversion, nanotechnology and next-generation forest products. Under this $40-million program, innovative ideas can be advanced to the pilot phase, to be tried out on a small scale in industrial settings. Another new program, Investing in Forest Industry Transformation, introduced early in 2010 supports development, commercialization and implementation of advanced clean energy technologies in the forest sector. Programs like these will help Canada remain at the forefront of developing new forest technologies—a key to creating prosperity, jobs and green products in the emerging bioeconomy.

A n n U A L R e P o R t 2 0 1 05
A brighter futureCanada’s forest sector has faced some difficult years, and the economic, social and environmental challenges are expected to continue. However, the forecast for wood in the medium term is positive, and the leaner sector that has survived these crises will be well positioned in the coming year as prices
begin to pick up. At the same time, forest-dependent communities across the country are looking beyond traditional forest products to new products for the bioeconomy, particularly bioenergy.
With the diversification of its markets and products well underway, Canada’s forest sector can look forward to an increasingly bright future.
t H e s t A t e o F C A n A D A ’ s F o R e s t s6
KeY FACts
society– Most of Canada’s forest land (93%) is publicly
owned—77% under provincial or territorial jurisdiction and 16% under federal purview.
– The rest is on private property belonging to more than 450 000 landowners.
– The provinces and territories have legislative authority over conservation and management of forest resources on provincial/territorial Crown lands.
– The federal government is responsible for matters related to the national economy, trade and international relations, and federal lands and parks. It also has constitutional, treaty, political and legal responsibilities for Aboriginal peoples.
– In 2009, direct employment in the Canadian forest industry fell by 13% compared with 2008.
– For about 200 communities, the forest sector makes up at least 50% of the economic base.
– About 80% of Aboriginal communities are in forested areas.
– Public participation is an important aspect of forest management planning in Canada.
– There were 11.9 million visitors to Canada’s national parks in 2009.
economy– Canada is the world’s largest exporter of forest
products.
– The forest industry’s contribution to Canada’s gross domestic product is about 1.7%.
– The United States is by far the largest buyer of Canadian forest products, 70.6% in 2009.
environment– Canada has 397.3 million hectares of forest,
other wooded land and other land with tree cover, representing 10% of the world’s forest cover and 30% of the world’s boreal forest.
– About 8% of Canada’s forest area is protected by legislation. About 40% of the total forest landbase is subject to varying degrees of protection such as integrated land-use planning or defined management areas such as certified forests.
– Annually, less than 1% of Canada’s forests are harvested.
– By law, all forests harvested on Canada’s public land must be successfully regenerated.
– About 72% of harvested areas on Crown land are regenerated through tree planting and direct seeding, while the remainder is regenerated naturally.
– By December 2009, 142.8 million hectares of Canada’s forests were certified as being sustainably managed by one or more of three globally recognized certification standards.
– Bioenergy now constitutes more than 60% of the total energy used by the forest industry.
7A n n U A L R e P o R t 2 0 1 0

t H e s t A t e o F C A n A D A ’ s F o R e s t s8

9A n n U A L R e P o R t 2 0 1 0
stAtIstICAL PRoFILes
D O M E S T I C E C O N O M I C I M P A C T
Canadian housing starts (SAAR) (2009) 147 600
Capital and repair expenditures (dollars) (2008) 5 247 800 000
Forestry and logging industry 564 900 000
Pulp and paper product manufacturing industry 2 672 300 000
Wood product manufacturing industry 2 010 600 000
Contribution to GDP (constant 2002 dollars) (2009) 19 887 000 000
Forestry and logging industry 3 571 000 000
Pulp and paper product manufacturing industry 8 217 000 000
Wood product manufacturing industry 8 099 000 000
Direct jobs (number) (2009)
Direct jobs (LFS) 238 200
Direct jobs (SEPH) 195 320
New investments (dollars) (2009) 1 574 400 000
Forestry and logging industry 159 000 000
Pulp and paper product manufacturing industry 863 700 000
Wood product manufacturing industry 551 700 000
Revenue from goods manufactured (dollars) (2008) 60 755 549 000
Forestry and logging industry 9 922 835 000
Pulp and paper product manufacturing industry 28 209 635 000
Wood product manufacturing industry 22 623 079 000
Wages and salaries (dollars) (2008) 10 302 669 000
Forestry and logging industry 1 960 610 000
Pulp and paper product manufacturing industry 3 989 116 000
Wood product manufacturing industry 4 352 943 000
F O R E S T P R O D U C T S
Domestic consumption
Lumber – hardwood (cubic metres) (2009) 1 362 501
Lumber – softwood (cubic metres) (2009) 22 290 655
Newsprint (tonnes) (2009) 839 314
Printing and writing paper (tonnes) (2009) 1 487 000
Structural panels (plywood and oriented strandboard) (cubic metres) (2009)
2 853 803
Wood pulp (tonnes) (2009) 9 112 907
Production
Christmas trees (dollars) (2008) 37 507 000
Christmas trees (number) (2008) 1 843 000
Lumber – hardwood (cubic metres) (2009) 813 000
Lumber – softwood (cubic metres) (2009) 44 436 000
Maple products (dollars) (2008) 263 216 000
Maple products (litres) (2008) 27 101 899
Newsprint (tonnes) (2009) 4 378 000
Printing and writing paper (tonnes) (2009) 3 602 000
Structural panels (plywood and oriented strandboard) (cubic metres) (2009)
6 008 471
Wood pulp (tonnes) (2009) 17 095 000
I N V E N T O R Y
Area classification (thousand hectares)
Forest land 347 710
Other land with tree cover 7 773
Other wooded land 41 779
Forest, other wooded land and other land with tree cover 397 262
Forest type (forest land)
Broadleaf 11%
Coniferous 67%
Mixedwood 16%
Non-treed 6%
Ownership (forest and other wooded land)
Federal 16%
Private 7%
Provincial 77%
National parks area (million hectares) 27.6
T R A D E
Balance of trade (total exports) (dollars) (2009) 14 402 354 417
Value of domestic exports (dollars) (2009) 23 528 451 000
Primary wood products 680 792 000
Pulp and paper products 16 118 391 000
Wood-fabricated materials 6 729 268 000
Value of imports (dollars) (2009) 9 251 693 000
Primary wood products 491 316 000
Pulp and paper products 6 328 231 000
Wood-fabricated materials 2 432 146 000
F O R E S T M A N A G E M E N T
Area defoliated by insects and beetle-killed trees (hectares) (2008)
13 733 728
Area planted (hectares) (2008) 447 195
Area seeded (hectares) (2008) 34 602
Fire – area burned (hectares) (2009) 755 405
Fires – number (2009) 7 167
Forest area certified (hectares) (2009) 142 782 131
Harvest area (hectares) (2008) 678 735
Harvest volume (cubic metres) (2008) 136 967 000
Greenhouse gas inventory
Afforestation – forest area (kilohectares) (2008) 1.4
CO2e emissions due to deforestation (megatonnes) (2008) 15.0
CO2e removals from the atmosphere due to afforestation (megatonnes) (2008)
-0.8
Deforestation – forest area (kilohectares) (2008) 45.6
Net carbon sequestered (CO2e/yr) (megatonnes) (2008) -17.4
CanadaPopulation (April 1, 2010)34 018 957
Maple
See page 16 for background information and sources for the statistics presented in these tables.

t H e s t A t e o F C A n A D A ’ s F o R e s t s 1 0
D O M E S T I C E C O N O M I C I M P A C T
Canadian housing starts (SAAR) (2009) 15 942
Direct jobs (number) (2009)
Direct jobs (LFS) 52 000
Direct jobs (SEPH) 46 787
New investments (dollars) (2009) 374 900 000
Forestry and logging industry 62 100 000
Pulp and paper product manufacturing industry 87 000 000
Wood product manufacturing industry 225 800 000
Revenue from goods manufactured (dollars) (2008) 17 139 598 000
Forestry and logging industry 4 439 626 000
Pulp and paper product manufacturing industry 5 224 000 000
Wood product manufacturing industry 7 475 972 000
Wages and salaries (dollars) (2008) 2 967 838 000
Forestry and logging industry 858 160 000
Pulp and paper product manufacturing industry 710 270 000
Wood product manufacturing industry 1 399 408 000
D O M E S T I C E C O N O M I C I M P A C T
Canadian housing starts (SAAR) (2009) 19 783
Direct jobs (number) (2009)
Direct jobs (LFS) 17 700
Direct jobs (SEPH) 15 579
New investments (dollars) (2009) 162 500 000
Forestry and logging industry 22 100 000
Pulp and paper product manufacturing industry 60 800 000
Wood product manufacturing industry 79 600 000
Revenue from goods manufactured (dollars) (2008) 4 806 157 000
Forestry and logging industry 707 840 000
Pulp and paper product manufacturing industry 1 714 904 000
Wood product manufacturing industry 2 383 413 000
Wages and salaries (dollars) (2008) 876 880 000
Forestry and logging industry 164 053 000
Pulp and paper product manufacturing industry 204 510 000
Wood product manufacturing industry 508 317 000
F O R E S T M A N A G E M E N T
Area defoliated by insects and beetle-killed trees (hectares) (2008)
9 343 389
Area planted (hectares) (2008) 179 134
Area seeded (hectares) (2008) Not available
Fire – area burned (hectares) (2009) 229 566
Fires – number (2009) 3 084
Forest area certified (hectares) (2009) 56 276 920
Harvest area (hectares) (2008) 144 335
Harvest volume (cubic metres) (2008) 61 805 000
F O R E S T M A N A G E M E N T
Area defoliated by insects and beetle-killed trees (hectares) (2008)
3 153 573
Area planted (hectares) (2008) 53 730
Area seeded (hectares) (2008) 580
Fire – area burned (hectares) (2009) 66 826
Fires – number (2009) 1 655
Forest area certified (hectares) (2009) 19 935 787
Harvest area (hectares) (2008) 68 370
Harvest volume (cubic metres) (2008) 19 736 000
I N V E N T O R Y
Ownership (forest and other wooded land)
Federal 1%
Private 3%
Provincial 96%
Provincial parks area (million hectares) 13.5
I N V E N T O R Y
Ownership (forest and other wooded land)
Federal 8%
Private 3%
Provincial 89%
Provincial parks area (thousand hectares) 220
T R A D E
Balance of trade (total exports) (dollars) (2009) 6 196 213 126
Value of domestic exports (dollars) (2009) 7 488 759 000
Primary wood products 464 164 000
Pulp and paper products 3 475 466 000
Wood-fabricated materials 3 549 129 000
Value of imports (dollars) (2009) 1 297 156 000
Primary wood products 52 602 000
Pulp and paper products 647 298 000
Wood-fabricated materials 597 256 000
T R A D E
Balance of trade (total exports) (dollars) (2009) 1 517 229 317
Value of domestic exports (dollars) (2009) 1 818 829 000
Primary wood products 20 878 000
Pulp and paper products 1 315 016 000
Wood-fabricated materials 482 935 000
Value of imports (dollars) (2009) 302 012 000
Primary wood products 4 424 000
Pulp and paper products 157 278 000
Wood-fabricated materials 140 310 000
British ColumbiaPopulation (April 1, 2010)4 510 858
AlbertaPopulation (April 1, 2010)3 724 832
Western redcedar Lodgepole pine

A n n U A L R e P o R t 2 0 1 01 1
I N V E N T O R Y
Ownership (forest and other wooded land)
Federal 4%
Private 6%
Provincial 90%
Provincial parks area (million hectares) 1.1
I N V E N T O R Y
Ownership (forest and other wooded land)
Federal 2%
Private 3%
Provincial 95%
Provincial parks area (million hectares) 3.4
T R A D E
Balance of trade (total exports) (dollars) (2009) 180 275 275
Value of domestic exports (dollars) (2009) 253 134 000
Primary wood products 2 799 000
Pulp and paper products 202 654 000
Wood-fabricated materials 47 681 000
Value of imports (dollars) (2009) 72 861 000
Primary wood products 1 363 000
Pulp and paper products 39 062 000
Wood-fabricated materials 32 436 000
T R A D E
Balance of trade (total exports) (dollars) (2009) -91 358 452
Value of domestic exports (dollars) (2009) 328 274 000
Primary wood products 949 000
Pulp and paper products 224 121 000
Wood-fabricated materials 103 204 000
Value of imports (dollars) (2009) 420 107 000
Primary wood products 1 471 000
Pulp and paper products 312 299 000
Wood-fabricated materials 106 337 000
D O M E S T I C E C O N O M I C I M P A C T
Canadian housing starts (SAAR) (2009) 3 675
Direct jobs (number) (2009)
Direct jobs (LFS) 2 600
Direct jobs (SEPH) Not available
New investments (dollars) (2009) Not available
Forestry and logging industry Not available
Pulp and paper product manufacturing industry Not available
Wood product manufacturing industry Not available
Revenue from goods manufactured (dollars) (2008) 381 260 000
Forestry and logging industry 90 379 000
Pulp and paper product manufacturing industry 47 430 000
Wood product manufacturing industry 243 451 000
Wages and salaries (dollars) (2008) 75 407 000
Forestry and logging industry 19 885 000
Pulp and paper product manufacturing industry 9 206 000
Wood product manufacturing industry 46 316 000
D O M E S T I C E C O N O M I C I M P A C T
Canadian housing starts (SAAR) (2009) 4 100
Direct jobs (number) (2009)
Direct jobs (LFS) 6 700
Direct jobs (SEPH) Not available
New investments (dollars) (2009) Not available
Forestry and logging industry Not available
Pulp and paper product manufacturing industry Not available
Wood product manufacturing industry Not available
Revenue from goods manufactured (dollars) (2008) 1 106 257 000
Forestry and logging industry 63 054 000
Pulp and paper product manufacturing industry 457 680 000
Wood product manufacturing industry 585 523 000
Wages and salaries (dollars) (2008) 229 699 000
Forestry and logging industry 13 002 000
Pulp and paper product manufacturing industry 79 338 000
Wood product manufacturing industry 137 359 000
F O R E S T M A N A G E M E N T
Area defoliated by insects and beetle-killed trees (hectares) (2008)
55 435
Area planted (hectares) (2008) 15 293
Area seeded (hectares) (2008) Not available
Fire – area burned (hectares) (2009) 37 559
Fires – number (2009) 511
Forest area certified (hectares) (2009) 2 089 964
Harvest area (hectares) (2008) 13 078
Harvest volume (cubic metres) (2008) 1 353 000
F O R E S T M A N A G E M E N T
Area defoliated by insects and beetle-killed trees (hectares) (2008)
140 055
Area planted (hectares) (2008) 9 565
Area seeded (hectares) (2008) 314
Fire – area burned (hectares) (2009) 2 872
Fires – number (2009) 184
Forest area certified (hectares) (2009) 11 705 655
Harvest area (hectares) (2008) 13 736
Harvest volume (cubic metres) (2008) 2 009 000
SaskatchewanPopulation (April 1, 2010)1 041 729
ManitobaPopulation (April 1, 2010)1 232 654
White birch White spruce

t H e s t A t e o F C A n A D A ’ s F o R e s t s 1 2
D O M E S T I C E C O N O M I C I M P A C T
Canadian housing starts (SAAR) (2009) 50 075
Direct jobs (number) (2009)
Direct jobs (LFS) 58 700
Direct jobs (SEPH) 40 698
New investments (dollars) (2009) 373 100 000
Forestry and logging industry 14 500 000
Pulp and paper product manufacturing industry 289 800 000
Wood product manufacturing industry 68 800 000
Revenue from goods manufactured (dollars) (2008) 13 399 878 000
Forestry and logging industry 1 550 664 000
Pulp and paper product manufacturing industry 7 992 594 000
Wood product manufacturing industry 3 856 620 000
Wages and salaries (dollars) (2008) 2 445 717 000
Forestry and logging industry 290 136 000
Pulp and paper product manufacturing industry 1 345 795 000
Wood product manufacturing industry 809 786 000
D O M E S T I C E C O N O M I C I M P A C T
Canadian housing starts (SAAR) (2009) 43 275
Direct jobs (number) (2009)
Direct jobs (LFS) 79 700
Direct jobs (SEPH) 68 000
New investments (dollars) (2009) 405 000 000
Forestry and logging industry 39 900 000
Pulp and paper product manufacturing industry 257 500 000
Wood product manufacturing industry 107 600 000
Revenue from goods manufactured (dollars) (2008) 18 446 486 000
Forestry and logging industry 2 092 599 000
Pulp and paper product manufacturing industry 9 761 266 000
Wood product manufacturing industry 6 592 621 000
Wages and salaries (dollars) (2008) 2 877 359 000
Forestry and logging industry 435 339 000
Pulp and paper product manufacturing industry 1 286 983 000
Wood product manufacturing industry 1 155 037 000
F O R E S T M A N A G E M E N T
Area defoliated by insects and beetle-killed trees (hectares) (2008)
772 897
Area planted (hectares) (2008) 74 961
Area seeded (hectares) (2008) 33 000
Fire – area burned (hectares) (2009) 20 656
Fires – number (2009) 385
Forest area certified (hectares) (2009) 25 208 308
Harvest area (hectares) (2008) 158 651
Harvest volume (cubic metres) (2008) 12 039 000
F O R E S T M A N A G E M E N T
Area defoliated by insects and beetle-killed trees (hectares) (2008)
106 033
Area planted (hectares) (2008) 77 290
Area seeded (hectares) (2008) 600
Fire – area burned (hectares) (2009) 93 972
Fires – number (2009) 483
Forest area certified (hectares) (2009) 20 086 118
Harvest area (hectares) (2008) 147 618
Harvest volume (cubic metres) (2008) 23 718 000
OntarioPopulation (April 1, 2010)13 167 894
QuebecPopulation (April 1, 2010)7 886 108
Eastern white pine Yellow birch
I N V E N T O R Y
Ownership (forest and other wooded land)
Federal 1%
Private 8%
Provincial 91%
Provincial parks area (million hectares) 7.9
I N V E N T O R Y
Ownership (forest and other wooded land)
Private 11%
Provincial 89%
Provincial parks area (thousand hectares) (excluding wildlife reserves)
755
T R A D E
Balance of trade (total exports) (dollars) (2009) -869 270 953
Value of domestic exports (dollars) (2009) 4 042 858 000
Primary wood products 53 557 000
Pulp and paper products 3 268 606 000
Wood-fabricated materials 720 695 000
Value of imports (dollars) (2009) 5 015 883 000
Primary wood products 58 904 000
Pulp and paper products 3 938 522 000
Wood-fabricated materials 1 018 457 000
T R A D E
Balance of trade (total exports) (dollars) (2009) 5 546 952 298
Value of domestic exports (dollars) (2009) 7 403 160 000
Primary wood products 83 102 000
Pulp and paper products 5 833 458 000
Wood-fabricated materials 1 486 600 000
Value of imports (dollars) (2009) 1 870 785 000
Primary wood products 311 447 000
Pulp and paper products 1 098 061 000
Wood-fabricated materials 461 277 000

A n n U A L R e P o R t 2 0 1 01 3
D O M E S T I C E C O N O M I C I M P A C T
Canadian housing starts (SAAR) (2009) 3 483
Direct jobs (number) (2009)
Direct jobs (LFS) 11 600
Direct jobs (SEPH) Not available
New investments (dollars) (2009) Not available
Forestry and logging industry Not available
Pulp and paper product manufacturing industry Not available
Wood product manufacturing industry Not available
Revenue from goods manufactured (dollars) (2008) Not available
Forestry and logging industry 669 428 000
Pulp and paper product manufacturing industry Not available
Wood product manufacturing industry 901 307 000
Wages and salaries (dollars) (2008) Not available
Forestry and logging industry 114 460 000
Pulp and paper product manufacturing industry Not available
Wood product manufacturing industry 171 946 000
D O M E S T I C E C O N O M I C I M P A C T
Canadian housing starts (SAAR) (2009) 3 358
Direct jobs (number) (2009)
Direct jobs (LFS) 7 300
Direct jobs (SEPH) Not available
New investments (dollars) (2009) Not available
Forestry and logging industry Not available
Pulp and paper product manufacturing industry Not available
Wood product manufacturing industry Not available
Revenue from goods manufactured (dollars) (2008) Not available
Forestry and logging industry 189 579 000
Pulp and paper product manufacturing industry Not available
Wood product manufacturing industry 509 611 000
Wages and salaries (dollars) (2008) Not available
Forestry and logging industry 44 177 000
Pulp and paper product manufacturing industry Not available
Wood product manufacturing industry 106 008 000
F O R E S T M A N A G E M E N T
Area defoliated by insects and beetle-killed trees (hectares) (2008)
Not available
Area planted (hectares) (2008) 21 434
Area seeded (hectares) (2008) Not available
Fire – area burned (hectares) (2009) 249
Fires – number (2009) 192
Forest area certified (hectares) (2009) 4 084 507
Harvest area (hectares) (2008) 72 241
Harvest volume (cubic metres) (2008) 8 931 000
F O R E S T M A N A G E M E N T
Area defoliated by insects and beetle-killed trees (hectares) (2008)
13 914
Area planted (hectares) (2008) 9 026
Area seeded (hectares) (2008) Not available
Fire – area burned (hectares) (2009) 892
Fires – number (2009) 193
Forest area certified (hectares) (2009) 1 332 841
Harvest area (hectares) (2008) 41 346
Harvest volume (cubic metres) (2008) 4 883 000
New BrunswickPopulation (April 1, 2010)751 273
Nova ScotiaPopulation (April 1, 2010)940 482
Balsam fir Red spruce
I N V E N T O R Y
Ownership (forest and other wooded land)
Federal 2%
Private 50%
Provincial 48%
Provincial parks area (thousand hectares) 24
I N V E N T O R Y
Ownership (forest and other wooded land)
Federal 3%
Private 68%
Provincial 29%
Provincial parks area (thousand hectares) 31
T R A D E
Balance of trade (total exports) (dollars) (2009) 1 050 883 933
Value of domestic exports (dollars) (2009) 1 263 515 000
Primary wood products 18 325 000
Pulp and paper products 978 726 000
Wood-fabricated materials 266 464 000
Value of imports (dollars) (2009) 213 953 000
Primary wood products 60 974 000
Pulp and paper products 109 993 000
Wood-fabricated materials 42 986 000
T R A D E
Balance of trade (total exports) (dollars) (2009) -53 158 546
Value of domestic exports (dollars) (2009) 758 221 000
Primary wood products 36 885 000
Pulp and paper products 652 308 000
Wood-fabricated materials 69 028 000
Value of imports (dollars) (2009) 53 160 000
Primary wood products 121 000
Pulp and paper products 20 253 000
Wood-fabricated materials 32 786 000

t H e s t A t e o F C A n A D A ’ s F o R e s t s 1 4
D O M E S T I C E C O N O M I C I M P A C T
Canadian housing starts (SAAR) (2009) 800
Direct jobs (number) (2009)
Direct jobs (LFS) 600
Direct jobs (SEPH) Not available
New investments (dollars) (2009) Not available
Forestry and logging industry Not available
Pulp and paper product manufacturing industry Not available
Wood product manufacturing industry Not available
Revenue from goods manufactured (dollars) (2008) Not available
Forestry and logging industry Not available
Pulp and paper product manufacturing industry Not available
Wood product manufacturing industry 24 718 000
Wages and salaries (dollars) (2008) Not available
Forestry and logging industry Not available
Pulp and paper product manufacturing industry Not available
Wood product manufacturing industry 8 007 000
D O M E S T I C E C O N O M I C I M P A C T
Canadian housing starts (SAAR) (2009) 3 108
Direct jobs (number) (2009)
Direct jobs (LFS) 1 300
Direct jobs (SEPH) Not available
New investments (dollars) (2009) Not available
Forestry and logging industry Not available
Pulp and paper product manufacturing industry Not available
Wood product manufacturing industry Not available
Revenue from goods manufactured (dollars) (2008) Not available
Forestry and logging industry 115 297 000
Pulp and paper product manufacturing industry Not available
Wood product manufacturing industry 49 843 000
Wages and salaries (dollars) (2008) Not available
Forestry and logging industry 20 272 000
Pulp and paper product manufacturing industry Not available
Wood product manufacturing industry 10 759 000
F O R E S T M A N A G E M E N T
Area defoliated by insects and beetle-killed trees (hectares) (2008)
Not available
Area planted (hectares) (2008) 570
Area seeded (hectares) (2008) Not available
Fire – area burned (hectares) (2009) 3
Fires – number (2009) 8
Forest area certified (hectares) (2009) 357
Harvest area (hectares) (2008) 2 133
Harvest volume (cubic metres) (2008) 404 000
F O R E S T M A N A G E M E N T
Area defoliated by insects and beetle-killed trees (hectares) (2008)
71 300
Area planted (hectares) (2008) 6 130
Area seeded (hectares) (2008) 73
Fire – area burned (hectares) (2009) 35 267
Fires – number (2009) 176
Forest area certified (hectares) (2009) 2 061 674
Harvest area (hectares) (2008) 16 977
Harvest volume (cubic metres) (2008) 2 048 000
* Timber and property rights for 69% of the Crown land on the island of Newfoundland have been conveyed to pulp and paper companies through 99-year licences issued under the 1905 Pulp and Paper Manufacturing Act and 1935 Bowater Act. Therefore, the province’s financial and legal system treats this licensed land as private property.
Prince Edward IslandPopulation (April 1, 2010)141 551
Newfoundland and LabradorPopulation (April 1, 2010)510 901
Red oak Black spruce
I N V E N T O R Y
Ownership (forest and other wooded land)
Federal 1%
Private 91%
Provincial 8%
Provincial parks area (thousand hectares) 2
I N V E N T O R Y
Ownership (forest and other wooded land)
Private 1%
Provincial* 99%
Provincial parks area (thousand hectares) 21
T R A D E
Balance of trade (total exports) (dollars) (2009) 3 323 747
Value of domestic exports (dollars) (2009) 3 373 000
Primary wood products 92 000
Pulp and paper products 1 893 000
Wood-fabricated materials 1 388 000
Value of imports (dollars) (2009) 55 000
Primary wood products 0
Pulp and paper products 5 000
Wood-fabricated materials 50 000
T R A D E
Balance of trade (total exports) (dollars) (2009) 162 481 408
Value of domestic exports (dollars) (2009) 168 030 000
Primary wood products 4 000
Pulp and paper products 166 108 000
Wood-fabricated materials 1 918 000
Value of imports (dollars) (2009) 5 703 000
Primary wood products 6 000
Pulp and paper products 5 445 000
Wood-fabricated materials 252 000

A n n U A L R e P o R t 2 0 1 01 5
F O R E S T M A N A G E M E N T
Area defoliated by insects and beetle-killed trees (hectares) (2008)
10 286
Area planted (hectares) (2008) 35
Area seeded (hectares) (2008) 35
Fire – area burned (hectares) (2009) 227 057
Fires – number (2009) 118
Forest area certified (hectares) (2009) Not available
Harvest area (hectares) (2008) 190
Harvest volume (cubic metres) (2008) 19 000
F O R E S T M A N A G E M E N T
Area defoliated by insects and beetle-killed trees (hectares) (2008)
66 846
Area planted (hectares) (2008) 27
Area seeded (hectares) (2008) Not available
Fire – area burned (hectares) (2009) 2 057
Fires – number (2009) 42
Forest area certified (hectares) (2009) Not available
Harvest area (hectares) (2008) 60
Harvest volume (cubic metres) (2008) 24 000
YukonPopulation (April 1, 2010)34 246
NunavutPopulation (April 1, 2010)32 900
Northwest TerritoriesPopulation (April 1, 2010)43 529
Subalpine fir Tamarack
I N V E N T O R Y
Ownership (forest and other wooded land)
Federal 100%
Territorial parks area Not available
I N V E N T O R Y
Ownership (forest and other wooded land)
Federal 100%
Territorial parks area Not available
I N V E N T O R Y
Ownership (forest and other wooded land)
Federal 100%
Territorial parks area (thousand hectares) 14
T R A D E
Balance of trade (total exports) (dollars) (2009) 162 733
Value of domestic exports (dollars) (2009) 182 000
Primary wood products 34 000
Pulp and paper products 0
Wood-fabricated materials 148 000
Value of imports (dollars) (2009) 17 000
Primary wood products 0
Pulp and paper products 14 000
Wood-fabricated materials 3 000
T R A D E
Balance of trade (total exports) (dollars) (2009) 33 336
Value of domestic exports (dollars) (2009) 35 000
Primary wood products 0
Pulp and paper products 0
Wood-fabricated materials 35 000
Value of imports (dollars) (2009) 1 000
Primary wood products 0
Pulp and paper products 0
Wood-fabricated materials 1 000
T R A D E
Balance of trade (total exports) (dollars) (2009) 79 026
Value of domestic exports (dollars) (2009) 79 000
Primary wood products 0
Pulp and paper products 33 000
Wood-fabricated materials 46 000
Value of imports (dollars) (2009) 0
Primary wood products 0
Pulp and paper products 0
Wood-fabricated materials 0

t H e s t A t e o F C A n A D A ’ s F o R e s t s 1 6
source and information The statistical profile data in the preceding tables are derived from a number of sources which are identified here under each data type. Where necessary, they have been edited for accuracy and consistency. All data are subject to revision.
In most cases, the data represent the year before the reporting period. However, when they are gathered from several sources, it takes longer to analyse and produce them. In these cases, the numbers reflect results from two or three years before the reporting period.
While most of the figures are calculated for the calendar year, some are based on the federal government’s fiscal year (April 1 to March 31). Numbers are rounded off; in the case of employ-ment data, they are rounded to the nearest hundred.
It may not be possible to compare directly the data from the various sections as they emanate from several sources, and these sources may compile their statistics differently.
Domestic economic impact
Canadian housing starts—seasonally adjusted annual rate (SAAR)A rate adjustment used for economic or business data that attempts to remove seasonal variations in the data. The time of year will affect most data. Adjusting for the seasonality in data enables more accurate month to month comparisons. The SAAR is calculated by dividing the unadjusted annual rate for the month by its seasonality factor and creating an adjusted annual rate for the month. These adjustments are more often used when economic data is released to the public.
Source: Canada Mortgage and Housing Corporation.
Capital and repair expendituresCapital expenditures include the cost of procuring, constructing and installing or leasing new durable plants, machinery or equipment, whether for replacement or addition to existing assets. Also included are all capitalized costs such as feasibility studies and architectural, legal, installation and
engineering fees; the value of capital assets put in place by firms either by contract or with the firm’s own labour force; and, capitalized interest charges on loans for capital projects. Repair expenditures include costs to repair and maintain structures, machinery and equipment.
Source: Statistics Canada, Capital and repair expenditures, by sector and province, annual (dollars), CANSIM Table 029-0005 and Capital and repair expenditures, industry sectors 31-33, manufacturing, annual (dollars), CANSIM Table 029-0009, March 2010.
Contribution to gross domestic product (GDP)The total unduplicated value of the goods and services produced in an economic area such as a country or region during a given period. (“Unduplicated value” means that the intermediate costs of producing an item or service have been deducted.) Figures are in constant dollars and only available for Canada. The constant dollars are used to measure variations in the dollar’s real value over time. The constant dollar is the real value of a current dollar compared with a dollar’s value in a specific reference year. Expressing GDP in constant dollars makes it possible to measure real growth by removing the effect of inflation.
Source: Statistics Canada, Gross Domestic Product (GDP) at basic prices, by North American Industry Classification System (NAICS), monthly (dollars), CANSIM Table 379-0027, March 2010 and Selected economic indicators, provincial economic accounts, annual, CANSIM Table 384-0013, April 2010.
Direct jobsPersons employed directly in the following industries: forestry and logging, industries involved in support activities for forestry, and paper product manufacturing and wood product manufacturing.
The data are sourced from Statistics Canada’s Labour Forces Survey (LFS) and the Survey of Employment, Payrolls and Hours (SEPH). Due to different methodologies, not all these data are comparable.
Source: Statistics Canada, Labour Force Survey (LFS), March 2010 (special extraction) and the Survey of Employment, Payrolls and Hours,

A n n U A L R e P o R t 2 0 1 01 7
unadjusted for seasonal variation, by type of employee for selected industries classified using the North American Industry Classification System (NAICS), monthly (persons), CANSIM Table 281-0023, March 2010.
New investmentsAll expenditures made on buildings, engineering, construction, machinery and equipment (including imports of used machinery and equipment) for the current time period. Investment in buildings includes transfer costs on the sale of existing assets (for example, real estate commissions).
Source: Statistics Canada, Capital and repair expenditures, by sector and province, annual (dollars), CANSIM Table 029-0005 and Capital and repair expenditures, industry sectors 31-33, manufacturing, annual (dollars), CANSIM Table 029-0009, March 2010.
Revenue from goods manufacturedRevenue from the sale of goods manufactured using materials owned by the establishment as well as from repair work, manufacturing service charges and work contracted to others.
Source: Statistics Canada, Annual Survey of Manufactures and Logging (ASML): Logging industries, principal statistics by North American Industry Classification System (NAICS), annual, CANSIM Table 301-0007 and Principal statistics for manufacturing industries, by North American Industry Classification System (NAICS), annual, CANSIM Table 301-0006, 2004–2008.
Wages and salariesThe earnings, in cash or in kind, of Canadian residents for work performed before deduction of income taxes and contributions to pension funds, employment insurance and other social insurance schemes.
Source: Statistics Canada, Annual Survey of Manufactures and Logging (ASML): Logging industries, principal statistics by North American Industry Classification System (NAICS), annual, CANSIM Table 301-0007 and Principal statistics for manufacturing industries, by North American Industry Classification System (NAICS), annual, CANSIM Table 301-0006, 2004–2008.
Forest management
Area defoliated by insects and beetle-killed treesThe data include areas where there is tree mortality and moderate to severe defoliation. Defoliation does not always imply mortality; for example, stands with moderate defoliation often recover and may not lose much growth. Also, defoliation is mapped on an insect-species basis, and a given area may be afflicted by more than one species at a time. This may result in double or triple counting in areas affected by more than one species, exaggerating the extent of the total area defoliated.
Source: Canadian Council of Forest Ministers, National Forestry Database.
Area planted and seededSource: Canadian Council of Forest Ministers, National Forestry Database.
Carbon emissions/removalsThe deforestation and afforestation figures reflect annual rates, while the figures for CO2e emissions and removals reflect the current year plus the previous 20 years. Thus, the figures for CO2e emissions include residual emissions from areas deforested over the past 20 years, and the figures for CO2e removals include ongoing removals by areas afforested over the past 20 years. Emissions and removals exactly match the most recent greenhouse gas inventory figures submitted to the United National Framework Climate Change Convention. Emissions always bear a positive sign, while removals bear a negative sign.
Source: National Inventory Report 2010, Environment Canada (based on Natural Resources Canada–Canadian Forest Service data/analysis).
FireArea burned includes areas within all of Canada’s forests.
Sources: All figures for the most current year are from the Canadian Interagency Forest Fire Centre. Data for all previous years were provided by the provinces/territories and are available from the Canadian Council of Forest Ministers, National Forestry Database.

t H e s t A t e o F C A n A D A ’ s F o R e s t s 1 8
Forest area certifiedIf a forest area has been certified to more than one of the three sustainable forest management standards (Canadian Standards Association [CSA], Sustainable Forestry Initiative [SFI] and Forest Stewardship Council [FSC]), the area is counted only once. Hence, the total certifications for SFM standards may be less than the sum of the individual totals for these standards.
Source: Canadian Sustainable Forestry Certification Coalition.
Harvest (volume)The national and provincial/territorial figures for harvesting volume include data for industrial roundwood, fuelwood and firewood.
Source: Canadian Council of Forest Ministers, National Forestry Database.
Forest products
Domestic consumptionNatural Resources Canada–Canadian Forest Service calculated the consumption figures for these products. This information is available only at the national level.
ProductionChristmas trees
The production quantity and value are based on estimates calculated by Natural Resources Canada–Canadian Forest Service.
Sources: Statistics Canada and Canadian Council of Forest Ministers, National Forestry Database.
Lumber
Source: Statistics Canada, Sawn lumber production and shipments, monthly (cubic metres dry), CANSIM Table 303-0009. April 2010.

A n n U A L R e P o R t 2 0 1 01 9
mapLe produCts
Source: Canadian Council of Forest Ministers, National Forestry Database.
NewspriNt, priNtiNg aNd writiNg paper, wood puLp
The production and consumption figures are based on Pulp and Paper Products Council data.
struCtur aL paNeLs
The production and consumption data of structural panels—plywood and oriented strandboard—are from the APA–The Engineered Wood Association.
Inventory
Source: National Forest Inventory 2006.
Other wooded land Areas of land where 1) tree canopies cover 5–10 percent of the total area and the trees–when mature–can grow to a height above 5 metres; or 2) shrubs, bushes and trees together cover more than 10 percent of the area. These areas include treed wetlands (swamps) and land with slow-growing and scattered trees. They do not include land that is predominantly agricultural or urban. Source: Food and Agriculture Organization of the United Nations (FAO).
Other land with tree coverAreas of land where tree canopies cover more than 10 percent of the total area and the trees, when mature, can grow to a height of at least 5 metres. Includes treed areas on farms and in parks, gardens and around buildings. Also includes tree plantations established mainly for other purposes than wood production, such as fruit orchards. Source: Food and Agriculture Organization of the United Nations (FAO).
Trade
Balance of tradeThe difference between the value of the goods and services that a country exports and the value of the goods and services that it imports. If a country’s exports exceed its imports, it has a trade surplus. If imports exceed exports, the country has a trade deficit.
Source: Statistics Canada, merchandise trade data (special extraction), monthly data.

t H e s t A t e o F C A n A D A ’ s F o R e s t s2 0

2 1A n n U A L R e P o R t 2 0 1 0
Sustainable forest management can be monitored by applying a set of indicators, which are objective measures that can be supported by data.
Indicators are practical, science-based tools that give governments, industry, the public and others a consistent way to track national progress over time and to identify where improvements can be made. However, no single indicator alone is a sign of sustainability. For a clear picture, the whole range of indicators must be considered.
The following is a sample of the indicators for sustainable forest management, along with the most recent information on how Canada’s forests are doing in each area.
sUstAInABILItY InDICAtoRs
b i o l o g i c a l d i v e r S i t yBiological diversity or biodiversity refers to the variety of species and ecosystems on earth and the ecological processes of which they are a part. Biodiversity makes it possible for organisms and ecosystems to respond and adapt to environmental change. Biodiversity conservation is therefore crucial to ensuring that forests are managed sustainably.
INdICATOr: status of forest-associated species at risK
Why is this important?
– Tracking changes in populations of selected species is one indication of how well species-recovery policies and practices are working.
– In Canada, the Committee on the Status of Endangered Wildlife in Canada (COSEWIC) identifies the wild species that are in some degree of danger or are at risk of disappearing.
What has changed?
– Of the 51 species assessed or reassessed by COSEWIC in April 2010, 7 are forest-associated. Of these, 5 saw no change in risk level; 2 were newly assessed as being at risk; and no species were reassessed in a lower-risk category. Canada now has 340 forest-associated species at risk, representing 55% of the COSEWIC-listed species.
– The 2010 COSEWIC assessment listed habitat loss, climate change, predation, competition and invasive alien species as some of the threats affecting species at risk.

t H e s t A t e o F C A n A D A ’ s F o R e s t s 2 2
e c o S y S t e m c o n d i t i o n a n d p r o d u c t i v i t yCanada’s forest ecosystems must be resilient so that they can cope with and recover from natural and human disturbances and maintain their ecological functions and processes.
INdICATOr: additions and deletions of forest area
Why is this important?
– It is important to know how and why the forest resource fluctuates over time, especially when these fluctuations may cause long term additions or deletions to Canada’s forest base.
– Because forests provide ecological services, such as water purification and erosion control, additions and deletions affect water and soil conservation. As well, because forests act as carbon sinks and sources, it is critical to track forest additions and deletions to help gauge Canada’s ability to meet its climate change-related commitments.
– Deforestation is the permanent conversion of forest to other land uses. Deforestation in Canada is mainly caused by the conversion of forest land to agriculture, industrial development, resource extraction and urban expansion. Harvesting, when followed by regeneration, is not deforestation. Afforestation is the establishment of new forests on previously non-forested land.
What has changed?
– Overall, deforestation in Canada is declining, with the annual rate dropping from nearly 68 000 hectares in 1990 to some 45 000 hectares in 2008. However, large hydroelectric projects created spikes in this trend, increasing the area deforested in Canada in 1995 and 2006 in particular.
– In 2008, deforestation resulted in net emissions of 15 million tonnes of carbon dioxide equivalent (CO2e), down from 25.8 million tonnes in 1990.
– Limited afforestation has been carried out in Canada since 1990 relative to the total area of forest. Although millions of trees are planted each year to supplement natural regeneration, these efforts are occurring primarily as part of sustainable forest management in areas that were already forest. Urban and rural tree planting initiatives are occurring in Quebec, Ontario, the Prairie provinces and other regions of Canada. Some of these afforestation activities are recorded in Canada’s National Afforestation Inventory, but the data in this system are too incomplete to provide an accurate picture of national trends.
CHANGE IN COSEWIC STATUS OF FOREST ASSOCIATED SPECIES AT RISK , 1999-2010
Total species % Change in status
152 45 no change
65 19 moved to higher risk category
6 2 moved to lower risk category
117 34 newly assessed since 1999

A n n U A L R e P o R t 2 0 1 02 3
INdICATOr: area of forest disturbed by fire, insects, disease and harvesting
Why is this important?
– Forests are constantly exposed to and modified by natural disturbances such as fire, insects and diseases. They are also disturbed by pursuits such as logging, road construction, oil and gas ventures and other human activities.
– Natural disturbances are an essential part of the process of forest renewal.
– Foresters study both natural and human disturbances to gain a better understanding of how forest ecosystems change.
– Forest managers increasingly look to natural events when planning forest harvesting. They want to ensure that their practices facilitate natural regeneration and recovery of ecosystem productivity following disturbance.
What has changed?
Fire– More than 7000 forest fires were reported across Canada in 2009, 2.9% less than the 10-year average
(1999–2008). Three-quarters of a million hectares were burned in 2009, which is less than half (42.5%) of the 10-year average. Approximately 89 communities were evacuated, affecting more than 31 000 people. Most of these were from British Columbia, where 25 000 people were evacuated.
– British Columbia and the Yukon saw the bulk of Canada’s fire activity in 2009, accounting for 60% of the national total area burned (456 thousand hectares). British Columbia had 43% (3084) of the fires in Canada while Alberta had 23% (1655 fires).
– Though 2009 was an average year in terms of fires reported in Canada, it was the fifth-lowest for area burned since 1970. British Columbia saw three times its average area burned—the highest since 2003—while most of the remaining provincial and territorial agencies reported well below normal area burned.
ESTIMATED AREA OF DEFORESTATION (1000’S HECTARES) BY SECTOR
Sector
Year
1990 1995 2000 2006 2007 2008
Agriculture 44.7 26.2 26.2 26.2 26.2 24.6
Forestry* 5.7 6.7 5.8 5.9 5.9 4.7
Hydro** 3.3 35.3 1.1 29.5 1.3 1.1
Industry and transportation*** 7.5 8.2 9.3 8.8 8.7 9.7
Municipal**** 5.2 4.7 4.7 4.7 4.7 4.9
Peat mining 0.8 0.7 0.4 0.0 0.0 0.0
Recreation***** 0.8 0.9 0.9 0.9 0.9 0.7
Total****** 68.1 82.8 48.4 76.0 47.8 45.6
* Resulting from the creation of permanent forest access roads ** Includes deforestation due to hydro infrastructure and hydro reservoirs*** Includes mines, gravel pits, oil and gas projects and highway construction**** Includes urban development***** Includes ski hills and golf courses****** Numbers may not equal total due to rounding
Source: Environment Canada. 2010. National inventory report 1990–2008: greenhouse gas sources and sinks in Canada

t H e s t A t e o F C A n A D A ’ s F o R e s t s 2 4
Insects– In 2008, 13.7 million hectares of forest were defoliated by insects or contained beetle-killed trees, down
from 18.7 million hectares in 2007.
– From 1998 through 2009, the mountain pine beetle killed an estimated 675 million cubic metres of pine in British Columbia—half of the province’s commercial pine.
– Some insect outbreaks are cyclical, with peak populations occurring periodically in particular regions of the country. For example, there is evidence of spruce budworm outbreaks in eastern Canada at 35-year intervals, and there have been three outbreaks of the forest tent caterpillar in Canada between 1975 and 2004.
Disease– Native forest pathogens have evolved to exist in equilibrium with natural forest communities. However,
they can become very destructive when the natural equilibrium is altered by forest management activities, climate change, fire or insects.
– Non-native forest pathogens such as white pine blister rust are also prominent in Canadian forests, in some cases threatening the survival of certain tree species.
– As agents of disturbance in forest ecosystems, forest pathogens are major drivers of diversity—shaping forest structure and function. Pathogens also play a major role in decomposition and carbon cycling in Canada’s forests.
– Environmental agents, such as drought, air pollution, extreme temperatures and nutrient deficiencies can cause disease directly or predispose trees to damage by disease-causing organisms. For example, aspen dieback and decline in western Canada and Northern Ontario has been attributed to the combined effects of insect defoliation, pathogens and thaw-freeze events.
– Although root diseases are one of the most widespread pathology problems in Canada’s forests, the symptoms are subtle and very difficult to detect. Nationally, armillaria root disease affects 203 million hectares of forest, infecting almost all tree species. Disease intensity may increase in stands disturbed from harvest or natural causes. For example, surveys of Douglas-fir in British Columbia and spruce and balsam fir in Ontario show that Armillaria infection increases steadily with stand age after planting in harvested stands or after disturbance in natural stands.
Harvesting– Provincial and territorial regulations govern harvesting of Canada’s forests and all harvested areas must
be reforested. Each province and territory sets an allowable annual cut (AAC) based on the sustainable growth rate of the particular forest area. The goal is to maintain biological diversity while considering economic and social factors.
– In 2008, approximately 680 000 hectares of forest were harvested.
– About 446 000 hectares were replanted and 35 000 hectares were seeded.
A n n U A L R e P o R t 2 0 1 02 5
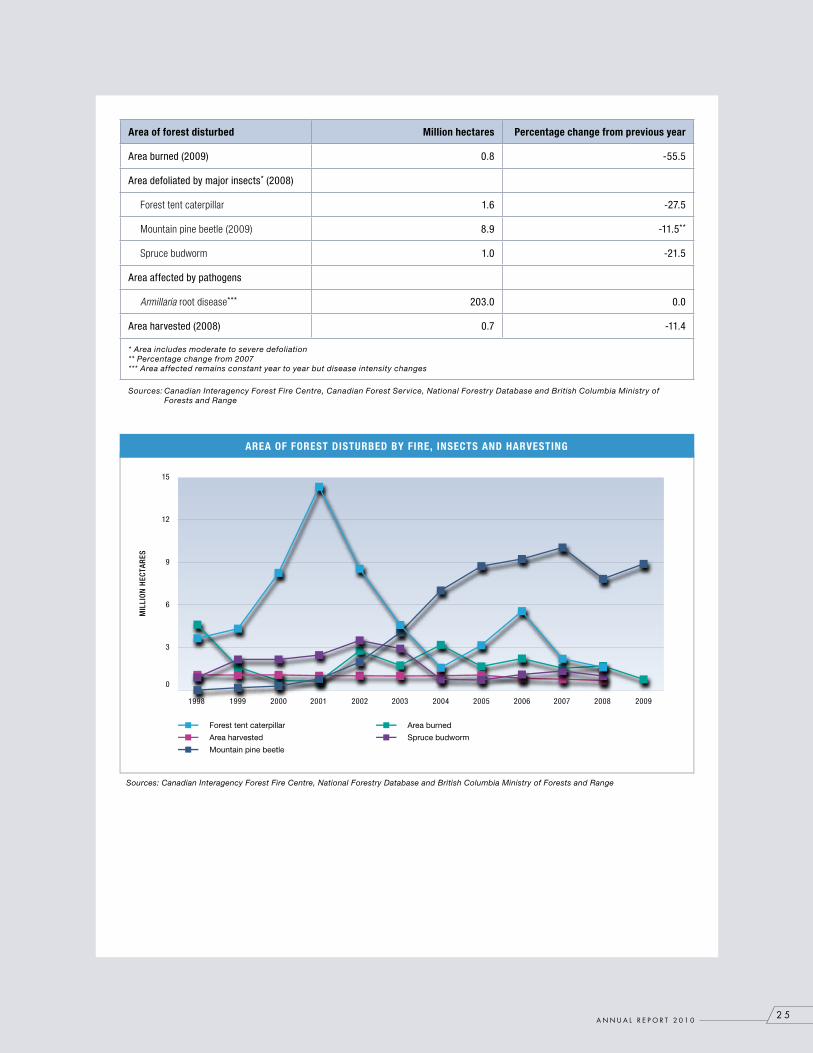
Area of forest disturbed Million hectares Percentage change from previous year
Area burned (2009) 0.8 -55.5
Area defoliated by major insects* (2008)
Forest tent caterpillar 1.6 -27.5
Mountain pine beetle (2009) 8.9 -11.5**
Spruce budworm 1.0 -21.5
Area affected by pathogens
Armillaria root disease*** 203.0 0.0
Area harvested (2008) 0.7 -11.4
* Area includes moderate to severe defoliation** Percentage change from 2007*** Area affected remains constant year to year but disease intensity changes
Sources: Canadian Interagency Forest Fire Centre, Canadian Forest Service, National Forestry Database and British Columbia Ministry of Forests and Range
Sources: Canadian Interagency Forest Fire Centre, National Forestry Database and British Columbia Ministry of Forests and Range
AREA OF FOREST DISTURBED BY FIRE, INSECTS AND HARVESTING
MIL
LIO
N H
ECTA
RES
Forest tent caterpillar
Area harvested
Mountain pine beetle
Area burned
Spruce budworm
0
3
6
9
12
15
1998 1999 2000 2001 2002 2003 2004 2005 2006 2007 2008 2009
t H e s t A t e o F C A n A D A ’ s F o R e s t s 2 6
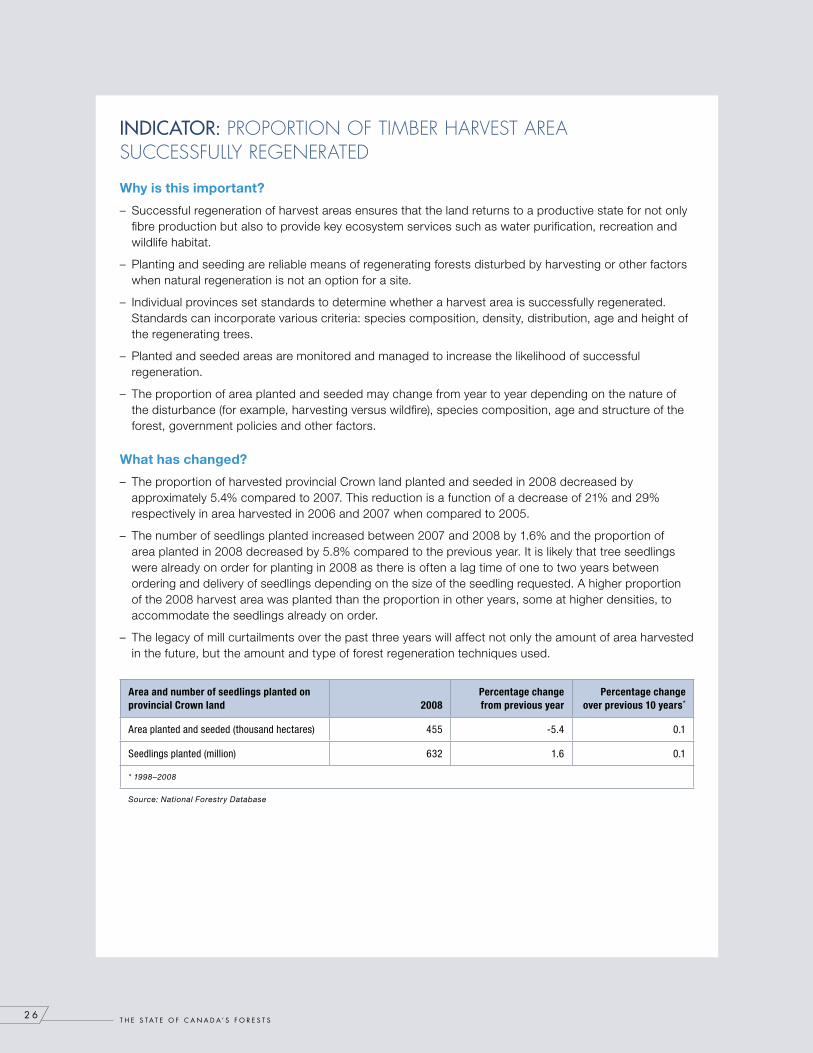
INdICATOr: proportion of tiMber harvest area successfully regenerated
Why is this important?
– Successful regeneration of harvest areas ensures that the land returns to a productive state for not only fibre production but also to provide key ecosystem services such as water purification, recreation and wildlife habitat.
– Planting and seeding are reliable means of regenerating forests disturbed by harvesting or other factors when natural regeneration is not an option for a site.
– Individual provinces set standards to determine whether a harvest area is successfully regenerated. Standards can incorporate various criteria: species composition, density, distribution, age and height of the regenerating trees.
– Planted and seeded areas are monitored and managed to increase the likelihood of successful regeneration.
– The proportion of area planted and seeded may change from year to year depending on the nature of the disturbance (for example, harvesting versus wildfire), species composition, age and structure of the forest, government policies and other factors.
What has changed?
– The proportion of harvested provincial Crown land planted and seeded in 2008 decreased by approximately 5.4% compared to 2007. This reduction is a function of a decrease of 21% and 29% respectively in area harvested in 2006 and 2007 when compared to 2005.
– The number of seedlings planted increased between 2007 and 2008 by 1.6% and the proportion of area planted in 2008 decreased by 5.8% compared to the previous year. It is likely that tree seedlings were already on order for planting in 2008 as there is often a lag time of one to two years between ordering and delivery of seedlings depending on the size of the seedling requested. A higher proportion of the 2008 harvest area was planted than the proportion in other years, some at higher densities, to accommodate the seedlings already on order.
– The legacy of mill curtailments over the past three years will affect not only the amount of area harvested in the future, but the amount and type of forest regeneration techniques used.
Area and number of seedlings planted on provincial Crown land 2008
Percentage change from previous year
Percentage change over previous 10 years*
Area planted and seeded (thousand hectares) 455 -5.4 0.1
Seedlings planted (million) 632 1.6 0.1
* 1998–2008
Source: National Forestry Database

A n n U A L R e P o R t 2 0 1 02 7
r o l e i n g l o b a l e c o l o g i c a l c yc l e SForests play an important role in global ecological cycles. they depend on and contribute to self-regulating processes responsible for recycling carbon, water, nitrogen and other life-sustaining elements. Forest management can impact forests’ role in the carbon cycle.
INdICATOr: carbon eMissions/reMovals in canada’s Managed forests
Why is this important?
– Management activities aimed at increasing carbon stocks in Canada’s forest ecosystems could mitigate climate change.
– Carbon emissions and removals from managed forests are an important indication of the contribution these forests make to the global carbon cycle and of the ever-changing impacts of natural processes.
– Monitoring trends in carbon emissions and removals is important for anticipating the future role of Canada’s forests in the global carbon cycle and for tracking the success of the forest sector’s mitigation activities.
What has changed?
– Canada’s managed forests acted as net carbon sinks in 11 of the 19 years from 1990 to 2008. However, it is difficult to discern an overall trend because forest carbon emissions and removals vary considerably from year to year as a result of wildfires and, to a lesser extent, insect outbreaks.
Source: National Forestry Database
AREA AND NUMBER OF SEEDLINGS PLANTED ON PROVINCIAL CROWN LANDTH
OU
SAN
D H
ECTA
RES
MIL
LIO
N S
EED
LIN
GS
Area planted and seeded
Seedlings planted
390
400
410
420
430
440
450
460
470
480
490
500
520
540
560
580
600
620
640
660
1998 1999 2000 2001 2002 2003 2004 2005 2006 2007 2008

t H e s t A t e o F C A n A D A ’ s F o R e s t s 2 8
– In 2008, the managed forests acted as a net sink, accumulating 6 million tonnes of carbon, which is the equivalent of 15 million tonnes of carbon dioxide.
– Fire strongly influences year-to-year differences in carbon emissions and removals from Canada’s managed forests. In 1992, a year of relatively few fires, net removals of CO2e were 101 million tonnes. In 1995, when more than 2 million hectares were burned, net emissions of CO2e reached 182 million tonnes.
– During the 1990–2008 period, annual gross emissions directly from wildfire ranged from a high of 291 million tonnes of CO2e in 1995 to a low of 11 million tonnes in 2000.
INdICATOr: forest sector carbon eMissions
Why is this important?
– Many experts agree that there is a strong link between global warming and the burning of fossil fuels and other activities that emit greenhouse gases (GHGs) such as carbon dioxide, methane and nitrous oxide.
– The forest sector uses large amounts of energy in harvesting, transporting and processing wood. In fact, it is one of the largest industrial users of energy in Canada.
– The forest sector has significant GHG emissions. However, the sector’s share of total industrial emissions is considerably lower than its share of total industrial energy use because of its increasing use of bioenergy.
– The sector’s GHG emissions include direct emissions, which result mainly from fossil fuel burned by the sector, and indirect emissions, which result mainly from fossil fuel burned in producing electricity purchased by the sector. The sector’s direct and indirect emissions also include small amounts of methane and nitrous oxide from burning biomass for energy.
– Monitoring the forest sector’s GHG emissions is a necessary first step in improving its emissions record. As well, tracking emissions in the forest sector helps Canada measure its national emission levels for comparison to its targets for GHG reductions.
What has changed?
– A changing energy mix and greater energy efficiency are clearly reducing GHG emissions in the forest sector.
– Between 1990 and 2007 the sector’s gross domestic product (GDP) rose 8%, while its energy use fell by 4% as energy efficiency improved.
– In 1990, fossil fuels, which include coal, refined petroleum products and natural gas, accounted for 38% of the forest sector’s energy needs. This estimate includes both the fossil fuels used directly by the sector and the fossil fuels used in producing electricity that the sector purchases. By 2007 the fossil fuel share had fallen to 26% while the share of bioenergy, hydro and nuclear power rose from 62% to 74%.
– Because of this switch in fuel types and increasing energy efficiency, the sector’s overall GHG emissions (direct and indirect) decreased 20% between 1990 and 2007 at the same time as its GDP rose by 8%.
– The forest sector substantially cut its use of fossil fuels between 1990 and 2007, contributing to a 47% decrease in direct emissions. However, in the same period the sector increased its use of fossil fuel electricity, increasing indirect emissions from this source by 23% and offsetting some of the reduction in direct emissions.
– In 2009, the federal government announced funding to assist the pulp and paper industry in improving its environmental performance (Pulp and Paper Green Transformation Program).

A n n U A L R e P o R t 2 0 1 02 9
Source: Natural Resources Canada, Energy Sector, Of�ce of Energy Ef�ciency
ENERGY SOURCES IN THE FOREST SECTOR PE
TAJO
ULE
S
Bioenergy
Fossil
Hydro and nuclear
100
200
300
400
500
1990 1991 1992 1993 1994 1995 1996 1997 1998 1999 2000 2001 2002 2003 2004 2005 2006 2007
Source: Natural Resources Canada, Energy Sector, Of�ce of Energy Ef�ciency
FOSSIL FUEL GHG EMISSIONS AND TOTAL ENERGY USE IN THE FOREST SECTOR
PETA
JOU
LES
MIL
LIO
N T
ON
NES
CO
2 EQ
UIV
ALEN
T
GHG emissions (million tonnes)
Total energy use (petajoules)
1990 1991 1992 1993 1994 1995 1996 1997 1998 1999 2000 2001 2002 2003 2004 2005 2006 2007
12
14
16
18
20
22
24
26
28
30
32
500
600
700
800
900
1000
1100
t H e s t A t e o F C A n A D A ’ s F o R e s t s 3 0
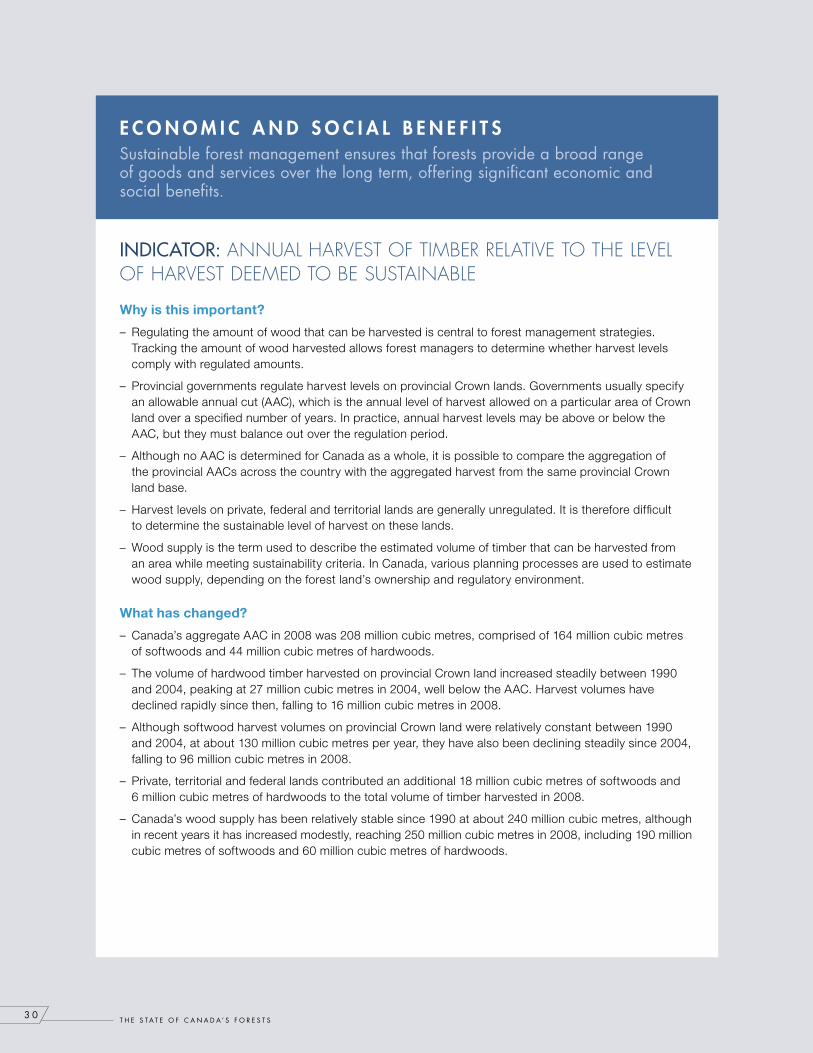
e c o n o m i c a n d S o c i a l b e n e F i t Ssustainable forest management ensures that forests provide a broad range of goods and services over the long term, offering significant economic and social benefits.
INdICATOr: annual harvest of tiMber relative to the level of harvest deeMed to be sustainable
Why is this important?
– Regulating the amount of wood that can be harvested is central to forest management strategies. Tracking the amount of wood harvested allows forest managers to determine whether harvest levels comply with regulated amounts.
– Provincial governments regulate harvest levels on provincial Crown lands. Governments usually specify an allowable annual cut (AAC), which is the annual level of harvest allowed on a particular area of Crown land over a specified number of years. In practice, annual harvest levels may be above or below the AAC, but they must balance out over the regulation period.
– Although no AAC is determined for Canada as a whole, it is possible to compare the aggregation of the provincial AACs across the country with the aggregated harvest from the same provincial Crown land base.
– Harvest levels on private, federal and territorial lands are generally unregulated. It is therefore difficult to determine the sustainable level of harvest on these lands.
– Wood supply is the term used to describe the estimated volume of timber that can be harvested from an area while meeting sustainability criteria. In Canada, various planning processes are used to estimate wood supply, depending on the forest land’s ownership and regulatory environment.
What has changed?
– Canada’s aggregate AAC in 2008 was 208 million cubic metres, comprised of 164 million cubic metres of softwoods and 44 million cubic metres of hardwoods.
– The volume of hardwood timber harvested on provincial Crown land increased steadily between 1990 and 2004, peaking at 27 million cubic metres in 2004, well below the AAC. Harvest volumes have declined rapidly since then, falling to 16 million cubic metres in 2008.
– Although softwood harvest volumes on provincial Crown land were relatively constant between 1990 and 2004, at about 130 million cubic metres per year, they have also been declining steadily since 2004, falling to 96 million cubic metres in 2008.
– Private, territorial and federal lands contributed an additional 18 million cubic metres of softwoods and 6 million cubic metres of hardwoods to the total volume of timber harvested in 2008.
– Canada’s wood supply has been relatively stable since 1990 at about 240 million cubic metres, although in recent years it has increased modestly, reaching 250 million cubic metres in 2008, including 190 million cubic metres of softwoods and 60 million cubic metres of hardwoods.
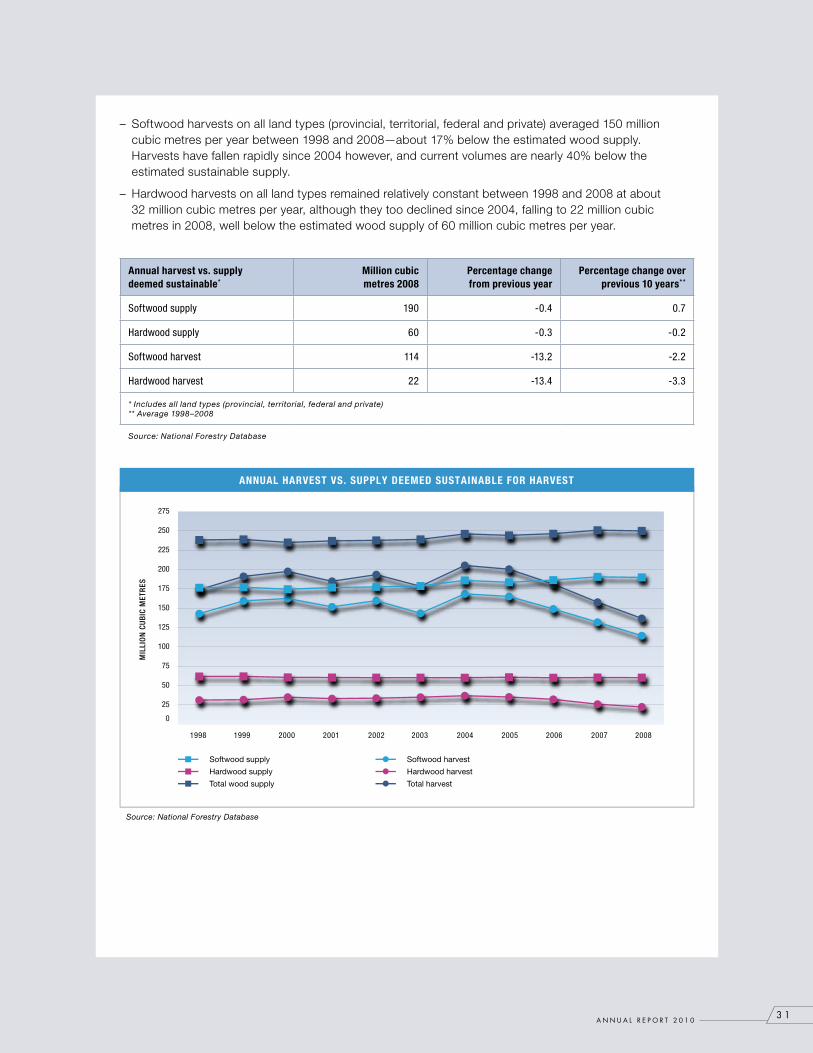
A n n U A L R e P o R t 2 0 1 03 1
– Softwood harvests on all land types (provincial, territorial, federal and private) averaged 150 million cubic metres per year between 1998 and 2008—about 17% below the estimated wood supply. Harvests have fallen rapidly since 2004 however, and current volumes are nearly 40% below the estimated sustainable supply.
– Hardwood harvests on all land types remained relatively constant between 1998 and 2008 at about 32 million cubic metres per year, although they too declined since 2004, falling to 22 million cubic metres in 2008, well below the estimated wood supply of 60 million cubic metres per year.
Annual harvest vs. supply deemed sustainable*
Million cubic metres 2008
Percentage change from previous year
Percentage change over previous 10 years**
Softwood supply 190 -0.4 0.7
Hardwood supply 60 -0.3 -0.2
Softwood harvest 114 -13.2 -2.2
Hardwood harvest 22 -13.4 -3.3
* Includes all land types (provincial, territorial, federal and private)** Average 1998–2008
Source: National Forestry Database
Source: National Forestry Database
ANNUAL HARVEST VS. SUPPLY DEEMED SUSTAINABLE FOR HARVEST
MIL
LIO
N C
UB
IC M
ETR
ES
Softwood supply
Hardwood supply
Total wood supply
Softwood harvest
Hardwood harvest
Total harvest
0
25
50
75
100
125
150
175
200
225
250
275
1998 1999 2000 2001 2002 2003 2004 2005 2006 2007 2008
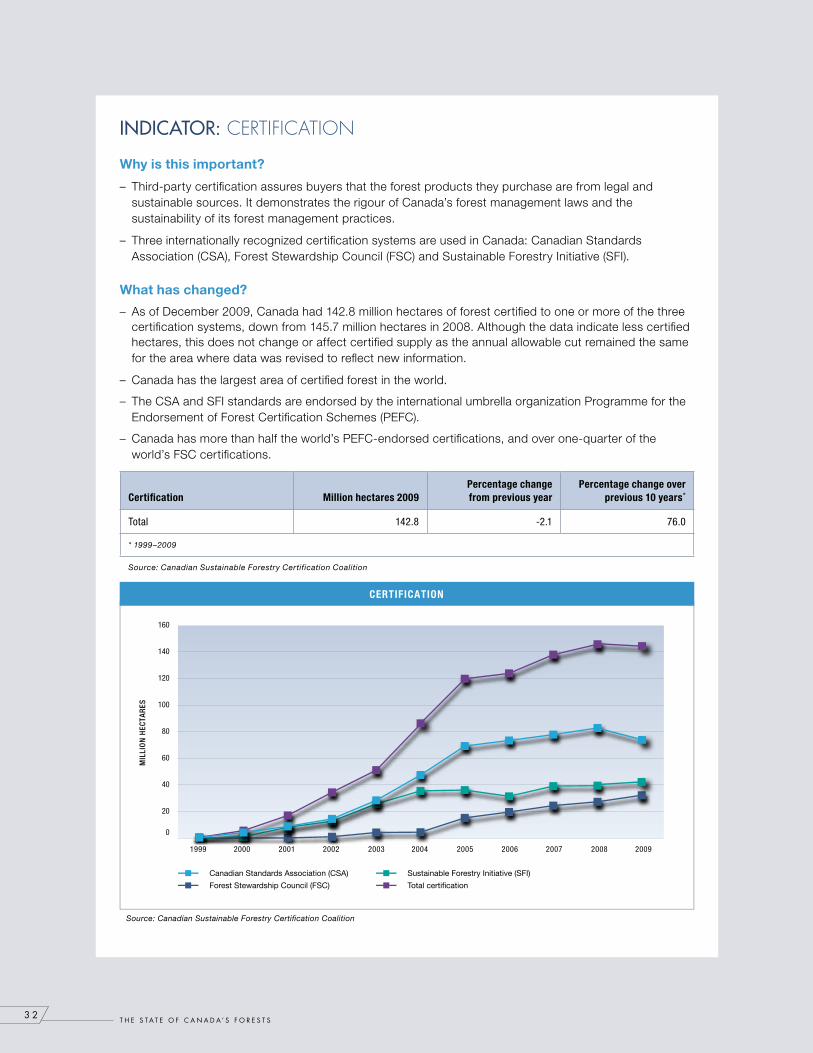
t H e s t A t e o F C A n A D A ’ s F o R e s t s 3 2
INdICATOr: certification
Why is this important?
– Third-party certification assures buyers that the forest products they purchase are from legal and sustainable sources. It demonstrates the rigour of Canada’s forest management laws and the sustainability of its forest management practices.
– Three internationally recognized certification systems are used in Canada: Canadian Standards Association (CSA), Forest Stewardship Council (FSC) and Sustainable Forestry Initiative (SFI).
What has changed?
– As of December 2009, Canada had 142.8 million hectares of forest certified to one or more of the three certification systems, down from 145.7 million hectares in 2008. Although the data indicate less certified hectares, this does not change or affect certified supply as the annual allowable cut remained the same for the area where data was revised to reflect new information.
– Canada has the largest area of certified forest in the world.
– The CSA and SFI standards are endorsed by the international umbrella organization Programme for the Endorsement of Forest Certification Schemes (PEFC).
– Canada has more than half the world’s PEFC-endorsed certifications, and over one-quarter of the world’s FSC certifications.
Certification Million hectares 2009 Percentage change from previous year
Percentage change over previous 10 years*
Total 142.8 -2.1 76.0
* 1999–2009
Source: Canadian Sustainable Forestry Certification Coalition
Source: Canadian Sustainable Forestry Certi�cation Coalition
CERTIFICATION
MIL
LIO
N H
ECTA
RES
Canadian Standards Association (CSA)
Forest Stewardship Council (FSC)
Sustainable Forestry Initiative (SFI)
Total certi�cation
0
20
40
60
80
100
120
140
160
1999 2000 2001 2002 2003 2004 2005 2006 2007 2008 2009

A n n U A L R e P o R t 2 0 1 03 3
INdICATOr: contribution of tiMber products to gross doMestic product
Why is this important?
– The gross domestic product (GDP) is the total value of all goods and services produced annually in all sectors of the economy.
– Comparing the GDP of the timber product sector with that of Canada as a whole is one measure of the sector’s importance to the nation’s economy.
– The Canadian timber product sector includes three subsectors: wood (building products such as lumber and wood panels), logging (forest protection, regeneration and timber extraction) and pulp and paper.
What has changed?
– From 2006 to 2009, the timber product sector’s share of GDP dropped significantly.
– In 2009, the timber product sector’s contribution to the GDP fell to a record low of 1.7%. Reasons included shifting global demand, the downturn in the U.S. housing market and the world economic slowdown.
– Over the last two decades, the contribution of the wood subsector has remained relatively stable, while becoming an increasingly important part of the overall forest sector as the contribution of logging and pulp and paper have declined. However, the wood subsector’s contribution to GDP has decreased as a result of the decline of the U.S. housing sector over the last three years.
– Provincial and federal programs have made good progress in diversifying market opportunities for Canadian timber products. In 2009, Quebec, Ontario, Newfoundland and Labrador, British Columbia and the federal government all announced funding to enhance the competitive position of Canadian companies in forest products markets.
Source: Statistics Canada, Gross Domestic Product (GDP) at basic prices, by North American Industry Classi�cation System (NAICS 2002)
CONTRIBUTION OF TIMBER PRODUCT SECTOR TO CANADA’S GDP
PER
CEN
T
NAICS data (2002$)
0
0.5
1.0
1.5
2.0
2.5
3.0
3.5
4.0
1991 1992 1993 1994 1995 1996 1997 1998 1999 2000 2001 2002 2003 2004 2005 2006 2007 2008 2009

t H e s t A t e o F C A n A D A ’ s F o R e s t s 3 4
INdICATOr: financial perforMance
Why is this important?
– Canada’s forest industry contributes significantly to the nation’s economy. It is particularly important in many rural communities where other jobs tend to be limited.
– Key measures of the forest industry’s financial performance include operating profits and return on capital employed. While high operating profits indicate that the industry’s core business activity is in good health, return on capital employed is an important measure of how efficiently the industry is using its capital.
What has changed?
– Producers received low returns on their product sales in 2009, resulting in a loss of $32 million, the second year in a row of negative operating profit. However, performance improved relative to 2008, when the sector lost $190 million. The industry’s return on capital employed, at 0.1%, was the lowest since 1992.
– The main reasons for the poor financial performance were the soft U.S. housing market, low demand for paper products and a strong Canadian dollar.
Return on capital employed 1999 2008 2009
7.9% 1.4% 0.1%
Source: Statistics Canada, quarterly survey of financial statistics for enterprises, CANSIM Table 187-0002
Source: Statistics Canada, Gross Domestic Product (GDP) at basic prices, by North American Industry Classi�cation System (NAICS 2002)
CONTRIBUTION TO GDP BY SUBSECTORPE
RCE
NT
Wood product manufacturing
Pulp and paper manufacturing
Forestry and logging
0
0.25
0.50
0.75
1.00
1.25
1.50
1991 1992 1993 1994 1995 1996 1997 1998 1999 2000 2001 2002 2003 2004 2005 2006 2007 2008 2009

A n n U A L R e P o R t 2 0 1 03 5
INdICATOr: forest industry eMployMent
Why is this important?
– The Canadian forest industry is a major employer nationwide, particularly in many rural communities where forest-related work is the main source of income.
What has changed?
– In 2009, direct employment in the Canadian forest industry fell by 13% compared with 2008.
– The primary areas of decline were pulp and paper products manufacturing (-18%) and forestry, logging and support activities (-14.5%).
Source: Statistics Canada, quarterly survey of nancial statistics for entreprises, CANSIM Table 187-0002Note: 2006 data include 3% of return duties
RETURN ON CAPITAL EMPLOYED
PER
CEN
T
0
2
4
6
8
10
1999 2000 2001 2002 2003 2004 2005 2006 2007 2008 2009
Source: Statistics Canada, quarterly survey of nancial statistics for entreprises, CANSIM Table 187-0002
OPERATING PROFITS
Bill
ion
dolla
rs (
Cana
dian
)
-1
0
1
2
3
4
5
6
7
8
1999 2000 2001 2002 2003 2004 2005 2006 2007 2008 2009
Operating pro�ts
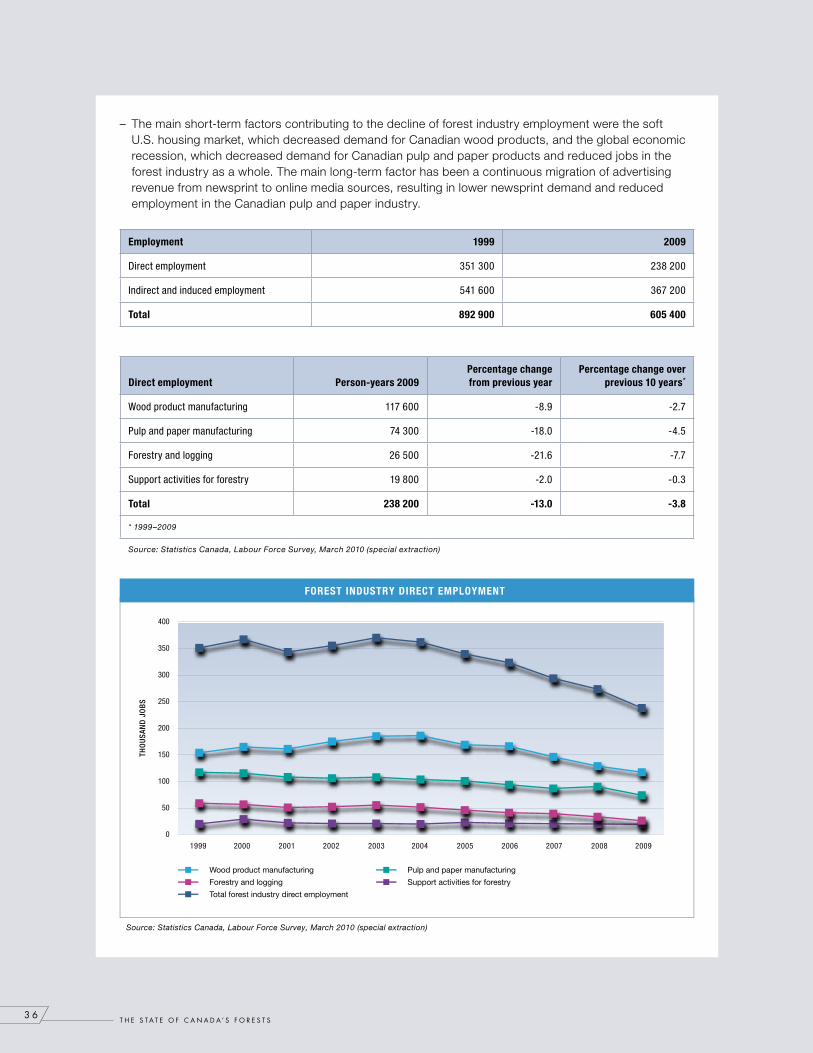
t H e s t A t e o F C A n A D A ’ s F o R e s t s 3 6
– The main short-term factors contributing to the decline of forest industry employment were the soft U.S. housing market, which decreased demand for Canadian wood products, and the global economic recession, which decreased demand for Canadian pulp and paper products and reduced jobs in the forest industry as a whole. The main long-term factor has been a continuous migration of advertising revenue from newsprint to online media sources, resulting in lower newsprint demand and reduced employment in the Canadian pulp and paper industry.
Direct employment Person-years 2009 Percentage change from previous year
Percentage change over previous 10 years*
Wood product manufacturing 117 600 -8.9 -2.7
Pulp and paper manufacturing 74 300 -18.0 -4.5
Forestry and logging 26 500 -21.6 -7.7
Support activities for forestry 19 800 -2.0 -0.3
Total 238 200 -13.0 -3.8
* 1999–2009
Source: Statistics Canada, Labour Force Survey, March 2010 (special extraction)
Source: Statistics Canada, Labour Force Survey, March 2010 (special extraction)
FOREST INDUSTRY DIRECT EMPLOYMENT
THO
USA
ND
JO
BS
Wood product manufacturing
Forestry and logging
Total forest industry direct employment
Pulp and paper manufacturing
Support activities for forestry
0
50
100
150
200
250
300
350
400
1999 2000 2001 2002 2003 2004 2005 2006 2007 2008 2009
Employment 1999 2009
Direct employment 351 300 238 200
Indirect and induced employment 541 600 367 200
Total 892 900 605 400

A n n U A L R e P o R t 2 0 1 03 7
INdICATOr: forest products
Why is this important?
– Canada’s forest products industry contributes substantially to the Canadian economy while forming the economic backbone of many rural communities.
– Canada is the world’s leading exporter of softwood lumber, panels, pulp and newsprint, and the third largest exporter of printing and writing paper.
What has changed?
– In 2009, the value of Canada’s forest product exports fell to $23.5 billion from $30.1 billion in 2008, a decline of 21.8%. This was primarily due to a corresponding decrease in the value of forest product exports to the U.S.
– The main reasons for the decline in exports were the low wood products demand associated with the weak U.S. housing market, reduced pulp and paper demand associated with the global economic recession and continued substitution of online media for paper based products.
Forest product exports Billion dollars 2009 Percentage change from previous year
Percentage change over previous 10 years*
Wood pulp 5.0 -27.9 -3.8
Softwood lumber 3.8 -26.2 -11.5
Printing and writing paper** 3.6 -14.2 -2.8
Newsprint 2.8 -34.3 -8.3
Structural wood panels 1.2 -20.6 -10.0
Other forest products 7.1 -11.3 -2.8
Total all forest products*** 23.5 -21.8 -6.2
* 1999–2009** Estimate calculated by the Canadian Forest Service based on data for the past five years from the Pulp and Paper Products Council *** Excludes non-timber forest products except Christmas trees
Source: Statistics Canada, merchandise trade data, monthly

t H e s t A t e o F C A n A D A ’ s F o R e s t s 3 8
S o c i e t y ’ S r e S p o n S i b i l i t yextensive forestry operations take place on Canada’s public lands, and many rural communities depend on the forest for their well-being. It’s therefore essential that forest practices reflect society’s economic, social and cultural values.
INdICATOr: forest-dependent coMMunities in canada
Why is this important?
– The forest industry is the main economic driver in nearly 200 Canadian rural communities. Sustainable forest management is particularly important to these communities because they are more likely than larger urban centres to suffer the costs of unsustainable practices, market fluctuations and environmental change.
– Assessing the economic impact of job losses in the industry is one way to measure this indicator.
What has changed?
– The number of rural communities where the forest industry is the main economic driver is down from approximately 300 recorded in the 2001 census to fewer than 200 in 2006. The primary cause of this drop was the decline in the forest sector between censuses. The impact on communities has been tempered by job growth in other sectors, particularly other resource sectors.
Source: Statistics Canada, merchandise trade data, monthly
Softwood lumber
Newsprint
Wood pulp
Structural wood panels
Printing and writing paper
Total all forest products
FOREST PRODUCT EXPORTSB
ILLI
ON
DO
LLAR
S (C
ANAD
IAN
)
0
5
10
15
20
25
30
35
40
45
50
1999 2000 2001 2002 2003 2004 2005 2006 2007 2008 2009

A n n U A L R e P o R t 2 0 1 03 9
– The forest industry labour force fell by approximately 24 200 people (7.1%) between the 2001 and 2006 censuses. In 2009, the industry lost about 6 600 jobs. In total, forest industry layoffs since 2003 have amounted to 47 795. Recent losses have been mostly in the wood sector; earlier losses were primarily in pulp. Increased demand from China has resulted in some mill re-openings in British Columbia.
– Factors contributing to these layoffs include the stronger Canadian dollar, offshore competition, lower U.S. housing starts and the mountain pine beetle infestation.
– Some communities have suffered significantly in recent years. However, quality of life indicators show that as a group, both currently and formerly forest-dependent communities have seen no decline in well-being. Many communities are diversifying their economies. This includes efforts to develop other forest-related values and services—such as recreation, ecotourism, bioenergy and non-timber products.
t H e s t A t e o F C A n A D A ’ s F o R e s t s4 0
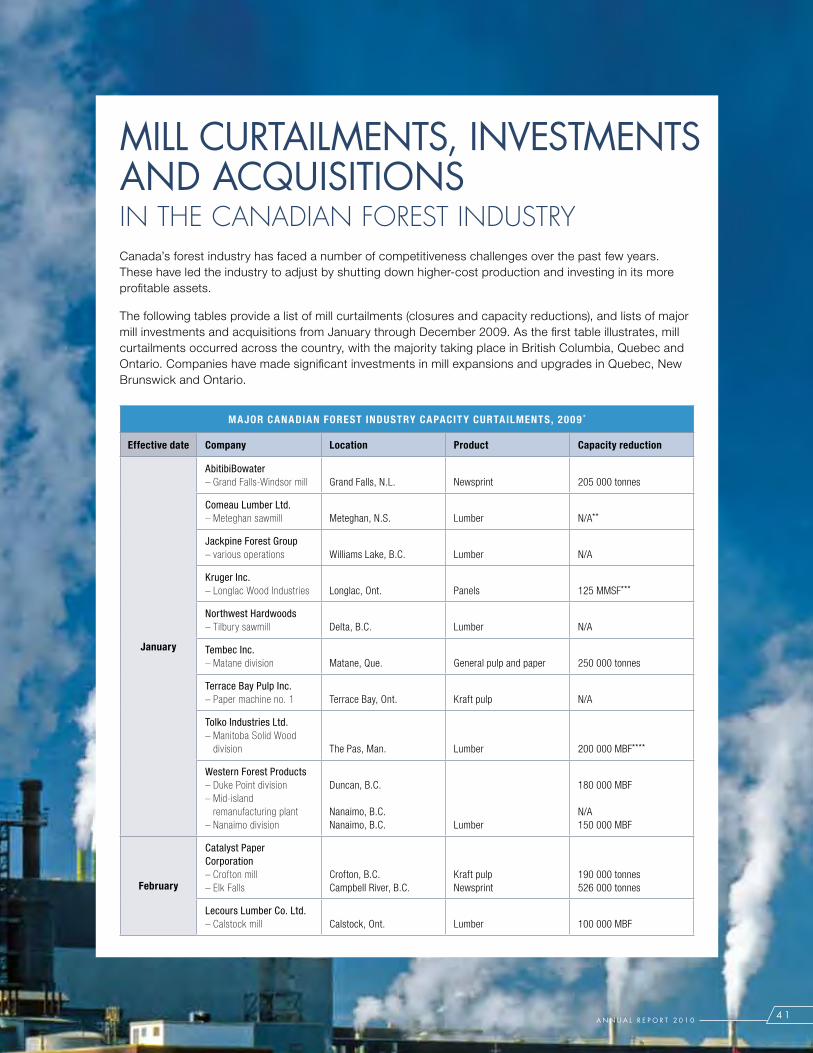
4 1A n n U A L R e P o R t 2 0 1 0
MILL CURtAILMents, InVestMents AnD ACQUIsItIons in the canadian forest industryCanada’s forest industry has faced a number of competitiveness challenges over the past few years. These have led the industry to adjust by shutting down higher-cost production and investing in its more profitable assets.
The following tables provide a list of mill curtailments (closures and capacity reductions), and lists of major mill investments and acquisitions from January through December 2009. As the first table illustrates, mill curtailments occurred across the country, with the majority taking place in British Columbia, Quebec and Ontario. Companies have made significant investments in mill expansions and upgrades in Quebec, New Brunswick and Ontario.
MAjOR CANADIAN FOREST INDUSTRY CAPACIT Y CURTAIlMENTS, 2009 *
Effective date Company location Product Capacity reduction
january
AbitibiBowater –GrandFalls-Windsormill Grand Falls, N.L. Newsprint 205 000 tonnes
Comeau Lumber Ltd.–Meteghansawmill Meteghan, N.S. Lumber N/A**
Jackpine Forest Group–variousoperations Williams Lake, B.C. Lumber N/A
Kruger Inc.–LonglacWoodIndustries Longlac, Ont. Panels 125 MMSF***
Northwest Hardwoods–Tilburysawmill Delta, B.C. Lumber N/A
Tembec Inc.–Matanedivision Matane, Que. General pulp and paper 250 000 tonnes
Terrace Bay Pulp Inc.–Papermachineno.1 Terrace Bay, Ont. Kraft pulp N/A
Tolko Industries Ltd.–ManitobaSolidWood
division The Pas, Man. Lumber 200 000 MBF****
Western Forest Products–DukePointdivision–Mid-island
remanufacturingplant–Nanaimodivision
Duncan, B.C.
Nanaimo, B.C.Nanaimo, B.C. Lumber
180 000 MBF
N/A150 000 MBF
February
Catalyst Paper Corporation –Croftonmill–ElkFalls
Crofton, B.C.Campbell River, B.C.
Kraft pulp Newsprint
190 000 tonnes526 000 tonnes
Lecours Lumber Co. Ltd.–Calstockmill Calstock, Ont. Lumber 100 000 MBF

t H e s t A t e o F C A n A D A ’ s F o R e s t s 4 2
MAjOR CANADIAN FOREST INDUSTRY CAPACIT Y CURTAIlMENTS, 2009 * (CONTINUED)
Effective date Company location Product Capacity reduction
February(Continued)
Millar Western Forest Products Ltd. –Whitecourtpulpmill Whitecourt, Alta. General pulp and paper 10 000 tonnes
Tolko Industries Ltd.–SlaveLakeOSBdivision Slave Lake, Alta. Panels 236 MMSF
Tembec Inc.–Chetwynddivision–Mattawadivision
Chetwynd, B.C.Mattawa, Ont.
Kraft pulpLumber
240 000 tonnes45 000 MBF
March
Carrier Lumber –Valemountdivision Valemount, B.C. Lumber 118 000 MBF
Howe Sound Pulp & Paper Ltd. Port Mellon, B.C. General pulp and paper N/A
Marathon Pulp Inc. Marathon, Ont. Kraft pulp 190 000 tonnes
NorSask Forest Products Inc.–MeadowLakesawmill Meadow Lake, Sask. Lumber N/A
April
Domtar Inc.–Ste-Mariesawmill Ste-Marie, Que. Lumber 60 000 MBF
Springer Creek Forest Products Slocan, B.C. Lumber N/A
May
AbitibiBowater –Comtoissawmill Lebel-sur-Quevillon, Que. Lumber 150 000 MBF
Fraser Papers –Thursomill Thurso, Que. Kraft pulp 245 000 tonnes
Newcastle Lumber Co. Inc. Newcastle, N.B. Lumber N/A
june
AbitibiBowater–Dolbeaumill Dolbeau-Mistassini, Que. Specialty paper 233 000 tonnes
Ainsworth Lumber Co. Ltd.–Lillooetveneerplant Lillooet, B.C. Panels 161 MMSF
Canfor–Radiumsawmill–Rustaddivision–Vaneby
Radium Hot Springs, B.CPrince George, B.C.Vaneby, BC Lumber
159 000 MBF371 000 MBF250 000 MBF
Catalyst Paper Corporation–Croftonmill–ElkFalls
Crofton, B.C.Campbell River, B.C. Kraft pulp N/A
Howe Sound Pulp & Paper Ltd. Port Mellon, B.C. Newsprint 77 000 tonnes
Kruger Inc.–CornerBrookmill Corner Brook, N.L. Newsprint 78 000 tonnes
Western Forest Products–Somasssawmill Port Alberni, B.C. Lumber N/A

A n n U A L R e P o R t 2 0 1 04 3
MAjOR CANADIAN FOREST INDUSTRY CAPACIT Y CURTAIlMENTS, 2009 * (CONTINUED)
Effective date Company location Product Capacity reduction
july
Commonwealth Plywood Shawinigan, Que. Panels N/A
Industries Perron Inc.–Fingerjointplant Trois-Rivières, Que. Lumber 150 MBF
Tolko Industries Ltd.–Creekside Williams Lake, B.C. Lumber 600 000 MBF
August
AbitibiBowater –ThunderBaymill Thunder Bay, Ont. Newsprint 396 000 tonnes
Louisiana-Pacific Canada Ltd.–EastRiversawmill East River, N.S. Panels N/A
St. Mary’s Paper Sault Ste. Marie, Ont. Specialty paper N/A
West Fraser Timber Multiple locations, B.C. Lumber 935 000 MBF
SeptemberTembec Inc. –PineFallsmill Pine Falls, Man. Newsprint 200 000 tonnes
October
AbitibiBowater–Beauprémill–FortFrancesdivision
Beaupré, Que.Fort Frances, Ont. Specialty paper
223 000 tonnes70 000 tonnes
JD Irving Ltd.–Sussexsawmill Four Corners, N.B. Lumber N/A
Kruger Inc.–Trois-Rivièresmill Trois-Rivières, Que. Specialty paper 110 000 tonnes
NovemberJD Irving Ltd. –Kedgwickdivision Kedgwick, N.B. Lumber N/A
December
Cascades–KingseyFallsmill Kingsey Falls, Que. Paperboard 86 000 tonnes
Catalyst Paper Corporation–Croftonmill Crofton, B.C. Newsprint N/A
Domtar Inc.–EarFallssawmill Ear Falls, Ont. Lumber 129 000 MBF
Tolko Industries Ltd.–HighLevelsawmill High Level, Alta. Lumber 385 000 MBF
Tolko Industries Ltd.–MeadowLakedivision Meadow Lake, Sask. Lumber N/A
Kruger Inc.–Wayagamack Trois-Rivières, Que. Specialty paper N/A
* Includes both partial (machine) and full mill closures whether indefinite or permanent; does not include shift reductions** N/A = not available*** MMSF = million square feet**** MBF = thousand board feet
Sources: Company press releases, newspaper articles
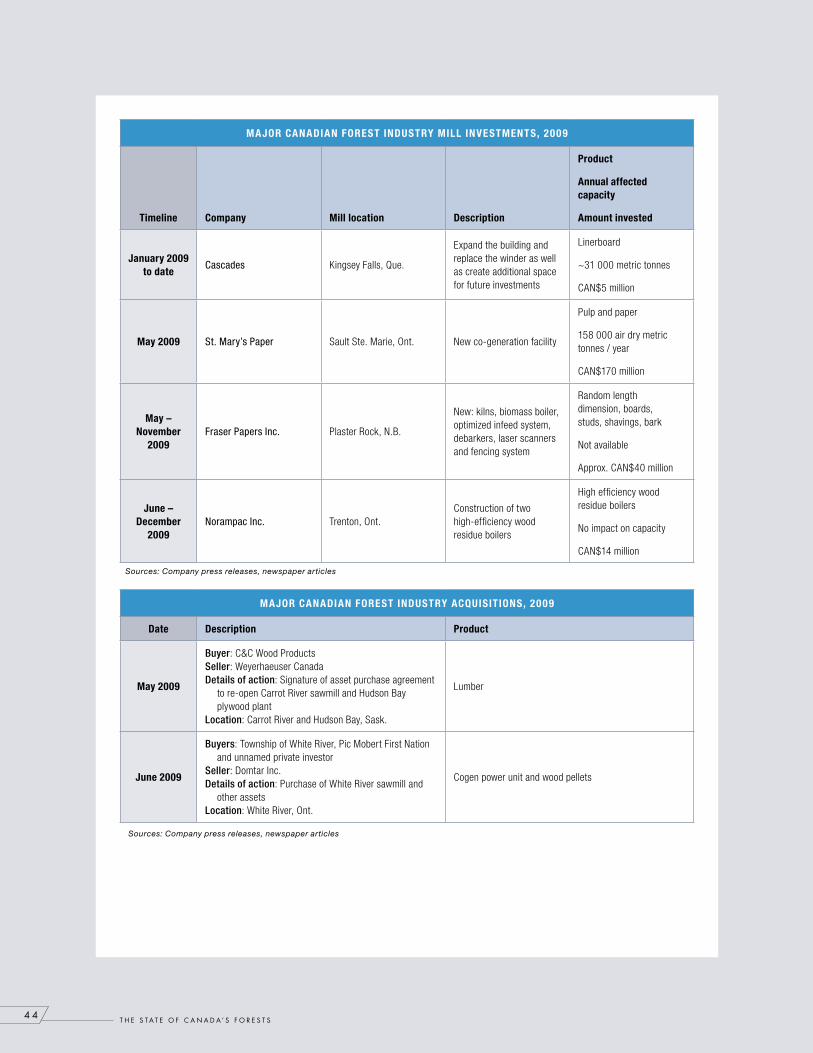
t H e s t A t e o F C A n A D A ’ s F o R e s t s4 4
MAjOR CANADIAN FOREST INDUSTRY MIll INVESTMENTS, 2009
Timeline Company Mill location Description
Product
Annual affected capacity
Amount invested
january 2009 to date
Cascades Kingsey Falls, Que.
Expand the building and replace the winder as well as create additional space for future investments
Linerboard
~31 000 metric tonnes
CAN$5 million
May 2009 St. Mary’s Paper Sault Ste. Marie, Ont. New co-generation facility
Pulp and paper
158 000 air dry metric tonnes / year
CAN$170 million
May – November
2009Fraser Papers Inc. Plaster Rock, N.B.
New: kilns, biomass boiler, optimized infeed system, debarkers, laser scanners and fencing system
Random length dimension, boards, studs, shavings, bark
Not available
Approx. CAN$40 million
june – December
2009Norampac Inc. Trenton, Ont.
Construction of two high-efficiency wood residue boilers
High efficiency wood residue boilers
No impact on capacity
CAN$14 million
Sources: Company press releases, newspaper articles
MAjOR CANADIAN FOREST INDUSTRY ACqUISITIONS, 2009
Date Description Product
May 2009
Buyer: C&C Wood Products Seller: Weyerhaeuser Canada Details of action: Signature of asset purchase agreement
to re-open Carrot River sawmill and Hudson Bay plywood plant
Location: Carrot River and Hudson Bay, Sask.
Lumber
june 2009
Buyers: Township of White River, Pic Mobert First Nation and unnamed private investor
Seller: Domtar Inc. Details of action: Purchase of White River sawmill and
other assets Location: White River, Ont.
Cogen power unit and wood pellets
Sources: Company press releases, newspaper articles
4
ABOUT NATURAL RESOURCES CANADA— CANADiAN FOREST SERviCEForests and forest resources are integral to Canadian life. The Canadian Forest Service is a science-based policy organization within Natural Resources Canada, a Government of Canada department that helps shape the natural resources sector’s important contributions to the economy, society and the environment.
For more than a century, the Canadian Forest Service has conducted research on the health of Canada’s forests to ensure that our nation’s forest sector needs are met without compromising the ability of future generations to meet their own needs. Today, using scientific data and economic analysis, the Canadian Forest Service plays a leadership role in advancing a new model for the forest sector, focused on two key areas: sustainability and competitiveness.
In its work related to sustainability, the Canadian Forest Service uses knowledge of natural and human-caused forest disturbances to develop models, tools and advice for forest practitioners, as well as adaptation options for addressing climate change. It also ensures that policy decisions related to resource development and sustainability are based on sound research.
In its work on competitiveness, the Canadian Forest Service aims at increasing economic opportunities for the Canadian forest sector; adding economic value to the forest sector through innovation; integrating innovation efforts and institutions into a more effective national system; and addressing challenges and building on new opportunities for forest-based communities.
Made up of research scientists, technicians, economists, policy analysts and other dedicated professionals, the Canadian Forest Service develops and shares knowledge about forests and brings together stakeholders to address regional, national and global forest issues. Whether conducting research in the field, performing tests in the lab or analyzing information and data, Canadian Forest Service staff are working to ensure healthy forests and a strong forest sector for Canada.

THE STATE OF CANADA’S FORESTS
ANNUAL REPORTANNUAL REPORT

![· Produced by the Australian Government Department of Education, Employment and Workplace . Relations. ISBN 978-0-642-78282-3 [PRINT] ISBN 978-0-642-78283-0 ISBN 978-0-642-782](https://static.fdocuments.in/doc/165x107/5facca188f21d94e9b431dcb/produced-by-the-australian-government-department-of-education-employment-and-workplace.jpg)