THE STATE OF BUG BOUNTY - HubSpot
21
THE STATE OF BUG BOUNTY Bug Bounty: A cooperative relationship between security researchers and organizations that allow the researchers to receive rewards for identifying application vulnerabilities without the risk of prosecution, thereby aiding companies to identify and resolve security problems that would otherwise go undetected. JULY 2015
Transcript of THE STATE OF BUG BOUNTY - HubSpot

THE STATE OF BUG BOUNTY
Bug Bounty: A cooperative relationship
between security researchers and
organizations that allow the researchers to
receive rewards for identifying application
vulnerabilities without the risk of prosecution,
thereby aiding companies to identify and
resolve security problems that would
otherwise go undetected.
JULY 2015

STATE OF BUG BOUNTY REPORT 2015 2©BUGCROWD INC.
CONTENTSINTRODUCTION 3
BUG BOUNTY 101 4 JUST WHAT IS A BUG BOUNTY PROGRAM? 4
WHAT KINDS OF ORGANIZATIONS RUN BUG BOUNTIES? 4
DO BUG BOUNTY PROGRAMS WORK? 5
BUG BOUNTY DATA: Q1 2013 – Q2 2015 IN REVIEW 6 A WORD ABOUT THE DATASET 6
SUMMARIZING THE RESULTS 6
DIVING INTO THE DATA 7 PROGRAM GROWTH BY QUARTER 7
THE RISE OF INVITATION-ONLY PROGRAMS 7
SIGNAL VS NOISE 8
SUBMISSIONS OPENED BY QUARTER 8
A PUBLIC PROGRAM LAUNCH 9
RESEARCHERS: WHO ARE THEY? 10 COMMUNITY GROWTH 11
RESEARCHER SUBMISSIONS 11
RESEARCHER BACKGROUND AND EXPERTISE 12
HOW ARE RESEARCHERS MEASURED? 12
TOP RESEARCHERS 13
TOP POINTS 13
TOP REWARDS 13
TOP SUBMITTER 13
VULNERABILITIES: WHAT ARE RESEARCHERS FINDING? 14 SUBMISSIONS BY PRIORITY 15
REWARDS: WHAT’S A BUG WORTH? 17
CONSIDERATIONS FOR STARTING YOUR OWN PROGRAM 19 BUDGETING REWARDS 19
DETERMINE THE TOTAL COST OF OWNERSHIP 20
GETTING STARTED 20
ABOUT BUGCROWD 21

STATE OF BUG BOUNTY REPORT 2015 3©BUGCROWD INC.
INTRODUCTIONThis document presents the inaugural State of Bug Bounty Report, an annual effort from the team at Bugcrowd. In this report, Bugcrowd program data gathered between January 2013 and June 2015 is aggregated and analyzed to paint a picture of the emerging market. By surveying programs on Bugcrowd’s platform we are able to identify emerging trends and patterns in the bug bounty market. With over 166 bounties run over two and a half years, Bugcrowd is uniquely positioned to observe these trends.
During the period of January 1, 2013 to June 30, 2015, Bugcrowd clients:
• Paid a total of $724,014 to 566 unique researchers • Received a total of 37,227 submissions, of which 7,958 contained valid vulnerabilities• Rewarded 3,621 submissions at an average of $200.81 each, with a top reward of
$10,000• Had, on average, 4.39 high- or critical-priority vulnerabilities per program
While Bugcrowd researchers:
• Discovered a total of 729 high-priority vulnerabilities across 166 programs, where 175 of those vulnerabilities were deemed “critical” by trained application security engineers
• Were paid for approximately 1 in every 5 submissions• Took home an average annual paycheck of $1,279.18 collected from over 6.41
submissions annually• Hailed primarily from India (31%), United States (18.2%), and United Kingdom (8.6%)
These numbers demonstrate the impressive economics behind bug bounty programs. As the bug bounty market continues to grow, it is important to us to maintain transparency into how vulnerabilities are reported, fixed and rewarded. Following, you will find an overview of Bugcrowd’s dataset, details on researchers and the vulnerabilities that they are discovering, the money being rewarded, and finally, how best to extract business value from a bug bounty program.
The Bugcrowd Team

STATE OF BUG BOUNTY REPORT 2015 4©BUGCROWD INC.
BUG BOUNTY 101JUST WHAT IS A BUG BOUNTY PROGRAM?In its most basic form, a bug bounty program is a rewards program offered by an organization to external parties, authorizing them to perform security assessments on the organization’s assets.
A program uses a “brief” as a form of contract, detailing how much the company will pay for each reported
bug. Commonly, only the first report of a valid (i.e. reproducible and fixable) vulnerability is rewarded; all
others are considered duplicates and are not rewarded. Rewards scale according to the severity of each
discovered issue and how hard it is to find.
WHAT KINDS OF ORGANIZATIONS RUN BUG BOUNTIES?Credit for the bug bounty concept is most commonly attributed to the Netscape team after their rewards
program was initiated in 1995. Large consumer tech companies such as Facebook and Google have
programs that are well known for their high rewards and significant participation.
Bug bounty programs are now commonly run on third-party platforms such as Bugcrowd. While this is
a recent development (Bugcrowd was founded in 2012), today the benefits of running a program via a
platform are significant versus setting up and running a program independently.
Bug bounty platforms manage the operational end of the programs, bringing the research community
together and handling the payment process, opening up the opportunity for more companies to
successfully run bug bounty programs.
To date, Bugcrowd’s customers are currently comprised of mainly B2C (business to consumer) and B2B
(business to business) technology companies.
Data from this report signals the growth of organizations outside of the high-tech industry that are
beginning to running bug bounty programs. Companies such as Western Union (started 2014) that offers
rewards ranging from $50 to $5000, Tesla Motors (started 2015) with rewards ranging from $25 - $1500,
and United Airlines(started 2015) have all created programs.

STATE OF BUG BOUNTY REPORT 2015 5©BUGCROWD INC.
DO BUG BOUNTY PROGRAMS WORK?On average, researchers find more than four high- or critical-priority vulnerabilities within a single program. The priority matrix below shows how Bugcrowd classifies high- and critical-priority vulnerabilities.
For a real-world example of how bug bounty results compare to traditional assessments, see Instructure’s
public security assessment reports. Instructure, which produces a learning management system,
has posted their assessment results every year since 2011. Its 2014 assessment was conducted with
Bugcrowd and kept to the same annual budget, yet produced more than three times as many valid findings
as the previous three years combined.
There are a number of other important factors to consider when evaluating how well a program works for
an organization. The marketing benefit of running a public program is substantial, and can indicate to an
organization’s customers and partners that security is a major priority for the organization.
Priority Level
Vulnerability Details
Critical
Vulnerabilities that cause a
privilege escalation on the
platform, from unprivileged to
admin or administrator.
• Remote code execution• Vertical authentication bypass• Exploitable SSRF• XXE• SQL injection• User-authentication bypass
High
Vulnerabilities that severely
affect multiple users or affect
the security of the underlying
platform.
• Lateral authentication bypass• Stored XSS• Exploitable CSRF with significant
impact

STATE OF BUG BOUNTY REPORT 2015 6©BUGCROWD INC.
BUG BOUNTY DATA: Q1 2013 – Q2 2015 IN REVIEW
A WORD ABOUT THE DATASETThe data analyzed in this report is gathered from programs run on the Bugcrowd platform and, where noted, from open public sources.
The dataset is specifically focused on Bugcrowd’s bounties—which are primarily run against web
applications, mobile applications and, in a small number of cases, hardware devices. The report does
not focus on non-application-layer VRP programs such as Google’s Chrome rewards program, HP’s
TippingPoint’s ZDI, or Microsoft’s Mitigation Bypass Bounty.
Bugcrowd’s bounty programs are comprised of two different types:
• Ongoing bounties are long-running bounties that incentivize researchers per submission based on
vulnerability severity. Programs may be public or invitation-only.
• Flex bounties are 2-4 week short term bug bounties that incentivize researchers with a placed
reward model. These programs are typically invitation-only and have 25-100 researchers
participating. In rare instances, a flex program may be publicly available.
Since its founding in early 2012, Bugcrowd has been through several data model iterations. The current
data model has been in place since the beginning of 2013. Approximately 20 programs that were run
before January 1, 2013 and fit outside of the current data model have been purposefully excluded.
SUMMARIZING THE RESULTS• Programs Run: 166
• 95 Ongoing Programs
• 71 Flex Programs
• Submissions received: 37,227
• Non-duplicate valid submissions: 7,958
• Paid submissions: 3,621
• High- and critical-priority submissions: 729
• High or critical priority vulnerabilities per
program: 4.39
• Submitted the most from India (31%), United
States (18.2%), and United Kingdom (8.6%)
• Most discovered vulnerability: XSS (17.8%)
• Range of minimum and maximum rewards:
$0 - $10,000
• Top reward: $10,000
• Total paid: $724,839
• Average reward per submission: $200.81
• Average reward per researcher: $1,279.18
(collected over 6.41 submissions)
• Total unique researchers paid: 566
• Countries that were most highly paid:
• Cyprus ($644 average reward)
• Switzerland ($512 average reward)
• Austria ($475 average reward)

STATE OF BUG BOUNTY REPORT 2015 7©BUGCROWD INC.
DIVING INTO THE DATAPROGRAM GROWTH BY QUARTEROverall new program growth is up significantly quarter over quarter. In the chart below, you can see the
combined total number of programs started over time, both public and invitation-only.
THE RISE OF INVITATION-ONLY PROGRAMSIn late 2014, the number of invitation-only programs exceeded the number of public programs on
Bugcrowd’s platform. This was driven by both an across-the-board trend of new bounties starting and
staying private for a longer period.
Bounties Started: Public vs. Invitation-Only
Source: Bugcrowd Bug Bounty Programs, Jan 2013 to 1H 2015
Invitation-OnlyPublic
0
10
20
30
40
50
2013 Q1 2013 Q3 2014 Q1 2014 Q3 2015 Q1
Figure 1: The number of bounties
started more than doubled in Q1’15 over the
same quarter the previous year.
Bounties Started: Public vs. Invitation-Only
2013 2014 2015
Bounties Started: Public vs. Invitation-Only
Invitation-OnlyPublic
Source: Bugcrowd Bug Bounty Programs, Jan 2013 to 1H 2015
0
20
40
60
80
100
Figure 2: Invitation-only
programs are now launched more frequently than
public programs.
Bounties Running: Public vs. Invitation-Only
STATE OF BUG BOUNTY REPORT 2015 8©BUGCROWD INC.
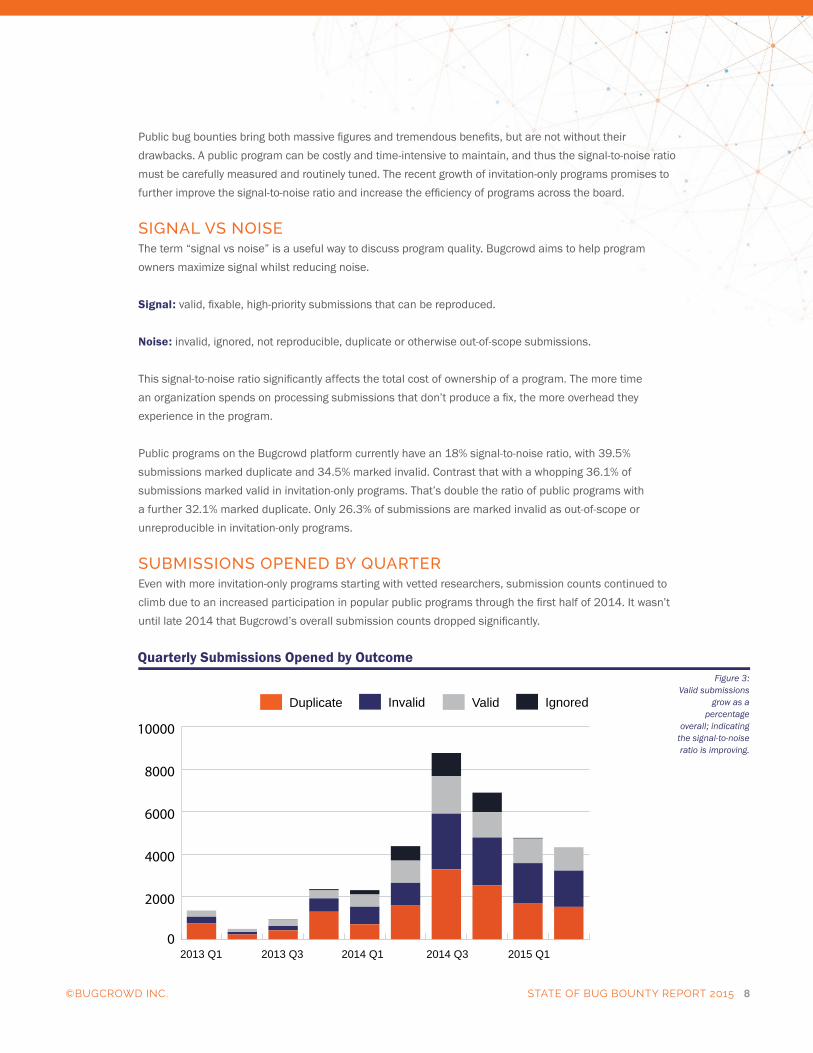
Public bug bounties bring both massive figures and tremendous benefits, but are not without their
drawbacks. A public program can be costly and time-intensive to maintain, and thus the signal-to-noise ratio
must be carefully measured and routinely tuned. The recent growth of invitation-only programs promises to
further improve the signal-to-noise ratio and increase the efficiency of programs across the board.
SIGNAL VS NOISEThe term “signal vs noise” is a useful way to discuss program quality. Bugcrowd aims to help program
owners maximize signal whilst reducing noise.
Signal: valid, fixable, high-priority submissions that can be reproduced.
Noise: invalid, ignored, not reproducible, duplicate or otherwise out-of-scope submissions.
This signal-to-noise ratio significantly affects the total cost of ownership of a program. The more time
an organization spends on processing submissions that don’t produce a fix, the more overhead they
experience in the program.
Public programs on the Bugcrowd platform currently have an 18% signal-to-noise ratio, with 39.5%
submissions marked duplicate and 34.5% marked invalid. Contrast that with a whopping 36.1% of
submissions marked valid in invitation-only programs. That’s double the ratio of public programs with
a further 32.1% marked duplicate. Only 26.3% of submissions are marked invalid as out-of-scope or
unreproducible in invitation-only programs.
SUBMISSIONS OPENED BY QUARTEREven with more invitation-only programs starting with vetted researchers, submission counts continued to
climb due to an increased participation in popular public programs through the first half of 2014. It wasn’t
until late 2014 that Bugcrowd’s overall submission counts dropped significantly.
Quarterly Submissions Opened By Type
Source: Bugcrowd Bug Bounty Programs, Jan 2013 to 1H 2015
IgnoredValidInvalidDuplicate
0
2000
4000
6000
8000
10000
2013 Q1 2013 Q3 2014 Q1 2014 Q3 2015 Q1
Figure 3: Valid submissions
grow as a percentage
overall; indicating the signal-to-noise ratio is improving.
Quarterly Submissions Opened by Outcome
STATE OF BUG BOUNTY REPORT 2015 9©BUGCROWD INC.
This drop in submission count was due to more invitation-only programs being launched, with between 25-100
researchers taking part in each invitation-only program. Notice, however, that valid submission counts continued
to grow as a percentage of overall incoming submissions, an indication that signal-to-noise ratio is improving
overall.
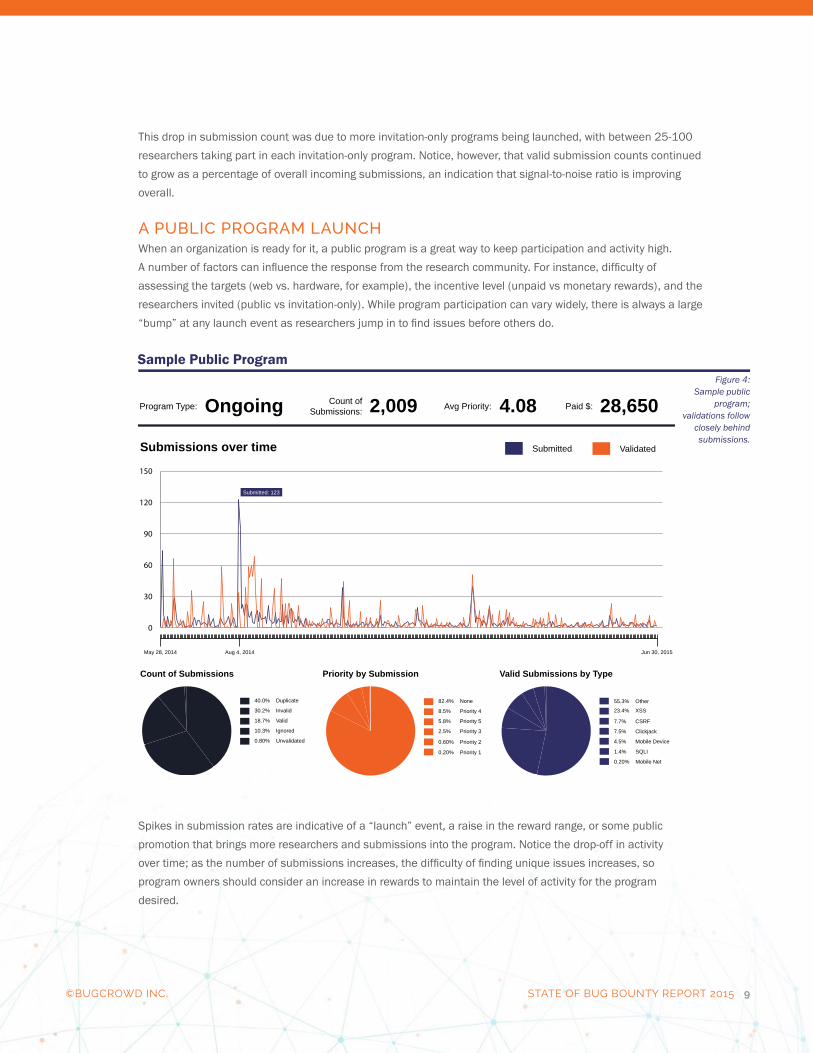
A PUBLIC PROGRAM LAUNCHWhen an organization is ready for it, a public program is a great way to keep participation and activity high.
A number of factors can influence the response from the research community. For instance, difficulty of
assessing the targets (web vs. hardware, for example), the incentive level (unpaid vs monetary rewards), and the
researchers invited (public vs invitation-only). While program participation can vary widely, there is always a large
“bump” at any launch event as researchers jump in to find issues before others do.
Spikes in submission rates are indicative of a “launch” event, a raise in the reward range, or some public
promotion that brings more researchers and submissions into the program. Notice the drop-off in activity
over time; as the number of submissions increases, the difficulty of finding unique issues increases, so
program owners should consider an increase in rewards to maintain the level of activity for the program
desired.
0
30
60
90
120
150
Submissions over time
2,009 4.08 28,650
Source: Bugcrowd Bug Bounty Programs, Jan 2013 to 1H 2015
Submitted
Count ofSubmissions:Ongoing Avg Priority:Program Type: Paid $:
Validated
Count of Submissions
40.0% Duplicate
May 28, 2014 Aug 4, 2014
Submitted: 123
Jun 30, 2015
30.2% Invalid
18.7% Valid
10.3% Ignored
0.80% Unvalidated
Valid Submissions by Type
55.3% Other
23.4% XSS
7.7% CSRF
7.5% Clickjack
4.5% Mobile Device
1.4% SQLI
0.20% Mobile Net
Priority by Submission
82.4% None
8.5% Priority 4
5.8% Priority 5
2.5% Priority 3
0.60% Priority 2
0.20% Priority 1
Figure 4: Sample public
program; validations follow
closely behind submissions.
Sample Public Program
STATE OF BUG BOUNTY REPORT 2015 10©BUGCROWD INC.
33% US
Count of Researchers: % of Overall
26% IN
5% GB
3% AU
2% PK
2% SG
2% DE
1% PH
1% CA
26% Other
5% NL
Count of Researchers: % of Other
Source: Bugcrowd Bug Bounty Programs, Jan 2013 to 1H 2015
5% RU
5% HK
3% EG
3% ES
3% FR
3% IT
3% TN
3% AR
67% ROW
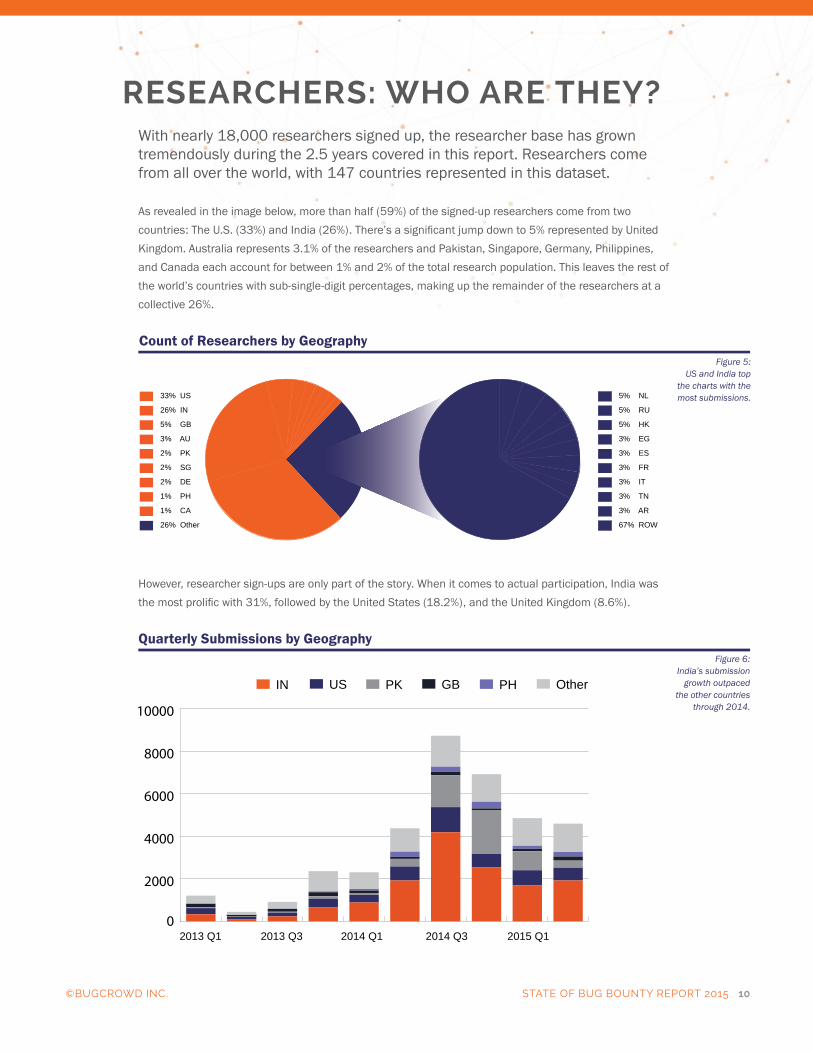
Figure 5: US and India top
the charts with the most submissions.
Count of Researchers by Geography
RESEARCHERS: WHO ARE THEY?With nearly 18,000 researchers signed up, the researcher base has grown tremendously during the 2.5 years covered in this report. Researchers come from all over the world, with 147 countries represented in this dataset.
As revealed in the image below, more than half (59%) of the signed-up researchers come from two
countries: The U.S. (33%) and India (26%). There’s a significant jump down to 5% represented by United
Kingdom. Australia represents 3.1% of the researchers and Pakistan, Singapore, Germany, Philippines,
and Canada each account for between 1% and 2% of the total research population. This leaves the rest of
the world’s countries with sub-single-digit percentages, making up the remainder of the researchers at a
collective 26%.
However, researcher sign-ups are only part of the story. When it comes to actual participation, India was
the most prolific with 31%, followed by the United States (18.2%), and the United Kingdom (8.6%).
Quarterly Submissions By Geo
Source: Bugcrowd Bug Bounty Programs, Jan 2013 to 1H 2015
GBPK OtherPHUSIN
0
2000
4000
6000
8000
10000
2013 Q1 2013 Q3 2014 Q1 2014 Q3 2015 Q1
Figure 6: India’s submission
growth outpaced the other countries
through 2014.
Quarterly Submissions by Geography

STATE OF BUG BOUNTY REPORT 2015 11©BUGCROWD INC.
COMMUNITY GROWTHAs of June 30, 2015, the Bugcrowd research community was home to 17,994 unique researchers
who, collectively, were responsible for a total of 37,227 submissions. As you can see, in mid-2014, the
submission rate per researcher began to grow significantly.
In order to counter this flow of increasing submissions per researcher, which was leading to increased
duplicate reports and, therefore, frustration for researchers, Bugcrowd started guiding customers to begin
their bounty with an invitation-only program.
Quarterly Submissions From Researchers
SubmissionsResearchers Valid Submissions
Source: Bugcrowd Bug Bounty Programs, Jan 2013 to 1H 2015
0
10000
20000
30000
40000
50000
2013 Q1 2013 Q3 2014 Q1 2014 Q3 2015 Q1
Figure 7: Submission rates
per researcher grow beginning
mid-2014.
Quarterly Submissions vs. Signups
RESEARCHER SUBMISSIONSOn average, researchers submitted 15.77 submissions, with eight of those marked valid by program
owners, and 6.42 of them paid. That said, researcher activity varied wildly with the most prolific submitter
making 1,092 submissions.
Submissions by Researcher
Source: Bugcrowd Bug Bounty Programs, Jan 2013 to 1H 2015
0
200
400
600
800
1000
1200
Unique Researchers
Figure 8: Submission
activity per user followed a long-tail
curve.
Submission Count by Researcher

STATE OF BUG BOUNTY REPORT 2015 12©BUGCROWD INC.
RESEARCHER BACKGROUND AND EXPERTISEResearchers are driven by different motives and have experience in different areas, with expertise across
numerous technologies, both software and hardware. A word graph of researcher biographies paints a
clear image of a deeply focused application security team.
HOW ARE RESEARCHERS MEASURED?Today, Bugcrowd researchers are measured on four key elements, each of which intersects with,
and builds upon, the others:
• Trust: First and foremost in researcher measurement is trust. Researchers are scored based on
their track record of staying inside the terms of the bounty brief, which includes following the scope
and honoring any non-disclosure requirements.
• Acceptance rate and overall submission quality: Acceptance rate is a measure of how often a
researcher’s submissions are accepted as “valid” by a program owner. The minimum acceptance
rate on invitation-only bounties is 50%.
• Finding Severity: Submission priority rate is measured between 1.0 (critical) and 3.99 (low).
Researchers must have a priority rate of better than 3.99 in order to qualify for invitations.
• Activity: Researchers must have submitted in the last 90 days to qualify as active.
These items are factored into researchers overall scores, which directly influence invitations to invitation-
only programs. For new researchers, the best thing they can do is participate in a public program and show
activity.

STATE OF BUG BOUNTY REPORT 2015 13©BUGCROWD INC.
TOP RESEARCHERSResearchers come from all walks of life and possess different backgrounds and skillsets. Below are the
profiles of some of the top researchers participating in Bugcrowd client bounty programs.
Top PointsThe current points leader researcher hails from Malaysia and has submitted 431 submissions since his
first entry on January 21, 2013. While this researcher is very prolific in his research activity, he remains
selective when it comes to submissions, especially when compared to the top submitter who sported
nearly 1,100 submissions since his first entry on February 18, 2014.
What gives the leaderboard position its value is its combination of count, acceptance rate, and priority. The
current points leader has an average bug priority rating of 3.76 (lower is better).
Top RewardsNot far behind the points leader in submission count is the top paid researcher with 292 submissions
since their first submission on February 28, 2013—presumably made from his hometown in the United
Kingdom. Compared to the research points leader, the top paid researcher is even more selective on the
bugs he submits. This can be seen in his 3.3 average priority rating (one of the best on the platform).
This researcher averages $306 per submission, nearly 50% more than the average. Simply put, this
researcher’s submissions are high quality.
Top SubmitterA self-employed “security researcher” based in Pakistan was the most prolific submitter overall with a
submission count of 1,094—nearly three times that of the points leader and nearly four times that of
the top paid researcher. This is especially noteworthy given his first submission wasn’t until February 18,
2014—roughly a year later than the points and rewards leaders.
While his 1,094 submissions make him the top submitter out of the entire research community, a well-
below-average priority rating of 4.42 and a very low total average reward per valid submission of $20.54
make this researcher very noisy. These figures suggest that this researcher uses a shotgun approach for
finding and submitting bugs, even if the issues found end up being flagged as invalid bugs. Further proving
this hypothesis is the fact that this researcher possesses an extremely low 4% acceptance rate for his
submissions.
Given these figures, one might come to the conclusion that this researcher puts a higher value on
submission count notoriety over rewards—with 120 Hall of Fame entries, it would be hard to argue this
point. So, while very proactive and active, simply put, this researcher submits things that aren’t as valuable
as other researchers’ submissions. The top, in this case, is far noisier than signal desired.

STATE OF BUG BOUNTY REPORT 2015 14©BUGCROWD INC.
VULNERABILITIES: WHAT ARE RESEARCHERS FINDING?
The top six vulnerabilities found in all programs (public and invitation-only) represent 32.3% of the vulnerability types uncovered:
XSS, CSRF and SQL injection are still driving top vulnerability submissions—which is consistent across
other publicly available bug bounty data from Google’s and Facebook’s programs. The 67.7% of “other”
vulnerabilities can be broken down into the following categories:
67.7% Other
Top Vulnerabilities: Public and Private
Source: Bugcrowd Bug Bounty Programs, Jan 2013 to 1H 2015
17.9% XSS
8.2% CSRF
2.9% Clickjack
1.7% Mobile_Device
1.3% SQLI
0.3% Mobile_Net
Figure 9: XSS and CSRF continue to top
the vulnerability charts.
Top Vulnerability Types: Public and Invitation-Only
11.2% Information Leakage
Other Vulnerabilities: Public and Invitation-Only
Source: Bugcrowd Bug Bounty Programs, Jan 2013 to 1H 2015
10.9% Abuse of Function
10.3% Anti Automation9.5% Password Recovery8.4% TLS Configuration
4.7% Lack of Security Headers4.7% Session Expiration Issues4.1% Authentication Issues
3.9% Mixed Content
3.9% Predictable Resource Location3.9% URL Redirect3.4% SPF Configuration
3.3% DNS Configuration Issues3.3% Process Validation
3.0% Authorization Issues
11.6% Other
Figure 10: There is a wide distribution of vulnerabilities
identified by the researchers.
Other Vulnerability Types: Public and Invitation-Only

STATE OF BUG BOUNTY REPORT 2015 15©BUGCROWD INC.
Generated from submission titles, the word graph below demonstrates an interesting view of the common
vulnerability types being found in both the public and invitation-only programs. Items that pop out in the
resulting word cloud are the two primary vulnerability types: XSS and CSRF. Vulnerability terms associated with
access control also stand out in this image: passwords, logins, authentication, session, and tokens.
SUBMISSIONS BY PRIORITYWhen evaluating the priorities associated to the submissions, it’s clear that the signal-to-noise ratio
appears to follow the common 80/20 rule. Across all programs the signal value is a collective 20%. The
other 80% of submissions were marked invalid or duplicate.
80.8% None
Priority per Submission
Source: Bugcrowd Bug Bounty Programs, Jan 2013 to 1H 2015
8.6% Priority 4
5.3% Priority 5
3.3% Priority 3
1.5% Priority 2
0.5% Priority 1
0.0% Priority 0
Figure 11: The 80/20
rule applies to invalid/duplicate
submissions vs valid.
Priority per Submission Across All Submissions

STATE OF BUG BOUNTY REPORT 2015 16©BUGCROWD INC.
5% Priority 1
Bug Priority by Count of Submissions - All Programs
Source: Bugcrowd Bug Bounty Programs, Jan 2013 to 1H 2015
8% Priority 2
17% Priority 3
44% Priority 4
26% Priority 5
Figure 12: 30% of
submissions possess a severity
level of 3 or higher.
Bug Priority by Count of Submissions - All Programs
Diving into the submissions that possessed an assigned priority, we find critical submissions at 5%, high
priority at 8% and moderate at 17%—collectively, 30%.

STATE OF BUG BOUNTY REPORT 2015 17©BUGCROWD INC.
REWARDS: WHAT’S A BUG WORTH?Year over year, the average payment is increasing, which is a factor of each program’s growth and the overall competition for every researcher’s time. As program owners begin to see submissions taper off, they are encouraged to raise rewards to compensate for the increased time investment. Higher paying bugs imply better security!
The average reward is growing each year, having started at approximately $180 in 2013 and reaching an
average reward level of just above $200.
0
50
100
150
200
250
Yearly Average Reward per Submission
Source: Bugcrowd Bug Bounty Programs, Jan 2013 to 1H 2015
2013 2014 2015
Figure 13: Average reward
climbs from $180 in 2013 to over $200 in 2015.
Average Reward by Year

STATE OF BUG BOUNTY REPORT 2015 18©BUGCROWD INC.
• THE TOP PRIZE, A $10,000
REWARD, WAS PAID TO A
RESEARCHER AFTER HE
DEMONSTRATED A PROOF-OF-
CONCEPT EXPLOIT FOR A CROSS-
SITE REQUEST FORGERY (CSRF)
VULNERABILITY, ALLOWING
A USER TO RESET AN ADMIN
ACCOUNT PASSWORD ON A
WELL-KNOWN E-COMMERCE
PLATFORM.
Figure 15: Top reward in Q4 2014 was
$10,000—double that of any other quarter thus far.
Top Reward by Quarter
2000
4000
6000
8000
10000
Top Reward - Quarter
Source: Bugcrowd Bug Bounty Programs, Jan 2013 to 1H 2015
2013
Q1
2013
Q3
2013
Q4
2014
Q1
2014
Q2
2014
Q3
2014
Q4
2015
Q1
2015
Q2
0
100
200
300
0
46.6K
93.2K
140K
400
500
600
700
800
Quarter Over Quarter Reward Details
Source: Bugcrowd Bug Bounty Programs, Jan 2013 to 1H 2015
Count of Rewards Total Sum of Amount
2013
Q1
2013
Q3
2013
Q4
2014
Q1
2014
Q2
2014
Q3
2014
Q4
2015
Q1
2015
Q2
Figure 14: Number of
rewards increasing with the total amount paid.
Total Reward vs. Number of Payouts
The chart below shows how the reward count and total amount is increasing quarter over quarter—which
translates to more bugs being found over time, along with the total payment increasing rapidly.

STATE OF BUG BOUNTY REPORT 2015 19©BUGCROWD INC.
CONSIDERATIONS FOR STARTING YOUR OWN PROGRAM
It’s important to realize that bug bounty programs involve a journey that may span your entire software development lifecycle. This section discusses these and other considerations that should be taken into account when preparing your own bug bounty program.
BUDGETING REWARDSIn 2014, Bugcrowd started guiding its customers to launch their program as invitation-only with a reward
range of $50-$500. Today, customers are guided to start with a reward range of $100-$1000, and to plan
to increase these amounts over time to maintain desired activity levels.
Depending on their security maturity level, the upper reward may be increased significantly to aim for
higher average rewards. For instance, security-mature financial customers are guided to increase their
rewards to obtain an average reward of $500-600, where most customers are guided toward obtaining an
average reward of $300.
It is useful to consider a maturity model when discussing how to budget for rewards. In the model below,
four maturity levels are determined from the spectrum.
Maturity: Blocking and Tackling: In most reactive organizations, bug bounties are a good way to
build awareness among stakeholders in organizational security, but there is not much budget available.
Organizations with this level of maturity should aim for an average reward of $100-200.
Maturity: Compliance Driven: In organizations with a primarily compliance-driven approach to security,
many controls may be in place, but there is not an organization-wide focus on security. A bug bounty can
bring belief in the threat of malicious actors and help propel a security program forward. Organizations with
this level of maturity should aim for an average reward of $200-500.
Maturity: Risk-based approach: As organizations implement an SDLC and advanced controls such as
code review, ongoing assessments, and a dedicated security focus, the average reward should increase.
Organizations with this level of maturity should aim for an average reward of $500-1,500
Maturity: Security Mature: In the most security mature organizations, where there are dedicated internal
testing teams in combination with an advanced SDLC, an average reward of $1,500 or more is appropriate.
It’s important to note that the market is still evolving and this guidance is subject to change based on new
information. Organizations should start with smaller amounts, and increase them over time in order to
obtain the desired level of activity.
These numbers above note the average reward, not suggested payment ranges, but ranges are important
for setting expectations. The current starting range for Bugcrowd programs is $100-1,000, and customers
are urged to increase the top reward amount as their program grows.

STATE OF BUG BOUNTY REPORT 2015 20©BUGCROWD INC.
DETERMINE THE TOTAL COST OF OWNERSHIPRewards budgeting is only part of the total cost of ownership. Organizations must also consider that there’s
a cost associated with staffing and running a program that should be factored into the overall cost.
With market-level rewards, organizations running public programs should plan to spend as much as they do
in rewards as they do on processing the submissions and managing incoming flow.
A public program will have a much higher noise ratio than invite-only programs. For invitation-only
programs, plan to spend 50% of your rewards budget on processing incoming issues.
Either way, be sure to have adequate staffing in place when launching a program, and consider starting
with an invitation-only program.
Key items to consider when thinking about the time required to run a successful program:
• Time invested organizing and launching the program
• Top and total reward amounts for the program
• Business hours spent looking at submissions and coordinating with the researchers
• Addressing the issues identified
• Communicating the results to the business
It’s important to consider and compare these TCO elements to the alternatives such as the cost of
a consultants, pen testers, and testing tools used in traditional security testing programs. There are
a number of other important factors to consider when evaluating how well a program works for an
organization. The marketing benefit of running a public program is significant, even if difficult to measure. It
can signal to an organization’s customers that security is a major priority for the organization.
GETTING STARTEDBug bounty programs are emerging as a way to give organizations the talented workforce required to make their applications and hardware secure. This approach enables a small team to easily create and manage a full-featured application security assessment program. As part of the process, you will also need to determine how much time and money to invest and how quickly you’d like the program to grow. For many organizations that want to launch an ongoing program, an invitation-only program with increasing rewards over time is a great way to get started. For organizations that want to replace their penetration testing budget, Flex is a great way to try out the economics of bug bounty.

STATE OF BUG BOUNTY REPORT 2015 21©BUGCROWD INC.
An innovator in crowdsourced security testing for the
enterprise, Bugcrowd harnesses the power of more
than 18,000 security researchers to surface critical
software vulnerabilities and level the playing field
in cybersecurity. Bugcrowd also provides a range of
responsible disclosure and managed service options
that allow companies to commission a customized
security testing program that fits their specific
requirements. Bugcrowd’s proprietary vulnerability
disclosure platform is deployed by Western Union,
Pinterest, Drupal and many others. Based in San
Francisco, CA, Bugcrowd is backed by Costanoa
Venture Capital, Rally Ventures, Paladin Capital Group
and Blackbird Ventures.
For more information visit www.bugcrowd.com.