![[Type text] - foi.tfl.gov.ukfoi.tfl.gov.uk/FOI-2292-1920/Internal Apprenticeship principles.pdf · EVERY JOURNEY MATTERS Apprentice Development . EVERY JOURNEY MATTERS Apprentice](https://static.fdocuments.in/doc/165x107/5f6bc878df9cf61310216ad0/type-text-foitflgovukfoitflgovukfoi-2292-1920internal-apprenticeship.jpg)
the State of Apprenticeship in 2010cep.lse.ac.uk/pubs/download/special/cepsp22.pdf• School system...
40
AMBASSADORS NETWORK the State of Apprenticeship in 2010 International Comparisons Australia Austria England France Germany Ireland Sweden Switzerland A Report for the Apprenticeship Ambassadors Network Hilary Steedman
Transcript of the State of Apprenticeship in 2010cep.lse.ac.uk/pubs/download/special/cepsp22.pdf• School system...
AMBASSADORS NETWORK
the State of Apprenticeship
in 2010 International Comparisons
Australia Austria England France Germany Ireland Sweden Switzerland
A Report for the Apprenticeship Ambassadors NetworkHilary Steedman
B the State of Apprenticeship in 2010
01
This publication can be downloaded free of charge at www.employersforapprentices.gov.uk/docs/research/Research_1_604.pdf or http://cep.lse.ac.uk/pubs/download/special/cepsp22.pdf
Foreword 1
Apprenticeship in England in Context: Overview 2 1. Apprenticeship in 2010: Australia 5
2. Apprenticeship in 2010: Austria 9
3. Apprenticeship in 2010: England 13
4. Apprenticeship in 2010: France 19
5. Apprenticeship in 2010: Germany 23
6. Apprenticeship in 2010: Ireland 27
7. Apprenticeship in 2010: Sweden 30
8. Apprenticeship in 2010: Switzerland 33
Contents
Explanatory Note
Each chapter in this Report is structured in the same way. Chapters may be read as stand-alone studies without reference to the full Report. All chapters use the same headings in the same order as follows:
• School system
• Post-compulsory vocational routes
• Governance and content
• Apprentice occupations
• Completion and progression
• Careers guidance
• Quality of entrants
• Demand for apprenticeship
• Funding apprenticeship
Hilary Steedman is a Research Associate at the Centre for Economic Performance, The London School of Economics and Political Science [email protected]

the State of Apprenticeship in 2010 1
ForewordContents
I am pleased to commend this report, commissioned by the Apprenticeship Ambassadors Network, of which I am Chairman. The Network is a group of senior business leaders committed to the expansion and development of Apprenticeships.
In an earlier report ‘The Net Benefit to Employer Investment in Apprenticeship Training’ (University of Warwick Institute for Employment Research, 2008) we set out the business case for Apprenticeships. That proved to be an effective medium for communicating the real and tangible benefits to employers. This time we wanted to draw comparisons on the planning and delivery of Apprenticeships in a number of other countries, with a particular focus on employer participation and involvement. Apprenticeships in this country are amongst the world’s best, but we cannot be complacent and we need to know what is happening in competitor countries and what lessons can be learnt
I was re-assured in the recent general election that all the main political parties signalled their support for the expansion of Apprenticeships.
I am grateful to Hilary Steedman for producing this report which I am sure will be of interest to employers and employer organisations, Government and policy makers, training organisations, trade unions, awarding bodies, academics in the vocational training field and others.
We will continue to argue the case with employers for greater involvement in Apprenticeships – they are good for young people, companies and the economy in general.
Sir Roy Gardner Chairman, Compass Group plc Chairman, Apprenticeship Ambassadors Network August 2010
2 the State of Apprenticeship in 2010
Apprenticeship in England in Context: Overview
The vocational route post-16
Education and/or training beyond the end of compulsory education to age 18 or 19 is now almost universal in the countries we report on here. England has rather lower levels of participation in education and training 16-19 than the other seven countries and much lower proportions achieving an upper secondary (Level 3) qualification by the vocational route.
Countries with apprenticeship – Australia, Austria, England, France, Germany, Ireland, Switzerland
Dual-system countries – Austria, Germany, Switzerland
No apprenticeship – Sweden
How apprenticeship contributes to vocational learning
Apprenticeship is the main vocational route to upper secondary qualification (Level 3) in the dual-system countries. In other apprentice countries, Australia, England, France and Ireland, more young people are in full-time vocational courses than in apprenticeship. Sweden offers only full-time vocational courses for 16-19 year olds but plans to introduce some apprenticeship into upper secondary provision in 2011.
How old are apprentices?
In France and the three dual-system countries apprenticeship is only available to young people aged 25 or less while in England just under one quarter and in Australia nearly half of all apprentices are over 25.
Where is employer involvement or ‘ownership’ strongest?
Apprenticeship is regulated by law in all seven apprentice countries and all have formal structures for involving employers in decision-making on apprenticeship policy and programmes. However, employer commitment of time, energy and resources is highest in the dual-system countries where at least half or more of all young people enter apprenticeship. In Switzerland employers claim ‘ownership’ of all main features of apprenticeship while in Austria employer organisations provide statistics and contribute to research. The OECD Jobs Review team points out that ‘few countries have achieved strong employer engagement without an equally strong apprenticeship system which remains elusive in England and Wales’.
How long to complete an apprenticeship?
In all apprenticeship countries except Australia and England most apprenticeship programmes take three years to complete or, in the case of Ireland, 4 years. In Australia, traditional apprenticeships last for three years and traineeships last on average for one year. In England
the average for all apprenticeships is between one and two years.
What must apprentices learn?
All the apprenticeship countries require periods of off-the-job training to form part of the apprenticeship programme. This is usually equivalent to a minimum of one day a week; in Australia and England the minimum is rather less.
All countries require apprentices to consolidate and improve their numeracy and communication skills and to acquire underpinning theoretical knowledge in addition to occupational competency.
Who provides core skills and underpinning knowledge?
In the dual-system countries and in Ireland and France core skills and underpinning knowledge are provided off-the-job in publicly-administered vocational colleges; in France, these are known as Apprentice Centres and are provided and run by employer organisations. In Australia and England core skills and underpinning knowledge may be acquired either on-the-job or off-the-job, facilitated by providers who may be public or private.
How does the apprentice acquire occupational skills?
In the dual-system countries, employers must ensure that apprentices acquire the required range of occupational skills on-the-job and on their own premises. In France, skill training is also provided in the employer-run Apprentice Centres and in Ireland skill training is also shared between employers and the Technical Colleges attended off-the-job by apprentices. In England and Australia, public and private providers take responsibility for ensuring that apprentices acquire the required competencies – although employers provide much informal on-the-job training.
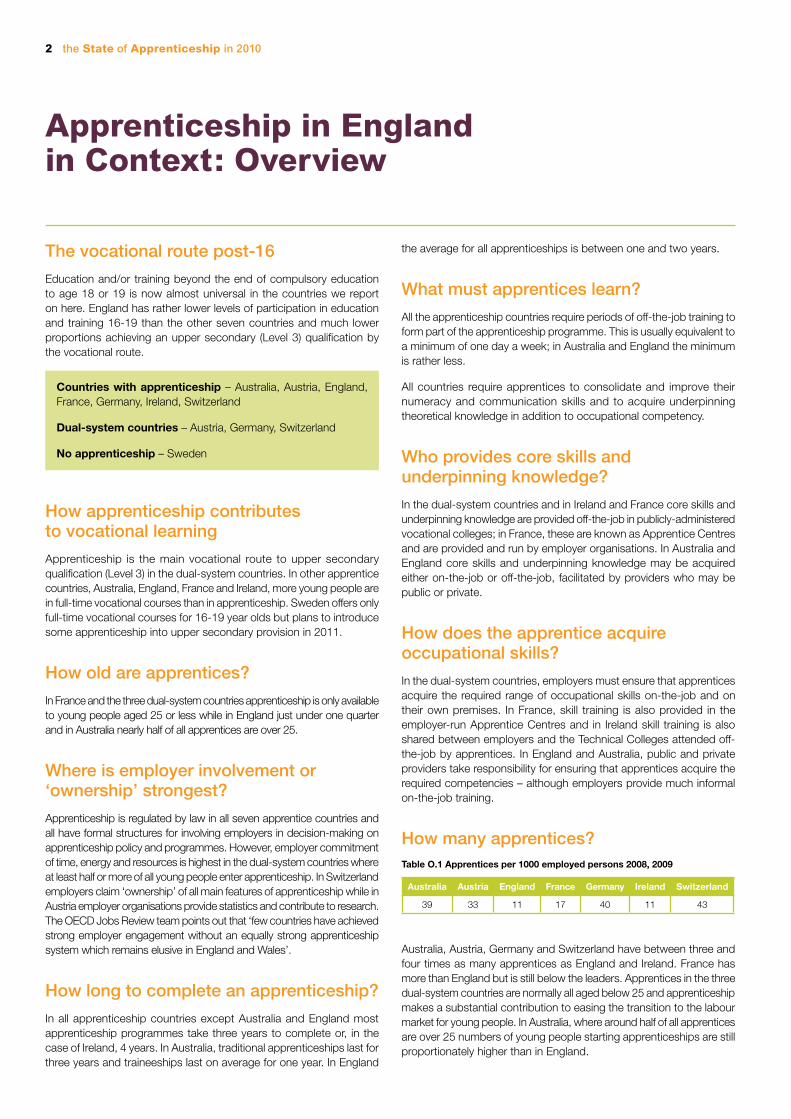
How many apprentices?Table O.1 Apprentices per 1000 employed persons 2008, 2009
Australia Austria England France Germany Ireland Switzerland
39 33 11 17 40 11 43
Australia, Austria, Germany and Switzerland have between three and four times as many apprentices as England and Ireland. France has more than England but is still below the leaders. Apprentices in the three dual-system countries are normally all aged below 25 and apprenticeship makes a substantial contribution to easing the transition to the labour market for young people. In Australia, where around half of all apprentices are over 25 numbers of young people starting apprenticeships are still proportionately higher than in England.
the State of Apprenticeship in 2010 3
Are all apprenticeships the same?
Australia, England and France all offer apprenticeships at more than one level of skill: most frequently Certificate 2 and Certificate 3 in Australia, Levels 2 and 3 in England and a range of qualifications in France which start at Level 2 and continue to degree level. Of these, England is the only country where apprenticeships at Level 2 far outnumber those offered at Level 3. In Australia most apprenticeships are at Certificate 3 level and in France just under half are at Level 2. In the dual system countries and in Ireland almost all apprenticeships are at Level 3.
What jobs are apprentices trained for?
Looking only at the most popular apprentice occupations in each country, service sector occupations dominate in Australia, Austria, England and Switzerland. The service sector and industrial/craft occupations are equally epresented in Germany. In France, construction, process industries and engineering outnumber apprenticeships in the service sector while in Ireland apprenticeships are only offered in construction and industrial occupations. In all apprentice countries young women are over-represented in the service sector, particularly in the low pay occupations while young men predominate in construction, industrial and craft apprenticeships.
How many complete their apprenticeship and can they go further?
Completion rates are high in the dual-system countries where apprentices are assessed by externally set written examinations, practical tests and oral interview. In England, assessment is often less rigourous; rates have improved recently to approach those of the dual-system countries. France and Ireland also assess by external tests and have similar completion rates to England.
Progression from one level of apprenticeship to a higher level is most frequent in France where apprentices study for vocational qualifications that are the same as those available in full-time education. Switzerland has successfully introduced a course of study and examination open only to those with completed apprenticeship that can lead to a vocational university course and Germany is currently encouraging similar arrangements. In the other apprentice countries apprentices only rarely continue to university.
Careers guidance
In the dual system countries young people must find their own apprenticeship places by making a direct application to an employer. To do this, young people must be informed in good time of the factors to be considered in making a choice of occupation. To achieve this, students are offered well-established programmes of careers education in schools which examines apprenticeship occupations, the prospects they offer and the type of work involved so that students can make an informed choice of route post-16.
Careers education is supported by publicly-funded careers offices and also by employer organisations and individual employers who advertise their apprenticeship opportunities and explain them to applicants. In Australia prospective apprentices are referred to employers through a network of Australian Apprenticeship Centres which in turn contact providers or Group Training Organisations. Both France and England suffer from indifference and sometimes hostility towards work-based training in schools and little or no advice is provided.
Quality of new apprentices
The PISA tests provide an indication of the levels of numeracy achieved in school and are an indicator of the quality of basic schooling. Scores of 15 year olds on the PISA assessment in mathematics show England below all the seven countries in the study. Switzerland and Australia have substantially higher scores than England. Austria and Sweden have scores that are higher and statistically significant.
The OECD organizes, administers and publishes PISA (Programme for International Student Assessment). PISA is an internationally standardised assessment that was jointly developed by participating economies and administered to15-year-olds in schools. Three assessments have so far been carried out (in 2000, 2003, 2006 and 2009). Data for the assessment which took place in 2009 will be released on 7 December 2010. Tests are typically administered to between 4,500 and 10,000 students in each country.
Germany, Ireland and France have slightly higher scores but the difference is not statistically significant.
In the dual system countries smaller proportions of young people continue to university and apprenticeship attracts well-qualified applicants. France offers the chance to study for vocational A-levels and vocational degrees through apprenticeships and thereby attracts good candidates in spite of a high proportion entering university. In Ireland and Australia HE participation is high but at least half of all young apprenticeship entrants have completed upper secondary education. Information for England is not made available but quality is unlikely to be as high as in the other apprentice countries.
Demand for apprentices
In England eight per cent of employers offered apprenticeships in 2009, the lowest proportion of all the countries reported here. Nearly a third did so in Australia and in the dual-system countries around a quarter offered apprenticeships. Very large firms with over 500 employees make an important contribution to demand for apprentices. In Germany almost all such firms took on apprentices in 2005 compared to just 30 per cent in England. In all the apprentice countries demand is still not adequate to provide for all those seeking apprenticeship and government payments to employers are available in all apprentice countries – except for England – to encourage demand.
4 the State of Apprenticeship in 2010
Apprenticeship in England in Context: Overview
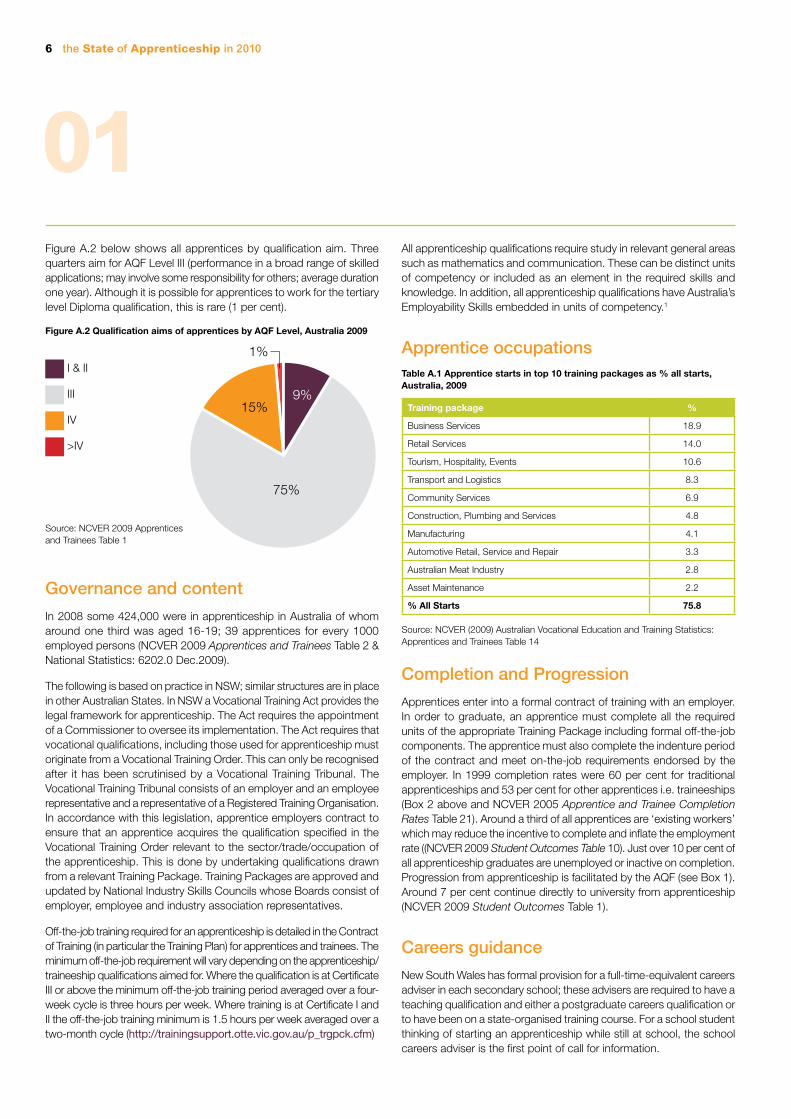
What about apprentice pay?Table O.2 Index (UK=100) of average weekly apprentice pay, 2006 or nearest year
Austria 55
France (1) 36
Germany 73
Switzerland (2) 36
England 100
(1) Minimum pay for 16-18 year olds
(2) 4 year apprenticeship
Source: Table 3 UKCES (2008) Catalyst No. 5 Time to Look Again at Apprentice Pay?
Average apprentice pay in England is well above the average in other apprentice countries. Employers in other apprentice countries try to recoup some of their training costs by paying an apprentice allowance/wage which is calculated as a fraction of the wage for a skilled employee. Combined with a longer apprenticeship period, this helps to offset the costs that employers incur when training.
Funding apprenticeship
In dual system countries where employers provide on-the-job training, funding regimes are straightforward. Funds for off-the-job training are paid directly to the vocational colleges and assessment costs are met by employers’ organisations, employee organisations and the government through the Chambers of Commerce. Employers’ paperwork is kept to a minimum. On average, employers in the dual system countries incur some net costs when training apprentices. However, apprentice wages below the skilled rate combined with an apprenticeship period of 3 or 4 years allow many firms to break even when providing apprenticeships. In Switzerland, where apprentice wages are rather low, most employers cover their training costs and sufficient apprentice places are available. Subsidies are rarely required. In Australia a range of payments are available to employers who take apprentices but the system lacks transparency and is difficult to assess. To encourage employers to train over and above their immediate skill needs, fixed payments are made in Austria, Germany and France to employers who take on additional apprentices or who take apprentices for the first time.
the State of Apprenticeship in 2010 5
13%
32%
29%
26%
Apprenticeship in 2010: Australia01
Numbers in apprenticeship in Australia have increased substantially over the past ten years. Traineeships have been introduced recently in addition to more traditional apprenticeships: all these are now known as ‘Australian Apprenticeships’. Just under half of all apprentices are aged 25 or over. Most aim for a Level III Certificate. Apprenticeship is underpinned by legislation which embodies employer and employee representation and comprises competency-based on-the-job and off-the-job training within a national qualifications framework. Careers education at school is well-supported. Apprentice employers benefit from good average mathematics attainment at school and show a good level of commitment to apprenticeship. Federal and State financial assistance is available to employers and apprentices but provision lacks transparency.
School system
Education in Australia is the responsibility of individual States. Schooling starts with a voluntary kindergarten or preparatory year followed by 12 years of primary and secondary school. The modal starting age for compulsory education is 5. The following information describes the system in the State of New South Wales (NSW), the State with the largest population (7,000,000). Publicly-financed primary schooling is from age 5 to age 11. This is followed by publicly-financed secondary education provided in neighbourhood comprehensive High Schools. All 17 year olds are required to be enrolled in either full or part-time education and/or training which includes apprenticeship.
Levels of post-compulsory educational participation in Australia have grown rapidly in the last three decades. Traditionally, schools were strongly oriented towards preparing young people for university study. Much effort has been made in recent years to develop better ways of meeting the needs of the majority of school leavers who do not proceed to university. In particular, steps have been taken to introduce into schools new vocational education and training (VET) pathways. These pathways, which include apprenticeships have contributed to a substantial increase in the proportions gaining a recognised qualification (Senior Secondary Certificate – SSC) at age 17/18. Just over two thirds (68 per cent) graduate from upper secondary education with a qualification which can give access to degree level study; just over a third (41 per cent) graduate from upper secondary education on a mainly vocational route, most commonly at levels similar to NVQ Levels 2 and 3. In NSW students in Years 11 and 12 can gain a recognised vocational qualification and the SSC while on a school-based apprenticeship.
Tertiary education, which is defined to include a wide range of sub-degree level qualifications, both academic and vocational, enrols at least 70 per cent of all 15-19 year olds and nearly 80 per cent of all 20-24 year olds (Australian Bureau of Statistics 6227 Education and Work 2009 Table 3). Because the definition of tertiary is so broad, many of these may be working full or part-time and included in the numbers given below for enrolment on courses leading to recognised qualifications, including apprenticeship.
Box 1 Vocational education and training (VET) in Australia normally leads to a qualification recognised within the Australian Qualifications Framework (AQF). The AQF is a national framework of qualifications in the school, vocational education and training and higher education sectors in Australia which supports the national recognition of qualifications. The AQF is not currently levels-based but provides a framework for national recognition of qualifications across all three VET-providing sectors.
Post-compulsory vocational routes
Unlike in many European countries, apprenticeship does not dominate vocational education and training provision in Australia. In 2008, just over one fifth (21 per cent) of those (1.6 million) engaged in vocational training leading to recognised qualification or part-qualification were apprentices (NCVER 2009 Students and Courses Table 3).
Apprenticeship accounts for a minority of 15-24 year olds in VET. Just under 10 per cent of all 15-19 year olds and 7 per cent of all 22-24 year olds are in apprenticeship.
Box 2 Australian apprenticeship includes both traditional apprenticeships in well-established trades and traineeships in other often more service-oriented occupations. Both involve a legal contract between employer and apprentice but differ in duration; traditional apprenticeships last for three or four years, traineeships (introduced in 1998) for one or two years. Apprenticeship is used here to refer to both traditional apprenticeships and traineeships in accordance with Australian Federal government practice.
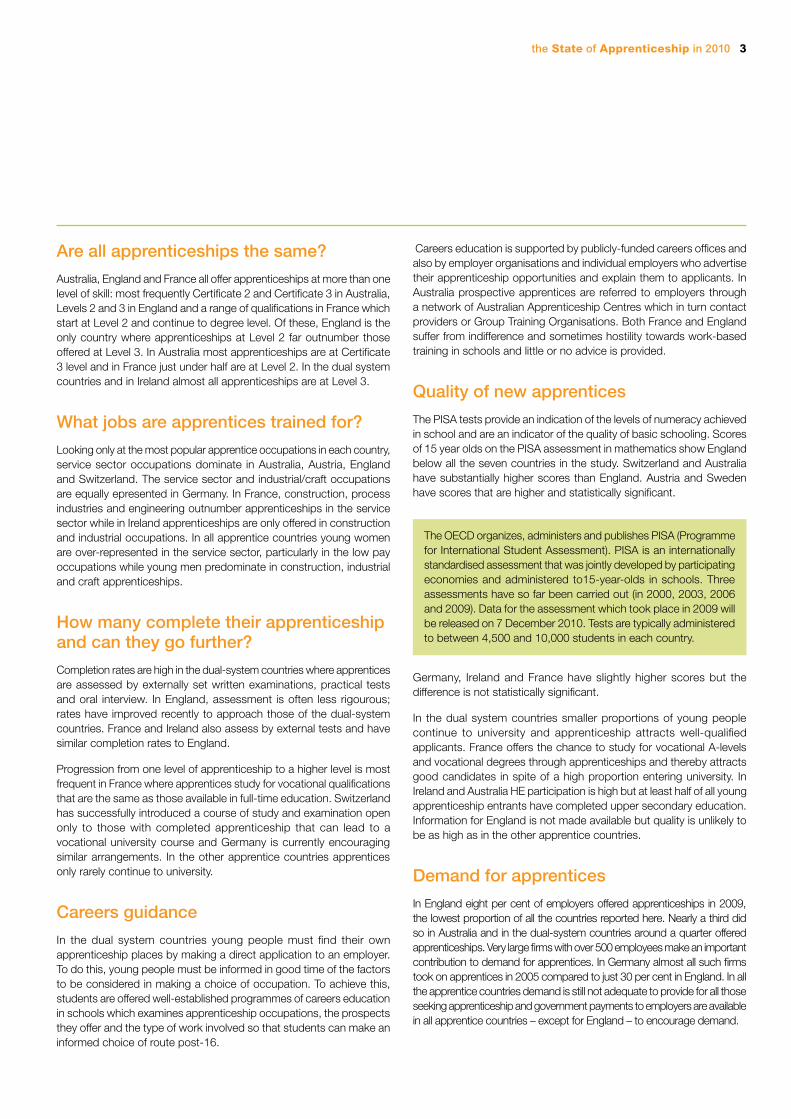
Figure A.1 below shows the distribution of apprentices by age. Just over half of all apprentices are under 25, just under a third are between 25 and 44
Figure A.1 All in apprenticeship training by age, Australia 2009
<20
20-24
25-44
>45
Source: NCVER 2009 Apprentices and Trainees Table 1
6 the State of Apprenticeship in 2010
01
>IV
IV
III
I & II>IV
IV
III
I & II
1%
75%
9%15%
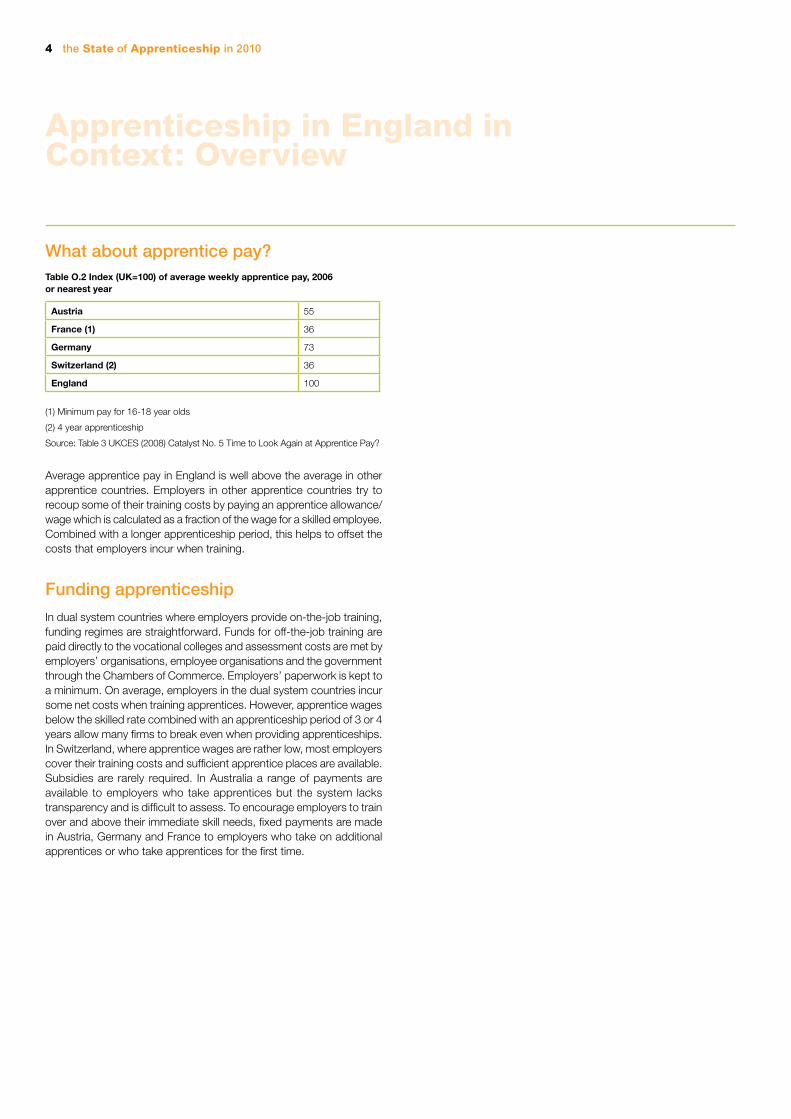
Figure A.2 below shows all apprentices by qualification aim. Three quarters aim for AQF Level III (performance in a broad range of skilled applications; may involve some responsibility for others; average duration one year). Although it is possible for apprentices to work for the tertiary level Diploma qualification, this is rare (1 per cent).
Figure A.2 Qualification aims of apprentices by AQF Level, Australia 2009
I & II
III
IV
>IV
Source: NCVER 2009 Apprentices and Trainees Table 1
Governance and content
In 2008 some 424,000 were in apprenticeship in Australia of whom around one third was aged 16-19; 39 apprentices for every 1000 employed persons (NCVER 2009 Apprentices and Trainees Table 2 & National Statistics: 6202.0 Dec.2009).
The following is based on practice in NSW; similar structures are in place in other Australian States. In NSW a Vocational Training Act provides the legal framework for apprenticeship. The Act requires the appointment of a Commissioner to oversee its implementation. The Act requires that vocational qualifications, including those used for apprenticeship must originate from a Vocational Training Order. This can only be recognised after it has been scrutinised by a Vocational Training Tribunal. The Vocational Training Tribunal consists of an employer and an employee representative and a representative of a Registered Training Organisation. In accordance with this legislation, apprentice employers contract to ensure that an apprentice acquires the qualification specified in the Vocational Training Order relevant to the sector/trade/occupation of the apprenticeship. This is done by undertaking qualifications drawn from a relevant Training Package. Training Packages are approved and updated by National Industry Skills Councils whose Boards consist of employer, employee and industry association representatives.
Off-the-job training required for an apprenticeship is detailed in the Contract of Training (in particular the Training Plan) for apprentices and trainees. The minimum off-the-job requirement will vary depending on the apprenticeship/traineeship qualifications aimed for. Where the qualification is at Certificate III or above the minimum off-the-job training period averaged over a four-week cycle is three hours per week. Where training is at Certificate I and II the off-the-job training minimum is 1.5 hours per week averaged over a two-month cycle (http://trainingsupport.otte.vic.gov.au/p_trgpck.cfm)
All apprenticeship qualifications require study in relevant general areas such as mathematics and communication. These can be distinct units of competency or included as an element in the required skills and knowledge. In addition, all apprenticeship qualifications have Australia’s Employability Skills embedded in units of competency.1
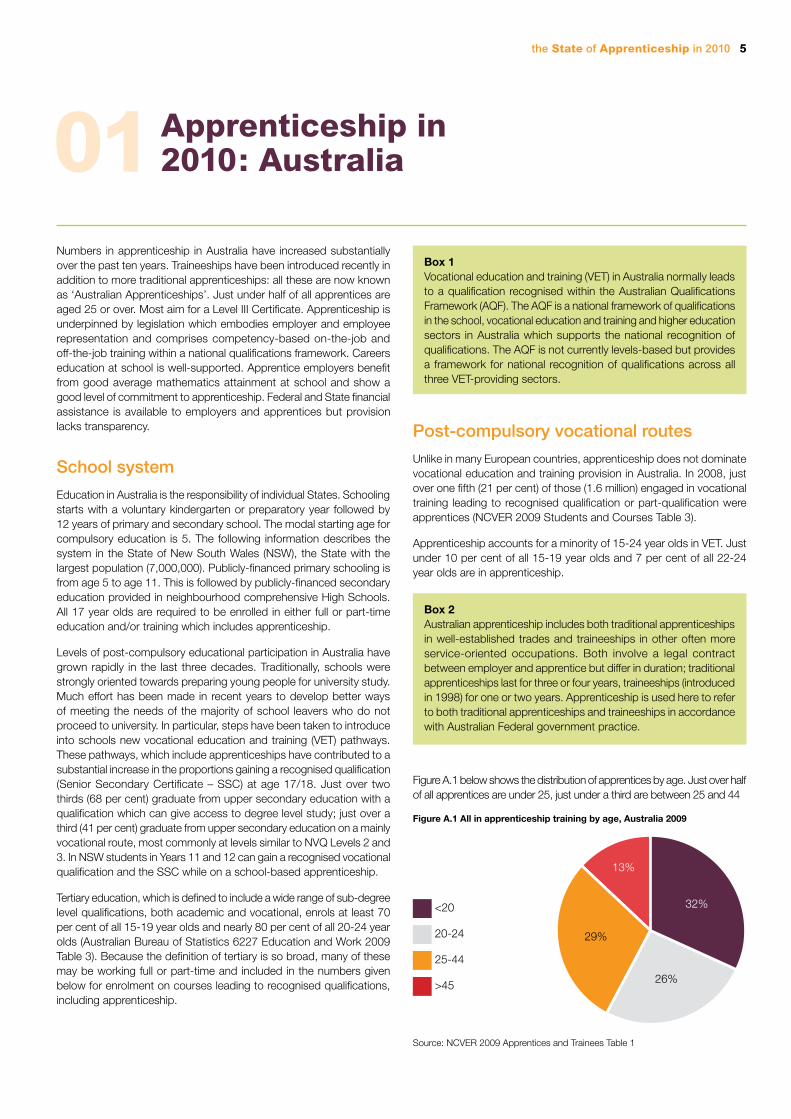
Apprentice occupationsTable A.1 Apprentice starts in top 10 training packages as % all starts, Australia, 2009
Training package %
Business Services 18.9
Retail Services 14.0
Tourism, Hospitality, Events 10.6
Transport and Logistics 8.3
Community Services 6.9
Construction, Plumbing and Services 4.8
Manufacturing 4.1
Automotive Retail, Service and Repair 3.3
Australian Meat Industry 2.8
Asset Maintenance 2.2
% All Starts 75.8
Source: NCVER (2009) Australian Vocational Education and Training Statistics: Apprentices and Trainees Table 14
Completion and Progression
Apprentices enter into a formal contract of training with an employer. In order to graduate, an apprentice must complete all the required units of the appropriate Training Package including formal off-the-job components. The apprentice must also complete the indenture period of the contract and meet on-the-job requirements endorsed by the employer. In 1999 completion rates were 60 per cent for traditional apprenticeships and 53 per cent for other apprentices i.e. traineeships (Box 2 above and NCVER 2005 Apprentice and Trainee Completion Rates Table 21). Around a third of all apprentices are ‘existing workers’ which may reduce the incentive to complete and inflate the employment rate ((NCVER 2009 Student Outcomes Table 10). Just over 10 per cent of all apprenticeship graduates are unemployed or inactive on completion. Progression from apprenticeship is facilitated by the AQF (see Box 1). Around 7 per cent continue directly to university from apprenticeship (NCVER 2009 Student Outcomes Table 1).
Careers guidance
New South Wales has formal provision for a full-time-equivalent careers adviser in each secondary school; these advisers are required to have a teaching qualification and either a postgraduate careers qualification or to have been on a state-organised training course. For a school student thinking of starting an apprenticeship while still at school, the school careers adviser is the first point of call for information.
01
the State of Apprenticeship in 2010 7
OECD average
Australia
United Kingdom
0
5
10
15
20
25
30
Level 6Level 5Level 4Level 3Level 2Level 1<Level 1
The Australian government also invests heavily in support and guidance services specifically geared to apprenticeship. Australian Apprenticeship Centres (AACs) are contracted by the Commonwealth government to provide one-stop shops for those seeking to hire apprentices or to take up an apprenticeship.
The Centres provide assistance to employers, apprentices and training providers throughout the duration of the apprenticeship. They assist with the signing of training contracts and also assess, approve and process the payment of government incentives to eligible employers, and personal benefits to eligible apprentices specifically to assist them in the early years of their apprenticeship when their wages are generally at their lowest. AACs also provide information to assist employers and/or apprentices with placements. AACs refer enquiries to appropriate organisations such as Job Placement Organisations and Group Training Organisations.
The Australian Government is currently expanding the role of existing AACs to establish a network of Skills and Training Information Centres (STICs). STICs will provide skills and training information and advice to employers, employees, job-seekers and other interested parties, and refer employers to Industry Skills Councils.
Quality of apprenticeship entrants
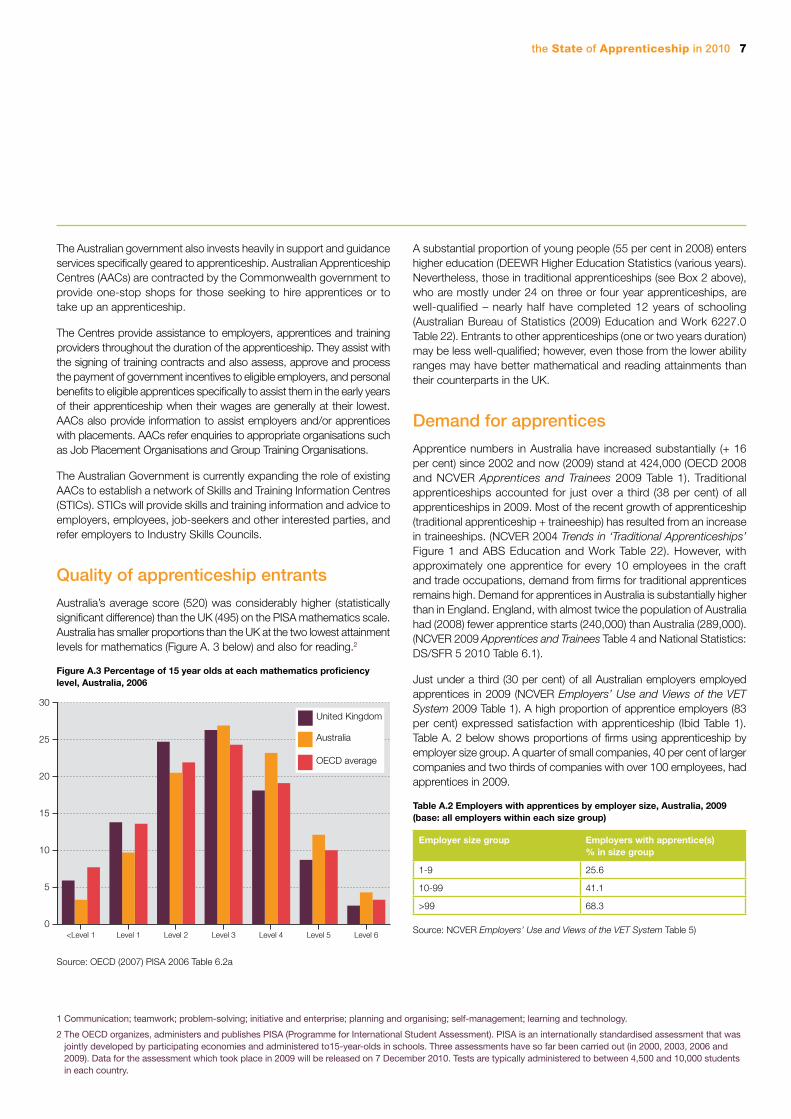
Australia’s average score (520) was considerably higher (statistically significant difference) than the UK (495) on the PISA mathematics scale. Australia has smaller proportions than the UK at the two lowest attainment levels for mathematics (Figure A. 3 below) and also for reading.2
Figure A.3 Percentage of 15 year olds at each mathematics proficiency level, Australia, 2006
Source: OECD (2007) PISA 2006 Table 6.2a
A substantial proportion of young people (55 per cent in 2008) enters higher education (DEEWR Higher Education Statistics (various years). Nevertheless, those in traditional apprenticeships (see Box 2 above), who are mostly under 24 on three or four year apprenticeships, are well-qualified – nearly half have completed 12 years of schooling (Australian Bureau of Statistics (2009) Education and Work 6227.0 Table 22). Entrants to other apprenticeships (one or two years duration) may be less well-qualified; however, even those from the lower ability ranges may have better mathematical and reading attainments than their counterparts in the UK.
Demand for apprentices
Apprentice numbers in Australia have increased substantially (+ 16 per cent) since 2002 and now (2009) stand at 424,000 (OECD 2008 and NCVER Apprentices and Trainees 2009 Table 1). Traditional apprenticeships accounted for just over a third (38 per cent) of all apprenticeships in 2009. Most of the recent growth of apprenticeship (traditional apprenticeship + traineeship) has resulted from an increase in traineeships. (NCVER 2004 Trends in ‘Traditional Apprenticeships’ Figure 1 and ABS Education and Work Table 22). However, with approximately one apprentice for every 10 employees in the craft and trade occupations, demand from firms for traditional apprentices remains high. Demand for apprentices in Australia is substantially higher than in England. England, with almost twice the population of Australia had (2008) fewer apprentice starts (240,000) than Australia (289,000). (NCVER 2009 Apprentices and Trainees Table 4 and National Statistics: DS/SFR 5 2010 Table 6.1).
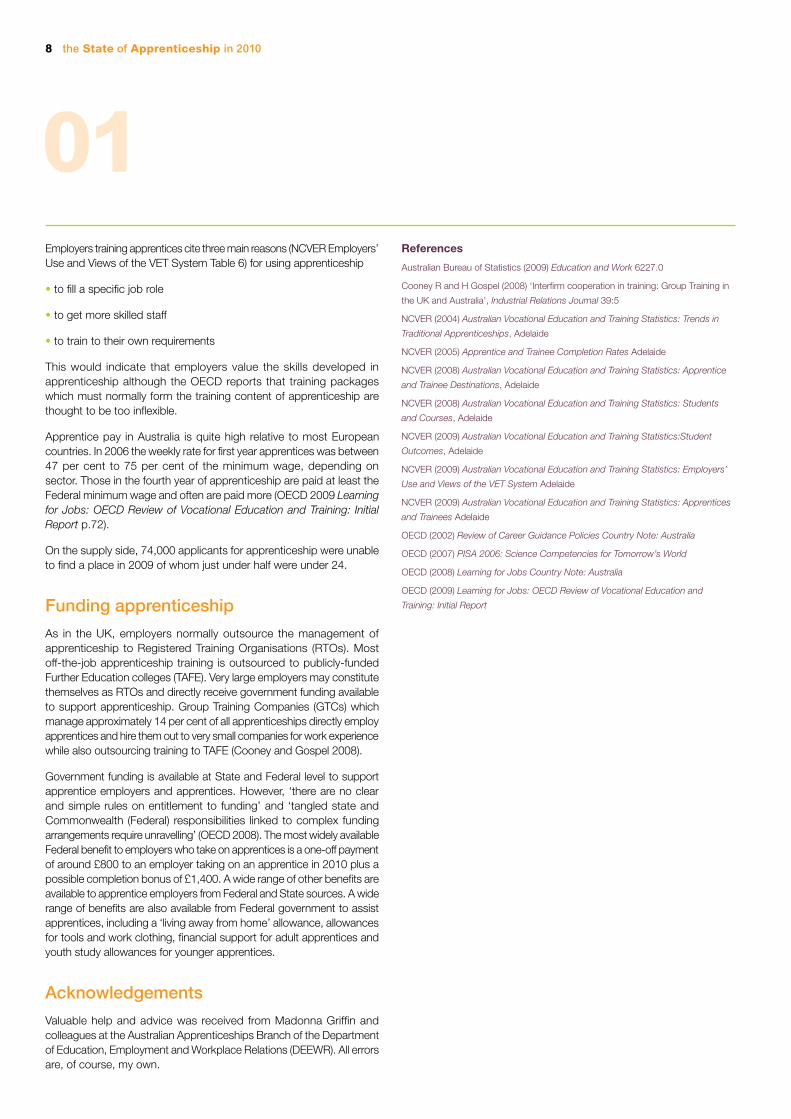
Just under a third (30 per cent) of all Australian employers employed apprentices in 2009 (NCVER Employers’ Use and Views of the VET System 2009 Table 1). A high proportion of apprentice employers (83 per cent) expressed satisfaction with apprenticeship (Ibid Table 1). Table A. 2 below shows proportions of firms using apprenticeship by employer size group. A quarter of small companies, 40 per cent of larger companies and two thirds of companies with over 100 employees, had apprentices in 2009.
Table A.2 Employers with apprentices by employer size, Australia, 2009 (base: all employers within each size group)
Employer size group Employers with apprentice(s) % in size group
1-9 25.6
10-99 41.1
>99 68.3
Source: NCVER Employers’ Use and Views of the VET System Table 5)
1 Communication; teamwork; problem-solving; initiative and enterprise; planning and organising; self-management; learning and technology.
2 The OECD organizes, administers and publishes PISA (Programme for International Student Assessment). PISA is an internationally standardised assessment that was jointly developed by participating economies and administered to15-year-olds in schools. Three assessments have so far been carried out (in 2000, 2003, 2006 and 2009). Data for the assessment which took place in 2009 will be released on 7 December 2010. Tests are typically administered to between 4,500 and 10,000 students in each country.
8 the State of Apprenticeship in 2010
Employers training apprentices cite three main reasons (NCVER Employers’ Use and Views of the VET System Table 6) for using apprenticeship
• to fill a specific job role
• to get more skilled staff
• to train to their own requirements
This would indicate that employers value the skills developed in apprenticeship although the OECD reports that training packages which must normally form the training content of apprenticeship are thought to be too inflexible.
Apprentice pay in Australia is quite high relative to most European countries. In 2006 the weekly rate for first year apprentices was between 47 per cent to 75 per cent of the minimum wage, depending on sector. Those in the fourth year of apprenticeship are paid at least the Federal minimum wage and often are paid more (OECD 2009 Learning for Jobs: OECD Review of Vocational Education and Training: Initial Report p.72).
On the supply side, 74,000 applicants for apprenticeship were unable to find a place in 2009 of whom just under half were under 24.
Funding apprenticeship
As in the UK, employers normally outsource the management of apprenticeship to Registered Training Organisations (RTOs). Most off-the-job apprenticeship training is outsourced to publicly-funded Further Education colleges (TAFE). Very large employers may constitute themselves as RTOs and directly receive government funding available to support apprenticeship. Group Training Companies (GTCs) which manage approximately 14 per cent of all apprenticeships directly employ apprentices and hire them out to very small companies for work experience while also outsourcing training to TAFE (Cooney and Gospel 2008).
Government funding is available at State and Federal level to support apprentice employers and apprentices. However, ‘there are no clear and simple rules on entitlement to funding’ and ‘tangled state and Commonwealth (Federal) responsibilities linked to complex funding arrangements require unravelling’ (OECD 2008). The most widely available Federal benefit to employers who take on apprentices is a one-off payment of around £800 to an employer taking on an apprentice in 2010 plus a possible completion bonus of £1,400. A wide range of other benefits are available to apprentice employers from Federal and State sources. A wide range of benefits are also available from Federal government to assist apprentices, including a ‘living away from home’ allowance, allowances for tools and work clothing, financial support for adult apprentices and youth study allowances for younger apprentices.
Acknowledgements
Valuable help and advice was received from Madonna Griffin and colleagues at the Australian Apprenticeships Branch of the Department of Education, Employment and Workplace Relations (DEEWR). All errors are, of course, my own.
References
Australian Bureau of Statistics (2009) Education and Work 6227.0
Cooney R and H Gospel (2008) ‘Interfirm cooperation in training: Group Training in
the UK and Australia’, Industrial Relations Journal 39:5
NCVER (2004) Australian Vocational Education and Training Statistics: Trends in
Traditional Apprenticeships, Adelaide
NCVER (2005) Apprentice and Trainee Completion Rates Adelaide
NCVER (2008) Australian Vocational Education and Training Statistics: Apprentice
and Trainee Destinations, Adelaide
NCVER (2008) Australian Vocational Education and Training Statistics: Students
and Courses, Adelaide
NCVER (2009) Australian Vocational Education and Training Statistics:Student
Outcomes, Adelaide
NCVER (2009) Australian Vocational Education and Training Statistics: Employers’
Use and Views of the VET System Adelaide
NCVER (2009) Australian Vocational Education and Training Statistics: Apprentices
and Trainees Adelaide
OECD (2002) Review of Career Guidance Policies Country Note: Australia
OECD (2007) PISA 2006: Science Competencies for Tomorrow’s World
OECD (2008) Learning for Jobs Country Note: Australia
OECD (2009) Learning for Jobs: OECD Review of Vocational Education and
Training: Initial Report
01
the State of Apprenticeship in 2010 9
Teacher training college
Teacher training school
Upper secondary vocational college
Full-time vocational school
Part-time vocational school (apprenticeship)
Upper secondary grammar school
1.7%
20.2%
40.3%11.8%
23.5%
2.7%Teacher training college
Teacher training school
Upper secondary vocational college
Full-time vocational school
Part-time vocational school (apprenticeship)
Upper secondary grammar school
1.7%
20.2%
40.3%11.8%
23.5%
2.7%
Apprenticeship in 2010: Austria02
Apprenticeship in Austria provides post-compulsory education and training for around forty per cent of all young people: almost all are aged under 19. Apprenticeship is underpinned by legislation and employer organisations play a leading role in piloting the system and promoting research and data collection. Most apprenticeships last for three years and comprise a programme of on-the-job and off-the-job training. Most apprenticeships are in artisan or service occupations, completion rates are high but there is little progression to higher education. Extensive careers advice is available both in and outside school. Recently government has provided payments to employers to raise demand for apprentices and to try to provide places for all who want them.
School system
Compulsory education in Austria starts at age 6 and lasts for 9 years. Pupils attend four years of primary education until age 10 when they are selected on past performance and teachers’ recommendation to attend either an academically demanding lower secondary school or a lower secondary school similar to the English secondary modern. At age 14 all pupils transfer to the upper secondary stage of education and a wide variety of routes open up. Just under 10 per cent of Austrian school students are in independent/private schools, most of which are government-financed. Students at state schools have higher scores on the PISA 2006 science tests than independent/private school pupils.
In this last year of compulsory education students may attend the one-year pre-vocational school which prepares for apprenticeship but also gives access to other types of post-compulsory VET. Other choices at 14 are continuation in the upper secondary ‘grammar’ school to age 19 or one of the vocational programmes described in more detail below.
Post-compulsory vocational routes
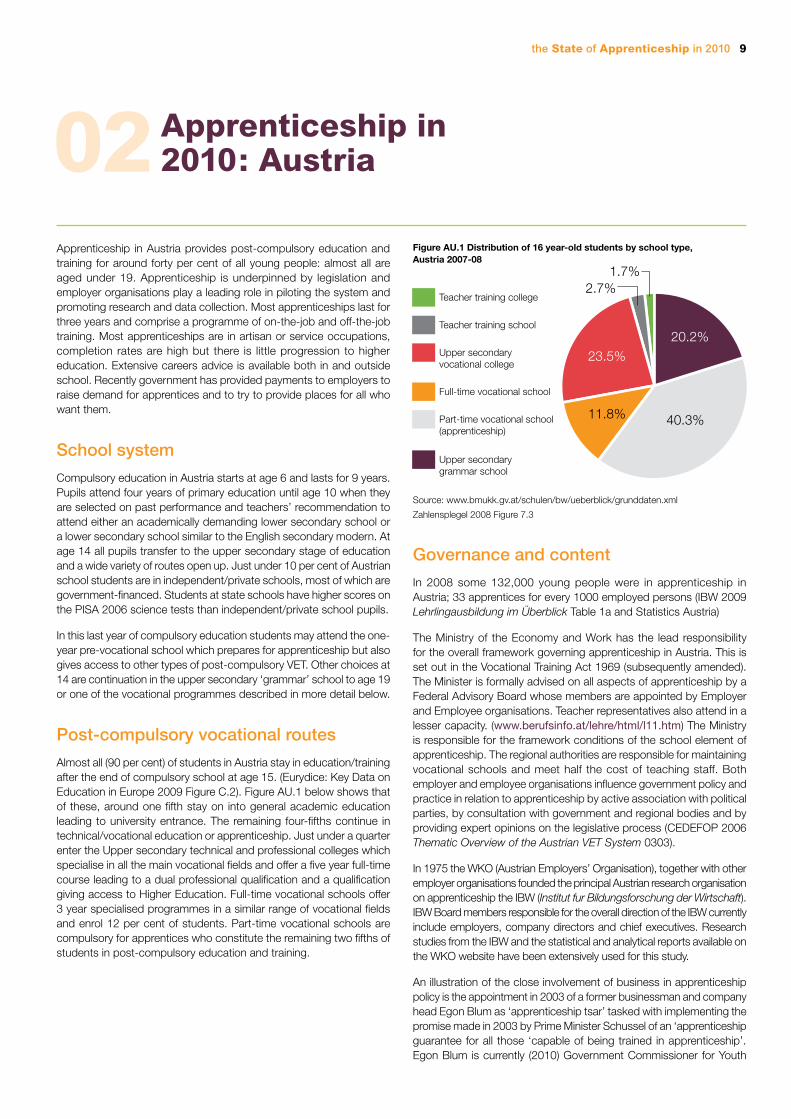
Almost all (90 per cent) of students in Austria stay in education/training after the end of compulsory school at age 15. (Eurydice: Key Data on Education in Europe 2009 Figure C.2). Figure AU.1 below shows that of these, around one fifth stay on into general academic education leading to university entrance. The remaining four-fifths continue in technical/vocational education or apprenticeship. Just under a quarter enter the Upper secondary technical and professional colleges which specialise in all the main vocational fields and offer a five year full-time course leading to a dual professional qualification and a qualification giving access to Higher Education. Full-time vocational schools offer 3 year specialised programmes in a similar range of vocational fields and enrol 12 per cent of students. Part-time vocational schools are compulsory for apprentices who constitute the remaining two fifths of students in post-compulsory education and training.
Figure AU.1 Distribution of 16 year-old students by school type, Austria 2007-08
Source: www.bmukk.gv.at/schulen/bw/ueberblick/grunddaten.xml
Zahlensplegel 2008 Figure 7.3
Governance and content
In 2008 some 132,000 young people were in apprenticeship in Austria; 33 apprentices for every 1000 employed persons (IBW 2009 Lehrlingausbildung im Überblick Table 1a and Statistics Austria)
The Ministry of the Economy and Work has the lead responsibility for the overall framework governing apprenticeship in Austria. This is set out in the Vocational Training Act 1969 (subsequently amended). The Minister is formally advised on all aspects of apprenticeship by a Federal Advisory Board whose members are appointed by Employer and Employee organisations. Teacher representatives also attend in a lesser capacity. (www.berufsinfo.at/lehre/html/l11.htm) The Ministry is responsible for the framework conditions of the school element of apprenticeship. The regional authorities are responsible for maintaining vocational schools and meet half the cost of teaching staff. Both employer and employee organisations influence government policy and practice in relation to apprenticeship by active association with political parties, by consultation with government and regional bodies and by providing expert opinions on the legislative process (CEDEFOP 2006 Thematic Overview of the Austrian VET System 0303).
In 1975 the WKO (Austrian Employers’ Organisation), together with other employer organisations founded the principal Austrian research organisation on apprenticeship the IBW (Institut fur Bildungsforschung der Wirtschaft). IBW Board members responsible for the overall direction of the IBW currently include employers, company directors and chief executives. Research studies from the IBW and the statistical and analytical reports available on the WKO website have been extensively used for this study.
An illustration of the close involvement of business in apprenticeship policy is the appointment in 2003 of a former businessman and company head Egon Blum as ‘apprenticeship tsar’ tasked with implementing the promise made in 2003 by Prime Minister Schussel of an ‘apprenticeship guarantee for all those ‘capable of being trained in apprenticeship’. Egon Blum is currently (2010) Government Commissioner for Youth
10 the State of Apprenticeship in 2010
3 The OECD organizes, administers and publishes PISA (Programme for International Student Assessment). PISA is an internationally standardised assessment that was jointly developed by participating economies and administered to15-year-olds in schools. Three assessments have so far been carried out (in 2000, 2003, 2006 and 2009). Data for the assessment which took place in 2009 will be released on 7 December 2010. Tests are typically administered to between 4,500 and 10,000 students in each country.
02Employment and Apprenticeship at the Ministry of Economy and Work www.egon-blum.at/
His achievements since 2003 are reported below under Demand and Funding.
Depending on the apprenticeship occupation, the duration of apprenticeship training is between two and four years; the majority last three years. There is scope to reduce this period where appropriate. Apprentices enter into a contract with the apprentice firms but are legally still students, not employees. This is because apprentice status requires attendance at the part-time vocational school, normally for a minimum of one day a week. The school-based training is three quarters job-oriented and one quarter general subjects (German, a foreign language, business studies) (CEDEFOP 2006 Thematic Overview of the Austrian VET System 0404).
Because Austrian apprenticeship follows the dual-system model found also in Switzerland and Germany, the firm also provides work-place training following the outline of the Training Regulations for the appropriate occupation. Apprenticeship firms must show that they have the equipment and facilities to provide this training and have a qualified person to supervise the apprentice. If firms lack some equipment/facilities, these can be supplied at a Group Training Centre financed from private and public funds. www.bmwfj.gv.at/Berufsausbildung/LehrlingsUndBerufsausbildung/ Seiten/ErstmaligesAusbildenvonLehrlingen.aspx
Apprentice occupations
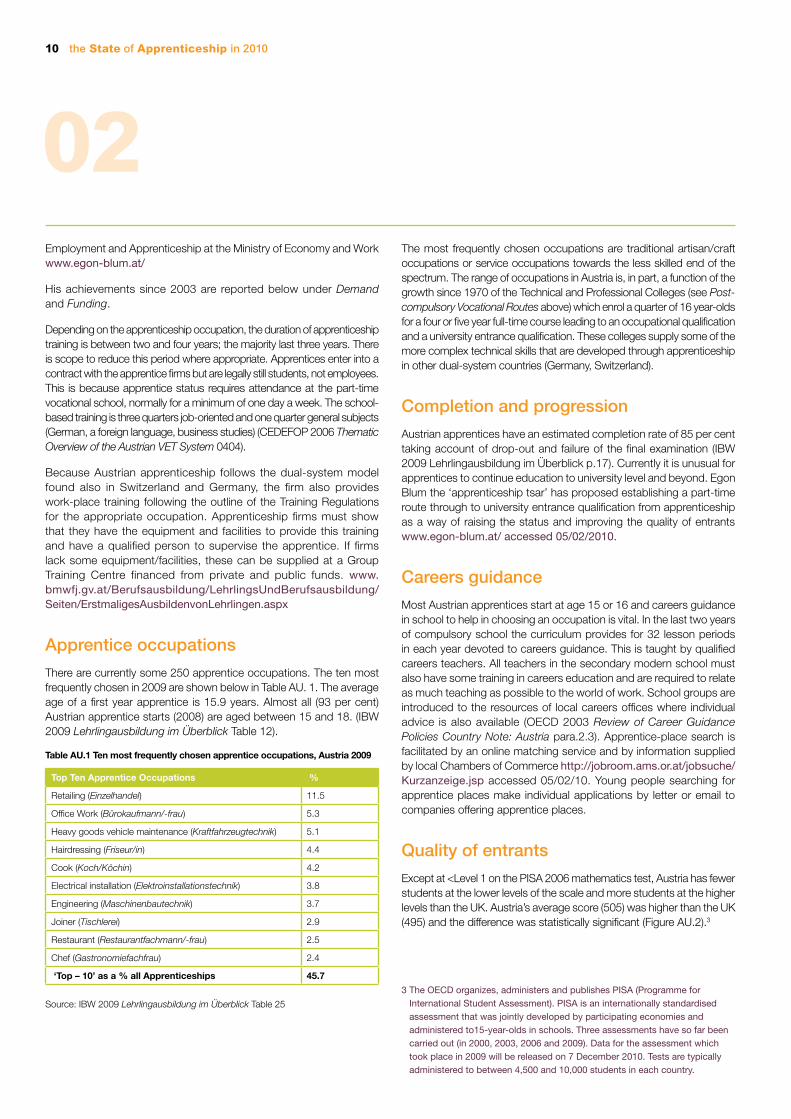
There are currently some 250 apprentice occupations. The ten most frequently chosen in 2009 are shown below in Table AU. 1. The average age of a first year apprentice is 15.9 years. Almost all (93 per cent) Austrian apprentice starts (2008) are aged between 15 and 18. (IBW 2009 Lehrlingausbildung im Überblick Table 12).
Table AU.1 Ten most frequently chosen apprentice occupations, Austria 2009
Top Ten Apprentice Occupations %
Retailing (Einzelhandel) 11.5
Office Work (Bürokaufmann/-frau) 5.3
Heavy goods vehicle maintenance (Kraftfahrzeugtechnik) 5.1
Hairdressing (Friseur/in) 4.4
Cook (Koch/Köchin) 4.2
Electrical installation (Elektroinstallationstechnik) 3.8
Engineering (Maschinenbautechnik) 3.7
Joiner (Tischlerei) 2.9
Restaurant (Restaurantfachmann/-frau) 2.5
Chef (Gastronomiefachfrau) 2.4
‘Top – 10’ as a % all Apprenticeships 45.7
Source: IBW 2009 Lehrlingausbildung im Überblick Table 25
The most frequently chosen occupations are traditional artisan/craft occupations or service occupations towards the less skilled end of the spectrum. The range of occupations in Austria is, in part, a function of the growth since 1970 of the Technical and Professional Colleges (see Post-compulsory Vocational Routes above) which enrol a quarter of 16 year-olds for a four or five year full-time course leading to an occupational qualification and a university entrance qualification. These colleges supply some of the more complex technical skills that are developed through apprenticeship in other dual-system countries (Germany, Switzerland).
Completion and progression
Austrian apprentices have an estimated completion rate of 85 per cent taking account of drop-out and failure of the final examination (IBW 2009 Lehrlingausbildung im Überblick p.17). Currently it is unusual for apprentices to continue education to university level and beyond. Egon Blum the ‘apprenticeship tsar’ has proposed establishing a part-time route through to university entrance qualification from apprenticeship as a way of raising the status and improving the quality of entrants www.egon-blum.at/ accessed 05/02/2010.
Careers guidance
Most Austrian apprentices start at age 15 or 16 and careers guidance in school to help in choosing an occupation is vital. In the last two years of compulsory school the curriculum provides for 32 lesson periods in each year devoted to careers guidance. This is taught by qualified careers teachers. All teachers in the secondary modern school must also have some training in careers education and are required to relate as much teaching as possible to the world of work. School groups are introduced to the resources of local careers offices where individual advice is also available (OECD 2003 Review of Career Guidance Policies Country Note: Austria para.2.3). Apprentice-place search is facilitated by an online matching service and by information supplied by local Chambers of Commerce http://jobroom.ams.or.at/jobsuche/Kurzanzeige.jsp accessed 05/02/10. Young people searching for apprentice places make individual applications by letter or email to companies offering apprentice places.
Quality of entrants
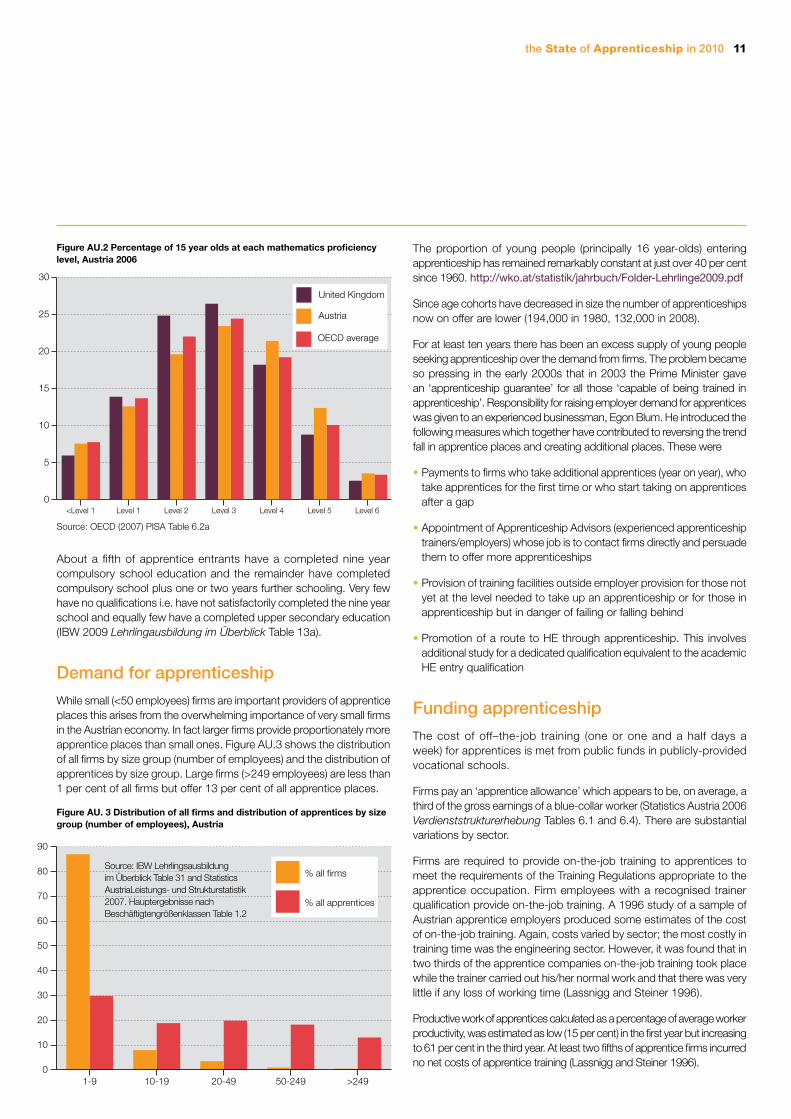
Except at <Level 1 on the PISA 2006 mathematics test, Austria has fewer students at the lower levels of the scale and more students at the higher levels than the UK. Austria’s average score (505) was higher than the UK (495) and the difference was statistically significant (Figure AU.2).3
the State of Apprenticeship in 2010 11
0
5
10
15
20
25
30
Level 6Level 5Level 4Level 3Level 2Level 1<Level 1
OECD average
Austria
United Kingdom
% all apprentices
% all firms
0
10
20
30
40
50
60
70
80
90
>24950-24920-4910-191-9
Source: IBW Lehrlingsausbildung im Überblick Table 31 and Statistics AustriaLeistungs- und Strukturstatistik 2007. Hauptergebnisse nach Beschäftigtengrößenklassen Table 1.2
Figure AU.2 Percentage of 15 year olds at each mathematics proficiency level, Austria 2006
Source: OECD (2007) PISA Table 6.2a
About a fifth of apprentice entrants have a completed nine year compulsory school education and the remainder have completed compulsory school plus one or two years further schooling. Very few have no qualifications i.e. have not satisfactorily completed the nine year school and equally few have a completed upper secondary education (IBW 2009 Lehrlingausbildung im Überblick Table 13a).
Demand for apprenticeship
While small (<50 employees) firms are important providers of apprentice places this arises from the overwhelming importance of very small firms in the Austrian economy. In fact larger firms provide proportionately more apprentice places than small ones. Figure AU.3 shows the distribution of all firms by size group (number of employees) and the distribution of apprentices by size group. Large firms (>249 employees) are less than 1 per cent of all firms but offer 13 per cent of all apprentice places.
Figure AU. 3 Distribution of all firms and distribution of apprentices by size group (number of employees), Austria
The proportion of young people (principally 16 year-olds) entering apprenticeship has remained remarkably constant at just over 40 per cent since 1960. http://wko.at/statistik/jahrbuch/Folder-Lehrlinge2009.pdf
Since age cohorts have decreased in size the number of apprenticeships now on offer are lower (194,000 in 1980, 132,000 in 2008).
For at least ten years there has been an excess supply of young people seeking apprenticeship over the demand from firms. The problem became so pressing in the early 2000s that in 2003 the Prime Minister gave an ‘apprenticeship guarantee’ for all those ‘capable of being trained in apprenticeship’. Responsibility for raising employer demand for apprentices was given to an experienced businessman, Egon Blum. He introduced the following measures which together have contributed to reversing the trend fall in apprentice places and creating additional places. These were
• Payments to firms who take additional apprentices (year on year), who take apprentices for the first time or who start taking on apprentices after a gap
• Appointment of Apprenticeship Advisors (experienced apprenticeship trainers/employers) whose job is to contact firms directly and persuade them to offer more apprenticeships
• Provision of training facilities outside employer provision for those not yet at the level needed to take up an apprenticeship or for those in apprenticeship but in danger of failing or falling behind
• Promotion of a route to HE through apprenticeship. This involves additional study for a dedicated qualification equivalent to the academic HE entry qualification
Funding apprenticeship
The cost of off–the-job training (one or one and a half days a week) for apprentices is met from public funds in publicly-provided vocational schools.
Firms pay an ‘apprentice allowance’ which appears to be, on average, a third of the gross earnings of a blue-collar worker (Statistics Austria 2006 Verdienststrukturerhebung Tables 6.1 and 6.4). There are substantial variations by sector.
Firms are required to provide on-the-job training to apprentices to meet the requirements of the Training Regulations appropriate to the apprentice occupation. Firm employees with a recognised trainer qualification provide on-the-job training. A 1996 study of a sample of Austrian apprentice employers produced some estimates of the cost of on-the-job training. Again, costs varied by sector; the most costly in training time was the engineering sector. However, it was found that in two thirds of the apprentice companies on-the-job training took place while the trainer carried out his/her normal work and that there was very little if any loss of working time (Lassnigg and Steiner 1996).
Productive work of apprentices calculated as a percentage of average worker productivity, was estimated as low (15 per cent) in the first year but increasing to 61 per cent in the third year. At least two fifths of apprentice firms incurred no net costs of apprentice training (Lassnigg and Steiner 1996).
12 the State of Apprenticeship in 2010
02Since the 1996 study was carried out the government has found it necessary to subsidise additional apprentice places and take other measures to ensure that demand from firms more nearly equates the supply of young people (see Demand above). The ‘apprenticeship tsar’, Egon Blum, points to the effect on the composition of apprenticeship applicants of the development of full-time vocational education. This has indirectly raised the costs of apprenticeship training because applicants in 2006 have a lower learning capacity than those of 10 or 20 years earlier. To increase the number of places on offer, payments are now made for each additional apprentice place over the previous year or to firms which return to apprentice training after a break. The payments are as follows
• £350 per month for first year of apprenticeship
• £175 per month for second year
• £87 per month for third year
These payments make a substantial contribution to offsetting employers’ costs of apprenticeship by covering between half and two thirds of the first year apprentice allowance – less in subsequent years. These measures were followed by an increase in places offered and a drop in the number of failed applications. However, failed applications for apprentice places started to rise again in 2008 and 2009 as a result of the economic downturn.
References
CEDEFOP (2006) Thematic Overview of the Austrian VET System
EURYDICE: Key Data on Education in Europe 2009
IBW – Institut für Bildung der Wirtschaft (2009) Lehrlingausbildung im
Überblick, Vienna
Lassnigg L and P Steiner (1996) Die betrieblichen Kosten der Lehrlingausbildung:
Hauptergebnisse Institut für Höhere Studien
OECD (2003) Review of Career Guidance Policies Country Note: Austria
OECD (2007) PISA 2006: Science Competencies for Tomorrow’s World
Statistics Austria (2006) Verdienststrukturerhebung
the State of Apprenticeship in 2010 13
NEET
Employment (b)
Work-based learning
Education (a)
NEET
Employment (b)
Work-based learning
Education (a)
5.2%
85.7%
3.8%5.5%
NEET
Employment (b)
Work-based learning
Education (a)
NEET
Employment (b)
Work-based learning
Education (a)
5.2%
85.7%
3.8%5.5%
NEET
Employment (b)
Work- based learning
Education (a)
NEET
Employment (b)
Work-based learning
Education (a)
26.2%50.6%
6.7%
16.6%NEET
Employment (b)
Work- based learning
Education (a)
NEET
Employment (b)
Work-based learning
Education (a)
26.2%50.6%
6.7%
16.6%
Apprenticeship in 2010: England03
Apprenticeship was relaunched in England in 1994 and numbers increased to 200,000 by 2000 and just under 300,000 by 2009. Employers are well-represented on national and sector skill organisations but employer numbers offering apprenticeships are low by international standards (8 per cent). The supply of applicants substantially exceeds employer demand. Apprenticeship requires completion of competency-based qualifications, underpinning knowledge and key skills, employment experience and off-the-job training. Completion rates have improved and are now comparable to some other countries. Progression to higher qualification levels is poor. The administration of government funding for apprenticeship training lacks transparency and deters or at best marginalises many employers. Financial incentives available in most other countries to employers taking apprentices are not normally available in England.
School system
In England, responsibility for the education service lies with the Department for Education (DFE); responsibilities include planning and monitoring the education service in schools in England, and ensuring the provision of integrated services for children. At local level, the responsibility for organising publicly-funded school education lies with 172 local authorities (LAs) in England and Wales. Compulsory education in England starts at age 5 and lasts for 11 years. Pupils attend six years of primary education until age 11 when they transfer to comprehensive secondary schools. Five per cent of pupils transfer after testing to selective grammar schools dependent on local authority education policy http://news.bbc.co.uk/1/hi/education/3571387.stm accessed 15/03/2010. (EURYDICE National summary sheets on education systems in Europe and ongoing reforms United Kingdom (England Wales and NI 2008 p.2)
Seven per cent of pupils in England are educated in independent/private schools. Students at independent fee-paying schools have higher scores on the PISA 2006 science tests than state-maintained school pupils after controlling for social class.
Post-compulsory vocational routes
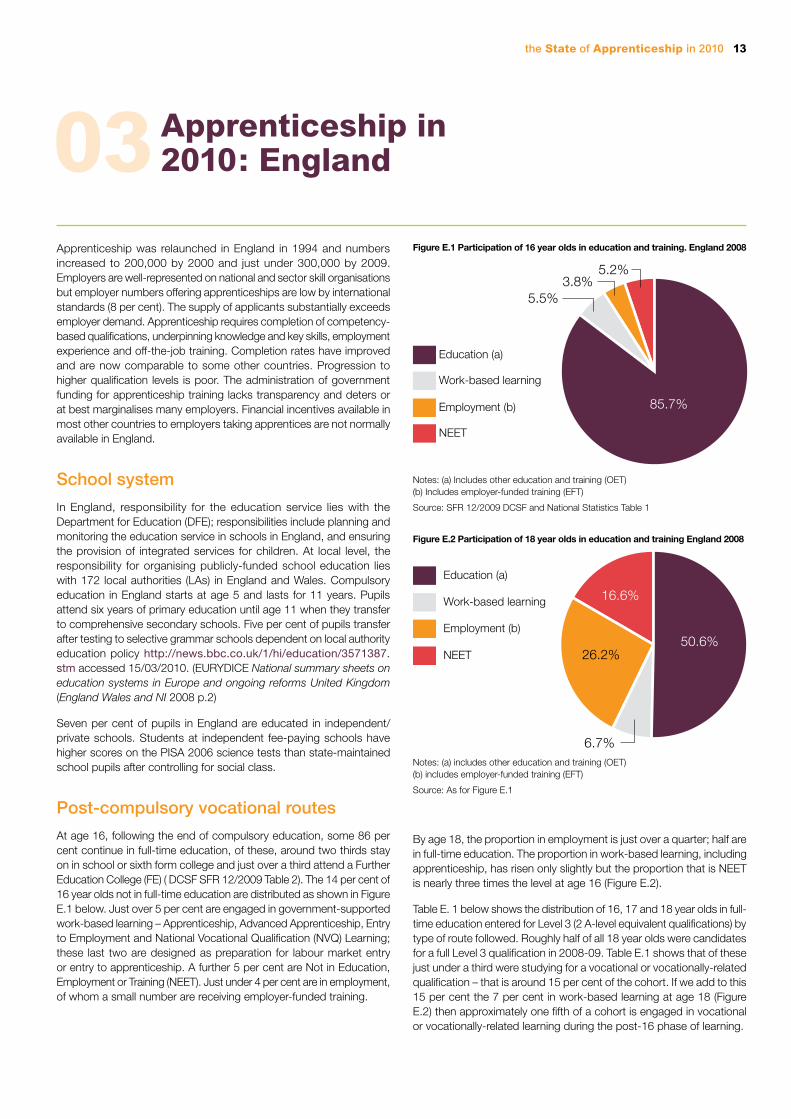
At age 16, following the end of compulsory education, some 86 per cent continue in full-time education, of these, around two thirds stay on in school or sixth form college and just over a third attend a Further Education College (FE) ( DCSF SFR 12/2009 Table 2). The 14 per cent of 16 year olds not in full-time education are distributed as shown in Figure E.1 below. Just over 5 per cent are engaged in government-supported work-based learning – Apprenticeship, Advanced Apprenticeship, Entry to Employment and National Vocational Qualification (NVQ) Learning; these last two are designed as preparation for labour market entry or entry to apprenticeship. A further 5 per cent are Not in Education, Employment or Training (NEET). Just under 4 per cent are in employment, of whom a small number are receiving employer-funded training.
Notes: (a) Includes other education and training (OET) (b) Includes employer-funded training (EFT)
Source: SFR 12/2009 DCSF and National Statistics Table 1
Figure E.2 Participation of 18 year olds in education and training England 2008
Notes: (a) includes other education and training (OET) (b) includes employer-funded training (EFT)
Source: As for Figure E.1
By age 18, the proportion in employment is just over a quarter; half are in full-time education. The proportion in work-based learning, including apprenticeship, has risen only slightly but the proportion that is NEET is nearly three times the level at age 16 (Figure E.2).
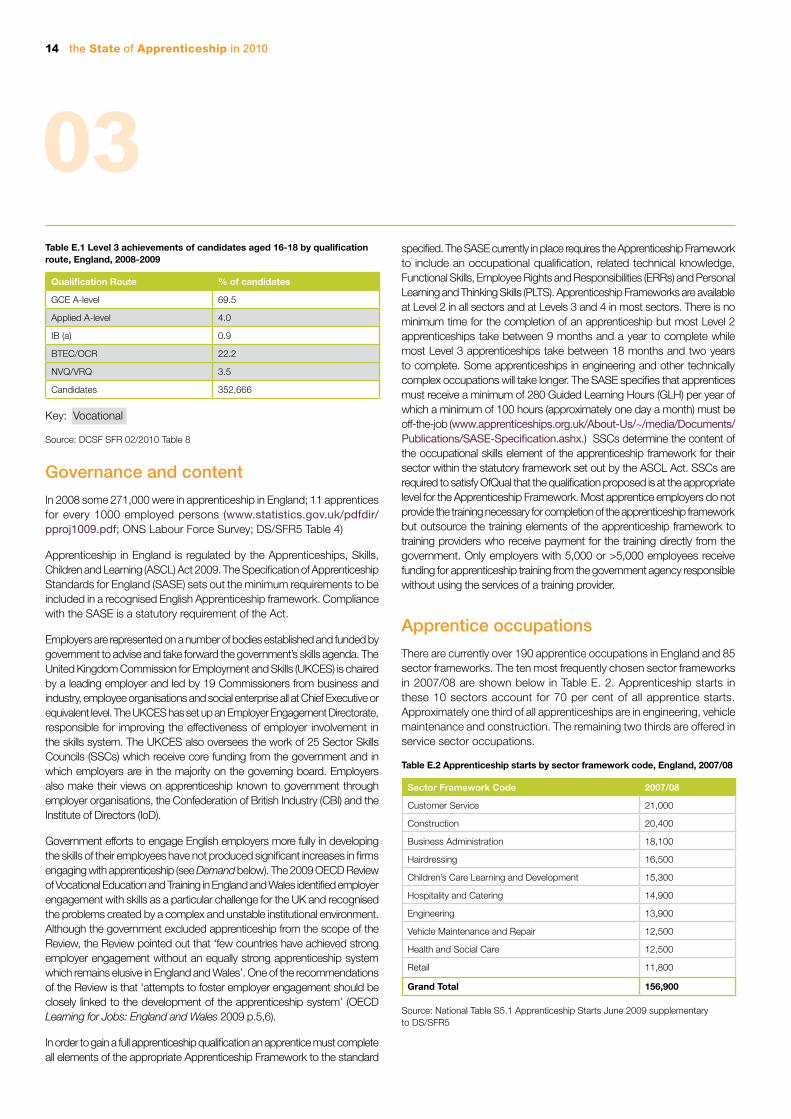
Table E. 1 below shows the distribution of 16, 17 and 18 year olds in full-time education entered for Level 3 (2 A-level equivalent qualifications) by type of route followed. Roughly half of all 18 year olds were candidates for a full Level 3 qualification in 2008-09. Table E.1 shows that of these just under a third were studying for a vocational or vocationally-related qualification – that is around 15 per cent of the cohort. If we add to this 15 per cent the 7 per cent in work-based learning at age 18 (Figure E.2) then approximately one fifth of a cohort is engaged in vocational or vocationally-related learning during the post-16 phase of learning.
Figure E.1 Participation of 16 year olds in education and training. England 2008
14 the State of Apprenticeship in 2010
03Table E.1 Level 3 achievements of candidates aged 16-18 by qualification route, England, 2008-2009
Qualification Route % of candidates
GCE A-level 69.5
Applied A-level 4.0
IB (a) 0.9
BTEC/OCR 22.2
NVQ/VRQ 3.5
Candidates 352,666
Key: Vocational
Source: DCSF SFR 02/2010 Table 8
Governance and content
In 2008 some 271,000 were in apprenticeship in England; 11 apprentices for every 1000 employed persons (www.statistics.gov.uk/pdfdir/pproj1009.pdf; ONS Labour Force Survey; DS/SFR5 Table 4)
Apprenticeship in England is regulated by the Apprenticeships, Skills, Children and Learning (ASCL) Act 2009. The Specification of Apprenticeship Standards for England (SASE) sets out the minimum requirements to be included in a recognised English Apprenticeship framework. Compliance with the SASE is a statutory requirement of the Act.
Employers are represented on a number of bodies established and funded by government to advise and take forward the government’s skills agenda. The United Kingdom Commission for Employment and Skills (UKCES) is chaired by a leading employer and led by 19 Commissioners from business and industry, employee organisations and social enterprise all at Chief Executive or equivalent level. The UKCES has set up an Employer Engagement Directorate, responsible for improving the effectiveness of employer involvement in the skills system. The UKCES also oversees the work of 25 Sector Skills Councils (SSCs) which receive core funding from the government and in which employers are in the majority on the governing board. Employers also make their views on apprenticeship known to government through employer organisations, the Confederation of British Industry (CBI) and the Institute of Directors (IoD).
Government efforts to engage English employers more fully in developing the skills of their employees have not produced significant increases in firms engaging with apprenticeship (see Demand below). The 2009 OECD Review of Vocational Education and Training in England and Wales identified employer engagement with skills as a particular challenge for the UK and recognised the problems created by a complex and unstable institutional environment. Although the government excluded apprenticeship from the scope of the Review, the Review pointed out that ‘few countries have achieved strong employer engagement without an equally strong apprenticeship system which remains elusive in England and Wales’. One of the recommendations of the Review is that ‘attempts to foster employer engagement should be closely linked to the development of the apprenticeship system’ (OECD Learning for Jobs: England and Wales 2009 p.5,6).
In order to gain a full apprenticeship qualification an apprentice must complete all elements of the appropriate Apprenticeship Framework to the standard
specified. The SASE currently in place requires the Apprenticeship Framework to include an occupational qualification, related technical knowledge, Functional Skills, Employee Rights and Responsibilities (ERRs) and Personal Learning and Thinking Skills (PLTS). Apprenticeship Frameworks are available at Level 2 in all sectors and at Levels 3 and 4 in most sectors. There is no minimum time for the completion of an apprenticeship but most Level 2 apprenticeships take between 9 months and a year to complete while most Level 3 apprenticeships take between 18 months and two years to complete. Some apprenticeships in engineering and other technically complex occupations will take longer. The SASE specifies that apprentices must receive a minimum of 280 Guided Learning Hours (GLH) per year of which a minimum of 100 hours (approximately one day a month) must be off-the-job (www.apprenticeships.org.uk/About-Us/~/media/Documents/Publications/SASE-Specification.ashx.) SSCs determine the content of the occupational skills element of the apprenticeship framework for their sector within the statutory framework set out by the ASCL Act. SSCs are required to satisfy OfQual that the qualification proposed is at the appropriate level for the Apprenticeship Framework. Most apprentice employers do not provide the training necessary for completion of the apprenticeship framework but outsource the training elements of the apprenticeship framework to training providers who receive payment for the training directly from the government. Only employers with 5,000 or >5,000 employees receive funding for apprenticeship training from the government agency responsible without using the services of a training provider.
Apprentice occupations
There are currently over 190 apprentice occupations in England and 85 sector frameworks. The ten most frequently chosen sector frameworks in 2007/08 are shown below in Table E. 2. Apprenticeship starts in these 10 sectors account for 70 per cent of all apprentice starts. Approximately one third of all apprenticeships are in engineering, vehicle maintenance and construction. The remaining two thirds are offered in service sector occupations.
Table E.2 Apprenticeship starts by sector framework code, England, 2007/08
Sector Framework Code 2007/08
Customer Service 21,000
Construction 20,400
Business Administration 18,100
Hairdressing 16,500
Children’s Care Learning and Development 15,300
Hospitality and Catering 14,900
Engineering 13,900
Vehicle Maintenance and Repair 12,500
Health and Social Care 12,500
Retail 11,800
Grand Total 156,900
Source: National Table S5.1 Apprenticeship Starts June 2009 supplementary to DS/SFR5
the State of Apprenticeship in 2010 15
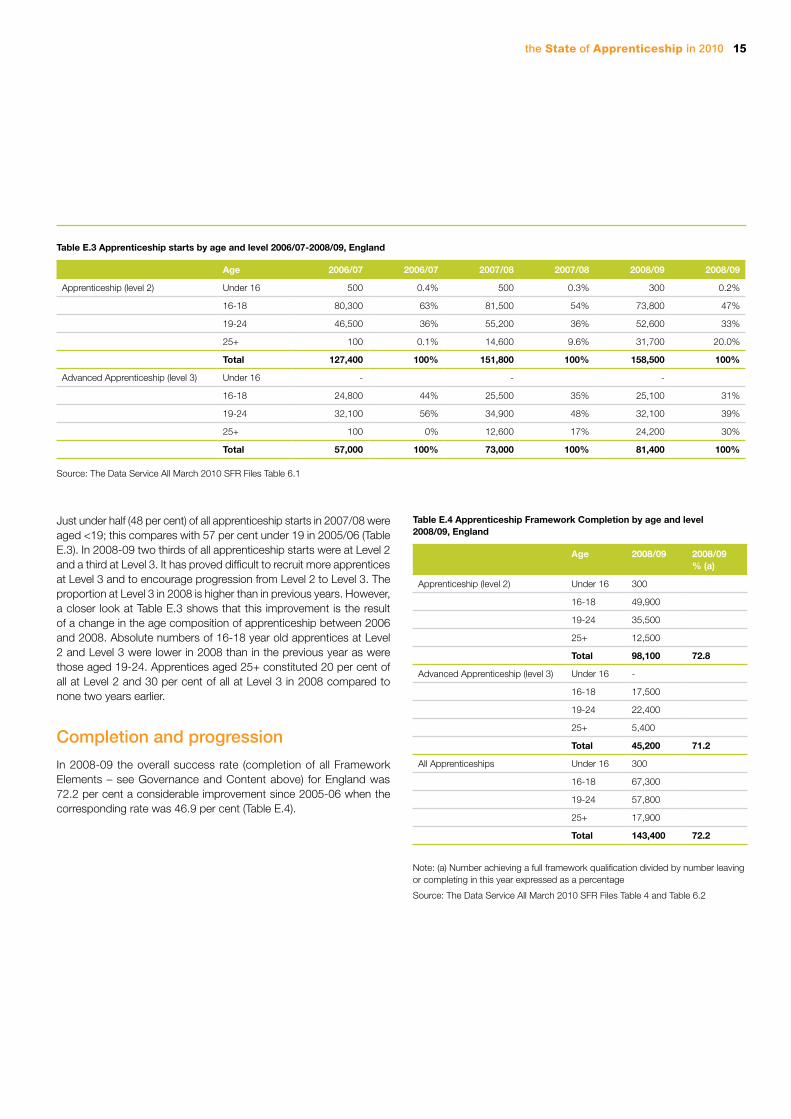
Just under half (48 per cent) of all apprenticeship starts in 2007/08 were aged <19; this compares with 57 per cent under 19 in 2005/06 (Table E.3). In 2008-09 two thirds of all apprenticeship starts were at Level 2 and a third at Level 3. It has proved difficult to recruit more apprentices at Level 3 and to encourage progression from Level 2 to Level 3. The proportion at Level 3 in 2008 is higher than in previous years. However, a closer look at Table E.3 shows that this improvement is the result of a change in the age composition of apprenticeship between 2006 and 2008. Absolute numbers of 16-18 year old apprentices at Level 2 and Level 3 were lower in 2008 than in the previous year as were those aged 19-24. Apprentices aged 25+ constituted 20 per cent of all at Level 2 and 30 per cent of all at Level 3 in 2008 compared to none two years earlier.
Completion and progression
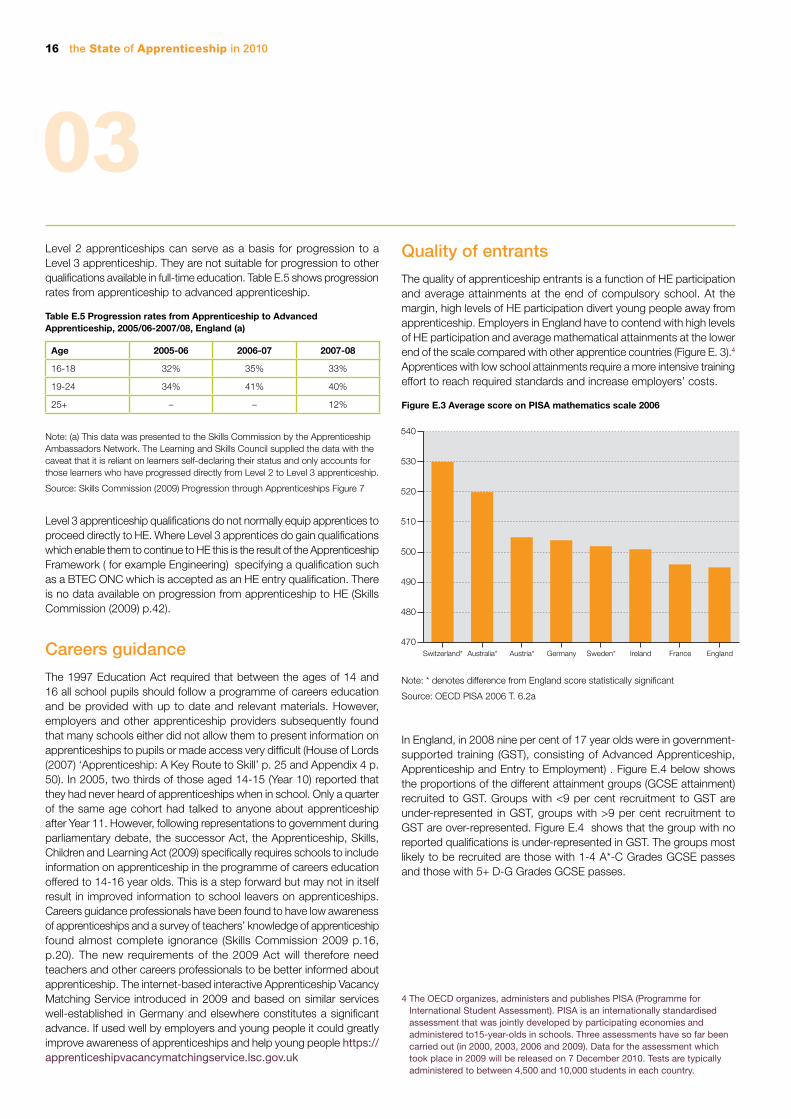
In 2008-09 the overall success rate (completion of all Framework Elements – see Governance and Content above) for England was 72.2 per cent a considerable improvement since 2005-06 when the corresponding rate was 46.9 per cent (Table E.4).
Table E.4 Apprenticeship Framework Completion by age and level 2008/09, England
Age 2008/09 2008/09 % (a)
Apprenticeship (level 2) Under 16 300
16-18 49,900
19-24 35,500
25+ 12,500
Total 98,100 72.8
Advanced Apprenticeship (level 3) Under 16 -
16-18 17,500
19-24 22,400
25+ 5,400
Total 45,200 71.2
All Apprenticeships Under 16 300
16-18 67,300
19-24 57,800
25+ 17,900
Total 143,400 72.2
Note: (a) Number achieving a full framework qualification divided by number leaving or completing in this year expressed as a percentage
Source: The Data Service All March 2010 SFR Files Table 4 and Table 6.2
Table E.3 Apprenticeship starts by age and level 2006/07-2008/09, England
Age 2006/07 2006/07 2007/08 2007/08 2008/09 2008/09
Apprenticeship (level 2) Under 16 500 0.4% 500 0.3% 300 0.2%
16-18 80,300 63% 81,500 54% 73,800 47%
19-24 46,500 36% 55,200 36% 52,600 33%
25+ 100 0.1% 14,600 9.6% 31,700 20.0%
Total 127,400 100% 151,800 100% 158,500 100%
Advanced Apprenticeship (level 3) Under 16 - - -
16-18 24,800 44% 25,500 35% 25,100 31%
19-24 32,100 56% 34,900 48% 32,100 39%
25+ 100 0% 12,600 17% 24,200 30%
Total 57,000 100% 73,000 100% 81,400 100%
Source: The Data Service All March 2010 SFR Files Table 6.1
16 the State of Apprenticeship in 2010
470
480
490
500
510
520
530
540
EnglandFranceIrelandSweden*GermanyAustria*Australia*Switzerland*
03Level 2 apprenticeships can serve as a basis for progression to a Level 3 apprenticeship. They are not suitable for progression to other qualifications available in full-time education. Table E.5 shows progression rates from apprenticeship to advanced apprenticeship.
Table E.5 Progression rates from Apprenticeship to Advanced Apprenticeship, 2005/06-2007/08, England (a)
Age 2005-06 2006-07 2007-08
16-18 32% 35% 33%
19-24 34% 41% 40%
25+ – – 12%
Note: (a) This data was presented to the Skills Commission by the Apprenticeship Ambassadors Network. The Learning and Skills Council supplied the data with the caveat that it is reliant on learners self-declaring their status and only accounts for those learners who have progressed directly from Level 2 to Level 3 apprenticeship.
Source: Skills Commission (2009) Progression through Apprenticeships Figure 7
Level 3 apprenticeship qualifications do not normally equip apprentices to proceed directly to HE. Where Level 3 apprentices do gain qualifications which enable them to continue to HE this is the result of the Apprenticeship Framework ( for example Engineering) specifying a qualification such as a BTEC ONC which is accepted as an HE entry qualification. There is no data available on progression from apprenticeship to HE (Skills Commission (2009) p.42).
Careers guidance
The 1997 Education Act required that between the ages of 14 and 16 all school pupils should follow a programme of careers education and be provided with up to date and relevant materials. However, employers and other apprenticeship providers subsequently found that many schools either did not allow them to present information on apprenticeships to pupils or made access very difficult (House of Lords (2007) ‘Apprenticeship: A Key Route to Skill’ p. 25 and Appendix 4 p. 50). In 2005, two thirds of those aged 14-15 (Year 10) reported that they had never heard of apprenticeships when in school. Only a quarter of the same age cohort had talked to anyone about apprenticeship after Year 11. However, following representations to government during parliamentary debate, the successor Act, the Apprenticeship, Skills, Children and Learning Act (2009) specifically requires schools to include information on apprenticeship in the programme of careers education offered to 14-16 year olds. This is a step forward but may not in itself result in improved information to school leavers on apprenticeships. Careers guidance professionals have been found to have low awareness of apprenticeships and a survey of teachers’ knowledge of apprenticeship found almost complete ignorance (Skills Commission 2009 p.16, p.20). The new requirements of the 2009 Act will therefore need teachers and other careers professionals to be better informed about apprenticeship. The internet-based interactive Apprenticeship Vacancy Matching Service introduced in 2009 and based on similar services well-established in Germany and elsewhere constitutes a significant advance. If used well by employers and young people it could greatly improve awareness of apprenticeships and help young people https://apprenticeshipvacancymatchingservice.lsc.gov.uk
Quality of entrants
The quality of apprenticeship entrants is a function of HE participation and average attainments at the end of compulsory school. At the margin, high levels of HE participation divert young people away from apprenticeship. Employers in England have to contend with high levels of HE participation and average mathematical attainments at the lower end of the scale compared with other apprentice countries (Figure E. 3).4 Apprentices with low school attainments require a more intensive training effort to reach required standards and increase employers’ costs.
Figure E.3 Average score on PISA mathematics scale 2006
Note: * denotes difference from England score statistically significant
Source: OECD PISA 2006 T. 6.2a
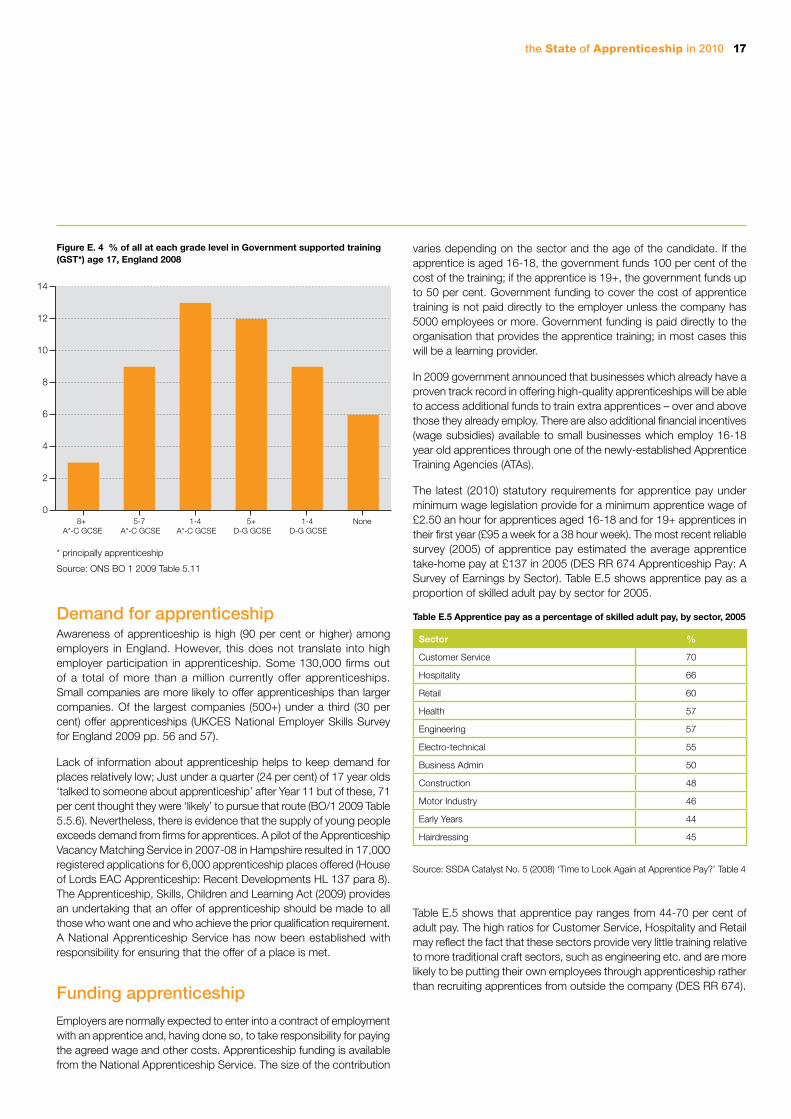
In England, in 2008 nine per cent of 17 year olds were in government-supported training (GST), consisting of Advanced Apprenticeship, Apprenticeship and Entry to Employment) . Figure E.4 below shows the proportions of the different attainment groups (GCSE attainment) recruited to GST. Groups with <9 per cent recruitment to GST are under-represented in GST, groups with >9 per cent recruitment to GST are over-represented. Figure E.4 shows that the group with no reported qualifications is under-represented in GST. The groups most likely to be recruited are those with 1-4 A*-C Grades GCSE passes and those with 5+ D-G Grades GCSE passes.
4 The OECD organizes, administers and publishes PISA (Programme for International Student Assessment). PISA is an internationally standardised assessment that was jointly developed by participating economies and administered to15-year-olds in schools. Three assessments have so far been carried out (in 2000, 2003, 2006 and 2009). Data for the assessment which took place in 2009 will be released on 7 December 2010. Tests are typically administered to between 4,500 and 10,000 students in each country.
the State of Apprenticeship in 2010 17
0
2
4
6
8
10
12
14
None 1-4 D-G GCSE
5+ D-G GCSE
1-4 A*-C GCSE
5-7 A*-C GCSE
8+ A*-C GCSE
* principally apprenticeship
Source: ONS BO 1 2009 Table 5.11
Demand for apprenticeshipAwareness of apprenticeship is high (90 per cent or higher) among employers in England. However, this does not translate into high employer participation in apprenticeship. Some 130,000 firms out of a total of more than a million currently offer apprenticeships. Small companies are more likely to offer apprenticeships than larger companies. Of the largest companies (500+) under a third (30 per cent) offer apprenticeships (UKCES National Employer Skills Survey for England 2009 pp. 56 and 57).
Lack of information about apprenticeship helps to keep demand for places relatively low; Just under a quarter (24 per cent) of 17 year olds ‘talked to someone about apprenticeship’ after Year 11 but of these, 71 per cent thought they were ‘likely’ to pursue that route (BO/1 2009 Table 5.5.6). Nevertheless, there is evidence that the supply of young people exceeds demand from firms for apprentices. A pilot of the Apprenticeship Vacancy Matching Service in 2007-08 in Hampshire resulted in 17,000 registered applications for 6,000 apprenticeship places offered (House of Lords EAC Apprenticeship: Recent Developments HL 137 para 8). The Apprenticeship, Skills, Children and Learning Act (2009) provides an undertaking that an offer of apprenticeship should be made to all those who want one and who achieve the prior qualification requirement. A National Apprenticeship Service has now been established with responsibility for ensuring that the offer of a place is met.
Funding apprenticeship
Employers are normally expected to enter into a contract of employment with an apprentice and, having done so, to take responsibility for paying the agreed wage and other costs. Apprenticeship funding is available from the National Apprenticeship Service. The size of the contribution
varies depending on the sector and the age of the candidate. If the apprentice is aged 16-18, the government funds 100 per cent of the cost of the training; if the apprentice is 19+, the government funds up to 50 per cent. Government funding to cover the cost of apprentice training is not paid directly to the employer unless the company has 5000 employees or more. Government funding is paid directly to the organisation that provides the apprentice training; in most cases this will be a learning provider.
In 2009 government announced that businesses which already have a proven track record in offering high-quality apprenticeships will be able to access additional funds to train extra apprentices – over and above those they already employ. There are also additional financial incentives (wage subsidies) available to small businesses which employ 16-18 year old apprentices through one of the newly-established Apprentice Training Agencies (ATAs).
The latest (2010) statutory requirements for apprentice pay under minimum wage legislation provide for a minimum apprentice wage of £2.50 an hour for apprentices aged 16-18 and for 19+ apprentices in their first year (£95 a week for a 38 hour week). The most recent reliable survey (2005) of apprentice pay estimated the average apprentice take-home pay at £137 in 2005 (DES RR 674 Apprenticeship Pay: A Survey of Earnings by Sector). Table E.5 shows apprentice pay as a proportion of skilled adult pay by sector for 2005.
Table E.5 Apprentice pay as a percentage of skilled adult pay, by sector, 2005
Sector %
Customer Service 70
Hospitality 66
Retail 60
Health 57
Engineering 57
Electro-technical 55
Business Admin 50
Construction 48
Motor Industry 46
Early Years 44
Hairdressing 45
Source: SSDA Catalyst No. 5 (2008) ‘Time to Look Again at Apprentice Pay?’ Table 4
Table E.5 shows that apprentice pay ranges from 44-70 per cent of adult pay. The high ratios for Customer Service, Hospitality and Retail may reflect the fact that these sectors provide very little training relative to more traditional craft sectors, such as engineering etc. and are more likely to be putting their own employees through apprenticeship rather than recruiting apprentices from outside the company (DES RR 674).
Figure E. 4 % of all at each grade level in Government supported training (GST*) age 17, England 2008

18 the State of Apprenticeship in 2010
03References
DES (2005) Apprenticeship Pay: A Survey of Earnings by Sector RR 674
EURYDICE (2008) National summary sheets on education systems in Europe and
ongoing reforms United Kingdom (England, Wales and NI )
House of Lords Economic Affairs Committee (2007) Apprenticeship: A Key Route
to Skill HL Paper 138-I
OECD (2007) PISA 2006: Science Competencies for Tomorrow’s World
OECD (2009) Learning for Jobs: OECD Reviews of Vocational Education and
Training: England and Wales
Skills Commission (2009) Progression through apprenticeships: The final report of
the Skills Commission’s Inquiry into apprenticeships www.policyconnect.org.uk
UKCES (2008) Catalyst No. 5 Time to Look Again at Apprentice Pay?
UKCES (2009) National Employer Skills Survey for England 2009: Key Findings Report
the State of Apprenticeship in 2010 19
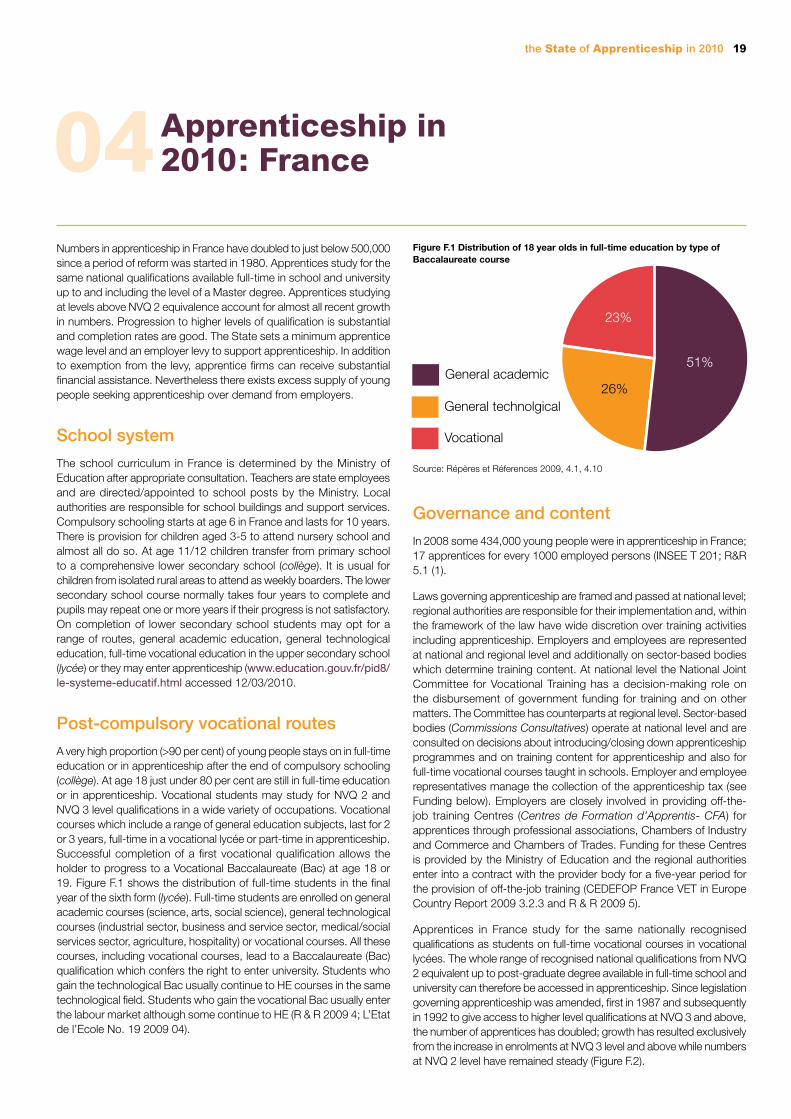
Bac pro
Techno
General
Vocational
General technolgical
General academic
26%
51%
23%
Bac pro
Techno
General
Vocational
General technolgical
General academic
26%
51%
23%
Apprenticeship in 2010: France04
Numbers in apprenticeship in France have doubled to just below 500,000 since a period of reform was started in 1980. Apprentices study for the same national qualifications available full-time in school and university up to and including the level of a Master degree. Apprentices studying at levels above NVQ 2 equivalence account for almost all recent growth in numbers. Progression to higher levels of qualification is substantial and completion rates are good. The State sets a minimum apprentice wage level and an employer levy to support apprenticeship. In addition to exemption from the levy, apprentice firms can receive substantial financial assistance. Nevertheless there exists excess supply of young people seeking apprenticeship over demand from employers.
School system
The school curriculum in France is determined by the Ministry of Education after appropriate consultation. Teachers are state employees and are directed/appointed to school posts by the Ministry. Local authorities are responsible for school buildings and support services. Compulsory schooling starts at age 6 in France and lasts for 10 years. There is provision for children aged 3-5 to attend nursery school and almost all do so. At age 11/12 children transfer from primary school to a comprehensive lower secondary school (collège). It is usual for children from isolated rural areas to attend as weekly boarders. The lower secondary school course normally takes four years to complete and pupils may repeat one or more years if their progress is not satisfactory. On completion of lower secondary school students may opt for a range of routes, general academic education, general technological education, full-time vocational education in the upper secondary school (lycée) or they may enter apprenticeship (www.education.gouv.fr/pid8/le-systeme-educatif.html accessed 12/03/2010.
Post-compulsory vocational routes
A very high proportion (>90 per cent) of young people stays on in full-time education or in apprenticeship after the end of compulsory schooling (collège). At age 18 just under 80 per cent are still in full-time education or in apprenticeship. Vocational students may study for NVQ 2 and NVQ 3 level qualifications in a wide variety of occupations. Vocational courses which include a range of general education subjects, last for 2 or 3 years, full-time in a vocational lycée or part-time in apprenticeship. Successful completion of a first vocational qualification allows the holder to progress to a Vocational Baccalaureate (Bac) at age 18 or 19. Figure F.1 shows the distribution of full-time students in the final year of the sixth form (lycée). Full-time students are enrolled on general academic courses (science, arts, social science), general technological courses (industrial sector, business and service sector, medical/social services sector, agriculture, hospitality) or vocational courses. All these courses, including vocational courses, lead to a Baccalaureate (Bac) qualification which confers the right to enter university. Students who gain the technological Bac usually continue to HE courses in the same technological field. Students who gain the vocational Bac usually enter the labour market although some continue to HE (R & R 2009 4; L’Etat de l’Ecole No. 19 2009 04).
Figure F.1 Distribution of 18 year olds in full-time education by type of Baccalaureate course
Source: Répères et Réferences 2009, 4.1, 4.10
Governance and content
In 2008 some 434,000 young people were in apprenticeship in France; 17 apprentices for every 1000 employed persons (INSEE T 201; R&R 5.1 (1).
Laws governing apprenticeship are framed and passed at national level; regional authorities are responsible for their implementation and, within the framework of the law have wide discretion over training activities including apprenticeship. Employers and employees are represented at national and regional level and additionally on sector-based bodies which determine training content. At national level the National Joint Committee for Vocational Training has a decision-making role on the disbursement of government funding for training and on other matters. The Committee has counterparts at regional level. Sector-based bodies (Commissions Consultatives) operate at national level and are consulted on decisions about introducing/closing down apprenticeship programmes and on training content for apprenticeship and also for full-time vocational courses taught in schools. Employer and employee representatives manage the collection of the apprenticeship tax (see Funding below). Employers are closely involved in providing off-the-job training Centres (Centres de Formation d’Apprentis- CFA) for apprentices through professional associations, Chambers of Industry and Commerce and Chambers of Trades. Funding for these Centres is provided by the Ministry of Education and the regional authorities enter into a contract with the provider body for a five-year period for the provision of off-the-job training (CEDEFOP France VET in Europe Country Report 2009 3.2.3 and R & R 2009 5).
Apprentices in France study for the same nationally recognised qualifications as students on full-time vocational courses in vocational lycées. The whole range of recognised national qualifications from NVQ 2 equivalent up to post-graduate degree available in full-time school and university can therefore be accessed in apprenticeship. Since legislation governing apprenticeship was amended, first in 1987 and subsequently in 1992 to give access to higher level qualifications at NVQ 3 and above, the number of apprentices has doubled; growth has resulted exclusively from the increase in enrolments at NVQ 3 level and above while numbers at NVQ 2 level have remained steady (Figure F.2).
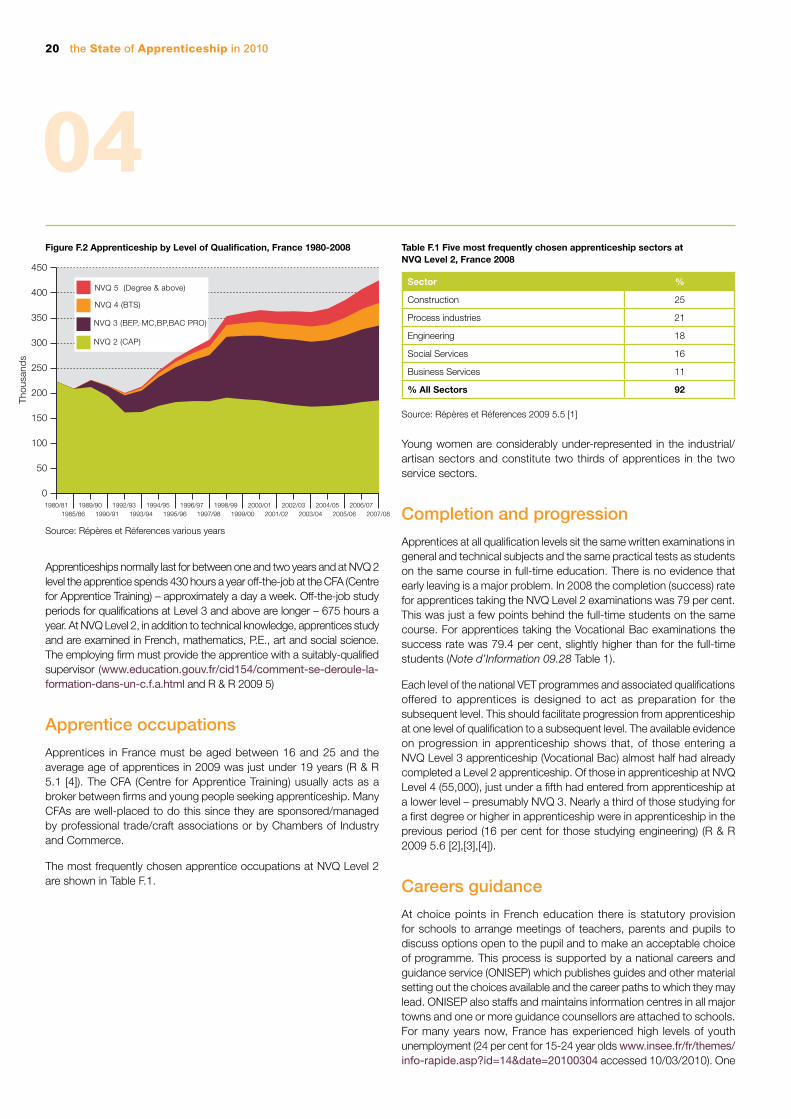
20 the State of Apprenticeship in 2010
0
50
100
150
200
250
300
350
400
450
2007/082006/07
2005/062004/05
2003/042002/03
2001/022000/01
1999/001998/99
1997/981996/97
1995/961994/95
1993/941992/93
1990/911989/90
1985/861980/81
Thou
sand
s
NVQ 5 (Degree & above)
NVQ 4 (BTS)
NVQ 3 (BEP, MC,BP,BAC PRO)
NVQ 2 (CAP)
04Figure F.2 Apprenticeship by Level of Qualification, France 1980-2008
Source: Répères et Réferences various years
Apprenticeships normally last for between one and two years and at NVQ 2 level the apprentice spends 430 hours a year off-the-job at the CFA (Centre for Apprentice Training) – approximately a day a week. Off-the-job study periods for qualifications at Level 3 and above are longer – 675 hours a year. At NVQ Level 2, in addition to technical knowledge, apprentices study and are examined in French, mathematics, P.E., art and social science. The employing firm must provide the apprentice with a suitably-qualified supervisor (www.education.gouv.fr/cid154/comment-se-deroule-la-formation-dans-un-c.f.a.html and R & R 2009 5)
Apprentice occupations
Apprentices in France must be aged between 16 and 25 and the average age of apprentices in 2009 was just under 19 years (R & R 5.1 [4]). The CFA (Centre for Apprentice Training) usually acts as a broker between firms and young people seeking apprenticeship. Many CFAs are well-placed to do this since they are sponsored/managed by professional trade/craft associations or by Chambers of Industry and Commerce.
The most frequently chosen apprentice occupations at NVQ Level 2 are shown in Table F.1.
Table F.1 Five most frequently chosen apprenticeship sectors at NVQ Level 2, France 2008
Sector %
Construction 25
Process industries 21
Engineering 18
Social Services 16
Business Services 11
% All Sectors 92 Source: Répères et Réferences 2009 5.5 [1]
Young women are considerably under-represented in the industrial/artisan sectors and constitute two thirds of apprentices in the two service sectors.
Completion and progression
Apprentices at all qualification levels sit the same written examinations in general and technical subjects and the same practical tests as students on the same course in full-time education. There is no evidence that early leaving is a major problem. In 2008 the completion (success) rate for apprentices taking the NVQ Level 2 examinations was 79 per cent. This was just a few points behind the full-time students on the same course. For apprentices taking the Vocational Bac examinations the success rate was 79.4 per cent, slightly higher than for the full-time students (Note d’Information 09.28 Table 1).
Each level of the national VET programmes and associated qualifications offered to apprentices is designed to act as preparation for the subsequent level. This should facilitate progression from apprenticeship at one level of qualification to a subsequent level. The available evidence on progression in apprenticeship shows that, of those entering a NVQ Level 3 apprenticeship (Vocational Bac) almost half had already completed a Level 2 apprenticeship. Of those in apprenticeship at NVQ Level 4 (55,000), just under a fifth had entered from apprenticeship at a lower level – presumably NVQ 3. Nearly a third of those studying for a first degree or higher in apprenticeship were in apprenticeship in the previous period (16 per cent for those studying engineering) (R & R 2009 5.6 [2],[3],[4]).
Careers guidance
At choice points in French education there is statutory provision for schools to arrange meetings of teachers, parents and pupils to discuss options open to the pupil and to make an acceptable choice of programme. This process is supported by a national careers and guidance service (ONISEP) which publishes guides and other material setting out the choices available and the career paths to which they may lead. ONISEP also staffs and maintains information centres in all major towns and one or more guidance counsellors are attached to schools. For many years now, France has experienced high levels of youth unemployment (24 per cent for 15-24 year olds www.insee.fr/fr/themes/info-rapide.asp?id=14&date=20100304 accessed 10/03/2010). One
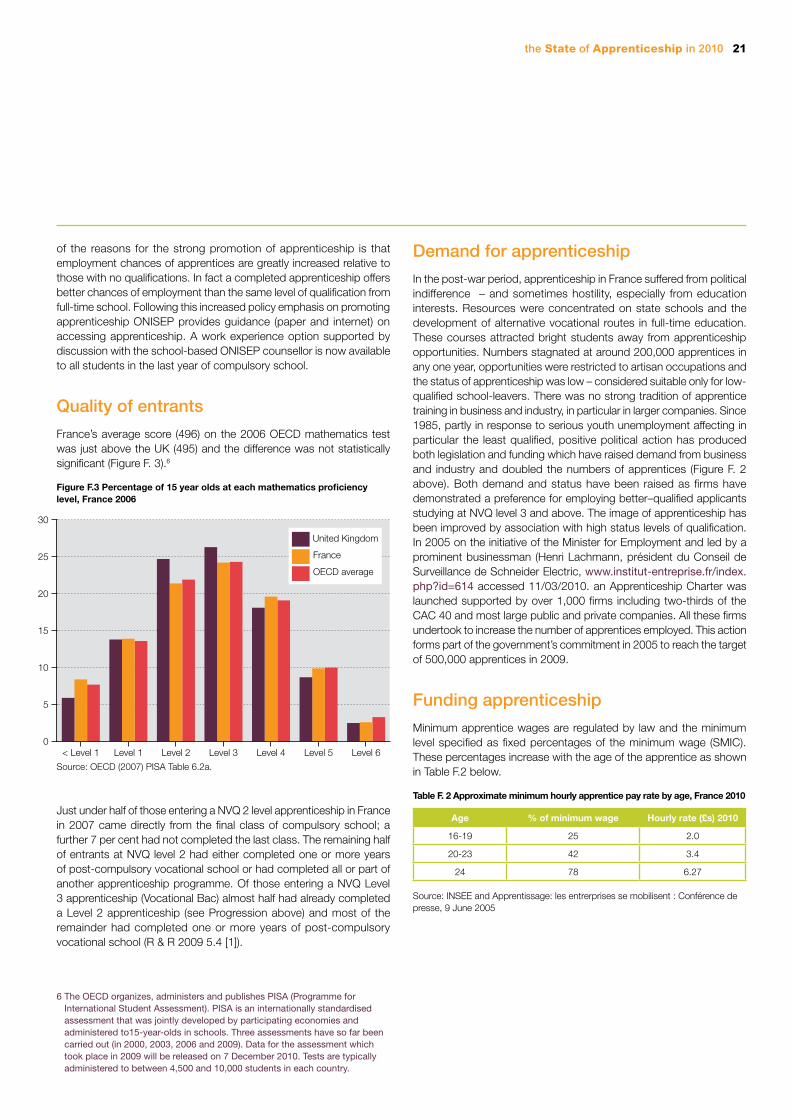
the State of Apprenticeship in 2010 21
0
5
10
15
20
25
30
OECD average
France
United Kingdom
Level 6Level 5Level 4Level 3Level 2Level 1< Level 1
of the reasons for the strong promotion of apprenticeship is that employment chances of apprentices are greatly increased relative to those with no qualifications. In fact a completed apprenticeship offers better chances of employment than the same level of qualification from full-time school. Following this increased policy emphasis on promoting apprenticeship ONISEP provides guidance (paper and internet) on accessing apprenticeship. A work experience option supported by discussion with the school-based ONISEP counsellor is now available to all students in the last year of compulsory school.
Quality of entrants
France’s average score (496) on the 2006 OECD mathematics test was just above the UK (495) and the difference was not statistically significant (Figure F. 3).6
Figure F.3 Percentage of 15 year olds at each mathematics proficiency level, France 2006
Source: OECD (2007) PISA Table 6.2a.
Just under half of those entering a NVQ 2 level apprenticeship in France in 2007 came directly from the final class of compulsory school; a further 7 per cent had not completed the last class. The remaining half of entrants at NVQ level 2 had either completed one or more years of post-compulsory vocational school or had completed all or part of another apprenticeship programme. Of those entering a NVQ Level 3 apprenticeship (Vocational Bac) almost half had already completed a Level 2 apprenticeship (see Progression above) and most of the remainder had completed one or more years of post-compulsory vocational school (R & R 2009 5.4 [1]).
Demand for apprenticeship
In the post-war period, apprenticeship in France suffered from political indifference – and sometimes hostility, especially from education interests. Resources were concentrated on state schools and the development of alternative vocational routes in full-time education. These courses attracted bright students away from apprenticeship opportunities. Numbers stagnated at around 200,000 apprentices in any one year, opportunities were restricted to artisan occupations and the status of apprenticeship was low – considered suitable only for low-qualified school-leavers. There was no strong tradition of apprentice training in business and industry, in particular in larger companies. Since 1985, partly in response to serious youth unemployment affecting in particular the least qualified, positive political action has produced both legislation and funding which have raised demand from business and industry and doubled the numbers of apprentices (Figure F. 2 above). Both demand and status have been raised as firms have demonstrated a preference for employing better–qualified applicants studying at NVQ level 3 and above. The image of apprenticeship has been improved by association with high status levels of qualification. In 2005 on the initiative of the Minister for Employment and led by a prominent businessman (Henri Lachmann, président du Conseil de Surveillance de Schneider Electric, www.institut-entreprise.fr/index.php?id=614 accessed 11/03/2010. an Apprenticeship Charter was launched supported by over 1,000 firms including two-thirds of the CAC 40 and most large public and private companies. All these firms undertook to increase the number of apprentices employed. This action forms part of the government’s commitment in 2005 to reach the target of 500,000 apprentices in 2009.
Funding apprenticeship
Minimum apprentice wages are regulated by law and the minimum level specified as fixed percentages of the minimum wage (SMIC). These percentages increase with the age of the apprentice as shown in Table F.2 below.
Table F. 2 Approximate minimum hourly apprentice pay rate by age, France 2010
Age % of minimum wage Hourly rate (£s) 2010
16-19 25 2.0
20-23 42 3.4
24 78 6.27
Source: INSEE and Apprentissage: les entrerprises se mobilisent : Conférence de presse, 9 June 2005
6 The OECD organizes, administers and publishes PISA (Programme for International Student Assessment). PISA is an internationally standardised assessment that was jointly developed by participating economies and administered to15-year-olds in schools. Three assessments have so far been carried out (in 2000, 2003, 2006 and 2009). Data for the assessment which took place in 2009 will be released on 7 December 2010. Tests are typically administered to between 4,500 and 10,000 students in each country.
22 the State of Apprenticeship in 2010
04In some sectors firms pay well above the minimum levels set out above. All firms pay an apprenticeship tax which is set at 0.05 per cent of the salaries for firms with <250 employees and 0.06 per cent for firms with >250 employees. Exemption from the tax is conditional on firms training a specified number of apprentices. In 2010 the number of apprentices which grant exemption from the tax for firms with >250 employees has been increased to 3 per firm. The apprenticeship tax is a hypothecated tax but does not directly benefit apprenticeship. The firm can choose to pay the tax to an education establishment of its choice – including universities – and there is considerable competition among education establishments for firms’ contributions from the tax. One of the proposals put forward by the Apprenticeship Charter employer group (see Demand above) is for the apprenticeship tax to be used directly to finance apprenticeship.
Firms which take apprentices receive payments from the regional authorities (which have direct control of training funds) and these payments vary by region. The most generous region (Lower-Normandy) pays up to £5,300 per apprentice while a less generous region may pay around £3000 per apprentice. www.lapprenti.com/articles/article_auto.asp?rubnews_id=28&js=2#234 accessed 11/03/2010.
References
CEDEFOP (2009) France: VET in Europe Country Report
Ministère de l’Education Nationale (2009) Repères et Références Statistiques sur
les Enseignements, la Formation et la Recherche ( R & R in text)
Ministère de l’Education Nationale (2009) L’Etat de l’Ecole
Ministère de l’Education Nationale (2009) Note d’Information 09.28
OECD (2007) PISA 2006: Science Competencies for Tomorrow’s World
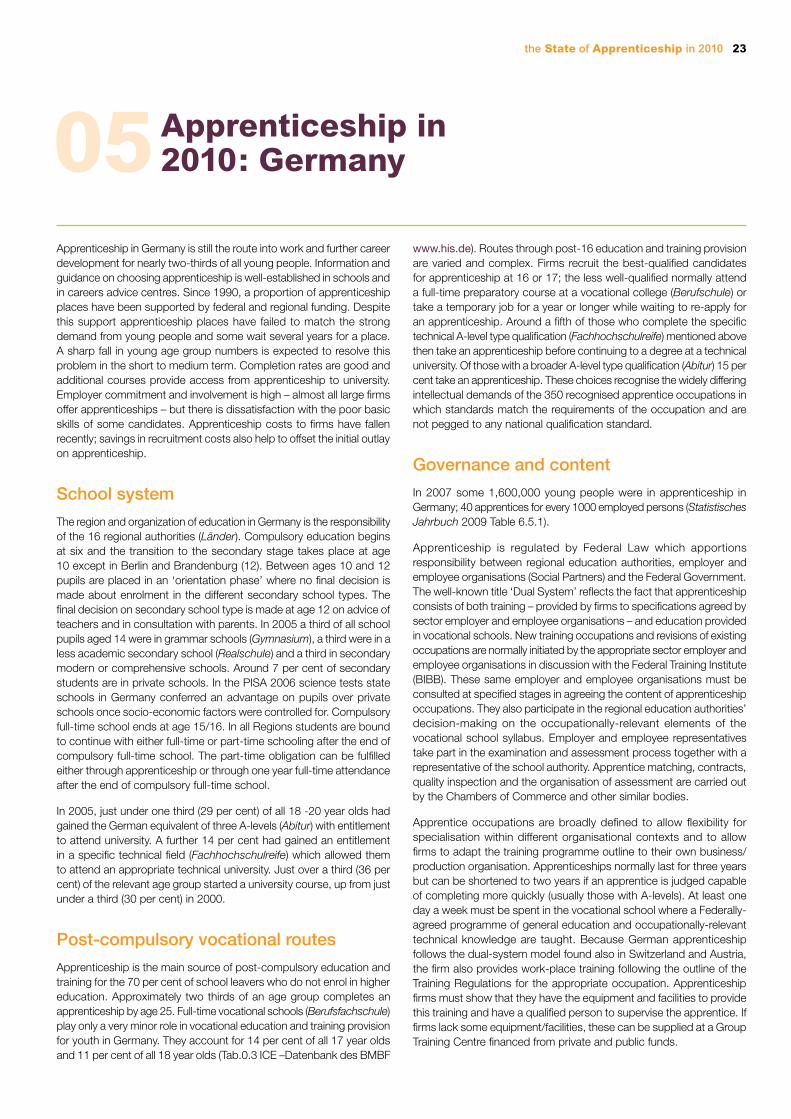
the State of Apprenticeship in 2010 23
Apprenticeship in 2010: Germany05
Apprenticeship in Germany is still the route into work and further career development for nearly two-thirds of all young people. Information and guidance on choosing apprenticeship is well-established in schools and in careers advice centres. Since 1990, a proportion of apprenticeship places have been supported by federal and regional funding. Despite this support apprenticeship places have failed to match the strong demand from young people and some wait several years for a place. A sharp fall in young age group numbers is expected to resolve this problem in the short to medium term. Completion rates are good and additional courses provide access from apprenticeship to university. Employer commitment and involvement is high – almost all large firms offer apprenticeships – but there is dissatisfaction with the poor basic skills of some candidates. Apprenticeship costs to firms have fallen recently; savings in recruitment costs also help to offset the initial outlay on apprenticeship.
School system
The region and organization of education in Germany is the responsibility of the 16 regional authorities (Länder). Compulsory education begins at six and the transition to the secondary stage takes place at age 10 except in Berlin and Brandenburg (12). Between ages 10 and 12 pupils are placed in an ‘orientation phase’ where no final decision is made about enrolment in the different secondary school types. The final decision on secondary school type is made at age 12 on advice of teachers and in consultation with parents. In 2005 a third of all school pupils aged 14 were in grammar schools (Gymnasium), a third were in a less academic secondary school (Realschule) and a third in secondary modern or comprehensive schools. Around 7 per cent of secondary students are in private schools. In the PISA 2006 science tests state schools in Germany conferred an advantage on pupils over private schools once socio-economic factors were controlled for. Compulsory full-time school ends at age 15/16. In all Regions students are bound to continue with either full-time or part-time schooling after the end of compulsory full-time school. The part-time obligation can be fulfilled either through apprenticeship or through one year full-time attendance after the end of compulsory full-time school.
In 2005, just under one third (29 per cent) of all 18 -20 year olds had gained the German equivalent of three A-levels (Abitur) with entitlement to attend university. A further 14 per cent had gained an entitlement in a specific technical field (Fachhochschulreife) which allowed them to attend an appropriate technical university. Just over a third (36 per cent) of the relevant age group started a university course, up from just under a third (30 per cent) in 2000.
Post-compulsory vocational routes
Apprenticeship is the main source of post-compulsory education and training for the 70 per cent of school leavers who do not enrol in higher education. Approximately two thirds of an age group completes an apprenticeship by age 25. Full-time vocational schools (Berufsfachschule) play only a very minor role in vocational education and training provision for youth in Germany. They account for 14 per cent of all 17 year olds and 11 per cent of all 18 year olds (Tab.0.3 ICE –Datenbank des BMBF
www.his.de). Routes through post-16 education and training provision are varied and complex. Firms recruit the best-qualified candidates for apprenticeship at 16 or 17; the less well-qualified normally attend a full-time preparatory course at a vocational college (Berufschule) or take a temporary job for a year or longer while waiting to re-apply for an apprenticeship. Around a fifth of those who complete the specific technical A-level type qualification (Fachhochschulreife) mentioned above then take an apprenticeship before continuing to a degree at a technical university. Of those with a broader A-level type qualification (Abitur) 15 per cent take an apprenticeship. These choices recognise the widely differing intellectual demands of the 350 recognised apprentice occupations in which standards match the requirements of the occupation and are not pegged to any national qualification standard.
Governance and content
In 2007 some 1,600,000 young people were in apprenticeship in Germany; 40 apprentices for every 1000 employed persons (Statistisches Jahrbuch 2009 Table 6.5.1).
Apprenticeship is regulated by Federal Law which apportions responsibility between regional education authorities, employer and employee organisations (Social Partners) and the Federal Government. The well-known title ‘Dual System’ reflects the fact that apprenticeship consists of both training – provided by firms to specifications agreed by sector employer and employee organisations – and education provided in vocational schools. New training occupations and revisions of existing occupations are normally initiated by the appropriate sector employer and employee organisations in discussion with the Federal Training Institute (BIBB). These same employer and employee organisations must be consulted at specified stages in agreeing the content of apprenticeship occupations. They also participate in the regional education authorities’ decision-making on the occupationally-relevant elements of the vocational school syllabus. Employer and employee representatives take part in the examination and assessment process together with a representative of the school authority. Apprentice matching, contracts, quality inspection and the organisation of assessment are carried out by the Chambers of Commerce and other similar bodies.
Apprentice occupations are broadly defined to allow flexibility for specialisation within different organisational contexts and to allow firms to adapt the training programme outline to their own business/production organisation. Apprenticeships normally last for three years but can be shortened to two years if an apprentice is judged capable of completing more quickly (usually those with A-levels). At least one day a week must be spent in the vocational school where a Federally-agreed programme of general education and occupationally-relevant technical knowledge are taught. Because German apprenticeship follows the dual-system model found also in Switzerland and Austria, the firm also provides work-place training following the outline of the Training Regulations for the appropriate occupation. Apprenticeship firms must show that they have the equipment and facilities to provide this training and have a qualified person to supervise the apprentice. If firms lack some equipment/facilities, these can be supplied at a Group Training Centre financed from private and public funds.
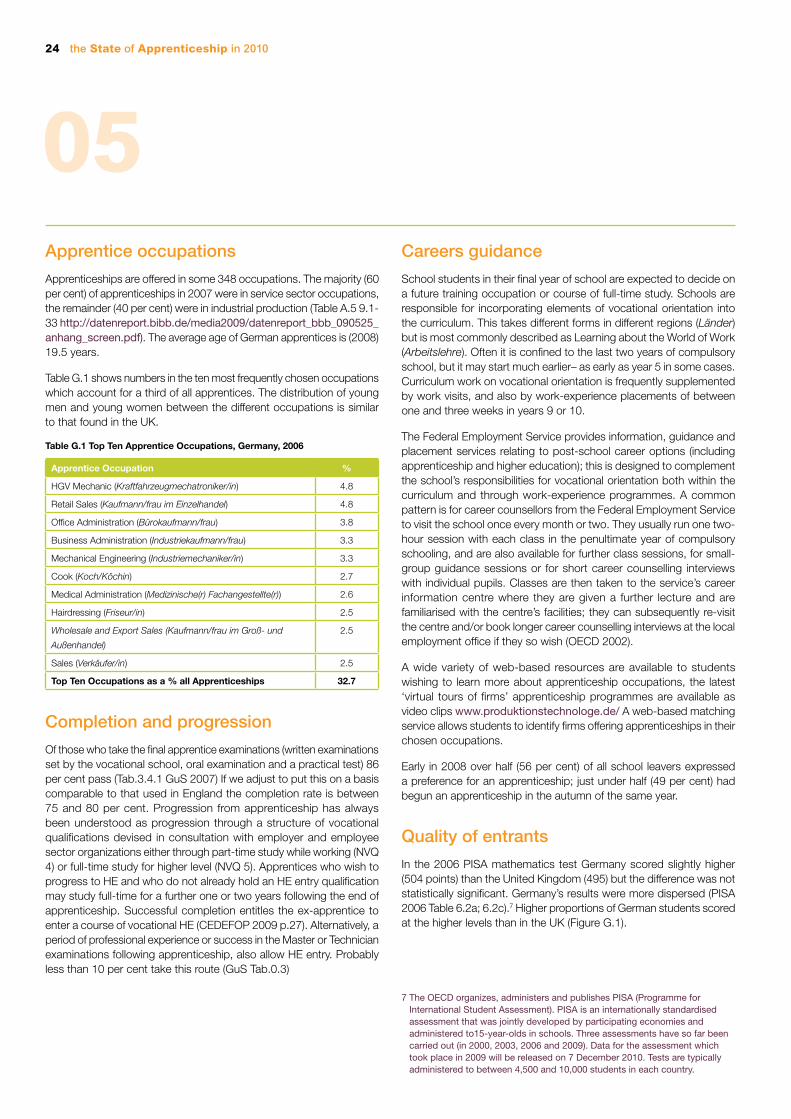
24 the State of Apprenticeship in 2010
7 The OECD organizes, administers and publishes PISA (Programme for International Student Assessment). PISA is an internationally standardised assessment that was jointly developed by participating economies and administered to15-year-olds in schools. Three assessments have so far been carried out (in 2000, 2003, 2006 and 2009). Data for the assessment which took place in 2009 will be released on 7 December 2010. Tests are typically administered to between 4,500 and 10,000 students in each country.
05Apprentice occupations
Apprenticeships are offered in some 348 occupations. The majority (60 per cent) of apprenticeships in 2007 were in service sector occupations, the remainder (40 per cent) were in industrial production (Table A.5 9.1-33 http://datenreport.bibb.de/media2009/datenreport_bbb_090525_anhang_screen.pdf). The average age of German apprentices is (2008) 19.5 years.
Table G.1 shows numbers in the ten most frequently chosen occupations which account for a third of all apprentices. The distribution of young men and young women between the different occupations is similar to that found in the UK.
Table G.1 Top Ten Apprentice Occupations, Germany, 2006
Apprentice Occupation %
HGV Mechanic (Kraftfahrzeugmechatroniker/in) 4.8
Retail Sales (Kaufmann/frau im Einzelhandel) 4.8
Office Administration (Bürokaufmann/frau) 3.8
Business Administration (Industriekaufmann/frau) 3.3
Mechanical Engineering (Industriemechaniker/in) 3.3
Cook (Koch/Köchin) 2.7
Medical Administration (Medizinische(r) Fachangestellte(r)) 2.6
Hairdressing (Friseur/in) 2.5
Wholesale and Export Sales (Kaufmann/frau im Groß- und
Außenhandel)
2.5
Sales (Verkäufer/in) 2.5
Top Ten Occupations as a % all Apprenticeships 32.7
Completion and progression
Of those who take the final apprentice examinations (written examinations set by the vocational school, oral examination and a practical test) 86 per cent pass (Tab.3.4.1 GuS 2007) If we adjust to put this on a basis comparable to that used in England the completion rate is between 75 and 80 per cent. Progression from apprenticeship has always been understood as progression through a structure of vocational qualifications devised in consultation with employer and employee sector organizations either through part-time study while working (NVQ 4) or full-time study for higher level (NVQ 5). Apprentices who wish to progress to HE and who do not already hold an HE entry qualification may study full-time for a further one or two years following the end of apprenticeship. Successful completion entitles the ex-apprentice to enter a course of vocational HE (CEDEFOP 2009 p.27). Alternatively, a period of professional experience or success in the Master or Technician examinations following apprenticeship, also allow HE entry. Probably less than 10 per cent take this route (GuS Tab.0.3)
Careers guidance
School students in their final year of school are expected to decide on a future training occupation or course of full-time study. Schools are responsible for incorporating elements of vocational orientation into the curriculum. This takes different forms in different regions (Länder) but is most commonly described as Learning about the World of Work (Arbeitslehre). Often it is confined to the last two years of compulsory school, but it may start much earlier– as early as year 5 in some cases. Curriculum work on vocational orientation is frequently supplemented by work visits, and also by work-experience placements of between one and three weeks in years 9 or 10.
The Federal Employment Service provides information, guidance and placement services relating to post-school career options (including apprenticeship and higher education); this is designed to complement the school’s responsibilities for vocational orientation both within the curriculum and through work-experience programmes. A common pattern is for career counsellors from the Federal Employment Service to visit the school once every month or two. They usually run one two-hour session with each class in the penultimate year of compulsory schooling, and are also available for further class sessions, for small-group guidance sessions or for short career counselling interviews with individual pupils. Classes are then taken to the service’s career information centre where they are given a further lecture and are familiarised with the centre’s facilities; they can subsequently re-visit the centre and/or book longer career counselling interviews at the local employment office if they so wish (OECD 2002).
A wide variety of web-based resources are available to students wishing to learn more about apprenticeship occupations, the latest ‘virtual tours of firms’ apprenticeship programmes are available as video clips www.produktionstechnologe.de/ A web-based matching service allows students to identify firms offering apprenticeships in their chosen occupations.
Early in 2008 over half (56 per cent) of all school leavers expressed a preference for an apprenticeship; just under half (49 per cent) had begun an apprenticeship in the autumn of the same year.
Quality of entrants
In the 2006 PISA mathematics test Germany scored slightly higher (504 points) than the United Kingdom (495) but the difference was not statistically significant. Germany’s results were more dispersed (PISA 2006 Table 6.2a; 6.2c).7 Higher proportions of German students scored at the higher levels than in the UK (Figure G.1).
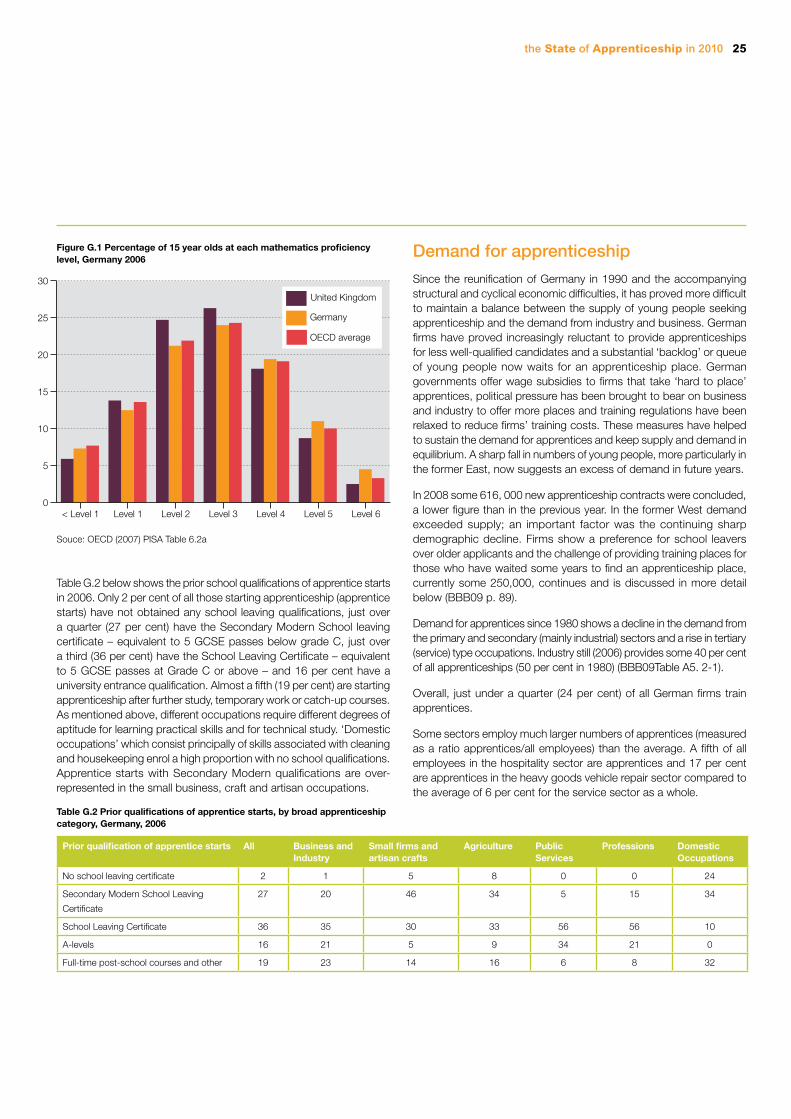
the State of Apprenticeship in 2010 25
0
5
10
15
20
25
30
Level 6Level 5Level 4Level 3Level 2Level 1< Level 1
OECD average
Germany
United Kingdom
Souce: OECD (2007) PISA Table 6.2a
Table G.2 below shows the prior school qualifications of apprentice starts in 2006. Only 2 per cent of all those starting apprenticeship (apprentice starts) have not obtained any school leaving qualifications, just over a quarter (27 per cent) have the Secondary Modern School leaving certificate – equivalent to 5 GCSE passes below grade C, just over a third (36 per cent) have the School Leaving Certificate – equivalent to 5 GCSE passes at Grade C or above – and 16 per cent have a university entrance qualification. Almost a fifth (19 per cent) are starting apprenticeship after further study, temporary work or catch-up courses. As mentioned above, different occupations require different degrees of aptitude for learning practical skills and for technical study. ‘Domestic occupations’ which consist principally of skills associated with cleaning and housekeeping enrol a high proportion with no school qualifications. Apprentice starts with Secondary Modern qualifications are over-represented in the small business, craft and artisan occupations.
Table G.2 Prior qualifications of apprentice starts, by broad apprenticeship category, Germany, 2006
Prior qualification of apprentice starts All Business and Industry
Small firms and artisan crafts
Agriculture Public Services
Professions Domestic Occupations
No school leaving certificate 2 1 5 8 0 0 24
Secondary Modern School Leaving
Certificate
27 20 46 34 5 15 34
School Leaving Certificate 36 35 30 33 56 56 10
A-levels 16 21 5 9 34 21 0
Full-time post-school courses and other 19 23 14 16 6 8 32
Demand for apprenticeship
Since the reunification of Germany in 1990 and the accompanying structural and cyclical economic difficulties, it has proved more difficult to maintain a balance between the supply of young people seeking apprenticeship and the demand from industry and business. German firms have proved increasingly reluctant to provide apprenticeships for less well-qualified candidates and a substantial ‘backlog’ or queue of young people now waits for an apprenticeship place. German governments offer wage subsidies to firms that take ‘hard to place’ apprentices, political pressure has been brought to bear on business and industry to offer more places and training regulations have been relaxed to reduce firms’ training costs. These measures have helped to sustain the demand for apprentices and keep supply and demand in equilibrium. A sharp fall in numbers of young people, more particularly in the former East, now suggests an excess of demand in future years.
In 2008 some 616, 000 new apprenticeship contracts were concluded, a lower figure than in the previous year. In the former West demand exceeded supply; an important factor was the continuing sharp demographic decline. Firms show a preference for school leavers over older applicants and the challenge of providing training places for those who have waited some years to find an apprenticeship place, currently some 250,000, continues and is discussed in more detail below (BBB09 p. 89).
Demand for apprentices since 1980 shows a decline in the demand from the primary and secondary (mainly industrial) sectors and a rise in tertiary (service) type occupations. Industry still (2006) provides some 40 per cent of all apprenticeships (50 per cent in 1980) (BBB09Table A5. 2-1).
Overall, just under a quarter (24 per cent) of all German firms train apprentices.
Some sectors employ much larger numbers of apprentices (measured as a ratio apprentices/all employees) than the average. A fifth of all employees in the hospitality sector are apprentices and 17 per cent are apprentices in the heavy goods vehicle repair sector compared to the average of 6 per cent for the service sector as a whole.
Figure G.1 Percentage of 15 year olds at each mathematics proficiency level, Germany 2006
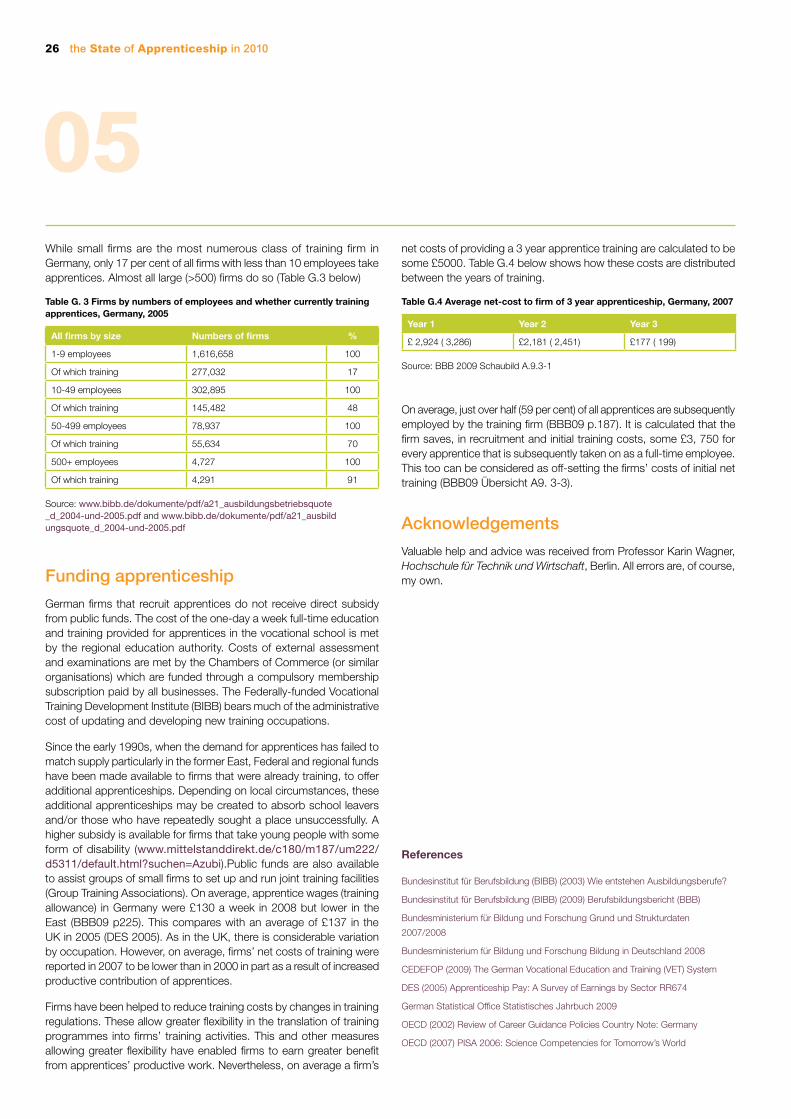
26 the State of Apprenticeship in 2010
05While small firms are the most numerous class of training firm in Germany, only 17 per cent of all firms with less than 10 employees take apprentices. Almost all large (>500) firms do so (Table G.3 below)
Table G. 3 Firms by numbers of employees and whether currently training apprentices, Germany, 2005
All firms by size Numbers of firms %
1-9 employees 1,616,658 100
Of which training 277,032 17
10-49 employees 302,895 100
Of which training 145,482 48
50-499 employees 78,937 100
Of which training 55,634 70
500+ employees 4,727 100
Of which training 4,291 91
Source: www.bibb.de/dokumente/pdf/a21_ausbildungsbetriebsquote _d_2004-und-2005.pdf and www.bibb.de/dokumente/pdf/a21_ausbild ungsquote_d_2004-und-2005.pdf
Funding apprenticeship
German firms that recruit apprentices do not receive direct subsidy from public funds. The cost of the one-day a week full-time education and training provided for apprentices in the vocational school is met by the regional education authority. Costs of external assessment and examinations are met by the Chambers of Commerce (or similar organisations) which are funded through a compulsory membership subscription paid by all businesses. The Federally-funded Vocational Training Development Institute (BIBB) bears much of the administrative cost of updating and developing new training occupations.
Since the early 1990s, when the demand for apprentices has failed to match supply particularly in the former East, Federal and regional funds have been made available to firms that were already training, to offer additional apprenticeships. Depending on local circumstances, these additional apprenticeships may be created to absorb school leavers and/or those who have repeatedly sought a place unsuccessfully. A higher subsidy is available for firms that take young people with some form of disability (www.mittelstanddirekt.de/c180/m187/um222/d5311/default.html?suchen=Azubi).Public funds are also available to assist groups of small firms to set up and run joint training facilities (Group Training Associations). On average, apprentice wages (training allowance) in Germany were £130 a week in 2008 but lower in the East (BBB09 p225). This compares with an average of £137 in the UK in 2005 (DES 2005). As in the UK, there is considerable variation by occupation. However, on average, firms’ net costs of training were reported in 2007 to be lower than in 2000 in part as a result of increased productive contribution of apprentices.
Firms have been helped to reduce training costs by changes in training regulations. These allow greater flexibility in the translation of training programmes into firms’ training activities. This and other measures allowing greater flexibility have enabled firms to earn greater benefit from apprentices’ productive work. Nevertheless, on average a firm’s
net costs of providing a 3 year apprentice training are calculated to be some £5000. Table G.4 below shows how these costs are distributed between the years of training.
Table G.4 Average net-cost to firm of 3 year apprenticeship, Germany, 2007
Year 1 Year 2 Year 3
£ 2,924 (€3,286) £2,181 (€2,451) £177 (€199)
Source: BBB 2009 Schaubild A.9.3-1
On average, just over half (59 per cent) of all apprentices are subsequently employed by the training firm (BBB09 p.187). It is calculated that the firm saves, in recruitment and initial training costs, some £3, 750 for every apprentice that is subsequently taken on as a full-time employee. This too can be considered as off-setting the firms’ costs of initial net training (BBB09 Übersicht A9. 3-3).
Acknowledgements
Valuable help and advice was received from Professor Karin Wagner, Hochschule für Technik und Wirtschaft, Berlin. All errors are, of course, my own.
References
Bundesinstitut für Berufsbildung (BIBB) (2003) Wie entstehen Ausbildungsberufe?
Bundesinstitut für Berufsbildung (BIBB) (2009) Berufsbildungsbericht (BBB)
Bundesministerium für Bildung und Forschung Grund und Strukturdaten
2007/2008
Bundesministerium für Bildung und Forschung Bildung in Deutschland 2008
CEDEFOP (2009) The German Vocational Education and Training (VET) System
DES (2005) Apprenticeship Pay: A Survey of Earnings by Sector RR674
German Statistical Office Statistisches Jahrbuch 2009
OECD (2002) Review of Career Guidance Policies Country Note: Germany
OECD (2007) PISA 2006: Science Competencies for Tomorrow’s World
the State of Apprenticeship in 2010 27
Apprenticeship in 2010: Ireland06
In 1991 a new standards-based apprenticeship system replaced traditional time-served apprenticeships. Numbers in apprenticeship in Ireland expanded rapidly during the years of rapid economic growth but have fallen since 2008. Employer involvement varies by sector; most apprenticeships are in construction and industrial occupations and most apprentices are young men. Some two thirds of all apprentices complete the four year apprenticeship course which includes substantial off-the-job study periods and can lead to university-level courses. Many apprenticeship entrants have good prior school achievements. Employers pay an apprentice training levy which is used to subsidise firms that employ apprentices. The National Training Authority has been criticised by some employers for lack of transparency.
School system
Compulsory education in Ireland lasts for 10 years. Practically all 5 year olds are in school and must be in education by age 6. Pupils attend six years of primary education until age 11/12. This is followed by four years of the Junior Cycle of Secondary Education in one of three types of school, Voluntary (Aided), Comprehensive or Vocational. All these lead to the Junior Certificate examination in 7-10 subjects including Irish, English and Mathematics. Additional subjects may be vocational or academic.
In the Senior Cycle of Secondary Education students are again distributed between the three types of school named above. In all three school types students may study for the Senior Leaving Certificate in one of three options, academic, vocational and applied. The academic and vocational Senior Leaving Certificates both give access to tertiary education. Around 80 per cent gain a Senior Leaving Certificate (Eurydice 2009 National Summary Sheets On Education System In Europe And On-Going Reforms and CEDEFOP 2008 Ireland: Overview of the Vocational Education and Training System 04).
Just under 60 per cent of Irish school students are in independent/private schools, most of which are government-financed. Students at independent/private schools have higher scores on the PISA 2006 science tests than state school pupils after controlling for socio-economic factors.
Post-compulsory vocational routes
Vocational education is offered in courses of full-time study in the Senior Cycle of Upper Secondary education and administered by the Department of Education and Science. Two of the three Senior Leaving Certificate Programmes are considered to have vocational elements, the Leaving Certificate Vocational Programme adds modules on Enterprise Education, Preparation for Work and Work Experience to a range of general subjects which must include a foreign language and gives access to tertiary level study (HE). The Leaving Certificate Applied Programme has more vocational elements and does not lead to HE entry. Neither of these two programmes is considered to be initial vocational training (CEDEFOP 2008 Ireland: Overview of the Vocational Education and Training System 04). Around one third of Irish 16 year olds studies for one of the two vocational Leaving Certificates; two thirds aim for the traditional academic Leaving Certificate.
Apprenticeship in Ireland frequently follows on from the Senior Cycle and a Senior Leaving Certificate and apprentices are not considered to be ‘in education’ as in the Dual System countries.
Governance and content
In 2008 some 23,000 young people were in apprenticeship in Ireland (30,000 in 2006); 11 apprentices for every 1000 employed persons. (OECD 2010 Learning for Jobs: Ireland Figure 1.3; Statistics Ireland www.cso.ie/statistics/empandunempilo.htm accessed 2/19/2010.
Apprenticeship is managed by the Ireland National Training and Employment Authority (FÁS) and its regional and local offices. The FÁS Board is appointed by the Minister for Enterprise, Trade and Employment. The Board comprises representatives from trade union, employer, social welfare, education and youth interests, together with representatives from other Government Departments and FÁS employee representatives. The Minister is also advised on training issues by the seven members of the National Training Advisory Committee which is composed of employer, trade union and education representatives.
However, a recent review (OECD 2010) found that employer involvement at FÁS regional and local levels is insufficient. While FÁS claimed lack of employer interest at local level employers felt that FÁS regional offices made arbitrary decisions on the funding of training (including apprenticeship) and were not sufficiently responsive to the range of needs in a region. Better accountability and transparency based on a range of relevant data and indicators was needed. Better data would increase employers’ trust in FÁS procedures (OECD 2010 p.36, 37).
Traditionally, craft apprenticeship in Ireland was time-served and achieving pre-determined standards of competence and knowledge was not mandatory. However, in 1991 a standards-based apprenticeship system was introduced which thereafter required a newly-qualified craft worker to have the National Craft Certificate as a compulsory requirement. Previously an apprentice underwent four to five years of training to achieve status as a qualified tradesperson, regardless of actual competency (O’Connor L and N Harvey 2001). In 1993 an Apprenticeship Act underpinned standards-based training for 14 (now 26) craft and technician occupations.
Apprenticeship training conforms to the same requirements for every occupation. All apprenticeships last for four years and comprise seven phases regardless of sector/occupation. Three of the phases are off- the-job and apprentices attend a FÁS Training Centre for the first phase and an Institute of Technology for the subsequent two phases over a total period of forty weeks. The remaining four phases are spent in the workplace. Employers are given a list of activities to be developed on the job and the employer certifies that these have been performed satisfactorily (CEDEFOP 2008 Ireland: Overview of the Vocational Education and Training System 04 and FÁS private communication).
Successful completion of all phases leads to a national award of an Advanced Certificate at Further Education and Training Awards Council (FETAC) Level 6. This qualification is considered equivalent to a Higher National Certificate in England and in the devolved administrations of the UK and can serve as an entry qualification to vocationally-specific
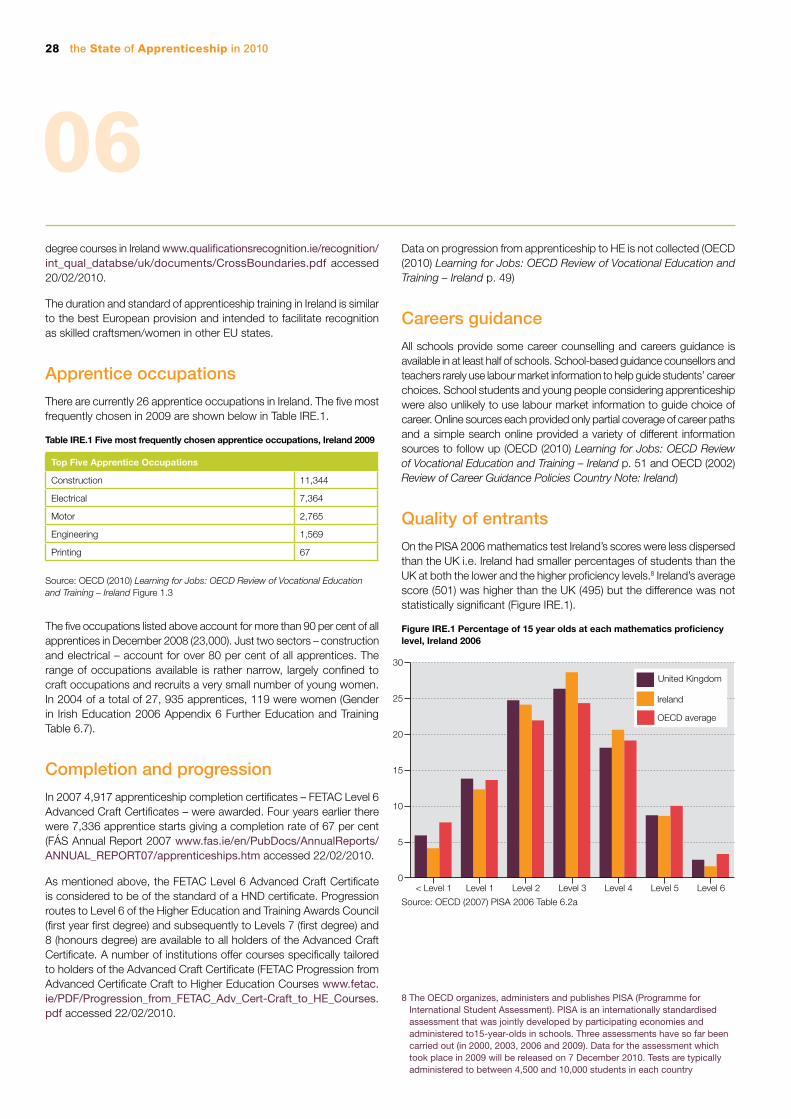
28 the State of Apprenticeship in 2010
0
5
10
15
20
25
30
Level 6Level 5Level 4Level 3Level 2Level 1< Level 1
OECD average
United Kingdom
Ireland
06degree courses in Ireland www.qualificationsrecognition.ie/recognition/int_qual_databse/uk/documents/CrossBoundaries.pdf accessed 20/02/2010.
The duration and standard of apprenticeship training in Ireland is similar to the best European provision and intended to facilitate recognition as skilled craftsmen/women in other EU states.
Apprentice occupations
There are currently 26 apprentice occupations in Ireland. The five most frequently chosen in 2009 are shown below in Table IRE.1.
Table IRE.1 Five most frequently chosen apprentice occupations, Ireland 2009
Top Five Apprentice Occupations
Construction 11,344
Electrical 7,364
Motor 2,765
Engineering 1,569
Printing 67
Source: OECD (2010) Learning for Jobs: OECD Review of Vocational Education and Training – Ireland Figure 1.3
The five occupations listed above account for more than 90 per cent of all apprentices in December 2008 (23,000). Just two sectors – construction and electrical – account for over 80 per cent of all apprentices. The range of occupations available is rather narrow, largely confined to craft occupations and recruits a very small number of young women. In 2004 of a total of 27, 935 apprentices, 119 were women (Gender in Irish Education 2006 Appendix 6 Further Education and Training Table 6.7).
Completion and progression
In 2007 4,917 apprenticeship completion certificates – FETAC Level 6 Advanced Craft Certificates – were awarded. Four years earlier there were 7,336 apprentice starts giving a completion rate of 67 per cent (FÁS Annual Report 2007 www.fas.ie/en/PubDocs/AnnualReports/ANNUAL_REPORT07/apprenticeships.htm accessed 22/02/2010.
As mentioned above, the FETAC Level 6 Advanced Craft Certificate is considered to be of the standard of a HND certificate. Progression routes to Level 6 of the Higher Education and Training Awards Council (first year first degree) and subsequently to Levels 7 (first degree) and 8 (honours degree) are available to all holders of the Advanced Craft Certificate. A number of institutions offer courses specifically tailored to holders of the Advanced Craft Certificate (FETAC Progression from Advanced Certificate Craft to Higher Education Courses www.fetac.ie/PDF/Progression_from_FETAC_Adv_Cert-Craft_to_HE_Courses.pdf accessed 22/02/2010.
Data on progression from apprenticeship to HE is not collected (OECD (2010) Learning for Jobs: OECD Review of Vocational Education and Training – Ireland p. 49)
Careers guidance
All schools provide some career counselling and careers guidance is available in at least half of schools. School-based guidance counsellors and teachers rarely use labour market information to help guide students’ career choices. School students and young people considering apprenticeship were also unlikely to use labour market information to guide choice of career. Online sources each provided only partial coverage of career paths and a simple search online provided a variety of different information sources to follow up (OECD (2010) Learning for Jobs: OECD Review of Vocational Education and Training – Ireland p. 51 and OECD (2002) Review of Career Guidance Policies Country Note: Ireland)
Quality of entrants
On the PISA 2006 mathematics test Ireland’s scores were less dispersed than the UK i.e. Ireland had smaller percentages of students than the UK at both the lower and the higher proficiency levels.8 Ireland’s average score (501) was higher than the UK (495) but the difference was not statistically significant (Figure IRE.1).
Figure IRE.1 Percentage of 15 year olds at each mathematics proficiency level, Ireland 2006
Source: OECD (2007) PISA 2006 Table 6.2a
8 The OECD organizes, administers and publishes PISA (Programme for International Student Assessment). PISA is an internationally standardised assessment that was jointly developed by participating economies and administered to15-year-olds in schools. Three assessments have so far been carried out (in 2000, 2003, 2006 and 2009). Data for the assessment which took place in 2009 will be released on 7 December 2010. Tests are typically administered to between 4,500 and 10,000 students in each country
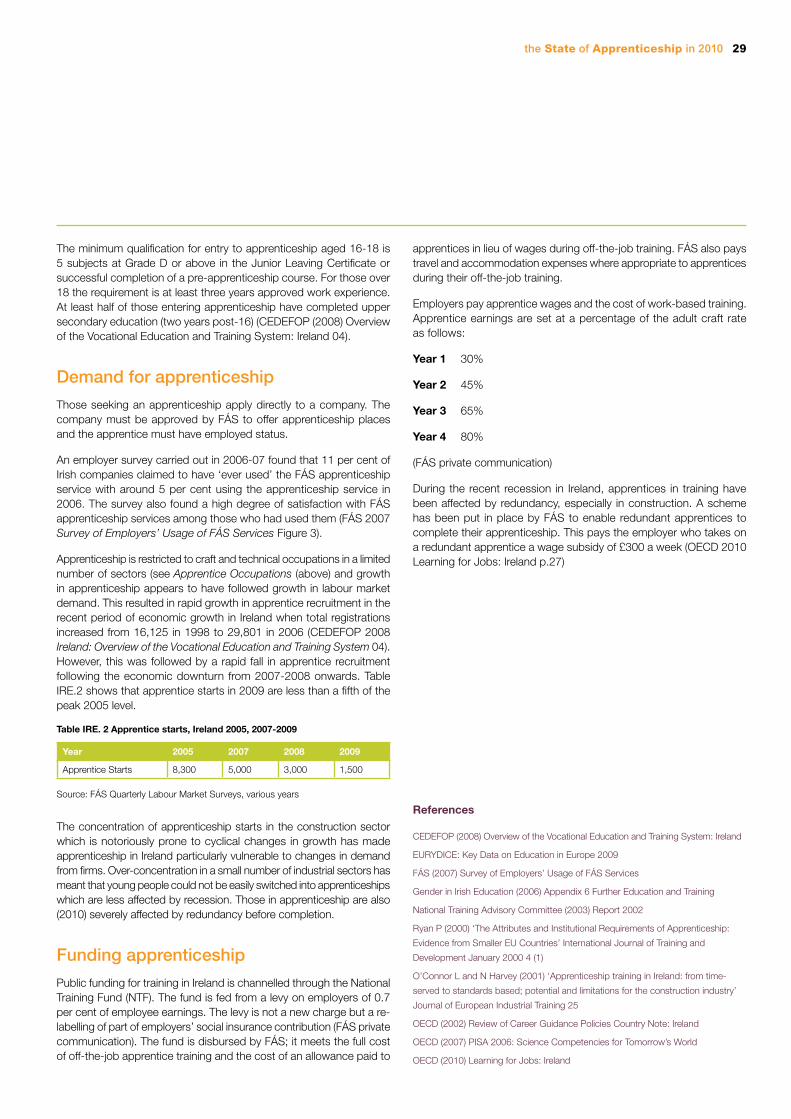
the State of Apprenticeship in 2010 29
The minimum qualification for entry to apprenticeship aged 16-18 is 5 subjects at Grade D or above in the Junior Leaving Certificate or successful completion of a pre-apprenticeship course. For those over 18 the requirement is at least three years approved work experience. At least half of those entering apprenticeship have completed upper secondary education (two years post-16) (CEDEFOP (2008) Overview of the Vocational Education and Training System: Ireland 04).
Demand for apprenticeship
Those seeking an apprenticeship apply directly to a company. The company must be approved by FÁS to offer apprenticeship places and the apprentice must have employed status.
An employer survey carried out in 2006-07 found that 11 per cent of Irish companies claimed to have ‘ever used’ the FÁS apprenticeship service with around 5 per cent using the apprenticeship service in 2006. The survey also found a high degree of satisfaction with FÁS apprenticeship services among those who had used them (FÁS 2007 Survey of Employers’ Usage of FÁS Services Figure 3).
Apprenticeship is restricted to craft and technical occupations in a limited number of sectors (see Apprentice Occupations (above) and growth in apprenticeship appears to have followed growth in labour market demand. This resulted in rapid growth in apprentice recruitment in the recent period of economic growth in Ireland when total registrations increased from 16,125 in 1998 to 29,801 in 2006 (CEDEFOP 2008 Ireland: Overview of the Vocational Education and Training System 04). However, this was followed by a rapid fall in apprentice recruitment following the economic downturn from 2007-2008 onwards. Table IRE.2 shows that apprentice starts in 2009 are less than a fifth of the peak 2005 level.
Table IRE. 2 Apprentice starts, Ireland 2005, 2007-2009
Year 2005 2007 2008 2009
Apprentice Starts 8,300 5,000 3,000 1,500 Source: FÁS Quarterly Labour Market Surveys, various years
The concentration of apprenticeship starts in the construction sector which is notoriously prone to cyclical changes in growth has made apprenticeship in Ireland particularly vulnerable to changes in demand from firms. Over-concentration in a small number of industrial sectors has meant that young people could not be easily switched into apprenticeships which are less affected by recession. Those in apprenticeship are also (2010) severely affected by redundancy before completion.
Funding apprenticeship
Public funding for training in Ireland is channelled through the National Training Fund (NTF). The fund is fed from a levy on employers of 0.7 per cent of employee earnings. The levy is not a new charge but a re-labelling of part of employers’ social insurance contribution (FÁS private communication). The fund is disbursed by FÁS; it meets the full cost of off-the-job apprentice training and the cost of an allowance paid to
apprentices in lieu of wages during off-the-job training. FÁS also pays travel and accommodation expenses where appropriate to apprentices during their off-the-job training.
Employers pay apprentice wages and the cost of work-based training. Apprentice earnings are set at a percentage of the adult craft rate as follows:
Year 1 30%
Year 2 45%
Year 3 65%
Year 4 80%
(FÁS private communication)
During the recent recession in Ireland, apprentices in training have been affected by redundancy, especially in construction. A scheme has been put in place by FÁS to enable redundant apprentices to complete their apprenticeship. This pays the employer who takes on a redundant apprentice a wage subsidy of £300 a week (OECD 2010 Learning for Jobs: Ireland p.27)
References
CEDEFOP (2008) Overview of the Vocational Education and Training System: Ireland
EURYDICE: Key Data on Education in Europe 2009
FÁS (2007) Survey of Employers’ Usage of FÁS Services
Gender in Irish Education (2006) Appendix 6 Further Education and Training
National Training Advisory Committee (2003) Report 2002
Ryan P (2000) ‘The Attributes and Institutional Requirements of Apprenticeship:
Evidence from Smaller EU Countries’ International Journal of Training and
Development January 2000 4 (1)
O’Connor L and N Harvey (2001) ‘Apprenticeship training in Ireland: from time-
served to standards based; potential and limitations for the construction industry’
Journal of European Industrial Training 25
OECD (2002) Review of Career Guidance Policies Country Note: Ireland
OECD (2007) PISA 2006: Science Competencies for Tomorrow’s World
OECD (2010) Learning for Jobs: Ireland
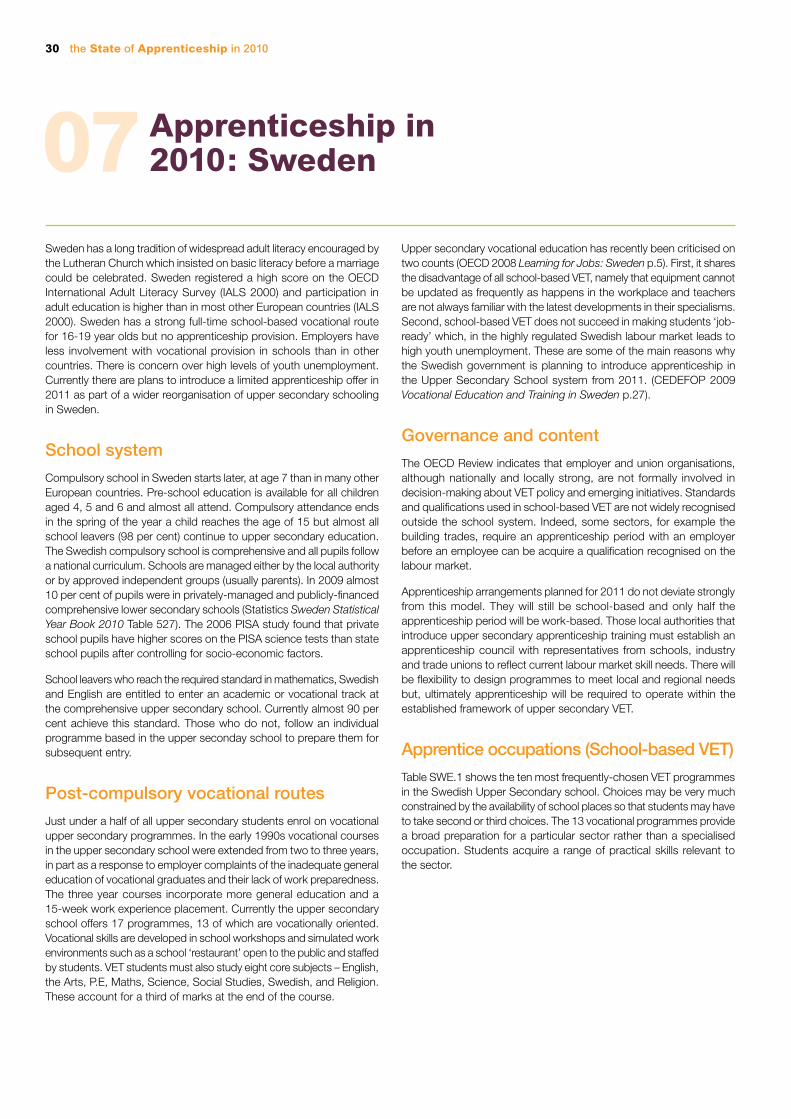
30 the State of Apprenticeship in 2010
Apprenticeship in 2010: Sweden07
Sweden has a long tradition of widespread adult literacy encouraged by the Lutheran Church which insisted on basic literacy before a marriage could be celebrated. Sweden registered a high score on the OECD International Adult Literacy Survey (IALS 2000) and participation in adult education is higher than in most other European countries (IALS 2000). Sweden has a strong full-time school-based vocational route for 16-19 year olds but no apprenticeship provision. Employers have less involvement with vocational provision in schools than in other countries. There is concern over high levels of youth unemployment. Currently there are plans to introduce a limited apprenticeship offer in 2011 as part of a wider reorganisation of upper secondary schooling in Sweden.
School system
Compulsory school in Sweden starts later, at age 7 than in many other European countries. Pre-school education is available for all children aged 4, 5 and 6 and almost all attend. Compulsory attendance ends in the spring of the year a child reaches the age of 15 but almost all school leavers (98 per cent) continue to upper secondary education. The Swedish compulsory school is comprehensive and all pupils follow a national curriculum. Schools are managed either by the local authority or by approved independent groups (usually parents). In 2009 almost 10 per cent of pupils were in privately-managed and publicly-financed comprehensive lower secondary schools (Statistics Sweden Statistical Year Book 2010 Table 527). The 2006 PISA study found that private school pupils have higher scores on the PISA science tests than state school pupils after controlling for socio-economic factors.
School leavers who reach the required standard in mathematics, Swedish and English are entitled to enter an academic or vocational track at the comprehensive upper secondary school. Currently almost 90 per cent achieve this standard. Those who do not, follow an individual programme based in the upper seconday school to prepare them for subsequent entry.
Post-compulsory vocational routes
Just under a half of all upper secondary students enrol on vocational upper secondary programmes. In the early 1990s vocational courses in the upper secondary school were extended from two to three years, in part as a response to employer complaints of the inadequate general education of vocational graduates and their lack of work preparedness. The three year courses incorporate more general education and a 15-week work experience placement. Currently the upper secondary school offers 17 programmes, 13 of which are vocationally oriented. Vocational skills are developed in school workshops and simulated work environments such as a school ‘restaurant’ open to the public and staffed by students. VET students must also study eight core subjects – English, the Arts, P.E, Maths, Science, Social Studies, Swedish, and Religion. These account for a third of marks at the end of the course.
Upper secondary vocational education has recently been criticised on two counts (OECD 2008 Learning for Jobs: Sweden p.5). First, it shares the disadvantage of all school-based VET, namely that equipment cannot be updated as frequently as happens in the workplace and teachers are not always familiar with the latest developments in their specialisms. Second, school-based VET does not succeed in making students ‘job-ready’ which, in the highly regulated Swedish labour market leads to high youth unemployment. These are some of the main reasons why the Swedish government is planning to introduce apprenticeship in the Upper Secondary School system from 2011. (CEDEFOP 2009 Vocational Education and Training in Sweden p.27).
Governance and content
The OECD Review indicates that employer and union organisations, although nationally and locally strong, are not formally involved in decision-making about VET policy and emerging initiatives. Standards and qualifications used in school-based VET are not widely recognised outside the school system. Indeed, some sectors, for example the building trades, require an apprenticeship period with an employer before an employee can be acquire a qualification recognised on the labour market.
Apprenticeship arrangements planned for 2011 do not deviate strongly from this model. They will still be school-based and only half the apprenticeship period will be work-based. Those local authorities that introduce upper secondary apprenticeship training must establish an apprenticeship council with representatives from schools, industry and trade unions to reflect current labour market skill needs. There will be flexibility to design programmes to meet local and regional needs but, ultimately apprenticeship will be required to operate within the established framework of upper secondary VET.
Apprentice occupations (School-based VET)
Table SWE.1 shows the ten most frequently-chosen VET programmes in the Swedish Upper Secondary school. Choices may be very much constrained by the availability of school places so that students may have to take second or third choices. The 13 vocational programmes provide a broad preparation for a particular sector rather than a specialised occupation. Students acquire a range of practical skills relevant to the sector.
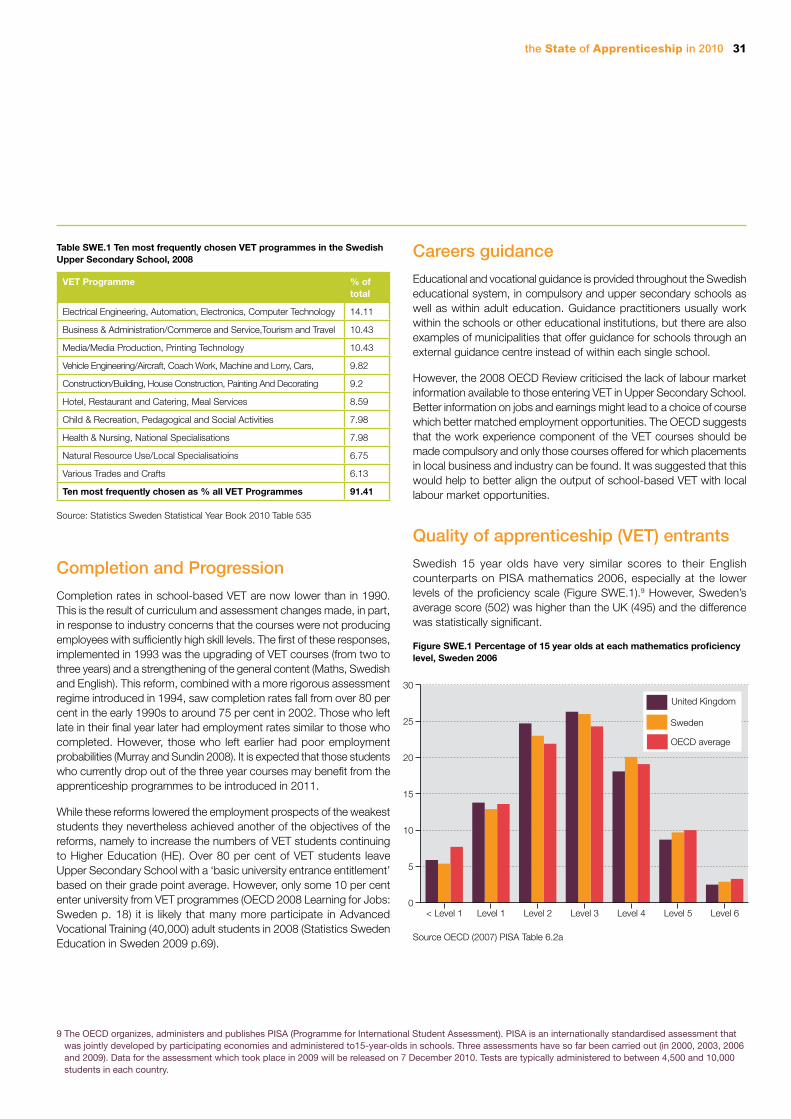
the State of Apprenticeship in 2010 31
0
5
10
15
20
25
30
Level 6Level 5Level 4Level 3Level 2Level 1< Level 1
OECD average
United Kingdom
Sweden
Table SWE.1 Ten most frequently chosen VET programmes in the Swedish Upper Secondary School, 2008
VET Programme % of total
Electrical Engineering, Automation, Electronics, Computer Technology 14.11
Business & Administration/Commerce and Service,Tourism and Travel 10.43
Media/Media Production, Printing Technology 10.43
Vehicle Engineering/Aircraft, Coach Work, Machine and Lorry, Cars, 9.82
Construction/Building, House Construction, Painting And Decorating 9.2
Hotel, Restaurant and Catering, Meal Services 8.59
Child & Recreation, Pedagogical and Social Activities 7.98
Health & Nursing, National Specialisations 7.98
Natural Resource Use/Local Specialisatioins 6.75
Various Trades and Crafts 6.13
Ten most frequently chosen as % all VET Programmes 91.41
Source: Statistics Sweden Statistical Year Book 2010 Table 535
Completion and Progression
Completion rates in school-based VET are now lower than in 1990. This is the result of curriculum and assessment changes made, in part, in response to industry concerns that the courses were not producing employees with sufficiently high skill levels. The first of these responses, implemented in 1993 was the upgrading of VET courses (from two to three years) and a strengthening of the general content (Maths, Swedish and English). This reform, combined with a more rigorous assessment regime introduced in 1994, saw completion rates fall from over 80 per cent in the early 1990s to around 75 per cent in 2002. Those who left late in their final year later had employment rates similar to those who completed. However, those who left earlier had poor employment probabilities (Murray and Sundin 2008). It is expected that those students who currently drop out of the three year courses may benefit from the apprenticeship programmes to be introduced in 2011.
While these reforms lowered the employment prospects of the weakest students they nevertheless achieved another of the objectives of the reforms, namely to increase the numbers of VET students continuing to Higher Education (HE). Over 80 per cent of VET students leave Upper Secondary School with a ‘basic university entrance entitlement’ based on their grade point average. However, only some 10 per cent enter university from VET programmes (OECD 2008 Learning for Jobs: Sweden p. 18) it is likely that many more participate in Advanced Vocational Training (40,000) adult students in 2008 (Statistics Sweden Education in Sweden 2009 p.69).
Careers guidance
Educational and vocational guidance is provided throughout the Swedish educational system, in compulsory and upper secondary schools as well as within adult education. Guidance practitioners usually work within the schools or other educational institutions, but there are also examples of municipalities that offer guidance for schools through an external guidance centre instead of within each single school.
However, the 2008 OECD Review criticised the lack of labour market information available to those entering VET in Upper Secondary School. Better information on jobs and earnings might lead to a choice of course which better matched employment opportunities. The OECD suggests that the work experience component of the VET courses should be made compulsory and only those courses offered for which placements in local business and industry can be found. It was suggested that this would help to better align the output of school-based VET with local labour market opportunities.
Quality of apprenticeship (VET) entrants
Swedish 15 year olds have very similar scores to their English counterparts on PISA mathematics 2006, especially at the lower levels of the proficiency scale (Figure SWE.1).9 However, Sweden’s average score (502) was higher than the UK (495) and the difference was statistically significant.
Figure SWE.1 Percentage of 15 year olds at each mathematics proficiency level, Sweden 2006
Source OECD (2007) PISA Table 6.2a
9 The OECD organizes, administers and publishes PISA (Programme for International Student Assessment). PISA is an internationally standardised assessment that was jointly developed by participating economies and administered to15-year-olds in schools. Three assessments have so far been carried out (in 2000, 2003, 2006 and 2009). Data for the assessment which took place in 2009 will be released on 7 December 2010. Tests are typically administered to between 4,500 and 10,000 students in each country.
32 the State of Apprenticeship in 2010
07Demand for apprentices
Youth unemployment in Sweden is high relative to adult unemployment. In 2008 almost a fifth (19.4 per cent) of 15-24 year olds were unemployed compared to a rate of just 6 per cent for the labour force as a whole. www.oecd.org/document/58/0,3343,en_2649_39023495_43219002_1_1_1_1,00.html
Leavers from school VET, in particular early leavers, have difficulty in finding a first job. Earnings differentials are compressed and heavily regulated by collective bargaining and wage structures do not normally allow for young people to be paid a training wage/lower wage on entering first employment. Employment protection is also very strong so that employing a young person entails relatively high costs and risks. For these reasons and as a result of cultural and historical factors, apprenticeship does not form part of education and training provision for young people in Sweden (Olofsson 2005). In the past, only a handful of large engineering firms have managed to satisfy the local authorities’ requirements for the education of 16-19 year olds and combine these requirements with periods of practical work on firms’ premises. In recent years demand has grown for apprenticeship to be an option available to 16-19 year olds and this is endorsed in the OECD 2008 Report; arguments in favour (OECD 2008) point out that
• apprenticeships allow students to learn on more up to date equipment than is available in schools,
• apprenticeships will enable employers to signal labour market requirements and provide young people with information on local labour markets
• on-the-job training has been shown to promote more effective learning of some skills than school-based learning
• apprentices undertake productive work and increase economic output
• apprenticeship allows employers to cut recruitment and initial training costs if the apprentice is subsequently taken on as a full-time employee
The Swedish government has announced that the renewed upper secondary school system from 2011 will include an apprenticeship programme. Pilots were launched in 2008.
Funding apprenticeship
Upper Secondary Education is entirely financed from public funds. Currently upper secondary students receive an Education Maintenance Allowance and it is not clear whether those on the apprenticeship programme will receive a wage (CEDEFOP 2009 Vocational Education and Training in Sweden p.28). Employers that hire and supervise apprentices will receive approximately £2,500 a year to cover the cost of employing and supervising the apprentice. In addition, the Swedish government has set aside a budget to cover the cost of training apprentice supervisors.
Acknowledgements
Valuable help and advice was received from Dr. Erika Ekström, Ministry of Education, Sweden; Dr Åsa Murray, LHS, University of Stockholm; and Dr. Jonas Olofsson. University of Lund. All errors are, of course, my own.
References
CEDEFOP (2009) Vocational Education and Training in Sweden
Murray A and S Sundin (2008) ‘Student flows and employment opportunities
before and after implementation of a third year in vocational programmes at upper
secondary school’ in European Journal of Vocational Training No. 44 2008/2
OECD (2000) Literacy in the Information Age: Final Report of the International Adult
Literacy Survey
OECD (2007) PISA 2006: Science Competencies for Tomorrow’s World
OECD (2008) Learning for Jobs: OECD Reviews of Vocational Education and Training
– Sweden
Olofsson J (2005) Stability or Change in the Swedish Labour Market Regime?
Institute for Futures Studies, Stockholm
Statistics Sweden Education in Sweden 2009
Statistics Sweden Statistical Year Book 2010
the State of Apprenticeship in 2010 33
Apprenticeship in 2010: Switzerland08
Switzerland is of particular interest for a study of apprenticeship. It is the only European apprenticeship country where there is reliable evidence showing that, on average, apprenticeship firms incur no net costs as a result of taking on apprentices. Employer involvement in planning and provision is very high. An in-school programme and out of school centres provide careers advice and guidance on apprenticeship. Two-thirds of school leavers start an apprenticeship aged 15-19 but some must wait a year or more for a place. Completion rates are high and progression to university-level courses is possible after further study.
School system
The age at which children start primary school varies by Local Authority (Canton); 6 is the normal starting age. Compulsory schooling lasts for 9 years but this will increase to 11 years, starting at kindergarten age 4 within the next five years. Secondary education begins at ages 10-11 and there are different types of secondary school. Some provide a more practical education, preparing children for apprenticeships; others aim to broaden pupils’ general culture, to enable them to continue with their studies at the next level. The structure of education at this level and the names of the different types of school vary from Canton to Canton. State-run schools enjoy a good reputation and are attended by 95 per cent of all children. In the PISA 2006 student science tests, state schools scored higher than private schools after controlling for socio-economic factors.
Ninety per cent of those leaving compulsory school gain the appropriate certificate; just under 80 per cent gain either a basic school-leaving certificate or a commercial certificate. Around a fifth gain an academic school leaving certificate at age 18 or 19 giving direct access to a university honours course.
Post-compulsory vocational routes
Following the end of compulsory school at age 15/16 roughly two thirds of a cohort continues to vocational education, of these, four fifths enter apprenticeship and the remaining fifth enters full-time vocational school.
Cohort size dipped sharply from 100,000 to 80,000 between 1985 and 1995. Since then it has risen slightly to 85,000 in 2008. During the period 1985 to 2008 proportions of school leavers on the post-compulsory vocational (apprenticeship) and academic routes have remained remarkably stable.
Governance and content
In 2008 197,000 young people were in three or four year apprenticeship in Switzerland; 43 apprentices for every 1000 employed persons (BFS 2009 15 Statistik der beruflichen Grundbildung 2008 p. 3.) The account below is based on the German-speaking Cantons which make up two-thirds of the country. Some variation on the system described here is found in the French and Italian-speaking Cantons.
Two thirds of all apprenticeships are of three year duration and the remainder is of four year duration. Apprenticeships of two year duration are being phased out. A new two year work-based qualification is now being introduced which provides a less demanding level of skill than apprenticeship for those who cannot meet the demands of three and four year courses. The dual (sometimes called ‘threeal’) system followed in Switzerland means that apprentices learn in two and sometimes three locations – the vocational school, off-the-job occupational training centres and the work place. Apprentices attend the vocational school for a minimum of one or one and a half days a week for theoretical grounding and some general education. In some occupations apprentices attend courses designed and funded by employers’ organisations in off-the-job occupational training centres. In the work place apprentices acquire the occupational competences laid down in the training regulations. (BFS 2009 15 Statistik der beruflichen Grundbildung 2008 p.4)
The individual firm signs an apprentice agreement and designates an employee responsible for the on the job training of the apprentice. During the three or four year apprenticeship the in-firm trainer ensures that the training programme is covered and the required skills are achieved. This is recorded in detail by the apprentice in a log book which is taken into account by examiners in the final examination. The firm is not required to participate in the assessment or certification process.
Employers are involved in decision-making on apprenticeship at every level. Professional (sector) organisations are financed by employers on a voluntary basis. At the Federal level professional organisations and employer organisations together with Federal, regional and employee representatives decide on the legal basis of each apprenticeship including the outline occupational competences. A Commission for Quality and Development with similar membership adapts training regulations in line with changing labour market requirements (OECD 2009 Learning for Jobs: Switzerland p.12). Table SWI.1 below provides a rough quantification of Swiss employers’ role in the management of apprenticeship.
34 the State of Apprenticeship in 2010
08
Table SWI.1 shows that Swiss employer, employee and professional organisations have a decision-making role in every aspect of apprenticeship except for accreditation.
Apprentice occupations
Apprentice places are offered in some 250 different occupations. The 10 most popular apprentice occupations are shown below. Hairdressing, Health and Care are almost exclusively female occupations while Engineering, Joiner and Vehicle Maintenance are almost exclusively male occupations. Almost all those starting an apprenticeship are aged between 15 and 19.
Table SWI.2 Ten most frequently chosen apprentice occupations, Switzerland, 2009
Apprentice starts 2006 as % all starts
1 Office administration (Kauffrau/-mann) 15.4
2 Retail sales (Detailhandelsfachfrau/-mann) 8.3
3 Electrical installation (Elektromonteur/in) 3.3
4 Cook (Koch/Köchin) 3.1
5 Health Occupations (Fachangestellte/r Gesundheit) 3.0
6 Engineering (Polymechaniker/in) 2.8
7 Hairdressing (Coiffeur/Coiffeuse) 2.7
8 Childcare/Care Occupations (Fachfrau/-mann
Betreuung)
2.3
9 Joiner (Schreiner/in) 2.2
10 Vehicle maintenance (Automechaniker/in) 2.2
www.dbk.ch/sbbk/berufsbildung/bbch/8_d20hgl2003.htm accessed 9/02/2010.
In total, the ten most frequently chosen occupations constitute 45 per cent of all occupations chosen.
Completion and Progression
The pass rate for the final apprenticeship examinations was 91 per cent in 2008. A rough calculation (passes/entrants) gives a completion rate of 79 per cent (BFS 2009 15 Statistik der beruflichen Grundbildung 2008 p. 4).
From 1994 onwards, some apprenticeships give access to a university entrance qualification, the Professional Baccalaureate (Berufsmaturität). This qualification is open only to those following the apprenticeship route and requires additional study and a written examination. The additional study can be followed either concurrently or subsequent to apprenticeship. In 2008 54,845 (just under two thirds of a cohort) gained a Federal Apprenticeship Certificate of whom 31,334 were men and 23,511 women. In the same year 10,883 apprentices (20 per cent) were awarded a Professional Baccalaureate in one of six specialist areas. A pass confers the right to study for a degree at a Technical University within the area of specialisation of the Professional Baccalaureate obtained.
Careers guidance
Careers guidance to help young people make an occupational choice begins in the 6th year of schooling when children are 12 years old and is the responsibility of school teaching staff throughout the period of compulsory school. In the 6th year children learn about the businesses and economic life of the area in which they live. In the following year they find out and discuss at school the jobs that their parents do and how their parents came to choose their occupation. This is followed in the 8th year by visits to careers centres, consultation with parents and learning about sources of information. Taster sessions in firms offering apprentice places are available for students in this and in the final (9th) year of compulsory school. In the 9th year there are aptitude tests, further opportunities for taster sessions, learning how to respond to newspaper advertisements and to write letters of application for apprenticeships together with other activities to help the student arrive at an occupational choice and to find an appropriate apprenticeship place. Support continues, provided by the Guidance Office of the relevant Canton once the young person has left school. An internet -based matching service is available at the level of the Canton. Young people are free to seek places outside their Canton by using other cantonal matching services. [Based on information from Aargau Canton, 575,000 inhabitants]
Table SWI. 1 Estimated percentage of apprenticeship administration and management in which professional organisations have advisory or decision-making role
Curricula Practical Training Content
Number of students in appr/ship
Places in practical training
Acquired competencies
Examination requirements
Delivered qualifications
Accreditation
D A D A D A D A D A D A D A D A
100 0 100 0 100 0 100 0 100 0 100 0 100 0 0 0
D = decision-making role, A = advisory role
Source: OECD 2009 Learning for Jobs: Switzerland Annex B Table B.2
the State of Apprenticeship in 2010 35
0
5
10
15
20
25
30
Level 6Level 5Level 4Level 3Level 2Level 1< Level 1
OECD average
United Kingdom
Switzerland
Quality of entrants
Young people seeking apprenticeship in Switzerland include a proportion – perhaps a third – who in England would choose an A-level and university route to a career. Firms offering apprenticeships benefit in part from the higher proportions with above average school achievements and in part from the higher standards in Swiss schools of basic subjects, for example, mathematics. Switzerland’s average score (530) on the PISA 2006 mathematics test was substantially higher than the UK (495) and the difference is statistically significant.10 Figure SWI.1, taken from PISA 2006, shows that 15 year olds in Switzerland have better mathematics achievements at every level than their English counterparts. Good standards in basic subjects and a broader range of abilities in those seeking apprenticeship help to bring down costs of training for firms.
Figure SWI.1 Percentage of 15 year olds at each mathematics proficiency level, Switzerland 2006
Source: OECD (2007) PISA Table 6.2a
In 2005 apprentices constituted 5.6 per cent of all employment; in apprentice training firms apprentices constituted on average a quarter of all employees (including apprentices). At least three quarters of firms with more than 250 employees employed apprentices in 2005 and the proportion rose to 85 per cent for firms with over 1,000 employees. Around one quarter of small firms with less than 20 but more than 3 employees employed apprentices.
The latest information (Lehrstellenmarkt – Funktion, Massnahmen, Zahlen 2009) on the supply of and demand for apprentices, expects only a small shortfall of apprentice places relative to the supply of young people.
Funding apprenticeship
Swiss firms do not receive a direct subsidy for taking an apprentice but the costs of the required off-the-job training in the Vocational College – one or one and a half days a week- is met out of a mix of Federal and Cantonal funds. Trade and professional associations funded by the whole sector develop training plans, support training firms and bear the cost of assessment. Some Federal funds are available to set up Group Training Facilities for groups of small firms that cannot meet all the training requirements of an apprenticeship within their organisation.
An important reason for the relatively high level of demand for apprentices in Switzerland is the way in which Swiss firms achieve a balance of training and productive work over the three or four year duration of the apprenticeships. This means that, on average, firms cover their training costs within the period of apprenticeship and, on average, manage to make a small profit.
Apprentice wages are an important component of apprentice costs for firms and these are negotiated at firm/establishment level. Gross apprentice earnings are shown in Table SWI.3. The male apprentice wage is less than a fifth of the wage of a skilled blue collar worker. These apprentice wages are substantially lower than the average in England but it should be recalled that Swiss apprentices are normally school leavers aged 15 or 16, considerably younger than their English counterparts and more likely to be living at home with parents.
Table SWI. 3 Average gross apprentice earnings, full-time, full year, Switzerland 2009
Male Female
£ 6,953 6,414
Source: Swiss Statistics Office Bruttoerwerbseinkommen pro Jahr der Erwerstätigen nach Erwerbsstatus, Berufsgruppen, Beschäftigungsgrad und Geschlecht 2nd Quarter 2009
10 The OECD organizes, administers and publishes PISA (Programme for International Student Assessment). PISA is an internationally standardised assessment that was jointly developed by participating economies and administered to15-year-olds in schools. Three assessments have so far been carried out (in 2000, 2003, 2006 and 2009). Data for the assessment which took place in 2009 will be released on 7 December 2010. Tests are typically administered to between 4,500 and 10,000 students in each country
Demand for apprenticeship
Taking as denominator all Swiss businesses (establishment level), 17.8 per cent took one or more apprentices in 2005. Excluding those firms not suited to offering apprenticeships, just under a third of all Swiss businesses offered apprenticeships in that year. This proportion has risen slightly since 1995 but apprentice vacancies have not been sufficient to provide places for all those seeking one. Some young people must wait for a year or sometimes longer to access a place (Meyer 2009).

36 the State of Apprenticeship in 2010
08References
Bertelsmann Stiftung (2008) Steuerung der beruflichen Bildung im internationalen
Vergleich
Bundesamt für Berufsbildung und Technologie (2009) Lehrstellenmarkt – Funktion,
Massnahmen, Zahlen
Bundesamt für Statistik (2008) Die Ausbildungsbereitschaft der Betriebe:
Entwicklungen 1995-2005
Bundesamt für Berufsbildung und Technologie (2009) Handbuch Verordnungen:
Schritt für Schritt zu einer Verordnung über die berufliche Grundbildung
Bundesamt für Statistik (2009) Statistik der beruflichen Grundbildung 2008
Bundesamt für Berufsbildung und Technologie (2006) Vocational Education and
Training in Switzerland 2006: Facts and Figures
Kurzinfo der Berufs-und Laufbahnberatung Aargau (2009) Berufswahl Zeitplan
Bundesamt für Statistik (2009) Bildungsabschlüsse 2008: Sekundarstufe II und
Tertiärstufe
Meyer T. (2009) `Can vocationalisation go too far? The case of Switzerland’ European
Journal of Vocational Training 2009/1 CEDEFOP
OECD (2007) PISA 2006 Science Competencies for Tomorrow’s World
OECD (2009) Learning for Jobs: OECD Reviews of Vocational Education and
Training: Switzerland

Design: LSE Design Unit (www.lse.ac.uk/designunit)
The London School of Economics and Political Science is a School of the University of London. It is a charity and is incorporated in England as a company limited by guarantee under the Companies Acts (Reg No 70527).
This information can be made available in alternative formats, on request. Please contact: Helen Durrantemail: [email protected]
D the State of Apprenticeship in 2010
01
Apprenticeship Ambassadors Network2 Queen Anne’s Gate BuildingsDartmouth StreetWestminsterLondon SW1H 9BP
Centre for Economic PerformanceThe London School of Economics and Political ScienceHoughton Street London, WC2A 2AE
AMBASSADORS NETWORK
This publication can be downloaded free of charge at www.employersforapprentices.gov.uk/docs/research/Research_1_604.pdf or http://cep.lse.ac.uk/pubs/download/special/cepsp22.pdf