The Spanish Labor Market in a Cross-Country Perspective; by ...
52
WP/11/11 The Spanish Labor Market in a Cross-Country Perspective Florence Jaumotte
Transcript of The Spanish Labor Market in a Cross-Country Perspective; by ...

WP/11/11
The Spanish Labor Market in a Cross-Country Perspective
Florence Jaumotte

© 2011 International Monetary Fund WP/11/11 IMF Working Paper European Department
The Spanish Labor Market in a Cross-Country Perspective
Prepared by Florence Jaumotte1
Authorized for distribution by James Daniel
January 2011
Abstract
This Working Paper should not be reported as representing the views of the IMF. The views expressed in this Working Paper are those of the author(s) and do not necessarily represent those of the IMF or IMF policy. Working Papers describe research in progress by the author(s) and are published to elicit comments and to further debate.
The Spanish labor market is not working: the unemployment rate is structurally very high; wages are not very responsive to labor market conditions, causing a high cyclicality of unemployment; and the labor market is highly dual. Compared with the EU15, Spanish labor market institutions and policies stand out by the structure of its collective bargaining, which occurs mostly at an intermediate level, and by very high severance payments for permanent workers. Based on a quantitative analysis, the paper shows that moving away from the intermediate level of bargaining would go a long way toward bringing the unemployment rate closer to the EU15 average. The key reform needed to reduce the share of temporary workers is reducing employment protection of permanent workers. Substantially reforming the collective bargaining system and reducing the protection of permanent workers are likely to be highly complementary to secure a substantial reduction in the unemployment rate. The recent 2010 labor market reform attempts to address these issues, although its effects are still to materialize. JEL Classification Numbers: E24, J5, J65 Keywords: Unemployment, Employment, Wages, Collective Bargaining, Severance Pay,
Unemployment Insurance, Spain Author’s E-Mail Address: [email protected] 1 The author is grateful to Andrea Bassanini and Romain Duval for providing some of the data and programs and to Marialuz Moreno-Badía for early discussions and help in tracking the history of labor market reform in Spain. The author also acknowledges helpful comments from Céline Allard, Ravi Balakrishnan, Helge Berger, Olivier Blanchard, James Daniel, Angel Estrada, Prakash Kannan, Stefano Scarpetta, and attendants at a conference “High-Level Seminar on Labour Market Experiences: Towards More Efficient Labour Markets” held at the Bank of Spain on May 11, 2010.

2
Contents Page I. Introduction ............................................................................................................................3 II. The Spanish Labor Market is Not Working ..........................................................................4 III. How Different Are Spain’s Labor Market Institutions and Policies? ..................................6 IV. Determinants of the Unemployment Rate .........................................................................12 V. Determinants of the Share of Temporary Workers .............................................................15 VI. Complementarity of Reforms ............................................................................................18 VII. Conclusions ......................................................................................................................19 Appendix Definition and Sources of Policy and Institutional Indicators .................................................21 References ................................................................................................................................24 Figures 1. Spain and EU15: Unemployment, Employment, and Labor Force Participation ................26 2. Spain and Comparators: Impact of the Global Crisis on the Labor Market ........................27 3. Spain and EU15: Incidence of Temporary and Part-Time Work ........................................28 4. Spain and EU15: Wage Dynamics .......................................................................................29 5. Spain and EU15: Wage Bargaining Systems .......................................................................30 6. Spain and EU15: Employment Protection Legislation ........................................................31 7. Spain and EU15: Unemployment Benefit Replacement Rates ............................................32 8. Spain and EU15: Tax Wedge ...............................................................................................33 9. Spain and EU15: Spending on Active Labor Market Policies (ALMP) ..............................34 10. Spain and EU15: Product Market Regulation ....................................................................35 11. Spain: Explaining the Unemployment Rate .......................................................................36 12. OECD Sample: Partial Correlations for the Unemployment Rate Regressions ................37 13. EU15 Comparators: Strong declines in Unemployment Rate and Reforms ......................39 14. Spain: Explaining the Share of Temporary Workers .........................................................39 15. OECD Sample: Partial Correlations for the Share of Temporary Workers Regressions ..40 16. EU15 Comparators: Rising Share of Temporary Workers ................................................41 17. EU15: Correlation Unemployment Rate, Temporary Work, and Part-Time work, 2008 ..42
Tables 1. Spain and Comparators: Employment Elasticities to Output ..............................................43 2. Spain: Extent of Wage Indexation .......................................................................................43 3. Spain: Severance Payments for Fair and Unfair Dismissals ................................................43 4. Spain: Labor Market Reforms .............................................................................................44 5. Unemployment Rate: Regression Results and Robustness, 1982–2007 ..............................45 6. Unemployment Rate: Bilateral Regressions, 1982–2007 ....................................................46 7. Spain: Policy Simulations for the Unemployment Rate ......................................................47 8. Spain and Comparator EU15 Countries: Policy Mixes, 1982–2007 ...................................47 9. Share of Temporary Workers: Regression Results, 1982–2007 ..........................................48 10. Share of Temporary Workers: Robustness of Regression Results, 1982–2007 ................49 11. Share of Temporary Workers: Bilateral Regressions, 1982–2007 ....................................50 12. Spain: Policy Simulations for the Share of Temporary Workers ......................................51 13. Spain and Comparator EU15 Countries: Policy Mixes, 1982–2007 .................................51

3
I. INTRODUCTION
For most of the last thirty years, the Spanish unemployment rate has been very high and cyclical. Spain entered the European Monetary Union in 1994 with the highest unemployment rate at 24 percent. In the strong growth period that followed, the unemployment rate declined substantially to reach 8 percent in 2007, yet still high in comparison with other euro area countries. However, this did not really reflect a structural improvement. As the domestic economic cycle turned and the global financial crisis struck starting in 2008, unemployment soared back to 20 percent. A related and problematic feature of the Spanish labor market is its high duality, with about thirty percent of workers in temporary (fixed-term) contracts. The recent developments suggest that, before the 2010 labor market reform, not much had changed in the Spanish labor market in the last three decades and leads us to reexamine, in a cross-country and long-run perspective, what makes the Spanish labor market so different and dysfunctional.2 Specifically, the paper attempts to shed light on three questions: (i) What Spanish labor market institutions and policies are most different from those of the EU15?3 (ii) Do these explain the high underlying unemployment rate and share of temporary workers? (iii) What reforms could cut both the unemployment rate and the share of temporary workers and what lessons can we draw from other reformers in the EU15? The findings of the paper can be summarized as follows: Spain stands out by the structure of its collective bargaining, which takes place at the
intermediate level and greatly constrains wage flexibility, and by the very high severance payments for permanent workers, which accentuate the insider-outsider problem.
The unemployment rate could be substantially reduced by effectively decentralizing collective bargaining, thereby reducing excessive wage demands and allowing more wage flexibility. Reducing unemployment benefits and lowering the tax wedge would also help reduce unemployment by lowering the cost of labor. Finally, deregulating product markets reduces unemployment including by boosting activity and labor demand.
Reducing the share of temporary workers could be achieved by lowering the very high employment protection of permanent workers and to a lesser extent by
2 The recent surge in the Spanish unemployment rate during the 2008-2009 crisis has been examined in detail in IMF (2010) and Bentolila et al. (2010).
3 The EU15 includes Austria, Belgium, Denmark, Finland, France, Germany, Greece, Ireland, Italy, Luxembourg, the Netherlands, Portugal, Spain, Sweden, and the United Kingdom.

4
restricting the regulation of temporary contracts. For the same reasons as above, lowering unemployment benefits and the tax wedge would also help reduce the duality of the labor market. In contrast, product market deregulation tends to increase the share of temporary workers (including by increasing competition and the need for firms to be able to adjust quickly) and should be combined with offsetting measures.
Overall, there does not appear to be a trade-off between reducing the unemployment rate and curbing the share of temporary workers. In fact, the decentralization of collective bargaining and the reduction of the protection of permanent workers probably need to be enacted jointly to effectively reduce the unemployment rate.
Finally, a higher share of part-time workers is positively associated with lower unemployment, suggesting that raising the share of part-time workers from its currently low level could be associated with substantial benefits in terms of lower unemployment.
Section II discusses the problems of the Spanish labor market, comparing its performance with that of EU15 countries. Section III reviews Spanish labor market institutions and policies in a cross-country perspective, highlighting differences from comparators. Section IV and V relate the behavior of respectively the unemployment rate and the share of temporary workers to these institutions and policies. Section VI discusses whether various reforms are complementary or involve a trade-off and Section VII concludes.
II. THE SPANISH LABOR MARKET IS NOT WORKING
The Spanish labor market stands out along many dimensions, including:
High unemployment. Spain’s unemployment rate has averaged 16.2 percent since 1980 and has been the highest unemployment rate among the EU15 for most of the period (Figure 1). During the boom years, the unemployment rate, and its divergence from the EU15’s, reduced substantially thanks to strong employment creation (and despite strong labor force and wage growth), but even then it was still above 8 percent. With the crisis, the differential has widened substantially again, despite a similar output fall to other countries. With wages and average working hours increasing, the output fall was reflected in strong employment declines. The unemployment rate is back at 20 percent, double the EU15 average and the highest in the EU15. The sharp rebound of the unemployment rate seems to suggest that the underlying “equilibrium” unemployment rate has not declined substantially over the period. The incidence of unemployment is especially high for youth. Labor force participation is in line with euro-area average but employment rates are relatively low, reflecting the high unemployment rate.

5
High cyclicality of employment and unemployment. The unemployment rate is showing much larger oscillations than in other countries. Output elasticities of employment are larger than for other EU15 countries (Table 1). This is partly the result of a high degree of wage rigidity (see below). Hence, when faced with a strong negative demand shock, firms adjust by dismissing workers or going out of business rather than reducing wages or working time, as has happened in the recent crisis (Figure 2). In contrast, when output picks up, employment rebounds and the unemployment rate reduces substantially.
High share of temporary contracts, but few part-time contracts.4 The Spanish labor market is highly dual, with about 30 percent of the labor force in temporary contracts (Figure 3). This is the highest level in the EU15 (since the mid-1980s) and about double the EU15 average. Like in the rest of the EU15, the incidence of temporary contracts is highest for youth and women. The high share of temporary contracts reflects both a higher incidence of temporary workers (than EU15 countries) in each sector, especially in construction, agriculture and household work, and a higher share of sectors that are prone to have temporary workers (households, construction and tourism). The share of temporary workers rose strongly in the mid-1980s, when the use of fixed term contracts was liberalized, and has been roughly constant since then.5 It went down somewhat in the recent crisis as employment destruction fell disproportionately on temporary workers. In contrast, the share of part-time contracts (another type of flexible contract) has remained very low in Spain.
High degree of wage rigidity. Wages and labor costs have been growing faster than in most other EU15 countries, but also much faster than labor productivity growth, leading to widening unit labor cost differentials during most of the 2000’s (though this was reversed during the recent crisis due to strong productivity growth as labor was shed in Spain) (Figure 4). Moreover, real wages have not responded much to the conditions of the labor market and have even behaved counter-cyclically, amplifying oscillations of employment (see Bank of Spain, 2009).
The high unemployment rate carries very high individual and social costs. Reducing the share of temporary workers is essential to promote fairness and social cohesion (Dao and Loungani, 2010).6 These labor market deficiencies also produce large macroeconomic costs. The high unemployment rate is causing fiscal costs, directly by keeping unemployment
4 Temporary contracts (or workers) refer to both fixed term contracts (workers) and temporary agency work contracts (workers).
5 This suggests that since then employment growth has been similar in permanent and temporary contracts.
6 Most temporary workers are involuntarily on temporary contracts. In addition to the cost of being in precarious contracts, temporary workers are also usually entitled to less unemployment benefits due to shorter and interrupted work history (see Bank of Spain, 2009).

6
benefits and employment subsidies high, and indirectly through lower tax collection. It is also putting pressure on the financial sector through personal defaults and corporate bankruptcies (unemployment and non-performing loans are highly correlated). The high cyclicality of employment can lead to strong hysteresis when the downturn is more protracted, as the high unemployment rate and number of bankruptcies reduce skills, the labor force, and productive capacity. The large pool of temporary workers (easily dismissable employees) contributes to the lack of wage flexibility by permanent workers and excessive employment adjustment by employers (Bentolila and Dolado, 1994). Temporary contracts also reduce strongly incentives for workers and firms to invest in human capital and depress productivity growth. Rapid labor cost growth undermines competitiveness and employment growth. Finally, all these factors (lower employment, lower human capital and lower productivity) depress potential output.
III. HOW DIFFERENT ARE SPAIN’S LABOR MARKET INSTITUTIONS AND POLICIES?
One natural question to ask is which institutions and policies differentiate the Spanish labor market from that of other EU15 countries? To answer this, we first briefly review the existing evidence in the literature on which institutions and policies matter for labor market outcomes. We then proceed to benchmark Spain’s institutions and policies against those of the EU15. Finally, we summarize the recent labor market reform approved in June 2010 and assess its possible impact on the Spanish institutional and policy landscape. The literature The literature has identified a number of institutions and policies as important determinants of labor market outcomes (see for example Bassanini and Duval, 2006; Nickell, Nunziata and Ochel, 2005; Blanchard and Wolfers, 2000).7 The literature focuses mostly on the determinants of unemployment and employment rates, while few studies look at the macroeconomic determinants of the share of temporary workers (one exception is Nunziata and Staffolani, 2007). The main variables which have been studied as determinants of the unemployment rate include: the level and duration of unemployment benefits, the tax wedge, employment protection legislation (EPL), union density, the degree of centralization/coordination of collective bargaining, spending on active labor market policies, and the extent of product market regulation (PMR). There is fairly robust evidence that high unemployment benefits and high labor taxes
increase the unemployment rate (although some studies are less conclusive on labor taxes). High unemployment benefits raise the reservation wage of workers and
7 For a more comprehensive theoretical and empirical survey of the impact of policies and institutions on employment, see Bassanini and Duval (2006).

7
discourage low-income workers from taking on lower-paying jobs. High tax wedges either raise the cost of labor to employers, reducing labor demand, and/or reduce the net take-home pay of the workers, discouraging work.
The literature is less conclusive on the unemployment effects of EPL, union density, and the structure of collective bargaining. High EPL has ambiguous effects on the unemployment rate: it raises the cost of labor and hence discourages labor demand and hirings; but it also makes it more difficult to dismiss workers and hence reduces dismissals. Econometric estimates do not yield conclusive evidence, and in general effects are small. The theoretical literature suggests that the relationship between unemployment and the degree of centralization/coordination of wage bargaining is hump-shaped: both full decentralization and full centralization lead to lower unemployment rates, while an intermediate level of coordination yields the worst labor market outcome (Calmfors and Driffill, 1988). In decentralized wage bargaining systems, the smaller bargaining power of unions and enhanced market discipline reduce excessive wage claims that have detrimental effects on employment. Further, wage agreements are better tailored to the individual firm circumstances, helping preserve employment. In highly centralized systems, unions internalize better the negative impact that excessive wage pressures may have on employment at the macroeconomic level. While some studies find evidence of a hump-shaped relationship (Elmeskov et al., 1998; Scarpetta, 1996), the empirical literature remains relatively inconclusive (see Flanagan, 1999, for a survey). Trade unions can push wages above market-clearing levels, yielding lower employment. However, their influence on wage formation will depend on the structure of collective bargaining (see above). Further, union density (a typical measure of trade unions’ importance) can be a poor indicator of the actual bargaining power of unions as in some countries collective agreements are automatically extended to unaffiliated workers. The evidence in the literature on the effect of trade unions is mixed.
Some macro-econometric studies find that active labor market policies reduce the unemployment rate; however there is no agreement about the magnitude of the effect. More specifically, the literature suggests that it is mostly spending on training that has an effect on unemployment (Bassanini and Duval, 2006).
Finally, the few studies available find that product market deregulation reduces unemployment.8 Indeed, lower entry barriers facilitate the entry of new firms, boosting activity levels and labor demand. Lower product market rents can lead to more moderate wage claims and reduce the gap between productivity and real wages. Stronger competition can also increase the employment costs of higher wages.
8 For instance, Berger and Danninger (2007) find sizeable positive effects on employment growth of joint deregulation of product and labor markets, including through interaction effects.

8
Benchmarking Spain’s institutions and policies Based on a comparison with EU15, Spain stands out by the structure of its collective bargaining system and the high severance payments on permanent contracts. Differences are less marked when it comes to other institutions and policies, although there are nuances.9 The definition and sources of the indicators used are explained in the Appendix.
Collective bargaining Spain is among the few countries with an intermediate level of coordination of wage bargaining.10 The coordination of wage bargaining takes place primarily at the province and industry level, instead of the national or company level (Figure 5). France, Portugal, and Sweden also share this system to some extent. However, most EU15 countries have a high level of coordination of wage bargaining, with the exception of the UK which has a complete decentralization. As explained above, it has been argued that an intermediate level of coordination is less favorable to employment than a highly coordinated system where externalities of wage agreements can be better internalized. Some also argue that it is also less favorable to employment than a completely decentralized system where wage agreements can be better tailored to the individual company’s circumstances. A simple correlation between the degree of coordination of wage bargaining and the unemployment rate suggests a little bit of a hump-shape, however this hinges mostly on Spain and to a lesser extent France (see Figure 5).
The wage bargaining system in Spain is made worse by four factors. First, while some guidelines for wage increases are established at the national level, these act as minima and are typically compounded by further increases at the industry/province level, and sometimes at the company level, leading to a high wage drift. Second, the wage agreements are automatically extended to the entire province or industry, even to employees and firms that did not participate in the bargaining. While a high coverage of wage bargaining agreements is common, it is combined in Spain with a low union density, accentuating the insider-outsider problem. Unions represent mostly permanent workers, who benefit from high employment protection, fostering wage demands that do not fully internalize the employment implications, especially for the easily dismissable temporary workers. Third, so-called
9 See also Bentolila and Jimeno (2003) and Dolado, García-Serrano and Jimeno (2002) for an interesting discussion of Spanish labor market institutions and policies and reforms.
10 There are two indicators of the structure of collective bargaining. The first one refers to the degree of centralization in negotiations and captures the level at which negotiations are conducted; the second one is the degree of coordination among unions on the one hand and among employers on the other hand. It is accepted that the more relevant indicator is the degree of coordination, as a very decentralized system with high coordination could mimick the outcome of a fully centralized system (see Flanagan, 1999). Spain has both an intermediate degree of centralization and coordination. While many EU15 countries have an intermediate degree of centralization, they also have a high degree of coordination. In the remainder of the paper, the focus is on the degree of coordination of collective bargaining.

9
"opt-out" clauses (clauses that allow firms to opt-out from the agreements if economic conditions become difficult) are very restrictive and hence not easily used. Finally, these problems are compounded by a high degree of wage indexation, much more widespread than in other countries (Table 2). Wages are typically highly indexed on inflation and corrected when inflation turns out higher than expected (but not vice versa), causing a high wage drift and reducing the sensitivity of real wages to labor market conditions.11 This wage bargaining system, which hamstrings wage and firms’ flexibility, is ill-suited to membership of a currency union.
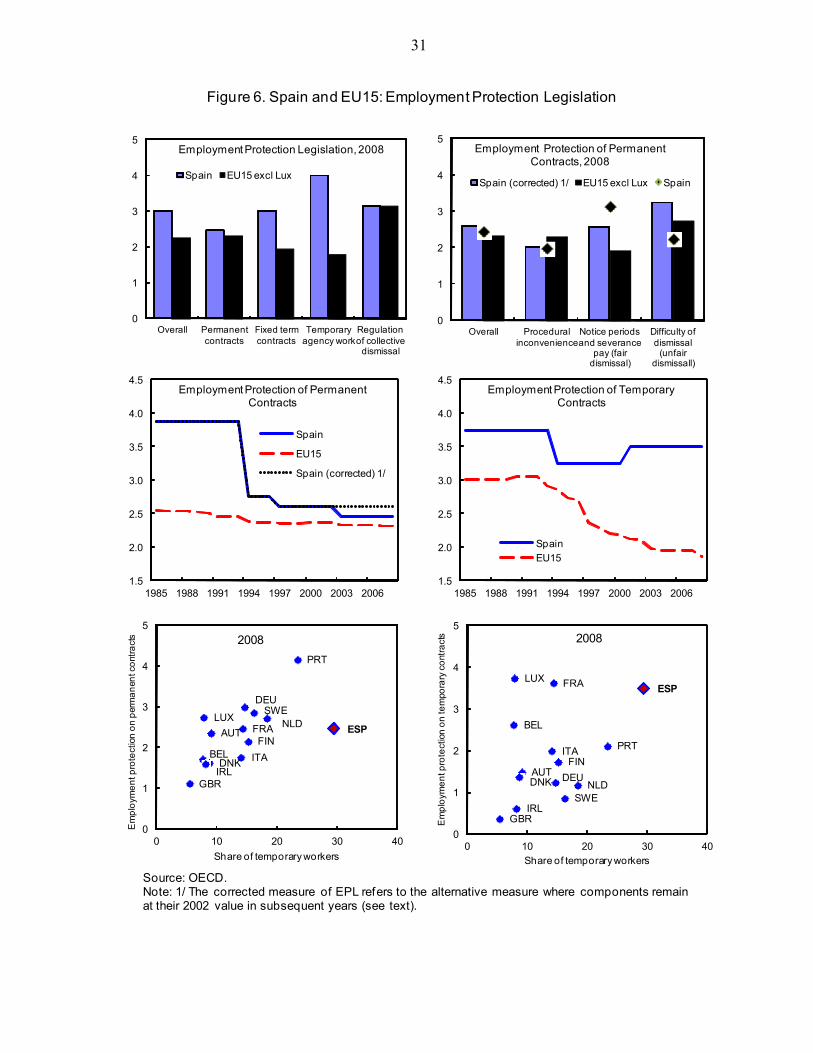
Employment protection legislation Dismissing permanent workers has been to date very costly in Spain, and its reduction is one of the main objectives of the recent reform. The difficulty of dismissal is not well reflected in the overall indicator of employment protection for permanent workers, which shows an average score (Figure 6). While Spain scores well on the length of notice periods and on procedures, it has among the highest severance payments and a very restrictive interpretation of fair dismissals (Table 3). Severance payments typically depend on whether the dismissal is considered fair or unfair. But in Spain, due to the very restrictive interpretation of fair dismissals, about 90 percent of lay-offs of permanent workers are treated as unfair (see Bank of Spain, 2009). In 70 percent of the cases, firms prefer to pay the higher severance payments upfront rather than going through a trial. The relevant severance payment is thus the one that applies to unfair dismissals. Severance payments are 20 days per year of service in case of fair dismissals and vary between 33 and 45 days per year of service for unfair dismissals (with a maximum of 24 and 42 months respectively). This is much higher than EU15 average severance payments which are about 7 days per year of service for fair dismissals and 21 days for unfair dismissals.12 In contrast, severance payments for temporary workers are only 8 days per year of service (and 12 days for temporary work agency workers). Finally, the trial period, i.e., the initial employment period during which an employer can dismiss a new employee without severance payment, is much shorter than in other countries.
Temporary work is also strictly regulated relative to other countries, although Spain has the highest share of temporary workers. Regulations are especially strict for temporary agency work but also for fixed term contracts.
Although the effect of employment protection on the unemployment rate is unclear a priori, it is likely to affect the share of temporary workers. The steep rise in the share of temporary workers took place after the authorized uses of fixed term contracts were broadened in 1984.
11 The latest wage agreement negotiated for 2010-2012, which postpones indexation until the end of the agreement, represents a small improvement.
12 The difference is even greater if one compares with the conditions for fair dismissals in EU15, since many unfair dismissals in Spain would actually be considered fair in other countries.

10
Presumably, employers rushed to use this type of contracts to avoid the inflexibility created by the high protection of permanent workers. Prima facie, the share of temporary workers seems much more closely correlated with the employment protection for permanent workers than with the employment protection for temporary contracts (see Figure 6). Other policies Spain’s differences with EU15 are less marked on other policies: Unemployment benefit net replacement rates are broadly in line with EU15 average,
but with a steeper profile. Overall, the average net replacement rates over the first five years of unemployment are somewhat below the EU average, but still at an internationally high level of 50 percent (Figure 7). Initial net replacement rates are among the highest in the EU15, at 77 percent. By the fifth year of unemployment, they are below the EU15 average, at 41 percent (including social assistance). The steep slope (around the average) seems broadly adequate as the high initial replacement rates provide strong support to families when they just lose their jobs, while the sharp expected decline in benefits strengthens incentives to return to the labor market. Like in the EU15, the trend has been toward an increase in unemployment benefit replacement rates, which have tripled their initial level since 1961.
The tax wedge is broadly in line with the EU15 average, although the composition varies somewhat. The tax wedge, which measures the difference between the labor cost to the employer and the take-home pay of the employee, is around 32 percent (Figure 8). The composition differs somewhat from that in the EU15 though, with higher employers’ social security contributions and lower employees’ social security contributions and personal income tax (and cash benefits). The trend in the tax wedge has followed closely that of the EU15, with a moderate decline in 1999.
Spending on active labor market policies remains low and relatively focused on employment subsidies. Although it has been increasing, spending on active labor market policies per unemployed (scaled by GDP per capita) remains well below the EU15 average (Figure 9). Moreover, Spain spends a large fraction on employment subsidies, while EU15 countries devote more resources to training and public employment services.
Product market regulation is somewhat below the EU15 average. Like the EU15, Spain has made much progress in reducing product market regulation, especially since the mid-1990s (Figure 10).

11
Labor market reforms Labor market reforms over the last years have tried to improve labor market institutions, especially reducing the protection of permanent workers and restricting the use of fixed-term contracts (Table 4). In 1997, a new permanent contract with lower severance payments for unfair dismissal (33 instead of 45 days per year of service) was introduced for all newly employed, except males of ages 33-45 who have been unemployed for less than one year. Yet, there was a low take-up of this contract and often de facto it carried a 45 day severance payment for unfair dismissal. In any case, even at 33 days per year of service, severance payments remain high in international comparison and compared to those of temporary workers. Another reform took place in 2003 with the elimination of the obligation to pay interim wages to dismissed workers while awaiting trial for unfair dismissal, on the condition that the employers recognize from the start the unfair character of the dismissal.13 However, these reforms have not yielded strong apparent declines in the share of temporary workers. The government approved a new labor market reform in June 2010, which aimed at tackling the high employment protection of permanent contracts and the lack of flexibility of the wage bargaining system. The main measures consist of (1) generalizing the use of the contract with 33 days severance pay per year of tenure for unfair dismissal so that most of the active population will now be eligible; (2) ensuring the 33 days is indeed the upper limit; (3) financing 8 days of severance payments via a fund paid for by firms;14 (4) easing the criteria for “fair” dismissal (which entails 20 days severance payment); and (5) significantly broadening and simplifying the conditions under which firms can opt-out of collective bargaining agreements. The reform also reduces the notice period for objective dismissals, imposes stricter conditions and higher costs of termination for temporary contracts, allows private for profit agencies to operate in labor intermediation, expands training contracts for unemployed and uneducated youth and streamlines to a certain extent employment subsidies.15 Further reforms addressing the collective bargaining process and active labor 13 The reform has little impact on the overall EPL for permanent workers (interim wages are typically only two months of salary). Yet, the way it was incorporated into the sub-indicators of EPL for permanent workers is a bit odd: the sub-indicator for difficulty of dismissals (which refers mostly to conditions for unfair dismissals) falls substantially to a level below the EU15 average – despite any significant change in severance payments for unfair dismissals or in the definition of fair dismissal – while the sub-indicator for fair dismissals rises – despite any change to severance payments or notice periods for fair dismissals. To test the robustness of our results, we calculate an alternative (“corrected”) measure of the sub-indicators for Spain, which basically keeps the value constant at the 2002 level (given the absence of later reform).
14 From January 1, 2012, this subsidy will be replaced by the creation of an individual capitalization fund for each new permanent employee, with contributions to the fund amounting to a number of days’ pay (to be determined) per year of service. The employees will be able to draw upon this fund in cases of dismissal, geographic mobility, training, or retirement. The new fund must not entail a net increase in employer social security contributions.
15 Specifically, with respect to temporary contracts, the reform tightens limits on successive renewals and the maximum length of such contracts and gradually (from 2012) raises severance payments from 8 to 12 days for all temporary contracts.

12
market policies are expected in early 2011. While the recent reform may turn out to be significant and important, depending on how it is used and implemented including by the courts, it does not appear to radically overhaul the labor market as it was described in the previous section. Employment protection remains above EU average levels and the reform does not institute a widespread decentralization of wage setting.
IV. DETERMINANTS OF THE UNEMPLOYMENT RATE
Estimation The institutions and policies reviewed in the previous section are important determinants of the behavior of the unemployment rate. Drawing on the recent literature, this paper relates the unemployment rate to the institutions and policies described above, specifically: the degree of coordination of wage bargaining (and its square, to allow for non-linearity), union density, the degree of employment protection legislation, the average gross replacement rate of unemployment benefits, the tax wedge, and the degree of product market regulation (Table 5). 16 The model also controls for the lagged unemployment rate (to allow for autocorrelation), the output gap, as well as country and time fixed effects:17
· · · · · · ·· ,
where UR denotes the unemployment rate of people aged 15 to 64, Coord denotes the degree of coordination of wage bargaining, Undens is the union density, EPL is the indicator of employment protection legislation, UB is the gross replacement rate of unemployment benefits, TW is the tax wedge, PMR is the indicator of product market regulation, Gap is the output gap, µ is the country fixed effect, and τ is the time fixed effect (see Appendix for the exact definition and source of variables) (Table 5). The model is estimated by ordinary least squares using a sample of 20 OECD countries during the period 1982-2007. Before even looking at the individual coefficients, it is clear that the model tracks closely the behavior of the unemployment rate in Spain since 1983 (Figure 11).18 We next present the results of the model.
16 Spending on active labor market policies is not introduced in the regression due to strong endogeneity issues.
17 Following Bassanini and Duval (2006), observations for Finland, Germany and Sweden in 1990 and 1991 are removed from the sample, and different country fixed effects are used for each of the three countries over the two sub-periods 1982-1989 and 1992-2007. This is because highly country-specific factors (the collapse of the Soviet Union, the unification and the banking crises) were behind the increase in unemployment over these two years, and including these six observations would risk biasing the estimates. Excluding these observations did not change conclusions from their analysis. Their study also suggests that the estimated coefficients of institutional and policy variables are not affected by whether they simply control for the output gap – as in our paper – or instead use more sophisticated measures of macroeconomic shocks.
18 An alternative model used in the literature introduces as additional variables the interaction of time dummies with (sample averages of) the institutions and policies to capture the fact that institutions and policies may
(continued…)
13
Unemployment increases with intermediate bargaining, high unemployment benefits, and a high tax wedge, but is little affected by employment protection legislation (see Table 5, Figure 12). Sub-dividing EPL into its subcomponents did not yield consistent and robust results (results available on request). The effects of product market regulation and union density are not precisely estimated, although the effect of product market regulation is quite large and becomes significant when the most insignificant variables are dropped (see below). These findings are in line with those of the literature described above. Robustness The results are robust to a number of sensitivity tests, such as dropping the most insignificant variables, using clustered standard errors, excluding outliers, dropping one country at a time, and running bilateral regressions between the unemployment rate and each of the policy/institutional variables (Table 5 and Table 6). Dropping the most insignificant variables (union density and EPL) leaves the results unchanged and makes product market regulation more significant, in line with results from other studies. Excluding outliers (which include a number of Spanish observations) affects mostly the union density variable which becomes significantly positive. This could reflect the fact that the very low union density in Spain is a poor measure of unions’ influence (as the coverage of collective agreements is very large due to automatic extension), biasing downward the estimated impact of union density on the unemployment rate when these observations are included. Bilateral regressions between the unemployment rate and each of the policy/institutional variables confirm the results of the multivariate regression (the main exception is somewhat weaker coefficient and significance for unemployment benefits). Excluding country fixed effects or time dummies do change all or some coefficients. However, these are precisely included to reduce biases in coefficient estimates due to the potential omission of other determinants of the unemployment rate. Hence, we do not see this sensitivity test as calling into question the main results of our study. While dynamic panel models can generate biased and inconsistent estimates, this is not so much a problem when the panels are longer, as is the case in our sample, and an estimation of the model using the Arellano-Bond estimator yields broadly supporting results, especially when two lags of the dependent variable are included. One main caveat to our estimation, though, is that the estimated relationship between the coordination of bargaining and the unemployment rate relies on a small number of observations. The only example of a country that moved toward more of an intermediate level of coordination in our sample is Sweden at the beginning of the 1980s, and this shift was not clear cut.19
affect the response to shocks (Blanchard and Wolfers, 2000). However, as it does not add much in terms of improving the fit of the regression, this paper uses the simpler model.
19 As a result, when earlier observations are dropped from the sample, the magnitude of the coefficients on the coordination variables changes a lot (as in the Arellano-Bond estimation) and in some cases only one of the two coordination variables (the level and its square) can be estimated (e.g. when using the subcomponents of EPL for which data start later).

14
Simulations The estimated model suggests that the equilibrium unemployment rate has not changed much from its high level over the last 25 years. Using the model, one can calculate the “equilibrium” path of the unemployment rate implied by its fundamental determinants as follows:
· · · · · · ·
. The equilibrium unemployment rate is around 14 percent and has only slightly declined by 1.5 percentage point since 1982 (see Figure 11). Over this period, there was little change in the system of wage bargaining and the tax wedge. And while the deregulation of product markets boosted employment creation, this was largely offset by the sharp increase in unemployment benefits. The Spanish equilibrium unemployment rate is about double the level of the EU15, which is at 7 percent. A reform of the structure of collective bargaining could have a large impact on the unemployment rate. With the tax wedge, unemployment benefits, and product market regulation broadly at the EU15 average, the bulk of the difference in equilibrium unemployment rates between Spain and the EU15 seems to reflect the higher degree of coordination of wage bargaining in other EU15 countries. Model estimates suggest that moving from an intermediate level of bargaining to a fully coordinated bargaining system would improve the equilibrium unemployment rate by 10 percentage points (Table 7). Similarly, according to our estimated hump-shaped relationship between coordination and the unemployment rate, switching from an intermediate level of bargaining to a completely decentralized bargaining structure would reduce the equilibrium unemployment rate by 7 percentage points. These large magnitudes should be taken with caution due to the small number of observations (Sweden in the early 1980s) that are available to estimate the impact of such a policy change (see above). However, it is interesting that the estimated effect (which relies on the experience of another country) seems to “explain away” the higher Spanish unemployment rate relative to EU15. On whether Spain should opt for full decentralization or full centralization, full decentralization would seem preferable given the relative large size of the Spanish economy (implying a diversified economic structure) and the need for considerable sectoral reallocation (from nontradables to tradables) and firm restructuring. Reducing the unemployment benefit replacement rate and the tax wedge would also help reduce the unemployment rate. Although it would take large changes in each of these policies to reduce substantially the unemployment rate, a combination of moderate changes in several policies could deliver a substantial reduction in the unemployment rate. Bringing the average gross replacement rate from the current 36 percent to the minimum observed in the sample (12 percent, UK) would reduce the long-run unemployment rate by 3 percentage points. Bringing the tax wedge from its current level of 32 percent to the minimum observed in the

15
sample (2 percent, Ireland) would reduce the long-run unemployment rate by 4 percentage points.20 A 10 percentage point reduction in either would generate smaller improvements in the unemployment rate of the order of 1.5 percentage points. Of course these two policies have very different fiscal implications. Their use in combination would minimize the budgetary impact, suggesting a fiscally neutral reduction in unemployment benefits and the tax wedge could significantly reduce unemployment. The experience of other countries suggests that the equilibrium unemployment rate can be reduced substantially by a mix of policy and institutional reform. Four EU15 countries have succeeded in reducing substantially their unemployment rate and bringing it to one of the lowest pre-crisis levels (Annett, 2007). These are Ireland, the United Kingdom, the Netherlands, and Denmark (Figure 13). The large declines in unemployment rates were accompanied by strong reductions in their equilibrium unemployment rates. This suggests that the most recent increases in unemployment rates in these countries related to the global financial crisis are probably mostly a cyclical phenomenon, unlike in Spain. Ireland took some sweeping steps (Table 8): it sharply reduced the tax wedge and union density, and transformed collective bargaining from decentralization to complete coordination. The other three countries used a mix of more moderate policy changes, including decreases in unemployment benefits, lowering of tax wedges (UK and Denmark), decreases in union density, and product market deregulation. Finally, spending on active labor market policies would gain in efficiency by refocusing on training. Although testing for the effect of this policy is difficult (due to endogeneity issues), the literature suggests that it can help reduce the unemployment rate, especially when it is focused on training. On the contrary, employment subsidies – widely used in Spain – are usually shown to be ineffective (see for instance Bassanini and Duval, 2006).
V. DETERMINANTS OF THE SHARE OF TEMPORARY WORKERS
Estimation Labor market institutions and policies are also likely important determinants of the share of temporary workers. To verify this, the share of temporary workers is regressed on a similar model to the one used for the unemployment rate, including the various institutions and policies, a lag of the share of temporary workers, and country and time fixed effects (Table 9).21 In this case, it is crucial that the model allow different subcomponents of the
20 Tax wedges for single people without children in Ireland are much higher, though still well below the EU15 average.
21 We are only aware of one other macroeconomic study that examines empirically the determinants of temporary employment using a panel data set, Nunziata and Staffolani (2007).

16
employment protection legislation index to have different impacts on the share of temporary workers. Indeed, while high employment protection of permanent workers would tend to increase the share of temporary workers, strict regulation of temporary work should reduce it. The model reads:
· · · · · ·· · · ,
where Tempsh denotes the share of temporary workers, EPR is the employment protection legislation for permanent workers, EPT is the strictness of regulation of fixed-term contracts and temporary agency work, and other variables are as defined above. The model is estimated on a sample of 20 OECD countries during the period 1985-2007 (or maximum years available). The model used explains pretty well the share of temporary workers over time in Spain (Figure 14). The share of temporary workers is boosted by higher unemployment benefits, a higher tax wedge, and lower product market regulation (see Table 9). The effects of unemployment benefits and of the tax wedge go in the same direction as for the unemployment rate. Presumably, because these variables lower labor demand, employers are more able to impose flexible contracts which fit their needs but increase the precarity of employees. But while lower product market regulation tends to reduce the unemployment rate, it actually increases the share of temporary workers. Lower product market regulation could increase the share of temporary workers for several reasons: (i) lower product market regulation increases competition and the need for firms to be able to adjust quickly, making it more tempting to hire temporary workers; (ii) lower product market regulation tends to favor the expansion of services sectors, where temporary work is more frequent; (iii) the lower rents induced by lower product market regulation may prompt firms to reduce labor costs by hiring temporary workers (with lower wages and dismissal costs). The effect of collective bargaining is either non significant or non identifiable.22 The estimation shows that high employment protection of permanent workers increases the share of temporary workers.23 This is true whether one uses the overall indicator of employment protection for permanent workers or its subcomponents (procedural inconvenience, notice period and severance payments for fair dismissals, and difficulty of dismissal). The most robust effect though comes from the difficulty of dismissal, which mostly refers to unfair dismissals (definition of justified or unfair dismissal, compensation following unfair dismissal, possibility of reinstatement following unfair dismissal, and length of trial period). In line with expectations, the strictness of regulation of temporary work
22 This is due to the lack of change in the variable over a smaller sample than the one used in the unemployment rate regression combined with the presence of country fixed effects.
23 See also Nunziata and Staffolani (2007) for a similar result using a panel of European countries over the period 1983-1999.

17
reduces the share of temporary workers, but the coefficient is often insignificant and not very robust. Robustness The main results from the estimations (for the difficulty of dismissals, unemployment benefits, the tax wedge, and product market regulation) are broadly robust to a number of sensitivity tests, such as using the alternative (“corrected”) measure of employment protection on permanent contracts, dropping the insignificant variables, using clustered standard errors, excluding outliers, dropping the time dummies, dropping one country at a time, using the Arellano-Bond estimator for dynamic panel models, and running bilateral regressions between the unemployment rate and each of the policy/institutional variables (Table 10 and Table 11).24 Plots of the partial correlations between the share of temporary workers and each of the variables confirms the robust impact of unemployment benefits, the tax wedge, the difficulty of dismissal and product market regulation (Figure 15). Simulations The equilibrium share of temporary workers, as estimated by the model, has actually decreased somewhat over time, reflecting the reforms. The model suggests that the share of temporary workers would have kept increasing to much higher levels, based on the institutions and policies prevailing at the end of the 1980s, was it not for the reforms that were enacted at the beginning of the 1990s (see Figure 14). In other words, while the share of temporary workers had increased to very high levels at the end of the 1980s, it had not reached its equilibrium. The equilibrium share of temporary workers declined by about 4 percentage points since 1988 (it actually declined by 9 percentage points until 2003 and then rebounded slightly). The decline reflected mostly the lowering of employment protection on permanent contracts and to a lesser extent, the strengthening of regulation on fixed-term contracts. However, this was largely offset by product market deregulation. The model suggests that reducing employment protection of permanent workers could substantially reduce the share of temporary workers. Much of the difference in the equilibrium shares of temporary workers between Spain and other EU15 countries is attributable to an unexplained country-specific effect, which likely captures the specialization of Spain in sectors with high use of temporary workers (e.g. household, construction, tourism). Yet, the estimations support the view that reducing the employment protection of
24 The significance of unemployment benefits and product market regulation is somewhat reduced when clustered standard errors are used, while the significance of the tax wedge is reduced in the bilateral regression with the share of temporary workers. Excluding country fixed effects does change coefficients drastically. However, they are precisely included to reduce biases in coefficient estimates due to the potential omission of other determinants of the unemployment rate. Hence, we do not see this sensitivity test as calling into question the main results of our study

18
permanent contracts can help reduce substantially the share of temporary workers (Table 12). Bringing the three components of employment protection of permanent workers to the minimum level observed in the EU15 would reduce the share of temporary workers by respectively 1, 3.5, and 9 percentage points, or a total of 13.5 percentage points. Reducing the tax wedge and the replacement rate of unemployment benefits would also help to lower the share of temporary workers. Other EU15 countries have mostly experienced increasing or flat shares of temporary workers, reflecting to a large extent product market deregulation. The actual and equilibrium shares of temporary workers increased significantly in France, Italy and Germany, although they fall short of reaching the high levels in Spain (Figure 16). The main driving force behind the rise in the share of temporary workers in these countries was product market deregulation (also present in Spain) (Table 13). In some of these countries, there was also a substantial liberalization of temporary contracts (Italy and Germany) and a rise in the protection of permanent contracts (Germany). The only country that had a decline in its share of temporary workers (recently reversed though) is Ireland, mostly as a result of the very large decrease in the tax wedge.
VI. COMPLEMENTARITY OF REFORMS
One could ask whether the two objectives, namely of reducing the unemployment rate and of curbing the share of temporary workers, are compatible or whether there could be some trade-off involved. Looking at a simple plot, the unemployment rate and the share of temporary workers appear to be positively correlated, suggesting the two could likely be reduced simultaneously. Countries with higher shares of temporary workers also have higher unemployment rates (Figure 17). This positive association may reflect various factors: (i) an adverse labor demand that leads both to a high unemployment rate and a high share of temporary workers; (ii) the attempt of countries that have a high unemployment rate to reduce it (not very successfully) by allowing new types of contracts; or (iii) the higher rotation of workers when the share of temporary contracts is larger, leading to higher frictional unemployment.25 An additional piece of evidence is that the four European countries that reduced substantially their unemployment rate before the recent global crisis (Ireland, the United Kingdom, the Netherlands, and Denmark) also had a flat or decreasing (in the case of Ireland) equilibrium share of temporary workers. The results from the regressions also seem to confirm these conclusions: most reforms of labor market institutions
25 See Blanchard and Landier (2002) and Cahuc and Postel-Vinay (2002). They argue that the effect of a partial reform of employment protection, which allows firms to hire workers on fixed-term contracts while maintaining strong employment protection on regular contracts, may be perverse, increasing unemployment as well as decreasing welfare. A policy that permits the opening of more temporary jobs fosters both job creation and destruction, but the latter effect is strengthened when high firing costs discourage the conversion of temporary jobs into permanent ones.

19
and policies either yield changes in the unemployment rate and the share of temporary workers that go in the same direction (e.g. the tax wedge and the unemployment benefit replacement rate) or affect one without affecting the other (e.g. EPL and the degree of coordination of collective bargaining). The main exception is product market reform that seems to reduce the unemployment rate but increase the share of temporary workers.
Furthermore, some reforms are likely to show strong complementarities. One striking example in the Spanish context is the decentralization of collective bargaining and the reduction of employment protection of permanent workers. The decentralization of collective bargaining may not lead to the expected flexibility in wages and reduction in unemployment if the employment protection of permanent workers remains high. Indeed, even at the firm level, unions’ representatives could keep defending the interest of the firm’s permanent workers at the cost of the firm’s temporary workers. Hence, although this cannot easily be tested in the data,especially because there are very few cases of countries that moved from/to an intermediate level of bargaining, it appears that the two reforms would have to be implemented hand-in-hand to be effective. On a last thought, it is interesting to note that contrary to the share of temporary workers, a higher share of part-time contracts is associated with a lower unemployment rate. This is in sharp contrast to the share of temporary workers, which is positively correlated with the unemployment rate. While both types of contracts provide additional flexibility, most part-time contracts are voluntary, hence they do not reflect adverse labor demand, but rather seem to be “imposed” from the supply side. They encourage the participation and employment in the labor market of groups that would otherwise not work, e.g. women especially with children, youth, and older workers. This may be an avenue worth pursuing for Spain, which has a very low share of part-time contracts.26
VII. CONCLUSIONS
The paper has shown that reforming labor market institutions and policies can have substantial effects on the unemployment rate and the share of temporary workers. Different policy mixes can achieve a similar result. A fundamental reform of the collective bargaining system, moving away from an intermediate level of bargaining towards either full centralization or full decentralization, would help reduce substantially the unemployment rate. In the Spanish case, full decentralization would seem preferable given its diversified economic structure and the need for considerable sectoral reallocation of labor and firm restructuring. Though Spain is not out of line on these policies, a combination of reduced unemployment benefits, lower tax wedges, and further product market deregulation could
26 See Jaumotte (2004) and Bassanini and Duval (2006) for an analysis of the determinants of female part-time labor force participation.

20
also contribute to reducing the unemployment rate. While not the focus of the paper, Spain also seems to have room to improve the effectiveness of its active labor market policies, which have helped keep unemployment low in some countries during the crisis. Another essential objective, not only from an economic viewpoint but also to promote fairness and social cohesion, is to reduce the share of temporary workers. One key reform needed in this respect is the reduction of employment protection on permanent workers, though reducing unemployment benefits and the tax wedge would also help. Interestingly, some reforms – especially those of unemployment benefits and tax wedges – seem to improve simultaneously the unemployment rate and the share of temporary workers. In contrast, product market deregulation reduces the unemployment rate but at the cost of an increase in temporary employment. Hence, it needs to be accompanied by offsetting measures. One aspect not examined in this paper is the role of interactions between policies and/or institutions. One interaction that would seem particularly important in the Spanish context is between decentralization of collective bargaining and the reduction of employment protection on permanent workers. If the employment protection on permanent workers is not reduced substantially, the decentralization of collective bargaining may not lead to the expected flexibility in wages and reduction in unemployment. Hence, it appears that these two reforms would have to be implemented hand-in-hand to be effective.
21
Appendix: Definition and Sources of Policy and Institutional Indicators
This appendix gives the definition and sources of the policy and institutional indicators used in the paper.
Coordination of wage bargaining:
Definition: indicator of the degree of coordination of the wage bargaining process, which takes the value 1 for uncoordinated systems, 2 for systems with intermediate coordination, and 3 for highly coordinated systems. The latest observed value is 2003. For later years, the value is assumed constant at the 2003 level (changes in the structure of collective bargaining are very rare).
Source: Bassanini and Duval (2006).
Union density:
Definition: trade union density rate, i.e. the share of workers affiliated to a trade union, in percent. Data for missing years are obtained by linear interpolation.
Source: Online OECD Employment Database.
Employment protection legislation:
Definition: OECD summary indicator of the stringency of Employment Protection Legislation. In addition to the summary indicator, we also use two disaggregations:
A disaggregation of the summary indicator into EPL for permanent workers, EPL for fixed term contracts, EPL for temporary agency work, EPL for collective dismissals;
A further disaggregation of EPL for permanent workers into: procedural inconvenience, notice periods and severance pay for fair dismissals, and difficulty of dismissals (which itself reflects the length of trial period on the job, the definition of justified and unfair dismissals, and the compensation in cases of unfair dismissals).
To test the robustness of our results, we also use an alternative (“corrected”) measure of EPL for permanent workers for Spain. This measure basically keeps the value of EPL for permanent workers and its components constant at the 2002 level. This is to account for the fact that the 2003 reform that suppressed the obligation of paying interim wages to workers while waiting for trial under the condition that the firm recognizes from the outset the unfair character of the dismissal may not have reduced much the difficulty of dismissals (interim wages are typically only two months of salary). While it does not make much of a difference for the overall EPL for permanent workers, it has a significant impact on its components, with the difficulty of dimissals staying at a high (above EU15 average) level, and the conditions for fair dismissals not increasing further above the EU15 average.
22
Source: Online OECD Employment Database and Online OECD Indicators of Employment Protection. See Venn (2009) for more information. Data prior to 1985 are taken from Bassanini and Duval (2006).
Unemployment benefit replacement rate
Definition: we use four different measures.
1. The average net replacement rate over first five years is the average of net unemployment benefit replacement rates over 60 months of unemployment across two income situations (100% and 67% of average production worker earnings) and two family situations (single and with dependent spouse). It includes social assistance
2. The initial net replacement rate is the average net unemployment benefit replacement rate during the first year of unemployment across two income situations (100% and 67% of average production worker earnings) and three family situations (single, with dependent spouse and with spouse in work). No social assistance "top-ups" are assumed to be available in either the in-work or out-of-work situation.
3. The long-term net replacement rate is the average net unemployment benefit replacement rate in the 60th month of benefit receipt across two income situations (100% and 67% of average production worker earnings) and three family situations (single, with dependent spouse and with spouse in work). It includes unemployment benefits, social assistance, and family and housing benefits.
4. The average gross replacement rate is the average unemployment benefit replacement rate across two income situations (100% and 67% of average production worker earnings), three family situations (single, with dependent spouse, with spouse in work) and three different unemployment durations (1st year, 2nd and 3rd years, and 4th and 5th years of unemployment). This is the measure we use in the regressions because it is the only one available since the early 1980s.
Source: OECD, Benefits and Wages Database.
Tax wedge:
Definition: tax wedge between the labor cost to the employer and the corresponding net take-home pay of the employee for a single-earner couple with two children earning 100% of the average production worker earnings. The tax wedge expresses the sum of personal income tax, all social security contributions, and (minus) cash benefits as a percentage of total labor costs. Due to a change of methodology starting in the year 2000, data prior to 2000 are projected backward by applying the change in their level to the 2000 data.
Source: OECD, Taxing Wages.

23
Public expenditures on active labor market policies
Definition: public expenditures on active labor market programmes per unemployed worker as a share of GDP per capita or public expenditures on active labor market programmes as a share of GDP, in percent.
Source: Online OECD Employment Database.
Product market regulation
Definition: OECD summary indicator of regulatory impediments to product market competition in seven non-manufacturing industries, including gas, electricity, post, telecoms, passenger air transport, railways, and road freight.
Source: Online OECD Homepage for Indicators of Product Market Regulation. See Conway and Nicoletti (2006) for more information.

24
REFERENCES
Annett, A. (2007), “Lessons from Successful Labor Market Reformers in Europe,”, IMF Policy Discussion Paper 07/01. Bank of Spain (2009), “El Funcionamiento del Mercado de Trabajo y el Aumento del Paro en Espana,”, Boletin Economico, Julio-Augosto 2009. Bassanini, A. and R. Duval (2006), “Employment Patterns in OECD Countries: Reassessing the Role of Policies and Institutions,” OECD Economics Department Working Papers No 14, June. Bentolila, S. and J.J. Dolado (1994), “Labour Flexibility and Wages: Lessons from Spain,” Economic Policy, Vol. 8, Issue 18, April. Bentolila, S. and J. F. Jimeno (2003), “Spanish Unemployment: The End of the Wild Ride?,” FEDEA Documento de Trabajo 2003-10. Berger, H. and S. Danninger (2007), “The Employment Effects of Labor and Product Market Deregulation and Their Implications for Structural Reform,” IMF Staff Papers, Vol. 54, No. 3. Blanchard, O. and A. Landier (2002), “The Perverse Effects of Partial Labour Market Reform: Fixed-term Contracts in France,” The Economic Journal, Vol. 112, No. 480, June. Blanchard, O. and J. Wolfers (2000), “The Role of Shocks and Institutions in the Rise of European Unemployment: The Aggregate Evidence,” The Economic Journal, Vol. 110, No. 462, March. Cahuc, P. and F. Postel-Vinay (2002), “Temporary Jobs, Employment Protection and Labor Market Performance,” Labour Economics, Vol. 9, No. 1. Calmfors, L. and J. Driffill (1988), “Bargaining Structure, Corporatism and Macroeconomic Performance,” Economic Policy, No. 6, April. Conway, P. and G. Nicoletti (2006), “Product Market Regulation in the Non-Manufacturing Sectors of OECD Countries: Measurement and Highlights,” OECD Economics Department Working Papers No. 530. Dao, M. and P. Loungani (2010), “The Human Cost of Recessions: Assessing it, Reducing it,” IMF Staff Position Note SPN/10/17. Dolado, J.J., C. García-Serrano and J.F. Jimeno (2002), “Drawing Lessons from the Boom of Temporary Jobs in Spain,” The Economic Journal, Vol. 112, No. 480, June. Elmeskov, J., J. Martin and S. Scarpetta (1998), “Key Lessons for Labour Market Reforms: Evidence from OECD Countries’ Experiences,” Swedish Economic Policy Review, Vol. 5, Issue 2.

25
Flanagan, R. (1999), “Macroeconomic Performance and Collective Bargaining: An International Perspective,” Journal of Economic Literature, Vol. 37, No. 3, September. Jaumotte, F. (2004), “Labour Force Participation of Women: Empirical Evidence on the Role of Policy and Other Determinants in OECD Countries,” OECD Economic Studies, No. 37. Nickell, S., L. Nunziata and W. Ochel (2005), “Unemployment in the OECD Since the 160s: What Do We Know?,” The Economic Journal, Vol. 115, No. 500, January. Nunziata, L. and S. Staffolani (2007), “Short-term Contracts Regulations and Dynamic Labour Demand: Theory and Evidence,” Scottish Journal of Political Economy, Vol. 54, No. 1, February. Scarpetta, S. (1996), “Assessing the Role of Labour Market Policies and Institutional Settings on Unemployment: A Cross-Country Study,” OECD Economic Studies No. 26, 1996/1. Venn, D. (2009), “Legislation, Collective Bargaining and Enforcement: Updating the OECD Employment Protection Indicators”, OECD Social, Employment and Migration Working Papers No. 89.

26
Figure 1. Spain and EU15: Unemployment, Employment, and Labor Force Participation
Sources: OECD; and Eurostat Labor Force Survey.
0
5
10
15
20
25
30
1970 1975 1980 1985 1990 1995 2000 2005
Unemployment Rate
SpainEU-15MinMax
-10
-5
0
5
10
15
1985 1988 1991 1994 1997 2000 2003 2006 2009
Employment Growth (percent)
SpainEU-15min EU15max EU15
-8
-6
-4
-2
0
2
4
6
8
10
1973 1977 1981 1985 1989 1993 1997 2001 2005 2009
Spain
Employment Growth
Labor Force Growth
0 20 40 60 80 100
Youth 15-24
Female 25-54
Male 25-54
Over 55
Total
Euro area
Spain
Labor force participation rate,
2009
0 5 10 15 20 25 30 35 40
Youth 15-24
Female 25-54
Male 25-54
Over 55
TotalUnemployment rate, 2009
Euro area
Spain
0 20 40 60 80 100
Youth 15-24
Female 25-54
Male 25-54
Over 55
Total
Euro area
Spain
Employment rate, 2009
(percent of working-age population)

27
Figure 2. Spain and Comparators: Impact of the Global Crisis on the Labor Market (Index, 2005q1=100)
Source: Statistical Office of the European Communities.
90
95
100
105
110
115
120
125
2005q1 2006q1 2007q1 2008q1 2009q1
Spain
Hours worked
Wages
Employment
Real output
90
95
100
105
110
115
120
125
2005q1 2006q1 2007q1 2008q1 2009q1
Euro area
Hours worked
Wages
Employment
Real output
90
95
100
105
110
115
120
125
2005q1 2006q1 2007q1 2008q1 2009q1
France
Hours worked
Wages
Employment
Real output
90
95
100
105
110
115
120
125
2005q1 2006q1 2007q1 2008q1 2009q1
Germany
Hours worked
Wages
Employment
Real output

28
Figure 3. Spain and EU15: Incidence of Temporary and Part-Time Work
Sources: OECD; Eurostat; European Commission; Instituto Nacional de Estadistica; WEO.
0
5
10
15
20
25
30
35
40
1987 1990 1993 1996 1999 2002 2005 2008
Temporary Employees as a percentage of the total number of employees
Spain EU-15
Min Max
-30
-20
-10
0
10
20
30
40
50
60
1988Q1 1992Q1 1996Q1 2000Q1 2004Q1 2008Q1
Spain: Growth of Employees (percent)
Permanent
Temporary
0
10
20
30
40
50
60
Households Construction Tourism Agriculture & Fishing
Public admin, Education,
health
Mining, Manufacture
& Elect.
Financial & Real estate
Transport Retail Trade
Incidence of Temporary Workers by Sector(average of the last 5 years)
SpainEuro areaSpain - share of employmentEuro area - share of employment
0
5
10
15
20
25
30
35
40
1987 1990 1993 1996 1999 2002 2005 2008
Share of Part-Time Workers (Percent of employment)
SpainEU15min EU15max EU15
0
10
20
30
40
50
60
70
Youth 15-24 Male 25-59 Female 25-59 Total 60+
Incidence of Temporary Workers by Age Group
Spain
Euro area

29
Figure 4. Spain and EU15: Wage Dynamics(Year-on-year percent change)
Sources: Instituto Nacional de Estadistica; and Statistical Office of the European Communities.
-8
-4
0
4
8
12
16
2001q1 2003q1 2005q1 2007q1 2009q1
Labor Cost Growth
Spain
EU-15
min EU-15
max EU-15
-2
0
2
4
6
8
2001q1 2003q1 2005q1 2007q1 2009q1
Spain: Labor Cost and Productivity Growth
Nominal labor cost
Real labor cost
Productivity
0
2
4
6
8
10
12
2001q1 2003q1 2005q1 2007q1 2009q1
Unit Labor Cost
Spain
Euro area
-8
-4
0
4
8
12
16
20
2001q1 2003q1 2005q1 2007q1 2009q1
Spain: Wage and GDP Growth
Nominal wages
Real wages
GDP
Unemployment rate (level)

30
Figure 5. Spain and EU15: Wage Bargaining Systems
Source: OECD.
0.0
0.5
1.0
1.5
2.0
2.5
3.0
3.5
GBR FRA PRT ESP SWE AUT BEL DNK IRL ITA NLD FIN DEU
Degree of Coordination of Wage Bargaining
AUTBEL
DNK
FINFRA
DEU
ITA
LUX
NLDPRT
ESP
SWE
GBR
0
10
20
30
40
50
60
70
80
90
100
0 10 20 30 40 50 60 70 80 90 100
Co
llect
ive
Bar
gai
ning
Co
vera
ge (p
erce
nt)
Union Density (percent)
Collective Bargaining Coverage and Union Density, 2000
GBRDNK
FRAITA
AUT
BEL
DEU
NLD
ESP
SWE
IRL
PRT
FIN
0
2
4
6
8
10
12
0 1 2 3 4 5 6
Un
emp
loym
ent R
ate
Degree of Coordination of wage bargaining
Unemployment Rate and Degree of Coordination of Wage Bargaining, average 2000-2008
31
Figure 6. Spain and EU15: Employment Protection Legislation
Source: OECD.Note: 1/ The corrected measure of EPL refers to the alternative measure where components remain at their 2002 value in subsequent years (see text).
0
1
2
3
4
5
Overall Permanent contracts
Fixed term contracts
Temporary agency work
Regulation of collective
dismissal
Employment Protection Legislation, 2008
Spain EU15 excl Lux
0
1
2
3
4
5
Overall Procedural inconvenience
Notice periods and severance
pay (fair dismissal)
Difficulty of dismissal
(unfair dismissall)
Employment Protection of Permanent Contracts, 2008
Spain (corrected) 1/ EU15 excl Lux Spain
1.5
2.0
2.5
3.0
3.5
4.0
4.5
1985 1988 1991 1994 1997 2000 2003 2006
Employment Protection of Permanent Contracts
Spain
EU15
Spain (corrected) 1/
1.5
2.0
2.5
3.0
3.5
4.0
4.5
1985 1988 1991 1994 1997 2000 2003 2006
Employment Protection of Temporary Contracts
Spain
EU15
AUT
BEL
DEU
DNK
ESPFIN
FRA
GBRIRL
ITA
LUXNLD
PRT
SWE
0
1
2
3
4
5
0 10 20 30 40
Em
plo
yme
nt p
rote
ctio
n o
n p
erm
an
ent c
ont
ract
s
Share of temporary workers
2008
AUT
BEL
DEUDNK
ESP
FIN
FRA
GBRIRL
ITA
LUX
NLD
PRT
SWE
0
1
2
3
4
5
0 10 20 30 40
Em
plo
yme
nt p
rote
ctio
n o
n te
mpo
rary
co
ntra
cts
Share of temporary workers
2008

32
Figure 7. Spain and EU15: Unemployment Benefit Replacement Rates
Source: OECD.1/ Includes social assistance.
0
10
20
30
40
50
60
70
80
90
Average Net Replacement Rate (first 5
years)
Initial Net Replacement
Rate
Long-Term Net Replacement
Rate (at end of 5 years)
Average Gross Replacement
Rate
Unemployment benefit replacement rates, 2007 1/
Spain EU15
0
10
20
30
40
50
60
70
80
90
ITA
GR
C
ES
P
GB
R
PR
T
FR
A
AU
T
DE
U
BE
L
SW
E
LUX
FIN
NLD
DN
K
IRL
Average Net Replacement Rate (f irst 5 years), 2007 1/
0
10
20
30
40
50
60
70
80
90
100
GR
C
GB
R
IRL
BE
L
AU
T
ITA
DE
U
SW
E
FIN
FR
A
ES
P
NLD
DN
K
PR
T
LUX
Initial Net Replacement Rate, 2007
0
10
20
30
40
50
60
70
80
GR
C
ITA
ES
P
PR
T
FR
A
GB
R
DE
U
SW
E
AU
T
LUX
NLD
BE
L
FIN
DN
K
IRL
Long-Term Net Replacement Rate, 2007 1/
0
10
20
30
40
50
60
70
1961 1967 1973 1979 1985 1991 1997 2003
Average Gross Replacement RateSpain EU15
min EU15 max EU15

33
Figure 8. Spain and EU15: Tax Wedge 1/
Source: OECD.1/ For a one-earner married couple at 100% of average earnings, with 2 children. SS stands for Social Security.
0
5
10
15
20
25
30
35
40
45IR
L
LUX
GB
R
PR
T
DN
K
ES
P
ITA
DE
U
FIN
NLD
AU
T
SW
E
BE
L
FR
A
GR
C
Tax Wedge, 2008(percent of gross labor costs)
-10
-5
0
5
10
15
20
25
30
35
Per
son
al In
com
e T
ax
Em
plo
yee
SS
Co
ntr
ibut
ions
Tra
nsf
ers
Em
plo
yer S
S C
on
tribu
tions
Tax
wed
ge
Tax Wedge , 2008(percent of gross labor costs)
Spain EU15
0
5
10
15
20
25
30
35
40
45
DN
K
GB
R
IRL
LUX
NLD
DE
U
AU
T
PR
T
FIN
GR
C
ES
P
BE
L
ITA
SW
E
FR
A
Employer Social Security Contribution Rate, 2008
(percent of gross earnings)
29
30
31
32
33
34
35
36
37
1979
1981
1983
1985
1987
1989
1991
1993
1995
1997
1999
2001
2003
2005
2007
Tax Wedge (percent of gross labor costs)
Spain
EU15

34
Figure 9. Spain and EU15: Spending on Active Labor Market Policies (ALMP)
Source: OECD.
0
0.2
0.4
0.6
0.8
1
1.2
1.4G
BR
ITA
LUX
PR
T
IRL
AU
T
DE
U
ES
P
FIN
FR
A
NLD
SW
E
BE
L
DN
K
ALMP Spending, 2007(percent of GDP)
0.0
0.1
0.2
0.3
0.4
0.5
GB
R
PR
T
DE
U
ITA
ES
P
FIN
FR
A
IRL
LUX
AU
T
SW
E
BE
L
NLD
DN
K
ALMP Spending per Unemployed, 2007 (scaled by GDP per capita)
0
0.4
0.8
1.2
1.6
1985 1988 1991 1994 1997 2000 2003 2006
AMLP Spending(percent of GDP)
Spain
EU-15
0
0.1
0.2
0.3
0.4
1985 1988 1991 1994 1997 2000 2003 2006
ALMP Spending per Unemployed (scaled by GDP per capita)
Spain
EU15
0
0.4
0.8
1.2
1.6
Spain EU-15
Composition of Spending on Active Labor Market Policies, 2007
Public Employment Services & AdministrationEmployment incentivesTrainingOther
0.00
0.02
0.04
0.06
0.08
1985 1988 1991 1994 1997 2000 2003 2006
ALMP spending per unemployed (scaled by GDP per capita)
Public Employment Services & Administration
Other (Direct job creation, Start-up incentives)
Employment incentives
Training

35
Figure 10. Spain and EU15: Product Market Regulation 1/
Source: OECD.Note: 1/ Based on product market regulation in seven non-manufacturing sectors.
0.0
0.5
1.0
1.5
2.0
2.5
3.0
3.5
GBR DEU DNK ESP NLD SWE AUT BEL ITA FRA FIN PRT LUX IRL GRC
Product Market Regulation , 2007
0
1
2
3
4
5
6
7
1975 1977 1979 1981 1983 1985 1987 1989 1991 1993 1995 1997 1999 2001 2003 2005 2007
Product Market Regulation
Spain
EU-15 (excl Lux)
min EU15
max EU15

36
Figure 11. Spain: Explaining the Unemployment Rate
Source: IMF staff calculations.1/ Using the benchmark regression in column (a) of Table 5.
5
10
15
20
25
1983 1987 1991 1995 1999 2003 2007
Unemployment Rate
actual
predicted 1/
5
10
15
20
25
1983 1986 1989 1992 1995 1998 2001 2004 2007
Unemployment Rate
actual
equilibrium 1/
-3 -2 -1 0 1 2
Eq. U Rate
U Benefits
Tax Wedge
Union Density
Emp. Prot.
Prod. Reg.
Coord. Bargain.
Time Effect
Change
Contributions to Change in Equilibrium
Unemployment Rate, 1982-
2007 1/
-4 -2 0 2 4 6 8
Eq. U Rate
U Benefits
Tax Wedge
Union Density
Emp. Prot.
Prod. Reg.
Coord. Bargain.
Country Effect
Contributions to Deviation from EU15 Equilibrium
Unemployment Rate, 2007 1/
Deviation

37
Figure 12. OECD Sample: Partial Correlations for the Unemployment Rate Regressions
Source: IMF staf f calculations.1/ Residual unemployment rate is the unemployment rate not explained by other regressors, using the benchmark regression in column (a) of Table 5.
-4
-2
0
2
4
6
0 20 40 60 80
Res
idua
l un
empl
oym
ent r
ate
1/
Unemployment Benefit Replacement Rate
-4
-2
0
2
4
6
0 10 20 30 40 50
Res
idua
l un
empl
oym
ent r
ate
1/
Tax Wedge
-4
-2
0
2
4
6
0 20 40 60 80 100
Res
idua
l un
empl
oym
ent r
ate
1/
Union Density
-4
-2
0
2
4
6
0 1 2 3 4 5
Res
idua
l un
empl
oym
ent r
ate
1/
Employment Protection Legislation
-4
-2
0
2
4
6
0 2 4 6 8
Res
idua
l un
empl
oym
ent r
ate
1/
Product Market Regulation
0
2
4
6
8
10
12
0 1 2 3 4
Res
idua
l un
empl
oym
ent r
ate
1/
Coordination of Wage Bargaining

38
Figure 13. EU15 Comparators: Strong Declines in Unemployment Rate and Reforms
Source: IMF staf f calculations.Note: 1/ Using the benchmark regression in column (a) of Table 5.
0
4
8
12
16
20
1982 1985 1988 1991 1994 1997 2000 2003 2006
Denmark Unemployment Rate
actual
equilibrium 1/
0
4
8
12
16
20
1982 1985 1988 1991 1994 1997 2000 2003 2006
Ireland Unemployment Rate
actual
equilibrium 1/
0
4
8
12
16
20
1982 1985 1988 1991 1994 1997 2000 2003 2006
Netherlands Unemployment Rate
actual
equilibrium 1/
0
4
8
12
16
20
1982 1985 1988 1991 1994 1997 2000 2003 2006
UK Unemployment Rate
actual
equilibrium 1/
-12
-9
-6
-3
0
3
IRL NLD GBR DNK ESP
Contributions to Decline in Equilibrium Unemployment Rate, 1982-2007 1/
U Benefits Tax Wedge Union Density Emp. Prot.
Prod. Reg. Coord. Bargain. Time Effect Total

39
Figure 14. Spain: Explaining the Share of Temporary Workers
Source: IMF staff calculations.Note: 1/ Using the benchmark regression in column (g) of Table 9.
10
15
20
25
30
35
40
45
1983 1986 1989 1992 1995 1998 2001 2004 2007
Share of Temporary Workers
actual
predicted 1/
10
15
20
25
30
35
40
45
1983 1986 1989 1992 1995 1998 2001 2004 2007
Share of Temporary Workers
actual
equilibrium 1/
-6 -4 -2 0 2 4 6
Eq. Share Temp.
U Benefits
Tax Wedge
Union Density
EPL Procedures
EPL Fair Dism.
EPL Unfair Dism.
EPL Fixed Term
EPL Temp Agency
Prod. Reg.
Coord. Barg.
Time Effect
Contributions to Decline in Equilibrium
Share of Temporary Workers,
1988-2007 1/
Decline
-5 0 5 10 15 20
Eq. Share Temp.
U Benefits
Tax Wedge
Union Density
EPL Procedures
EPL Fair Dism.
EPL Unfair Dism.
EPL Fixed Term
EPL Temp Agency
Prod. Reg.
Coord. Barg.
Country Effect
Contributions to Deviation from EU15 Equilibrium
Share of Temporary Workers, 2007 1/
Deviation

40
Figure 15. OECD Sample: Partial Correlations for the Share of Temporary Workers Regression
Source: IMF staff calculations.1/ Residual share of temporary workers is the share of temporary workers not explained by other regressors, using the benchmark regression in column (g) of Table 9.
-4
-2
0
2
4
6
8
0 20 40 60 80
Res
idua
l sh
are
of
tem
ps
1/
Unemployment Benefit Replacement Rate
-4
-2
0
2
4
6
0 10 20 30 40 50
Res
idua
l sh
are
of
tem
ps
1/ Tax Wedge
-6
-4
-2
0
2
4
6
8
0 2 4 6
Res
idua
l sh
are
of
tem
ps
1/ EPR, Procedural Inconvenience
-4
-2
0
2
4
6
8
0 2 4 6
Res
idua
l sh
are
of
tem
ps
1/ EPR, Fair Dismissals
-2
0
2
4
6
8
10
0 1 2 3 4 5 6
Res
idua
l sh
are
of
tem
ps
1/
EPR, Unfair Dismissals
-6
-4
-2
0
2
4
6
0 2 4 6
Res
idua
l sh
are
of
tem
ps
1/
EPT, Fixed Term Contracts
-6
-4
-2
0
2
4
6
0 2 4 6
Res
idua
l sh
are
of
tem
ps
1/ EPT, Temporary Agency Work
-8
-6
-4
-2
0
2
4
6
0 2 4 6 8
Res
idua
l sh
are
of
tem
ps
1/ Product Market Regulation

41
Figure 16. EU15 Comparators: Rising Share of Temporary Workers
Source: IMF staff calculations.1/ Using the benchmark regression in column (g) of Table 9.2/ 1994-2007 for Germany; 1988-2007 for Spain.
0
4
8
12
16
20
1985 1988 1991 1994 1997 2000 2003 2006
France Share of Temporary Workers
actual
equilibrium 1/
0
4
8
12
16
20
1985 1988 1991 1994 1997 2000 2003 2006
Italy Share of Temporary Workers
actual
equilibrium 1/
0
4
8
12
16
20
1994 1996 1998 2000 2002 2004 2006
Germany Share of Temporary Workers
actual
equilibrium 1/
0
4
8
12
16
20
1985 1988 1991 1994 1997 2000 2003 2006
Ireland Share of Temporary Workers
actual
equilibrium 1/
-15
-10
-5
0
5
10
15
20
FRA ITA DEU IRL ESP
Contributions to Changes in the Equilibrium Share of Temporary Workers, 1985-2007 1/ 2/
U Benefits Tax Wedge Union DensityEPL Permanent EPL Temporary Prod. Reg.Coord. Barg. Time Effect Total

42
Figure 17. EU15: Correlation Unemployment Rate, Temporary Work, and Part-Time Work, 2008
Source: OECD.
ESP
ASTBEL
DNK
FINFRADEU
IRL
ITA
LUX
NTH
PRT
SWE
UKUSA
0
5
10
15
20
25
30
35
0 2 4 6 8 10 12
Sh
are
of t
emp
ora
ry w
ork
ers
Unemployment rate
ESP
AUTBEL
DNK
FIN
FRA
DEU
GRC
IRL
ITA
LUX
NLD
PRT
SWE
GBR
USA
0
5
10
15
20
25
30
35
40
0 2 4 6 8 10 12
Par
t-T
ime
Sh
are
Unemployment rate

43
Spain Germany France Italy Sweden UK US
Total Hours Worked 1.67 0.75 1.25 0.82 1.01 1.46 0.96Employment 1.41 0.78 0.7 0.86 1.01 1.06 0.71
Source: Bank of Spain.
Table 1. Spain and Comparators: Employment Elasticities to Output
Spain Euro area France Italy Belgium
Automatic link to past inflation 38 16 8 1 98Automatic link to expected inflation 16 4 2 0.5 0Indirect relation with past inflation 10 9 21 3 0Indirect relation with expected inflation 5 5 8 2 0No link to inflation 29 64 59 94 2
Source: Bank of Spain.
Table 2. Spain: Extent of Wage Indexation(percent of affected workers)
Unfair Dismissals9 months tenure 4 years tenure 20 years tenure 20 year tenure
Austria 0 0 0 6Belgium 0 0 0 14Denmark 0 0 1.5 9Finland 0 0 0 14France 0 0.8 6.7 16Germany 0.2 1 5 18Greece 0.3 1 6 6Ireland 0 0.4 1.9 24Italy 0 0 0 15Luxembourg 0 0 6 5The Netherlands 0 3 9 7Portugal 3 4 20 15Spain 0.5 2.7 12 22Sweden 0 0 0 32The United Kingdom 0 0.5 2.3 8.0EU15 0.3 0.9 4.7 14.1
Source: OECD.1/ The large majority of dismissals are treated as unfair in Spain.2/ Average over all types of w orkers.
(Months of salary)
Fair Dismissals
Table 3. Spain: Severance Payments for Fair and Unfair Dismissals 1/2/

44
Table 4. Spain: Labor Market Reforms Legal Measures Permanent Contracts Temporary Contracts Workers’ Status (1980)
Individual dismissals:
For objective reasons. For economic, organizational, or technological reasons. For disciplinary reasons.
Ruling by labor courts upon appeal:
Unfair: 45 days’ wages per year of seniority (maximum 42 months wages) plus interim wages. Fair: 20 days wages per year of seniority (maximum 12 months’ wages) plus interim wages. Void: reinstatement.
Collective dismissal: Administrative approval. Same dismissal costs as fair individual dismissals
Minor incidence. Only for seasonal jobs (under stringent regulation).
Law 32/1984 Employment Promotion Contract (EPC) (Contrato Temporal de Fomento del Empleo): For any type of job. Minimum length, 6 months; maximum length, 3 years. Severance pay: 12 days’ wages per year of service.
Law 1/1992 Social security contributions rebates for hiring permanent employees.
EPC minimum duration raised to 12 months and maximum duration raised to 4 years (under certain circumstances).
Law 11/1994 New definition of collective dismissals. Extension of the definition of fair dismissal. Reduction of notice periods.
EPC abolished. Temporary contracts only allowed for fixed-term duration jobs. Legalization of temporary work agencies.
Law 63/1997 Permanent Employment Promotion Contract (PEPC) (Contrato de Fomento de la Contratación Indefinida). Severance pay for unfair dismissals for objective reasons lowered to 33 days’ wages per year of service (maximum 24 months’ wages), only for targeted groups.
Strengthening of causality principle in the applicability of temporary contracts.
Law 12/2001 Extension of coverage of PEPC. Severance pay of 8 days’ wages per year of service in some temporary contracts.
Law 45/2002 Elimination of interim wages when dismissal is acknowledged as unfair by the employer and severance pay deposited in court.
Decree 5/2006 Extension of coverage of PEPC. New tax deductions for hiring permanent employees.
Restrictions to continuation of temporary contracts to same employee.
Law 35/2010 Generalization of coverage of PEPC, ensuring that the 33 days severance pay per year of tenure is indeed the upper limit. Easing the criteria for “fair” dismissal. Broadening and simplification of the conditions under which firms can opt-out of collective bargaining agreements. Reduction of notice periods. Authorization of private for profit placement agencies to operate.
Progressive increases of the costs of termination for temporary contracts,

45
Benchmark
model
Dropping
insignificant
variables
Clustered
standard
errors
Excluding
outliers
No time
dummies
No fixed
effects
Arrellano-
Bond
estimation
one lag
Arrellano-
Bond
estimation two
lags(a) (b) (c) (d) (e) (f) (g) (h)
Unemployment Benefit Replacement Rate 0.025 0.024 0.025 0.03 0.02 0.003 0.013 0.018[3.21]*** [3.20]*** [1.64] [4.27]*** [2.67]*** [0.66] [0.82] [1.47]
Tax Wedge 0.028 0.033 0.028 0.025 0.022 0.003 -0.001 0.019[2.13]** [2.66]*** [2.00]* [2.38]** [1.71]* [0.50] [0.07] [1.67]*
Union Density 0.01 0.01 0.018 0.019 -0.002 0.004 -0.002[0.94] [0.48] [2.00]** [1.75]* [0.76] [0.13] [0.09]
Employment Protection Legislation (EPL) 0.077 0.077 0.18 0.12 -0.024 0.126 0.078[0.42] [0.38] [1.25] [0.66] [0.39] [0.51] [0.43]
Product Market Regulation 0.097 0.12 0.097 0.022 0.107 0.087 0.178 0.225[1.17] [1.77]* [0.85] [0.31] [1.84]* [1.38] [1.26] [1.94]*
Coordination of Wage Bargaining 6.355 7.363 6.355 13.337 0.527 0.493 9.581 37.316[1.68]* [2.07]** [1.48] [2.72]*** [0.22] [0.97] [1.07] [1.72]*
Square of Coordination of Wage Bargaining -1.659 -1.904 -1.659 -3.407 -0.213 -0.148 -2.479 -9.397[1.78]* [2.15]** [1.61] [2.80]*** [0.36] [1.22] [1.11] [1.74]*
Output Gap -0.279 -0.28 -0.279 -0.275 -0.286 -0.244 -0.308 -0.218[12.74]*** [13.02]*** [10.82]*** [13.49]*** [14.59]*** [10.98]*** [13.43]*** [8.51]***
Lagged Dependent Variable 0.801 0.798 0.801 0.801 0.767 0.916 0.83 1.105[31.17]*** [31.35]*** [20.58]*** [39.17]*** [32.04]*** [66.83]*** [23.92]*** [14.14]***
Second Lag of Dependent Variable -0.305[5.18]***
Joint significance of coordination variables (p-value) 0*** 0*** 0*** 0*** 0*** 0.02** 0.14 0.06*Number of observations 511 511 511 495 511 511 488 465Adjusted R-squared 0.99 0.99 0.99 1 0.97 0.97 n/a n/a
Source: IMF staff calculations.
Notes: 1/ All regressions include country fixed effects and time dummies unless otherwise indicated and are estimated by ordinary least squares with robust standard errors.
T-statistics are in parenthesis. * denotes significance at the 10% level, ** significance at the 5% level, and *** significance at the 1% level.
Table 5. Unemployment Rate: Regression Results and Robustness, 1982-2007 1/

46
Benchmark
model
Unemployment
benefits
Tax wedge Union density EPL
Product
market
regulation
Coordination
of wage
bargaining (a) (b) (c) (d) (e) (f) (g)
Unemployment Benefit Replacement Rate 0.025 0.009[3.21]*** [1.40]
Tax Wedge 0.028 0.023[2.13]** [2.09]**
Union Density 0.01 0.007[0.94] [0.78]
Employment Protection Legislation (EPL) 0.077 0.059[0.42] [0.48]
Product Market Regulation 0.097 0.105[1.17] [1.48]
Coordination of Wage Bargaining 6.355 8.907[1.68]* [2.41]**
Square of Coordination of Wage Bargaining -1.659 -2.263[1.78]* [2.46]**
Output Gap -0.279 -0.273 -0.275 -0.271 -0.272 -0.273 -0.274[12.74]*** [12.73]*** [12.38]*** [12.12]*** [12.53]*** [12.31]*** [12.56]***
Lagged Dependent Variable 0.801 0.844 0.824 0.846 0.843 0.842 0.839[31.17]*** [43.16]*** [35.30]*** [43.44]*** [42.68]*** [43.14]*** [42.50]***
Joint significance of coordination variables (p-value) 0*** … … … … … 0.01***Number of observations 511 511 531 511 531 511 531Adjusted R-squared 0.99 0.99 0.99 0.99 0.99 0.99 0.99
Source: IMF staff calculations.
Notes: 1/ All regressions include country fixed effects and time dummies and are estimated by ordinary least squares with robust standard errors.
T-statistics are in parenthesis. * denotes significance at the 10% level, ** significance at the 5% level, and *** significance at the 1% level.
Table 6. Unemployment Rate: Bilateral Regressions, 1982-2007 1/

47
Average EU15 Minimum EU15 Policy Change2/ Average EU15 Minimum EU15 Policy Change2/
Unemployment Benefit Replacement Rate 0.0 -0.6 -0.3 -0.2 -3.0 -1.3Tax Wedge 0.0 -0.9 -0.3 0.0 -4.4 -1.4Union Density 0.2 -0.1 -0.1 1.1 -0.3 -0.5Employment Protection Legislation -0.1 -0.2 -0.1 -0.3 -0.9 -0.4Product Market Regulation 0.0 -0.1 -0.1 0.1 -0.3 -0.5Coordination of Wage Bargaining -1.3 -1.4 -1.9 -6.5 -6.9 -9.8
Source: IMF staff calculations.
1/ Using the benchmark regression in column (a) of Table 5.
2/ Policy change is defined as a 10 percentage point reduction for the unemployment benefit replacement rate, the tax wedge and union density, and a one unit
reduction for employment protection legislation and product market regulation. For the coordination of wage bargaining, the alternative policy scenario considered is a
complete centralization.
Short-Run Effects Long-Run Effects
Table 7. Spain: Policy Simulations for the Unemployment Rate 1/(Change in the Unemployment Rate, percent)
Ireland Netherlands United Kingdom Denmark Spain
Unemployment Benefit Replacement Rate 7.0 -13.7 -10.9 -7.5 8.0Tax Wedge -23.7 1.7 -8.2 -4.9 0.0Union Density -30.7 -12.4 -20.7 -11.2 4.5Employment Protection Legislation 0.2 -0.6 0.2 -0.9 -0.8Product Market Regulation -2.9 -3.8 -3.5 -4.4 -3.4
Coordination of Wage Bargaining
from decentralization to centralization no change no change no change no change
Source: IMF staff calculations.
Table 8. Spain and Comparator EU15 Countries: Policy Mixes, 1982-2007(Change in the Policy/Institution)

48
All Observations Excl. Outliers All Observations Excl. Outliers All Observations Excl. Outliers All Observations Excl. Outliers(a) (b) (c) (d) (e) (f) (g) (h)
Main RegressorsUnemployment Benefit Replacement Rate 0.035 0.031 0.032 0.028 0.047 0.026 0.046 0.029
[2.05]** [2.48]** [1.86]* [2.20]** [2.51]** [1.89]* [2.52]** [2.13]**Tax Wedge 0.049 0.05 0.042 0.046 0.05 0.047 0.05 0.049
[1.88]* [2.68]*** [1.69]* [2.81]*** [2.01]** [2.71]*** [2.00]** [2.84]***Union Density -0.012 -0.005 -0.01 -0.004 -0.013 0.001 -0.019 -0.004
[0.45] [0.22] [0.40] [0.20] [0.52] [0.06] [0.74] [0.19]Employment Protection Legislation (EPL) 0.126 0.03 … … … … … …
[0.42] [0.13]Product Market Regulation -0.334 -0.239 -0.27 -0.23 -0.34 -0.21 -0.295 -0.206
[2.01]** [1.79]* [1.76]* [1.87]* [2.18]** [1.72]* [1.92]* [1.74]*Coordination of Wage Bargaining 2/ 2.23 0.406 … … … … … …
[0.90] [0.21]Square of Coordination of Wage Bargaining 2/ -0.552 -0.091 -0.034 -0.019 -0.048 -0.012 -0.056 -0.021
[0.88] [0.19] [0.63] [0.43] [0.90] [0.26] [1.04] [0.48]Output Gap -0.07 -0.072 -0.088 -0.087 -0.092 -0.082 -0.094 -0.084
[1.26] [1.99]** [1.64] [2.58]** [1.73]* [2.56]** [1.76]* [2.63]***Lagged Dependent Variable 0.778 0.828 0.792 0.815 0.774 0.801 0.777 0.802
[17.28]*** [23.40]*** [19.99]*** [25.22]*** [17.59]*** [24.01]*** [17.55]*** [23.96]***Subcomponents of EPLEPL Regular Contracts (EPR) 1.476 1.57
[3.62]*** [5.68]***Procedural Inconvenience 0.233 0.47 0.277 0.462
[1.05] [2.74]*** [1.25] [2.79]***Notice and Severance Pay for Fair Dismissal 0.394 0.475 0.386 0.336
[1.65]* [2.27]** [1.54] [1.54]Difficulty of Dismissal 0.9 0.592 0.992 0.871
[2.88]*** [2.81]*** [3.20]*** [3.62]***EPL Temporary Contracts (EPT) -0.09 -0.104
[0.61] [0.89]Fixed Term Contracts -0.117 -0.132 -0.141 -0.146
[1.16] [1.62] [1.40] [1.81]*Temporary Work Agency Employment 0.101 0.013 0.086 0.019
[1.01] [0.15] [0.87] [0.23]
Joint Significance of Subcomponents of EPL (p-value) 0*** 0*** 0*** 0*** 0*** 0***Number of observations 344 332 335 326 335 324 335 324Adjusted R-squared 1 1 1 1 1 1 1 1
Source: IMF staff calculations.
Notes: 1/ All regressions include country fixed effects and time dummies and are estimated by ordinary least squares with robust standard errors.
T-statistics are in parenthesis. * denotes significance at the 10% level, ** significance at the 5% level, and *** significance at the 1% level.
2/ In cases where earlier years of the sample are excluded (due to the lack of data on subcomponents of EPL), the coefficient of only one of the two coordination variables can be estimated.
3/ Corrected measure of EPL refers to the alternative measure where components remain at their 2002 value in subsequent years.
Model with Disaggregated EPLBasic Model Model with EPR and EPT Disaggregated EPL, Corrected 3/
Table 9. Share of Temporary Workers: Regression Results, 1982-2007 1/

49
Benchmark model 3/Dropping insignificant
variablesClustered standard
errorsExcluding outliers No time dummies No fixed effects
Arrellano-Bond estimation one lag
(a) (b) (c) (d) (e) (f) (g)
Main RegressorsUnemployment Benefit Replacement Rate 0.046 0.042 0.046 0.029 0.04 0 0.058
[2.52]** [3.61]*** [1.52] [2.13]** [2.17]** [0.02] [1.83]*Tax Wedge 0.05 0.049 0.05 0.049 0.059 -0.003 0.066
[2.00]** [1.95]* [2.04]* [2.84]*** [2.30]** [0.28] [3.24]***Union Density -0.019 -0.019 -0.004 -0.022 -0.003 -0.061
[0.74] [0.68] [0.19] [0.97] [0.77] [1.85]*Product Market Regulation -0.295 -0.319 -0.295 -0.206 -0.215 -0.069 -0.408
[1.92]* [2.50]** [1.43] [1.74]* [2.21]** [0.68] [1.81]*Coordination of Wage Bargaining 2/ … … … … 2.43 …
[2.01]**Square of Coordination of Wage Bargaining 2/ -0.056 -0.056 -0.021 -0.063 -0.597 -0.099
[1.04] [0.90] [0.48] [1.24] [2.12]** [1.71]*Output Gap -0.094 -0.083 -0.094 -0.084 -0.029 -0.116 -0.118
[1.76]* [1.56] [2.07]* [2.63]*** [0.79] [2.03]** [2.43]**Lagged Dependent Variable 0.777 0.761 0.777 0.802 0.77 0.963 0.772
[17.55]*** [17.04]*** [13.95]*** [23.96]*** [16.92]*** [68.62]*** [14.10]***Subcomponents of EPLEPL Regular Contracts (EPR)
Procedural Inconvenience 0.277 0.277 0.462 0.269 0.135 0.251[1.25] [1.17] [2.79]*** [1.18] [1.44] [1.15]
Notice and Severance Pay for Fair Dismissal 0.386 0.386 0.336 0.352 -0.029 0.257[1.54] [1.02] [1.54] [1.36] [0.29] [0.85]
Difficulty of Dismissal 0.992 1.23 0.992 0.871 0.835 0.003 1.281[3.20]*** [4.17]*** [2.48]** [3.62]*** [2.35]** [0.03] [3.60]***
EPL Temporary Contracts (EPT)
Fixed Term Contracts -0.141 -0.141 -0.146 -0.16 -0.093 -0.107[1.40] [1.08] [1.81]* [1.73]* [1.67]* [0.70]
Temporary Work Agency Employment 0.086 0.086 0.019 0.042 0.128 0.113[0.87] [0.60] [0.23] [0.43] [1.86]* [1.00]
Number of observations 335 335 335 324 335 335 315Adjusted R-squared 1 1 1 1 0.98 0.98 n/a
Source: IMF staff calculations.
1/ All regressions include country fixed effects and time dummies unless otherwise indicated and are estimated by ordinary least squares with robust standard errors. T-statistics are in parenthesis.
* denotes significance at the 10% level, ** significance at the 5% level, and *** significance at the 1% level. 2/ In cases where earlier years of the sample are excluded (due to the lack of data on subcomponents of EPL), the coefficient of only one of the two coordination variables can be estimated.
3/ The benchmark model is column (g) of Table 9.
Table 10. Share of Temporary Workers: Robustness of Regression Results, 1982-2007 1/

50
Benchmark
model 3/
Unemployment
benefits
Tax wedge Union density
Product
market
regulation
Coordination
of wage
bargaining
Procedural
Inconvenience
Notice and
Severance Pay for
Fair Dismissal
Difficulty of
Dismissal
Fixed Term
Contracts
Temporary
Work Agency
Employment(a) (b) (c) (d) (e) (f) (g) (h) (i) (j) (k)
Main RegressorsUnemployment Benefit Replacement Rate 0.046 0.021
[2.52]** [1.69]*Tax Wedge 0.05 0.021
[2.00]** [0.96]Union Density -0.019 0.013
[0.74] [0.50]Product Market Regulation -0.295 -0.221
[1.92]* [1.70]*Coordination of Wage Bargaining 2/ … 5.545
[3.72]***Square of Coordination of Wage Bargaining 2/ -0.056 -1.344
[1.04] [3.62]***Output Gap -0.094 -0.09 -0.059 -0.085 -0.092 -0.07 -0.078 -0.08 -0.081 -0.07 -0.066
[1.76]* [1.63] [1.09] [1.60] [1.66]* [1.29] [1.45] [1.48] [1.50] [1.27] [1.19]Lagged Dependent Variable 0.777 0.804 0.814 0.801 0.806 0.825 0.849 0.81 0.822 0.802 0.817
[17.55]*** [17.42]*** [17.05]*** [17.80]*** [17.65]*** [17.78]*** [20.04]*** [17.95]*** [17.92]*** [17.47]*** [17.44]***
Subcomponents of EPLEPL Regular Contracts
Procedural Inconvenience 0.277 0.539[1.25] [2.35]**
Notice and Severance Pay for Fair Dismissal 0.386 0.735[1.54] [2.78]***
Difficulty of Dismissal 0.992 0.754[3.20]*** [2.58]**
EPL Temporary Contracts
Fixed Term Contracts -0.141 -0.285[1.40] [3.10]***
Temporary Work Agency Employment 0.086 -0.091[0.87] [1.16]
Number of observations 335 344 363 344 344 363 354 354 354 354 354Adjusted R-squared 1 1 1 1 1 1 1 1 1 1 1
Source: IMF staff calculations.
Notes: 1/ All regressions include country fixed effects and time dummies unless otherwise indicated and are estimated by ordinary least squares with robust standard errors.
T-statistics are in parenthesis. * denotes significance at the 10% level, ** significance at the 5% level, and *** significance at the 1% level.
2/ In cases where earlier years of the sample are excluded (due to the lack of data on subcomponents of EPL), the coefficient of only one of the two coordination variables can be estimated.
3/ The benchmark model is column (g) of Table 9.
Table 11. Share of Temporary Workers: Bilateral Regressions, 1982-2007 1/

51
Average EU15 Minimum EU15 Policy Change2/ Average EU15 Minimum EU15 Policy Change2/
Unemployment Benefit Replacement Rate -0.1 -1.1 -0.5 -0.4 -5.0 -2.1Tax Wedge 0.0 -1.5 -0.5 0.0 -6.9 -2.2Union Density -0.4 0.1 0.2 -1.9 0.6 0.9Product Market Regulation 0.0 0.2 0.3 -0.2 0.9 1.3
Subcomponents of EPLEPL Regular Contracts
Procedural Inconvenience 0.1 -0.3 -0.3 0.4 -1.2 -1.2Notice and Severance Pay for Fair Dismissal -0.3 -0.8 -0.4 -1.3 -3.5 -1.7Difficulty of Dismissal -0.4 -2.0 -1.0 -1.8 -8.9 -4.5
EPL Temporary ContractsFixed Term Contracts 0.2 0.4 0.1 0.7 1.7 0.6Temporary Work Agency Employment -0.2 -0.3 -0.1 -0.8 -1.3 -0.4
Source: IMF staff calculations.
1/ Using the benchmark regression in column (g) of Table 9.
2/ Policy change is defined as a 10 percentage point reduction for the unemployment benefit replacement rate, the tax wedge and union density, and a one unit
reduction for employment protection legislation and product market regulation.
Short-Run Effects Long-Run Effects
Table 12. Spain: Policy Simulations for the Share of Temporary Workers 1/(Change in the Share, percent)
France Italy Germany Ireland Spain
Unemployment Benefit Replacement Rate 4.6 31.3 -3.4 9.0 2.1Tax Wedge 5.0 -11.3 -2.9 -27.8 -0.3Union Density -5.8 -9.2 -10.5 -28.5 3.3Product Market Regulation -3.8 -3.8 -2.9 -2.9 -3.3
Subcomponents of EPLEPL Regular Contracts
Procedural Inconvenience 0.0 0.0 0.0 0.0 -2.8Notice and Severance Pay for Fair Dismissal 0.4 0.0 1.0 0.0 -0.6Difficulty of Dismissal -0.5 0.0 0.0 0.0 -0.5
EPL Temporary ContractsFixed Term Contracts 0.5 -3.3 -2.8 0.8 1.0Temporary Work Agency Employment 0.6 -3.8 -1.8 0.0 -1.5
Source: IMF staff calculations.
1/ Germany covers the period 1994-2007 and Spain 1988-2007.
Table 13. Spain and Comparator EU15 Countries: Policy Mixes, 1982-2007 1/(Change in the Policy/Institution)