The Sonification Handbook - Sonification · The Sonification Handbook, chapter 15, pages...
37
The Sonification Handbook Edited by Thomas Hermann, Andy Hunt, John G. Neuhoff Logos Publishing House, Berlin, Germany ISBN 978-3-8325-2819-5 2011, 586 pages Online: http://sonification.de/handbook Order: http://www.logos-verlag.com Reference: Hermann, T., Hunt, A., Neuhoff, J. G., editors (2011). The Sonification Handbook. Logos Publishing House, Berlin, Germany. Chapter 15 Parameter Mapping Sonification Florian Grond and Jonathan Berger This chapter introduces the benefits and challenges of parameter mapping sonification. The chapter explores features of data and their preparation for sonification; synthesis parameters, both in the signal and perceptual domains, and methods of creating mapping functions to bridge between data and sound synthesis. Reference: Grond, F. and Berger, J. (2011). Parameter mapping sonification. In Hermann, T., Hunt, A., Neuhoff, J. G., editors, The Sonification Handbook, chapter 15, pages 363–397. Logos Publishing House, Berlin, Germany. Media examples: http://sonification.de/handbook/chapters/chapter15
Transcript of The Sonification Handbook - Sonification · The Sonification Handbook, chapter 15, pages...
The Sonification Handbook
Edited byThomas Hermann, Andy Hunt, John G. Neuhoff
Logos Publishing House, Berlin, GermanyISBN 978-3-8325-2819-52011, 586 pages
Online: http://sonification.de/handbookOrder: http://www.logos-verlag.com
Reference:Hermann, T., Hunt, A., Neuhoff, J. G., editors (2011). TheSonification Handbook. Logos Publishing House, Berlin,Germany.
Chapter 15
Parameter Mapping Sonification
Florian Grond and Jonathan Berger
This chapter introduces the benefits and challenges of parameter mapping sonification. The chapterexplores features of data and their preparation for sonification; synthesis parameters, both in thesignal and perceptual domains, and methods of creating mapping functions to bridge between dataand sound synthesis.
Reference:Grond, F. and Berger, J. (2011). Parameter mapping sonification. In Hermann, T., Hunt, A., Neuhoff, J. G., editors,The Sonification Handbook, chapter 15, pages 363–397. Logos Publishing House, Berlin, Germany.
Media examples: http://sonification.de/handbook/chapters/chapter15

30
Chapter 15
Parameter Mapping Sonification
Florian Grond, Jonathan Berger
15.1 Introduction
Parameter Mapping Sonification (PMSon) involves the association of information with audi-tory parameters for the purpose of data display. Since sound is inherently multidimensional,PMSon is – at least in principle – particularly well suited for displaying multivariate data.PMSon has been used in a wide range of application areas.
The idiophonic acoustical output of material, electrical or chemical interaction (or the directconversion of such interactions to electroacoustic signals), can often be used as a direct meansof data interpretation. Consider, for example, the sound produced from the state change ofwater in a whistling tea kettle as it approaches boiling point. However, unlike the boiling teakettle, the output signal that we wish to monitor may be beyond perceptual limen – whetherbelow difference thresholds, or beyond of the limits of human hearing. Furthermore, thedirect acoustic signal typically integrates a number of contributory factors, where attending toselect attributes (while discounting others) may be desirable. Using PMSon a predeterminedintermediary association can be established between one or more attributes of the informationunder scrutiny and its resulting auditory display. This association can, when necessary, bescaled to adapt to perceptual features and constraints of human hearing in order to optimizeinterpretive potential.
Our whistling tea kettle, arguably, generates an awful lot of sound for a simple binary signalwhose purpose is to alert the user to remove the kettle from the stove and pour the water intothe teacup. A simpler, albeit perhaps less charming, auditory signal might be achieved bymonitoring the output of a thermometer measuring the water temperature in the tea kettle,and mapping the numeric output to a sound synthesis parameter. A simple mapping, forexample, would link temperature to frequency, pitch or, perhaps a more obvious and explicitauditory signal (example S15.1). Rather than simply hearing when the target temperature isreached one might wish to listen to the continuous change of the rising water temperature

364 Grond, Berger
(sound example S15.2), or, perhaps, to hear selective temperatures at various times duringthe heating process as in sound example S15.3 which identifies the five traditional stages ofChinese tea preparation.
Therein lies both power and problem. Specifically, the enormous range of interpretivemapping decisions provides equally enormous opportunities to create an appropriate auditorydisplay for a particular desired purpose. However, the wide variety of mapping possibilitiesposes a challenge in terms of consistency and comprehensibility, a challenge that has, forvisual data mapping, been attenuated by evolution and the a-temporal nature of the display.
While mapping temperature to frequency or pitch is an intuitive and effective means ofmonitoring a critical stage in the process of tea preparation, it is useful to consider whatinformation is lost in replacing the direct auditory output of the reed in the kettle with thissimple mapping. For one thing, the kettle’s whistle is, for many, a sound whose meaning isbroadly, indeed universally, understood. For many, the sound carries a positive emotionalvalence. In addition, there is an anticipatory and musical component in the transformationfrom noise through variable and unsteady frequency to a relatively stable frequency1. Thus,while PMSon may offer precision and efficiency of display, it is important to consider thedegree to which the sonification is intuitive along with aesthetic and emotive issues that maybe desirable and even vital in the auditory display. In the following sections we considerthese factors.
Sound example S15.2 displays the continuously monitored temperature change of the waterin the tea kettle by directly mapping temperature to frequency (i.e., 100 F = 100 Hz) ata relatively high sampling rate. The mapping provides both the numerical and temporalprecision needed for the task at hand. However, unlike in sound example S15.1, in which thedisplay is set only to sound at the boiling point (and thus, using virtually any mapped sound,an intuitive and effective result is produced), this display lacks an intuitive representationof context and goal. A simple solution might be to add a reference tone representing theboiling point that sounds together with the sonification as in sound example S15.4. Thisreference tone is analogous to a grid line on a graph. In the absence of this reference, thelistener would be required to have absolute pitch and to know beforehand that 212 F is,in fact the boiling temperature of water 2. Implicit in these examples is the notion thatthe sound parameters employed for mapping may be physical (for example, frequency) orpsychophysical (pitch)3.
Effective PMSon often involves some compromise between intuitive, pleasant, and precisedisplay characteristics. For example, in sound example S15.3, temperature is polled atdiscrete time points and mapped to pitch. As opposed to the auditory ‘line graph‘ of soundexample S15.2, this example is analogous to a scatter plot. As is the case with visual graphsthere are benefits and deficiencies in every approach. Discrete data polling using sounds andintervening silences that result in a display that is neither overly obtrusive nor exceedinglyhabituating is as much an art as a science. In sound example S15.5 the tea water temperatureis mapped to quantized frequencies corresponding to a pentatonic scale with pitch classes [C,
1The fact, that the idiophonic acoustic output is often already music with lots of variations and details, full ofinformation in its own right, is addressed by the emerging field of auditory augmentation (see Bovermann etal. [11], and Grond et al. [33])
2In fact, since 212 F, or better 212 Hz, this falls between G#3 and A3, even absolute pitch might not be sufficient.3As discussed further on, mappings may additionally be complexes in the time and/or frequency domains such as
timbre, chords, melodic or rhythmic patterns

Parameter Mapping Sonification 365
D, E, G and A] on the musical scale. The lowest pitch sounded is C2, 212 F is set to C5, andall other sounded pitches are scaled to their closest match within this range. Although thetemperature is sampled regularly, the number of data points sonified is determined by thetemperature, such that the higher the temperature, more (and higher) pitches are soundeduntil the boiling point is reached and the pitch is repeated every 200 ms. Sounded at avolume level that is neither masked by the environment, nor far above the masking threshold,and using a recognizable timbre with a relatively high degree of harmonicity, the resultingdisplay is generally deemed pleasant, unobtrusive, and effective. Compound these intuitivebut relatively arbitrary mapping decisions by the number of variable parameters comprisingaudio, let alone by adding additional dimensions to be displayed and the inherent strengthsand challenges of implementing effective PMSon become apparent.
In addition to selecting particular increments for mapping data, there is a wide range ofavailable sound parameters, and virtually limitless scaling strategies from which to choose.The optimal mapping is thus – even in this elementary case – the result of various considera-tions such as what are the task related aspects of the data to sonify, how much of this data isuseful for auditory display (i.e., the granularity of the display), what sound dimension andparameter to use, and how to scale the data to the chosen parameter? A systematic analysisof these considerations is depicted in the diagram in Figure 15.1 and will be discussed in thefollowing sections.
15.2 Data Features
In Figure 15.1, the field data features, encapsulating data domain and the data preparation,represents the stage in which the parameter-mapping sonification (PMSon) design involvesobjective thought regarding the data. Although we will present the process of PMSondesign formally and in discrete segments, the bi-directionality of the design flow at the datapreparation stage, suggests that the process is influenced at all stages by decisions regardingsound synthesis parameters.
15.2.1 Data Domain
The data domain describes all properties directly related to the data. Initial categorizationof the data would identify channels or dimensions and whether the data are continuous ordiscrete. These aspects and their implications for the design process have been discussedin the design space map by deCampo in [21] and are treated in depth in the theory chapterchapter 2.
Data of a continuous variable that is densely sampled in time can potentially translate intosmoothly interpolating auditory streams. Here sound has the potential to create the impressionof analog continuity, in contrast to the inherently discrete nature of digital data. The orderingof the data is translated one to one (that is, one data point mapped to one signal parametersetting) into auditory features. In contrast, data that do not represent an continuos variablebut rather a statistic process may fluctuate dramatically, and thus approaches such as granularsynthesis may be appropriate. For this category in particular, but also the case for continuousdata, attention must be paid to data format properties (such as data sampling rate) which,although unrelated to the data content, influence selection and design of mapping strategies.

366 Grond, Berger
Figure 15.1: Map for a general design process of PMSon. Effective PMSon involves translat-ing data features (left) into sound synthesis parameters (right). In this diagram,this process is divided between data and numerical control in grey, and soundand auditory factors in blue. Although data processing (rectangle) can be han-dled with rigorous objectivity (grey rectangle), human perception (green oval)imposes a subjective component to the process. As the figure suggests, thedesign of PMSon involves the interplay of, and the conscious intervention inboth the data and the signal domains. Integrating both worlds is key in creatingeffective sonification.
If these format properties are reflected in the sound, the sonification runs the risk of producingaudible display artifacts that compromise the veracity and efficacy of the auditory display.A third category involves data sets in which the data points are not equidistant. These aresometimes encoded in the original data, through non-equidistant timestamps. They can alsobe extracted from continuous or discrete data series as identified events, e.g. maxima, turningpoints or zero crossings, in the data preparation process.
Findings for this preliminary data assessment have important consequences for the subsequentmapping decisions. It is further important to identify topological structures in the data. Arethey, for instance, organized on a ring or any other particular manifold shape structure whichmight suggest a particular spatialization of the auditory stream? Depending upon the outcomeof this analysis, questions of polarity in the data can be addressed. A similar structuringapproach for the design process has been developed by Barrass in [2].

Parameter Mapping Sonification 367
15.2.2 Data Preparation
Following an objective data assessment, PMSon design involves a data preparation stepwhich is not only influenced by the data structure but also by the inherent structure of theavailable sound synthesis parameters selected from the parameter domain. It is here thatperception influences decisions. If, for instance, a selected sound synthesis parameter createsa perceptual categorical boundary 4 the sonification designer might apply this perceptualfeature to a dichotomic data feature.
Appropriate data preparation is key for successful PMSon, particularly when the data setis multivariate and – as is typically the case – demands dimension reduction. Methods fordimension reduction can include principal component analysis (PCA) [45], self organizingmaps (SOM) [35] among other methods. The purpose of dimension reduction for sonificationis twofold: First, the available dimensions of synthesis parameters are often of limitedorthogonality and of highly varying saliency and hence need to be used as efficiently aspossible. Second, dimensionality reduction in the data domain must be considered in terms ofresulting noise or perceptible distortion in the auditory display. Imagine several data channelsthat correlate in a complex manner but are each very noisy. Only after the information inthe signal is properly separated from the noise can the correlation become perceivable in thesonification.
In contrast to data reduction at the data preparation stage, for scalar time series, datapreparation may involve calculating derivatives as complementary information to map.Derivatives can, for example, be interesting data channels for expressing movement aschanges in posture. In this case, the velocity as one indicator of the movement energy can bethen expressed appropriately through the sound signal energy.
Data preparation can also consist of extracting events (e.g., extrema, zero crossings, intersec-tions of data channels) from either discrete or continuous data, as a way to ‘condense’ thedata substrate and adapt it to perceptual constraints.
The data preparation step can also help to objectify mapping decisions later on in the process.Principle Component Sonification [36] for example, determines the information content ofdata dimensions and maps them to sound parameters ordered by salience. This means thatthe data channel with most information (deviating from Gaussian distribution) is mapped tothe most salient sound synthesis parameter.
Both the analysis of the data domain and analysis of the data preparation must be based onconscious and rational decisions. This is why we find on the side of the data features thehuman activity thinking. This might seem self-evident, but during the design process one hasto constantly switch between careful thinking and concentrated listening. Awareness aboutwhich modality is necessary to move one step forward in the design process is crucial.
15.3 Connecting Data and Sound
The next field, the mapping function is the essence of what defines PMSon, which is to mapdata features to sound synthesis parameters in order to understand structures in the data. InPMSon the mapping function poses two challenges: The first is a proper formalization of
4for example, a sharp transition from a pitched to an unpitched source filtered by a spectral envelope
368 Grond, Berger
the transfer function which connects the data domain of hard facts with the somewhat moreelusive perceptual domain. The second challenge is to find a good mapping topology, i.e.,how the sets of data features and synthesis parameters should be linked in order to achieve aperceptually valid result.
15.3.1 The Transfer Function
A formalization of the mapping function can be found by Hermann in [36] and is here brieflyrecapitulated: Given a d-dimensional dataset {~x1, ..., ~xn}, ~xi ∈ Rd, an acoustic event isdescribed by a signal generation function f : Rm+1 → Rq which computes a q-channelsound signal s(t) = f(~p; t) as a function of time. ~p is an m-dimensional vector of acousticattributes which are parameters of the signal generator. q is the number of dimensionsavailable through the spatialization setup. A PMSon is then computed by:
s(t) =N∑i=1
f(g(~xi), t) (1)
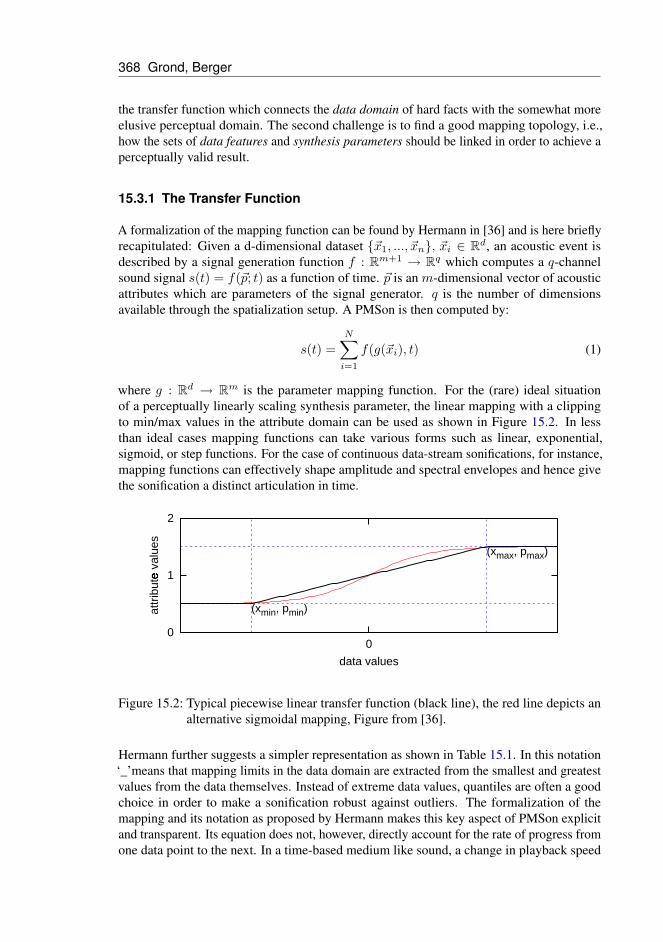
where g : Rd → Rm is the parameter mapping function. For the (rare) ideal situationof a perceptually linearly scaling synthesis parameter, the linear mapping with a clippingto min/max values in the attribute domain can be used as shown in Figure 15.2. In lessthan ideal cases mapping functions can take various forms such as linear, exponential,sigmoid, or step functions. For the case of continuous data-stream sonifications, for instance,mapping functions can effectively shape amplitude and spectral envelopes and hence givethe sonification a distinct articulation in time.
0
1
2
0
attr
ibut
e va
lues
�
data values
(xmin, pmin)
(xmax, pmax)
Figure 15.2: Typical piecewise linear transfer function (black line), the red line depicts analternative sigmoidal mapping, Figure from [36].
Hermann further suggests a simpler representation as shown in Table 15.1. In this notation‘_’means that mapping limits in the data domain are extracted from the smallest and greatestvalues from the data themselves. Instead of extreme data values, quantiles are often a goodchoice in order to make a sonification robust against outliers. The formalization of themapping and its notation as proposed by Hermann makes this key aspect of PMSon explicitand transparent. Its equation does not, however, directly account for the rate of progress fromone data point to the next. In a time-based medium like sound, a change in playback speed

Parameter Mapping Sonification 369
data feature sound synthesis parameterdatafeature1[_, _] → onset [10 ms, 20 ms]datafeature2[_, _] → freq [50 midinote, 52 midinote]datafeature3[_, _] → level [−18 dBV, 0 dBV]
Table 15.1: A readable textual representation for ease of interpreting the mapping of asonification, where each parameter in the target domain is given a meaningfulname.
affects many, if not all, perceptual characteristics of the display simultaneously and is hencea very important parameter.
15.3.2 Towards a General Formalization
Time, which is inherent to sonification, is well integrated in a formalism introduced byRohrhuber [61] which introduces mixed expressions that intertwine sonification method anddomain formalism. This formalism is not restricted to parameter mapping but also encom-passes model-based sonifications and audification, see chapter 12 and 16. All sonificationspecific variables and operators are denoted with a ring, e.g., t for sonification time. Thisensures that a change in time in the data domain is not confused with the time that elapseswhile the sonification is being listened to. The sonification operator S is further defined asS = A〈ξ〉 → A〈ξ, t, y〉, where A stands for a function, relation or other term, ξ is a set ofdomain variables (corresponding to the data domain) and y is the sound signal of the sonifica-tion. The formalism is also discussed in chapter 2. The generality and rigor of this formalismcomes at the cost of the typically steep learning curve associated with understanding abstractmathematical notation. Its intention and strength is to tighten expert domain mathematicalformalism with synthesis processes. However it describes a transformation into the signaldomain which, contrary to Table 15.1, does not contain perceptual qualities. It might beinteresting for future extensions to consider the explicit integration of necessary perceptualcorrections in the sonification operator S.
It is important to keep in mind that western music notation evolved over centuries in responseto progressive refinements and changes in musical textures, timbre, pitch and rhythmicattributes. Thus music notation is, in a sense, a mapping from visual representation intopitch, loudness, duration and timbre instrumental space with time progressing according toan independent tempo map. The challenge which is genuine to sonification is that notationsneed to be functional and practical like the ones in music. However, they equally need toaddress the more abstract signal domain without losing sight of their ultimate purpose, whichis to map and represent data rather than musical ideas.
15.4 Mapping Topology
The mapping function as shown in its readable form in Table 15.1 shows a mixture ofmappings from data features into either a) strictly signal related parameters (onset in mil-liseconds), or b) hybrid mixtures i.e., mapping into level (expressed as dBV) or frequency
370 Grond, Berger
(scaled as MIDI notes). This mixture of signal-related and perceptual- related categoriesand units expresses the two big challenges from opposite directions in the formalizationof the mapping function: Are the signal synthesis parameters perceptually valid? Can theperceptual categories be smoothly varied and well expressed by synthesis parameters? Oneway to address this challenge is to choose a proper mapping topology.
‘one-to-one’ mapping
‘One-to-one’ mappings (as shown in Table 15.1) can, strictly, only be mappings to parame-ters of the signal domain since the parameters in the perceptual domain are generally notindependent. The Principal Component Mapping, explained in the data preparation stepon page 367, also falls into this category. Here, data channels are ordered with respectto their information content which are then assigned in a ‘one-to-one’ mapping schemeto the synthesis parameters with respect to their perceptual saliency (although in the caseof Principal Component Mapping, the‘one-to-one’ approach is more related to the idea ofparsimony in the use of perceptual dimensions).
‘one-to-many’ mapping
Mapping one data feature to several synthesis parameters (‘one-to-many’ mapping, alsoknown as divergent mapping was first introduced by Kramer in [48]. The motivation behindthis approach is to account for the fact that idiophonic objects usually change their soundcharacteristics in several aspects at the same time when varying, for instance, the amountof energy input. In [29] this method was expanded by scaling the ranges in the perceptualdomain. This can be of particular interest if variations must be made noticeable in the displayfrom small to large scales .
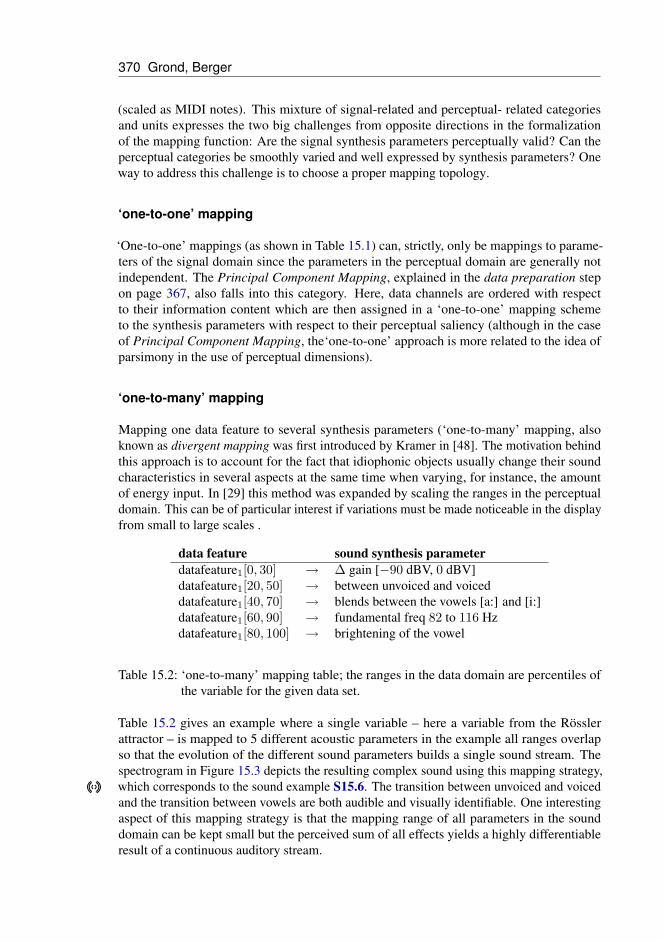
data feature sound synthesis parameterdatafeature1[0, 30] → ∆ gain [−90 dBV, 0 dBV]datafeature1[20, 50] → between unvoiced and voiceddatafeature1[40, 70] → blends between the vowels [a:] and [i:]datafeature1[60, 90] → fundamental freq 82 to 116 Hzdatafeature1[80, 100] → brightening of the vowel
Table 15.2: ‘one-to-many’ mapping table; the ranges in the data domain are percentiles ofthe variable for the given data set.
Table 15.2 gives an example where a single variable – here a variable from the Rösslerattractor – is mapped to 5 different acoustic parameters in the example all ranges overlapso that the evolution of the different sound parameters builds a single sound stream. Thespectrogram in Figure 15.3 depicts the resulting complex sound using this mapping strategy,which corresponds to the sound example S15.6. The transition between unvoiced and voicedand the transition between vowels are both audible and visually identifiable. One interestingaspect of this mapping strategy is that the mapping range of all parameters in the sounddomain can be kept small but the perceived sum of all effects yields a highly differentiableresult of a continuous auditory stream.

Parameter Mapping Sonification 371
Figure 15.3: Spectrogram showing the described one to many mapping; on top is shown thelogarithmic time series of the z variable. See also [29]
‘many-to-one’ mapping
‘Many-to-one’ mapping, also known as convergent mapping, can indirectly occur throughthe perceptual interdependence of sound synthesis parameters. Further, when mapping twoor more data features to physical modeling processes, their variation can change perceptualproperties such that a ‘many-to-one’ mapping is implicitly present. Convergent mappingshave been explored mostly in gesture to sound synthesis mappings for signal models byRovan et al. in [62]. The authors discuss and situate this approach in the field of new musicalinterfaces and identify this strategy as a determinant factor in expressivity control. Huntet al. extended these definitions [43, 44]. The main goal in musical interface research isexpressivity and fine control of musical material, see VanNort [71], and not necessarily theuse of sound to highlight possibly hidden relationships in data sets. However, it is commonlyagreed that it is important to have a perceivable relationship between gestures and sounds inperformances. With regard to musical performance, expressivity is obviously an importantissue for new musical interfaces, but its function is less clear for the purpose of representingdata through sonification, since expressivity remains mostly a performer related category.
15.5 Signal and Sound
The parameter domain depicted in Figure 15.1 has already been touched upon by thediscussion of the data preparation step and the mapping function. Sound synthesis parametersare part of the formalization of the mapping function and are in practical terms oftencontrollable arguments of the signal generating units. Despite their role in the operationalaspects in PMSon they also equally belong to the perceptual side and their proper scalingis part of the sound design expertise. In Table 15.1 we find, for instance, that some soundsynthesis parameters can be expressed in perceptually approximatively linear units (e.g.,MIDI notes, dBV), and hence a linear transfer function can be formulated. These perceptuallylinear units have then to be mapped into units of the signal domain (i.e., base frequency,amplitude). The corresponding mapping functions that take these perceptual relations into
372 Grond, Berger
account can be sometimes made explicit. For instance, the relationship between loudnessperception and frequency is captured in isophonic curves and hence psychoacoustic amplitudecompensation can be applied. Within the context of PMSon this problem was demonstratedby Neuhoff et al. in [55]. For sounds of complex timbres however, this loudness compensationin the signal domain can become difficult and within PMSon appropriate compensationshave still to be integrated. Nonetheless, if perceptual anchors can be defined in a sufficientlysmooth manifold of non-orthogonal perceptual subspaces, data mining techniques can beapplied to interpolate between those anchors. Related concepts have been explored for theformant space in [38] and for a smooth transition within sets of earcons and sets of auditoryicons in [20].
15.5.1 Parameter and Signal Domain
In a strict sense the parameter domain belongs only to the signal domain in Figure 15.1 sinceparameters influence only signal generating processes as described in the formalism above.Furthermore, although we can rely on a good deal of empirical psychoacoustic formulae,the perceptual domain is ultimately reliant on the interactive process of listening, assessing,and refining parameter mappings. The arrangement in the diagram however reflects thechallenge a PMSon designer is faced with which is the problem of representation in creativeprocesses: An experienced sound designer or composer generally has a preconception of howthe resultant signal should sound before it is generated and listened at. This imagined resultbelongs to the perceptual domain which demystifies the common notion of inexplicableintuition by presupposing that a conceptual auditory model is, through experience, createdby the PMSon designer. Although this preconception is a strong guiding principle, the soundhas to be heard for further evaluation and refinement.
15.5.2 Perceptual Domain
The psychophysical limits of just-noticeable differences (JND), masking, thresholds ofhearing in the frequency, amplitude, and time domains, necessitates the constant interactionbetween ‘thinking’ and ‘listening’. Thus, in Figure 15.1, the signal domain and the perceptualdomain overlap partially, which is because not all aspects of a signal can be heard due torestrictions in the audible range and masking phenomena.
Here it is again interesting to compare sonification with classical music and compositionpractices, where mapping often refers to instrumentation or orchestration. Both are tightlycoupled to the perceptual domain. For instance, a note in a score represents pitch andnot frequency; a single pitch mapped simultaneously to a clarinet and oboe represents asingle novel timbre combination rather than two discrete sounds. This musical approachcan typically be found in MIDI based sonifications, where perceptual categories and scalingis contained in the signal product of the output sample which is triggered by a particularMIDI command. Because of the indexical nature of the signal in this case (i.e., being thetrace of a calibrated instrument), creating a MIDI sample sonification effectively generatesa quasi-musical score. Hence the signal category does not play the same role compared tosound synthesis through signal generators. MIDI-based sonification avoids (or skirts around)some perceptual challenges. However, its limitations deprive PMSon of the potentially highdimensional parameter space of sound synthesis methods. Nonetheless, the comparison of

Parameter Mapping Sonification 373
such mappings to musical scores suggests the efficacy of building sound synthesis units asperceptually calibrated ‘mini instruments’ whenever possible. The perceptual calibration canthen be tested before preprocessed data are integrated in the PMSon.
The Sound Object
The sound taxonomy introduced in Pierre Schaeffer’s classic work Traité des objets musi-caux [63, 16] provides useful concepts for PMSon design. The first level of the perceptualdomain can be considered as the abstract object sonore constituted by idealized reducedlistening, a listening mode without causal and semantic connotations.
In practical terms this particularly applies when data features are mapped to mediatingsynthesis processes such as physical modeling. Here the target space into which data featuresare mapped often has parameters that describe material properties of simulated idiophonicobjects, such as stiffness or mass. Through the dynamics of the physical model they controla complex combination of signal properties which integrate to perceptual categories such astimbre.
The Auditory Scene
Whereas the object sonore and its related theory describes the basic sounding units of asonification design, principles of Auditory Scene Analysis (ASA), which describes howthe human auditory system organizes sound into perceptually meaningful elements [12],allow us to account for their interplay. ASA describes how streams of sounds are groupedor segregated – vital considerations for effective sonification. Efficient PMSon design musttake into account the cognitive load of users and their available capacities for a given task.One must, for example, be certain to avoid mappings in which three distinct data features areperceived as two auditory streams due to the pitch or timbral proximity of two of the threefeatures. In addition to fusion, segregation and various Gestalt-based grouping principles,PMSon design must take into account auditory masking issues both with respect to themutual influence of all sounds within the auditory display itself or the environment withinwhich it is sounded.
ASA principles provide a framework where sound parameters, spatialization, harmonicityand their perceptual effects on masking, stream fusion, and segregation can be criticallyassessed. For literature and an in-depth discussion on stream-based sonification we refer toWorrall [83]. Masking, stream fusion and segregation are difficult challenges but parametermapping can be considered as the sonification technique which allows for the most flexibleintervention by the designer in order to address them individually. In audification for instancemasking effects can only be explored by changing the playback-speed, which has at the sametime implications on all other perceptual levels.
15.6 Listening, Thinking, Tuning
The projected result of a sound design idea is then evaluated through the three fields ofhuman activities: listening, tuning, and thinking, as depicted in the diagram in Figure 15.1.

374 Grond, Berger
Listening in this context means a real listening mode as opposed to an ideal one. This is whythe arrow from listening to thinking in Figure 15.1 is bi-directional.
A common pitfall in developing a PMSon is convincing oneself that variations in a sound areclearly audible and informative (since sonification designers know what they are seeking tohear) when, in fact, these variations are not at all salient to the naive listener. Interactivelychanging the mapping function, or exploratory Tuning the design can effectively avoid thistrap. Yet, tuning that is undirected or uncontrolled runs the risk of leading the sonificationdesigner to frustration and failure.
The iterative tuning process as an inherent element of PMSon has been investigated by meth-ods of tangible computing through Bovermann et al. in [9, 10]. In their work a tangible deskwas used to support an externalized representation of the parameter space while exploringvarious configurations within. These works fall into the category of interactive sonificationswhich are further described in chapter 11.
In [39] the tuning process and its evolutionary dynamics was partly operationalized byintegrating it within a numerical optimization algorithm. This algorithm ensures a systematicand hence potentially efficient exploration of the parameter space. In numerical optimizationsusually a cost-function is formulated, which defines a potential surface on which existingoptima must be found. Since the functionality of sonification can ultimately only be as-sessed on the perceptual level the cost-function was substituted with user ratings and theircomparison.
These examples show that tuning as an important aspect of PMSon has been identifiedas an interesting field of research which has also prompted the need for just in time (JIT)sonification tools that facilitate a quick evaluation cycle of idea, implementation, and listening.Related techiques are described in chapter 11. The function of tuning thereby is not onlyrestricted to improve a PMSon in absolute terms but can also support exploratory dataanalysis, since different structures in the data may require different parameter sets to bediscovered. Tuning however is an activity that can counteract learning efforts where parameterinvariance is essential for building up internal representations.
15.7 Integrating Perception in PMSon
In the previous description of the PMSon design diagram, the constant tension between,phenomena of perception and formalization of the data-to-signal transformation has beenencountered in several situations. However, auditory display has been successfully appliedto various problems and in various circumstances. This unresolved tension is the reason whythere is no generic way of designing a multipurpose PMSon for auditory display. This tensionalso exists, in principle, for visualizations but appears as less problematic in this modality.Why is this so? And what can we learn from this apparent advantage of visualization?
The visual modality is biased through our predominantly visual culture and the connectionof knowledge with visual rather than auditory representation. It is further important that atleast in 2D, structures such as correlations in data can be transparently visualized becauseof orthogonal (x, y) display dimensions and magnitude can be absolutely accessed throughexplicit scales. From a cultural/historic standpoint, the introduction of central perspectivehas further introduced a working mathematical formalization of some perceptional aspects
Parameter Mapping Sonification 375
of human vision. This operationalization contributes greatly to its credibility (and myth) asan objective knowledge representing medium.
Due to the complexity of the human auditory sense, which is in terms of the sonic qualitiespotentially multidimensional, but at the same time on the signal level only a “2-channel”time-based medium, formalizations of perceptual aspects and their operationalization forPMSon are considerably more difficult. In the next section some possible integration ofperceptual corrections is discussed.
Proactive Corrections in the Mapping Function
In the ideal case, concerns regarding perception could be explicitly integrated in the formal-ized mapping functions as correcting terms. Possible sound aspects of intervention belongfirst and foremost to the perceptual field of the sound object. Imagine a PMSon that mapsdata solely to pure sine tones. In this case psychoacoustic amplitude compensation canbe applied, which adapts the amplitude of a given frequency according to equal-loudnesscontours. In a similar way the Mel scale can be used to account for the nonlinear pitchfrequency relation.
In the perceptional field of the auditory scene mapping aspects related to spatializationare one field where, in the case of HRTF rendering measurements of idealized head andtorso shapes and their contribution to the sound perception, are well formalized. Hereeven individual perceptional features can be explicitly taken into account in the case ofpersonalized HRTF.
Retroactive optimization through Tuning of the Mapping Function
Some aspects of the auditory scene are so difficult to operationalize that they cannot beaddressed in the mapping function in the first step. In this case it is necessary to retroactivelyoptimize the PMSon. Psychoacoustic models can provide an appropriate measure to opti-mize a sonification, and can be applied post fact.An interesting future question is whetherquantifiable perceptual criteria lead to sonic optima that are pleasant enough to be functionalfor an auditory display. In the case of masking, however, this approach could ensure thatPMSon can be ruled out where the data is obscured in the auditory display.
In the field of qualitative perceptual effects human intervention imposes the aesthetic judg-ment and criteria to a sonification. Therefore it can only partly be operationalized as describedby Hermann et al. in [39], and criteria have to be formulated in order to quantify qualitativeaspects of a PMSon. Attempts to formulate these high-level criteria for sonifications havebeen made by Vogt in [74].
Ultimately, the principal tenets of effective sonification – design of displays that are intuitive,learned with relatively little effort, able to draw attention to salient data features, andable to maintain interest and minimize satiation – involve both perceptual and, to somedegree, aesthetic considerations. Such considerations are often arrived at through retroactivetuning.

376 Grond, Berger
Post-production Interventions
The equivalent of this step in music production is mastering, an activity with a particular levelof expertise in auditory perception. Mastering processes that can be relevant for sonificationinclude equalization and compression. Since these processes are prone to compromise theveracity of the sonification they should, ideally, be considered in the mapping function orsound synthesis processes rather than applied post factum. For equalization this should bedone by proper psychoacoustic corrections. With respect to a signal compressor, the data canbe scaled during the preparation step based on statistical properties (mean, median, variance,quantiles), which formalizes the display in a transparent way. However, compression mightbe appropriate when data magnitudes cannot be properly estimated in advance as is the casewith online monitoring of data.
15.8 Auditory graphs
Auditory graphs are the auditory equivalent of mapping data to visual plots, graphs and charts.Going back to the tea ceremony from the introduction, mapping the continuous change in thekettle’s water temperature to frequency is the attempt to produce the auditory equivalent ofa line graph. The field of application for auditory graphs is usually as assistive technologyfor visually impaired or blind users, which is treated in depth in chapter 17. Auditory graphimplementations are often clear cases of PMSon. For scatterplots, however, data sonogramshave been introduced [41] which belong to MBS but usually involve a PMSon element,which is the categorial labeling of the data points as tone color. In the next paragraphs,we summarize a review over auditory graphs from [32] with a focus on PMSon designconsiderations.
Foundational work was laid in 1985 by Mansur et al. [51] who presented the first system forthe creation of computer-generated sound patterns of two-dimensional line graphs, whichthey called sound graphs. Their goal was to provide the blind and visually impaired witha display for line graphs that allowed for a holistic understanding similarly to those ofsighted users. The sonification approach employed by the authors was mapping the Ordinatevalues to pitch, varying it continuously while progressing in time along the x-axis. In theirstudy the authors compared a prototype system with tactile-graph methods and found thatmathematical concepts such as symmetry, monotonicity, and the slopes of lines could bedetermined quickly.
After presenting a longitudinal research approach in [8], Bonebright suggested an agendafor auditory graphs in [7]. The main agenda items were effectiveness, role of memory andattention, and longitudinal studies of learning.
A good overview of the field of auditory graphs can be found in Stockman et al. [68]The authors outline issues of a research agenda for design and evaluation which are com-parisons, understanding and recall of sonified charts. Further, they introduce the ‘multi-ple views’ paradigm and how to design intuitive representations the same information usingdifferent levels of detail. Interactivity as a way to explore auditory graphs was also addressedas an important point of the proposed research agenda.
Harrar et al. [34] address the need to look at the mode of presentation and what effects
Parameter Mapping Sonification 377
changing the presentation parameters of auditory graphs have on the user’s ability to gain anoverview or to identify specific graph characteristics. Amongst other aspects they discuss theinfluence of playback speed in which the auditory graph is presented.
A first conceptual model of auditory graph comprehension can be found with Nees et al.in [54]. The authors motivate the necessity for their extensive review of the research field bypointing out that:
Auditory graph design and implementation often has been subject to criticismsof arbitrary or atheoretical decision-making processes in both research andapplication.
Nees et al. attempt to make links to the relevant literature on basic auditory perception, andsupport a number of common design practices. The general design process diagram forPMSon from Figure 15.1 provides a supporting structure for design decisions. Nees et al.mention that information in an auditory graph has been occasionally mapped to spectralcharacteristics such as brightness, although they restrict their discussion of mapping strategiesto frequency/pitch mappings which are still the most popular and dominant approaches. Theconceptual model as presented in [54] also analyzes the role of the auditory context in anauditory graph. This includes concepts of tick-marks and the indication of quadrant transition.As a further auditory element the idea of an acoustic bounding box was introduced in [30].
Flowers gives (in [25]) an overview on auditory graphs and the state of the art in 2005.From a PMSon perspective, this is particularly interesting in that it lists not only successfulmapping strategies but also those which failed. Some of the mappings that worked contained:pitch coding of numeric value, manipulating loudness changes in pitch-mapped stream ascontextual cues and signal critical events, choosing distinct timbres to minimize streamconfusions and unwanted grouping, sequential comparisons of sonified data. Approachesthat failed were either due to the complex nature of loudness perception which cannot beused to represent an important continuous variable, or due to grouping if the simultaneouspresentation of some continuous variables were of similar timbres, or if too many simulta-neous continuous variables were presented at the same time using pitch mapping. Flowersalso lists what we need to know more about, which are the effects of stream timbre andpatterning on perceptual grouping, and the representation of multiple variables in a singleauditory stream.
Despite the fact that research questions in the field of auditory graphs are far from beingconclusively answered, applications that make use of auditory graphs are available. From theperspective of assistive technologies, the Java program MathTrax [64] 5 must be mentionedsince its interface is tailored to typical requirements for the blind and partially sighted users,see chapter 17. It allows for an interactive exploration of the sonified function and presentsvisual, acoustic and descriptive information which can be all accessed through screen readers.Derivatives of a function can be sonified parallel to the function values. In comparison to theimpressive features of the user interface, the sonification relies on a basic parameter mappingof function value to frequency/pitch. Mathtrax also allows the user to play the sonification ofseveral functions – e.g., function values and their derivatives – at the same time.
From an auditory scene analysis standpoint the PMSon from MathTrax splits into twoor several auditory streams exhibiting different varying pitch contours, whose integrated
5http://prime.jsc.nasa.gov/mathtrax/
378 Grond, Berger
(a) (b)
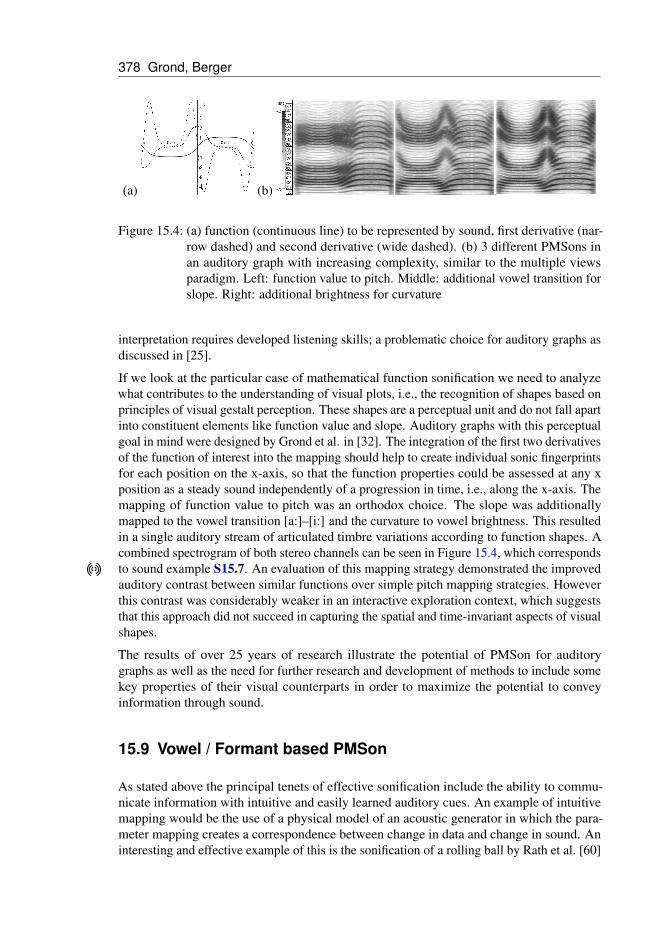
Figure 15.4: (a) function (continuous line) to be represented by sound, first derivative (nar-row dashed) and second derivative (wide dashed). (b) 3 different PMSons inan auditory graph with increasing complexity, similar to the multiple viewsparadigm. Left: function value to pitch. Middle: additional vowel transition forslope. Right: additional brightness for curvature
interpretation requires developed listening skills; a problematic choice for auditory graphs asdiscussed in [25].
If we look at the particular case of mathematical function sonification we need to analyzewhat contributes to the understanding of visual plots, i.e., the recognition of shapes based onprinciples of visual gestalt perception. These shapes are a perceptual unit and do not fall apartinto constituent elements like function value and slope. Auditory graphs with this perceptualgoal in mind were designed by Grond et al. in [32]. The integration of the first two derivativesof the function of interest into the mapping should help to create individual sonic fingerprintsfor each position on the x-axis, so that the function properties could be assessed at any xposition as a steady sound independently of a progression in time, i.e., along the x-axis. Themapping of function value to pitch was an orthodox choice. The slope was additionallymapped to the vowel transition [a:]–[i:] and the curvature to vowel brightness. This resultedin a single auditory stream of articulated timbre variations according to function shapes. Acombined spectrogram of both stereo channels can be seen in Figure 15.4, which correspondsto sound example S15.7. An evaluation of this mapping strategy demonstrated the improvedauditory contrast between similar functions over simple pitch mapping strategies. Howeverthis contrast was considerably weaker in an interactive exploration context, which suggeststhat this approach did not succeed in capturing the spatial and time-invariant aspects of visualshapes.
The results of over 25 years of research illustrate the potential of PMSon for auditorygraphs as well as the need for further research and development of methods to include somekey properties of their visual counterparts in order to maximize the potential to conveyinformation through sound.
15.9 Vowel / Formant based PMSon
As stated above the principal tenets of effective sonification include the ability to commu-nicate information with intuitive and easily learned auditory cues. An example of intuitivemapping would be the use of a physical model of an acoustic generator in which the para-meter mapping creates a correspondence between change in data and change in sound. Aninteresting and effective example of this is the sonification of a rolling ball by Rath et al. [60]
Parameter Mapping Sonification 379
and Lagrange et al. [49] (see also chapter 13).
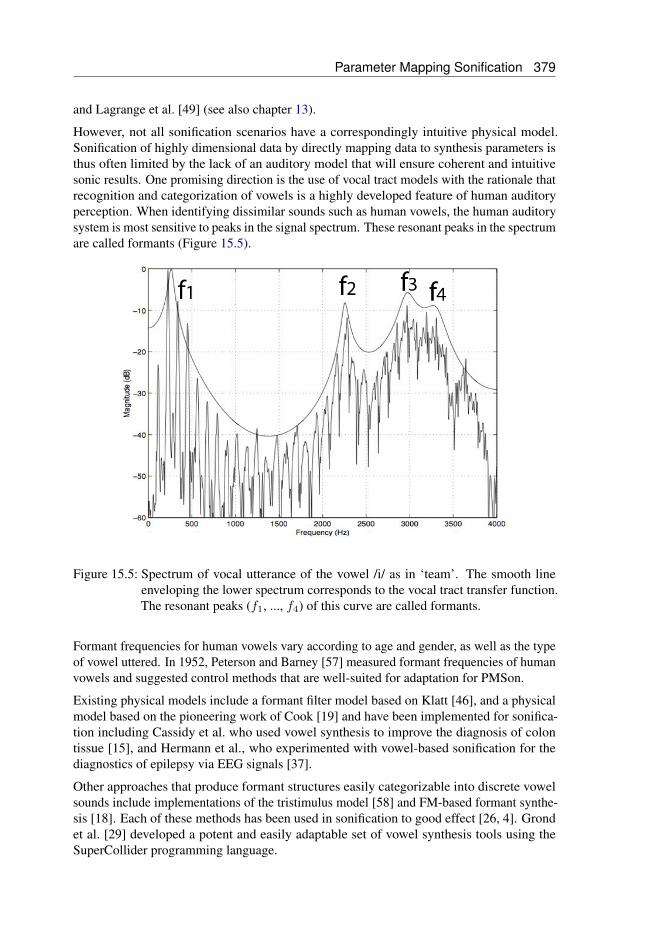
However, not all sonification scenarios have a correspondingly intuitive physical model.Sonification of highly dimensional data by directly mapping data to synthesis parameters isthus often limited by the lack of an auditory model that will ensure coherent and intuitivesonic results. One promising direction is the use of vocal tract models with the rationale thatrecognition and categorization of vowels is a highly developed feature of human auditoryperception. When identifying dissimilar sounds such as human vowels, the human auditorysystem is most sensitive to peaks in the signal spectrum. These resonant peaks in the spectrumare called formants (Figure 15.5).
Figure 15.5: Spectrum of vocal utterance of the vowel /i/ as in ‘team’. The smooth lineenveloping the lower spectrum corresponds to the vocal tract transfer function.The resonant peaks (f1, ..., f4) of this curve are called formants.
Formant frequencies for human vowels vary according to age and gender, as well as the typeof vowel uttered. In 1952, Peterson and Barney [57] measured formant frequencies of humanvowels and suggested control methods that are well-suited for adaptation for PMSon.
Existing physical models include a formant filter model based on Klatt [46], and a physicalmodel based on the pioneering work of Cook [19] and have been implemented for sonifica-tion including Cassidy et al. who used vowel synthesis to improve the diagnosis of colontissue [15], and Hermann et al., who experimented with vowel-based sonification for thediagnostics of epilepsy via EEG signals [37].
Other approaches that produce formant structures easily categorizable into discrete vowelsounds include implementations of the tristimulus model [58] and FM-based formant synthe-sis [18]. Each of these methods has been used in sonification to good effect [26, 4]. Grondet al. [29] developed a potent and easily adaptable set of vowel synthesis tools using theSuperCollider programming language.
380 Grond, Berger
15.10 Features of PMSon
The potential benefits of PMSon include the possibility of highly effective multivariatedisplays and the potential to represent both physical and data spaces in a variety of waysthat allow for exploration and observation monitoring (See also chapter 18). PMSon ispotentially useful in a wide range of applications from data mining to assistive technology forthe visually impaired. Computational speeds of real-time sound synthesis systems, efficientand flexible network protocols (for example, [84]), and a number of parameter mappingsoftware tools like the Sonification sandbox [78] and SONArt [5] make real-time PMSonquite feasible for a host of applications. (See also chapter 10.)
Coming back to our introductory example of the boiling teapot, assuming appropriate meansof transmission and reception one could as readily monitor the sensor in a teapot whilein Qandahar as when sitting beside it in Palo Alto. Using sensors, whether proximate orremote, to transmit data, PMSon has been implemented to display diverse tasks includingnavigation, kinematic tracking, medical, environmental, geophysical, oceanographic andastrophysical sensing. In addition to numerical datasets, PMSon has been used to sonify staticand moving images. Sonification of human movement, for example, is used in diagnosticand rehabilitative medicine [81], and athletic training (including golf, rowing, iceskating,and tai-chi) [47, 76].
15.10.1 Multidimensional mapping for multivariate display
Even the most compact representations of sound are multidimensional. Depending uponcontext, the contributory dimensions that make up a sound can alternately be heard as anintegrated whole or segregated into independent components. Humans are adept at processingand interpreting some degree of multiple simultaneously sounding signals. Thus PMSonseems naturally amenable to auditory display of multivariate data.
Contributing factors in the perception of sound include frequency, duration, magnitude,spectrum, and spatial orientation and their musical correlates, pitch, rhythm and tempo,dynamics and timbre. Time-variant attributes include onset character and spectral flux, aswell as characteristics that involve the integration of multiple parameters such as distancewhich integrates loudness, spectral character and reverberation. The ability to effectivelysimulate a sound moving through illusory space adds yet another perceptual cue, potentiallyuseful in auditory display. Most importantly, the perceptual features of stream segregationand integration in auditory scene analysis provide a basis for sonification that can, withinperceptual limits, display data polyphonically as discrete data streams mapped to independentsounds, or monophonically, as single sounds in which one or more data dimensions aremapped to sound dimensions.
The use of digitally synthesized sound to display multidimensional data was used by MaxMatthews in the early 1970s with the mapping of three dimensions of a five-dimensionaldataset to three sound parameters, while presenting the remaining two dimensions on astandard scatterplot. The mappings were pitch (150–700 Hz, quantized as chromatic pitches),spectral content using additive synthesis, and amplitude modulation varying the amplitude ofa 15 Hz modulator. Experiments with a number of scientific datasets suggested the approachto be effective.
Parameter Mapping Sonification 381
One of the earliest validating experiments of PMSon was Yeung’s work on pattern recognitionby audio representation of multivariate analytical data [86] in which data was mapped toregister, loudness, decay time, left-right localization, duration and period of silence. Yeungallowed subjects two training sessions before they performed a classification task involvingthe presence of metals in a sample. Accuracy in the classification test was remarkably high.
Since that time the promise and allure of PMSon of data has been of persistent interest to agrowing community of researchers. Principles of PMSon design have been proposed notablyBrewster et al. [13], Walker and Kramer [79] and Barass [3]. However standard practiceshave yet to be broadly adopted.
15.10.2 Exploratory, observational and hybrid PMSon
Broadly speaking, PMSon can be used for two purposes, spatial exploration of data orexploratory PMSon, and monitoring sequential data (observational PMSon). ExploratoryPMSon can be useful both for physical and virtual data spaces. Observational PMSon is usefulwith time series or sequential data streams. In some instances exploratory sonification isdone on temporal data. We refer to this exploratory-observational approach as hybrid PMSon.From the user perspective the primary distinction between exploratory and observationalPMSon is contingent upon the mode of inquiry which can either be sequential, which we referto as scanning, or non-sequential, which we term probing [85]. Model-based sonification(MBS, see chapter 16) of which, some examples employ PMSon, provides a means ofsystematically sonifying data in the absence of an inherent time domain.
Exploratory PMSon
Effective mapping of spatial or relational information to time is key for useful exploratorysonification. Geometric display, that is, representing the properties and relations of mag-nitudes in a data vector, can be used to navigate and probe for diagnostic or analyticalpurposes. Exploratory PMSon has been used to display a wide range of complex dataincluding EEG [40], turbulence [6], meteorological data [59], hyperspectral imaging [15],and geophysical data, as well as providing a means to display hierarchical data such as treesand graphs [72].
Auditory exploration of spatial states is routine in many everyday tasks. We tap on plaster-covered sheet rockhouse walls to determine whether there is a cross-beam or hollow spacebehind the surface. We slap a watermelon to determine whether it will be sweet and ripe.A physician listens to respiration, circulation and digestion using an archaic technology toevaluate respiratory state of her patient 6. Analogous PMSon methods allow the user toprobe vectors of data with the purpose of locating a target sound that closely matches apredetermined source sound. If the source sound is readily categorizable and the range ofdifferentiation in the auditory mappings is sufficiently wide then it is quite possible to train auser to locate and identify particular data states. For example, a vocal tract model in whichparticular data states were anchored to specific phoneme sounds provided a remarkablyintuitive sonification scheme [15].
6For a fascinating historical statement on the impact of Laennec and Auenbrugger see Edward Otis’ 1898Presidential speech to the Massachusetts’ Medical Society [56]
382 Grond, Berger
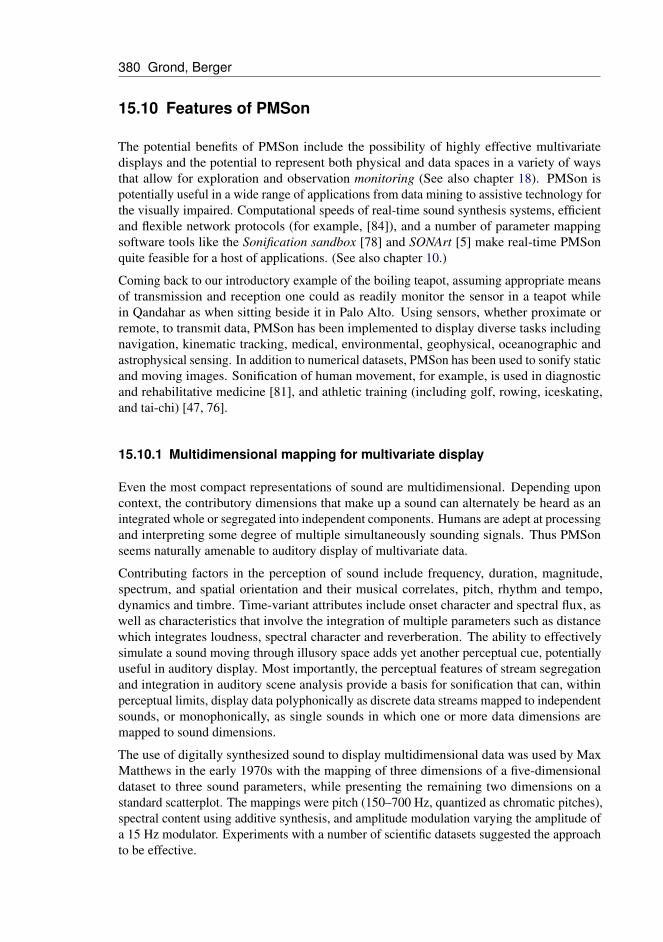
Figure 15.6: Viewer applet with Hyperspectral image of colon cell in window
In the area of auditory display, indeed in virtually all sonic situations, time is not just yetanother parameter but rather the principal dimension to which all other auditory parametersaddress. While this may conform well to representing sequential or time series informationstreams, it demands particular consideration when representing spatial or geometric data.This challenge is particularly true when it is useful to have a synoptic overview of data.
A-temporal exploration may integrate scanning with probing data in which arbitrary pointsin a dataset are selectively sonified. Probing is typically necessary in diagnostic situa-tions [15].
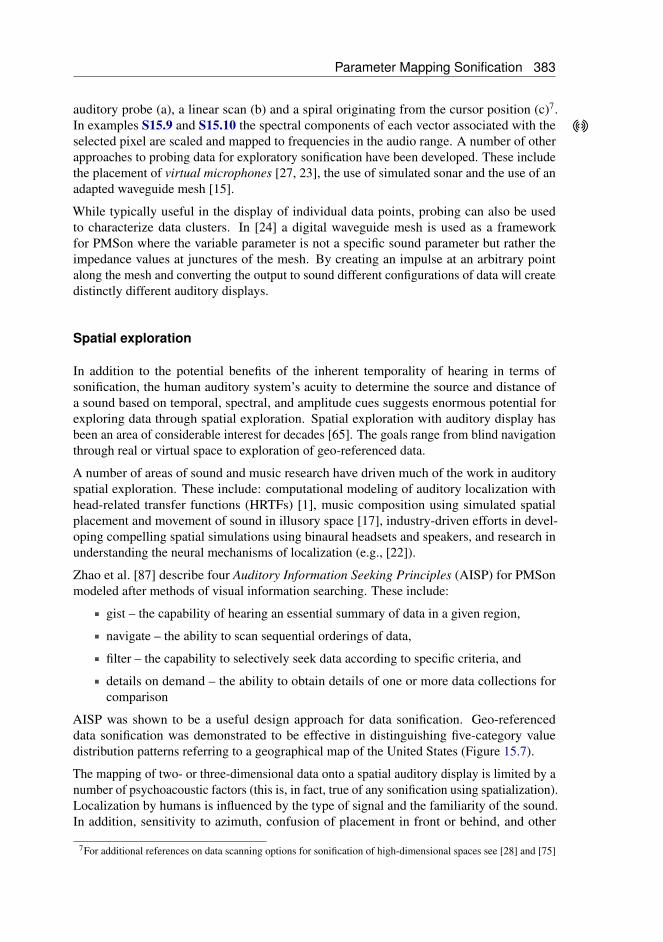
Figure 15.6 illustrates the user interface of a data viewer that provides a hybrid PMSonapproach incorporating both data probing and data scanning. In this example a high di-mensional hyperspectral image of a colon cell is represented visually as a two-dimensionalsurface with each data coordinate represented as a digital color pixel (Fig. 15.6). The vector atany data point can be probed by positioning the cursor over the associated pixel and clickingthe mouse. By holding down the mouse button and dragging, the user can access all thedata that is encountered during the scan. Alternatively, pre-set scan paths can be generatedfrom a given data pixel. Accessed data is then packaged as an OSC message and sent to auser-designated port for sonification. The application allows the user to scan arbitrarily longsequences to gain a general auditory representation of local regions by dragging the cursoracross the image, to hear a particular trajectory (for example a spiral generating from theoriginating pixel) or to probe a particular data point by clicking the mouse on a particularpixel [15]. Sound examples S15.8, S15.9 and S15.10 provide examples of, respectively,
Parameter Mapping Sonification 383
auditory probe (a), a linear scan (b) and a spiral originating from the cursor position (c)7.In examples S15.9 and S15.10 the spectral components of each vector associated with theselected pixel are scaled and mapped to frequencies in the audio range. A number of otherapproaches to probing data for exploratory sonification have been developed. These includethe placement of virtual microphones [27, 23], the use of simulated sonar and the use of anadapted waveguide mesh [15].
While typically useful in the display of individual data points, probing can also be usedto characterize data clusters. In [24] a digital waveguide mesh is used as a frameworkfor PMSon where the variable parameter is not a specific sound parameter but rather theimpedance values at junctures of the mesh. By creating an impulse at an arbitrary pointalong the mesh and converting the output to sound different configurations of data will createdistinctly different auditory displays.
Spatial exploration
In addition to the potential benefits of the inherent temporality of hearing in terms ofsonification, the human auditory system’s acuity to determine the source and distance ofa sound based on temporal, spectral, and amplitude cues suggests enormous potential forexploring data through spatial exploration. Spatial exploration with auditory display hasbeen an area of considerable interest for decades [65]. The goals range from blind navigationthrough real or virtual space to exploration of geo-referenced data.
A number of areas of sound and music research have driven much of the work in auditoryspatial exploration. These include: computational modeling of auditory localization withhead-related transfer functions (HRTFs) [1], music composition using simulated spatialplacement and movement of sound in illusory space [17], industry-driven efforts in devel-oping compelling spatial simulations using binaural headsets and speakers, and research inunderstanding the neural mechanisms of localization (e.g., [22]).
Zhao et al. [87] describe four Auditory Information Seeking Principles (AISP) for PMSonmodeled after methods of visual information searching. These include:
gist – the capability of hearing an essential summary of data in a given region,
navigate – the ability to scan sequential orderings of data,
filter – the capability to selectively seek data according to specific criteria, and
details on demand – the ability to obtain details of one or more data collections forcomparison
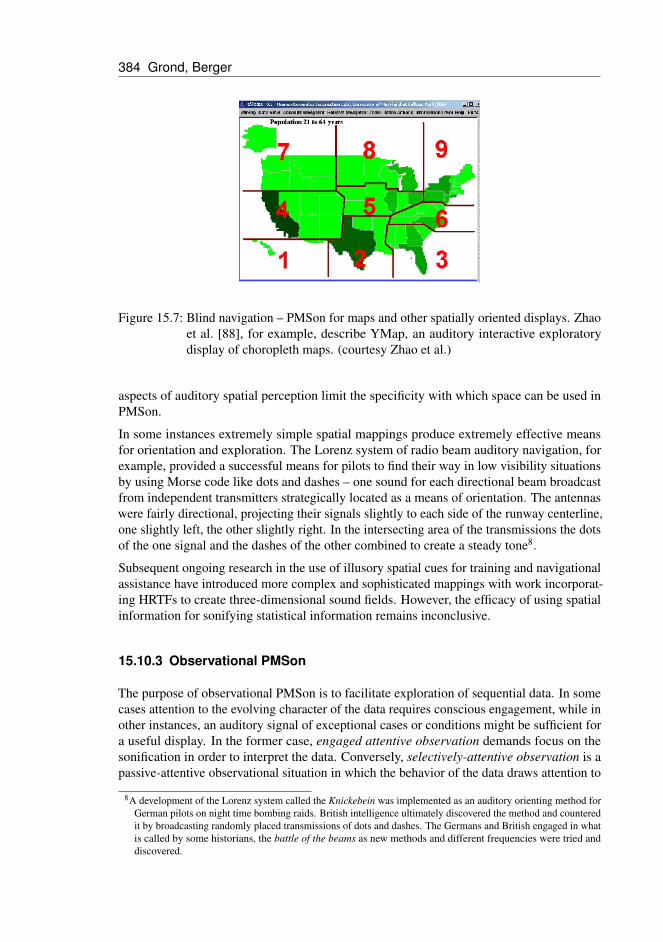
AISP was shown to be a useful design approach for data sonification. Geo-referenceddata sonification was demonstrated to be effective in distinguishing five-category valuedistribution patterns referring to a geographical map of the United States (Figure 15.7).
The mapping of two- or three-dimensional data onto a spatial auditory display is limited by anumber of psychoacoustic factors (this is, in fact, true of any sonification using spatialization).Localization by humans is influenced by the type of signal and the familiarity of the sound.In addition, sensitivity to azimuth, confusion of placement in front or behind, and other
7For additional references on data scanning options for sonification of high-dimensional spaces see [28] and [75]
384 Grond, Berger
Figure 15.7: Blind navigation – PMSon for maps and other spatially oriented displays. Zhaoet al. [88], for example, describe YMap, an auditory interactive exploratorydisplay of choropleth maps. (courtesy Zhao et al.)
aspects of auditory spatial perception limit the specificity with which space can be used inPMSon.
In some instances extremely simple spatial mappings produce extremely effective meansfor orientation and exploration. The Lorenz system of radio beam auditory navigation, forexample, provided a successful means for pilots to find their way in low visibility situationsby using Morse code like dots and dashes – one sound for each directional beam broadcastfrom independent transmitters strategically located as a means of orientation. The antennaswere fairly directional, projecting their signals slightly to each side of the runway centerline,one slightly left, the other slightly right. In the intersecting area of the transmissions the dotsof the one signal and the dashes of the other combined to create a steady tone8.
Subsequent ongoing research in the use of illusory spatial cues for training and navigationalassistance have introduced more complex and sophisticated mappings with work incorporat-ing HRTFs to create three-dimensional sound fields. However, the efficacy of using spatialinformation for sonifying statistical information remains inconclusive.
15.10.3 Observational PMSon
The purpose of observational PMSon is to facilitate exploration of sequential data. In somecases attention to the evolving character of the data requires conscious engagement, while inother instances, an auditory signal of exceptional cases or conditions might be sufficient fora useful display. In the former case, engaged attentive observation demands focus on thesonification in order to interpret the data. Conversely, selectively-attentive observation is apassive-attentive observational situation in which the behavior of the data draws attention to
8A development of the Lorenz system called the Knickebein was implemented as an auditory orienting method forGerman pilots on night time bombing raids. British intelligence ultimately discovered the method and counteredit by broadcasting randomly placed transmissions of dots and dashes. The Germans and British engaged in whatis called by some historians, the battle of the beams as new methods and different frequencies were tried anddiscovered.
Parameter Mapping Sonification 385
a feature of the auditory scene that otherwise may or may not demand attention. For an indepth discussion of monitoring in sonification we refer to chapter 18. Sound example S15.11demonstrates a means of anchoring data by scaling to a particular phoneme [4]. In thisexample, a particular trend in stock market data is detectable by mapping the sound to afrequency modulation synthesis algorithm that can produce vocal formants. This mappingallowed the sonification task to be described as simply ‘you are seeking for a conditiondisplayed when you hear the sung vowel [o] in the sonification’.
15.11 Design Challenges of PMSon
We have thus far discussed PMSon of time-series data (sonified in or out of ‘real-time’), aswell as PMSon for non-temporal data in which information is converted into the time-domainfor auditory display. Processing methods might involve numeric conversion, data filtering, orre-sampling, as well as mapping considerations of parameter association, polarity, scaling,among other decisions.
However, as Lumsden and Brewster noted, the fact remains that sounds are often used in adhoc and ineffective ways [50]. It is important to note that the ineffective use of sound couldwell have as much to do with flaws in preparation of the data. The term signal conditioninghas been used to describe signal processing performed on data for auditory display purposes.These methods include re-sampling, filtering and compression. It is useful to considerthree aspects of parameter association: the polarity of mapping, dimensional scaling andthe need for contextual and referential sounds to orient the listener to an effective auditorydisplay [66].
15.11.1 Polarity
Polarity [77] is the directional mapping of data to a sound parameter. That is, whether, forinstance, an increasing number sequence should be mapped to increasing or decreasingnumbers in the mapped parameter. Whereas mapping the polarity of the rising temperatureof the teapot thermometer to rising pitch seems intuitive enough, some studies suggest thatinverting the polarity of pitch to pressure (that is, decreasing pressure mapped to increasingpitch) is preferable [79, 67]. One confounding factor in polarity is a lack of consistencyin listeners’ mental models. Even musical parameter mappings are not always as intuitiveas generally thought. When one of the authors’ daughter started studying the ‘cello sheconfused pitch direction and the verbal descriptions of ‘higher’ and ‘lower’. This polarityreversal reflected the physical nature of producing progressively ‘higher’ notes on a givenstring by moving the hand downwards.
15.11.2 Scale
It is often, indeed typically, necessary to scale from a data domain that transcends theperceptual limits of hearing such that data values must be scaled to adapt to a perceptuallyuseful range of a particular auditory parameter.
Returning to our tea kettle example, while the unscaled mapping of numeric change between
386 Grond, Berger
temperature and pitch as the water heat rises from 106 F to 212 F seems appropriate enoughto be expressed as a musical octave, it may not serve the purpose of the sonification, whichmay, for example wish to delineate the range between the threshold of pain (130 F) and theboiling point by designating an octave relationship between these points. If the purpose ofsonification is comparative (say, for example, one wishes to hear the temporal differencebetween boiling under varying atmospheric pressures, or perhaps, hear the differencesbetween the boiling points of water, cesium (613 F), tellurium (989 F), and antimony (1750F). These hypothetical analytical tasks exemplify the comparative analytical mode of PMSon.Another PMSon approach involves the integration of data into a single perceptual group (asopposed to discrete segregated data display).
The likelihood is that numeric changes in a data set may have insufficient or inappropriatenumber ranges to be directly mapped to frequency change. Scaling the values is typicallyneeded to effectively represent data in sound. Furthermore, categorical boundaries such asscale degrees are often useful in providing effective sonification. Octave equivalence is afundamental aspect of music perception in a wide swath of cultures. Therefore, it wouldseem that a representation of doubling of a numerical value as the doubling of frequencywould be an appropriate auditory mapping. However, this introduces problems of scaling aswell as of multiplicity.
The perceptual challenges of scaling lie in the absence of uniformity and wide divergenceof perceptual acuity. For example, judgment of the relative loudness of two sounds is bothdifficult and subject to contextual and other biases such as pitch range [52] and duration. Inthe case of loudness perception, the ranges and limits of hearing are fairly well understood.Human hearing is remarkably sensitive. We can hear a sound whose energy is so weak asto move the tympanic membrane a small fraction of the diameter of a hydrogen molecule,while the dynamic range of hearing is in the order of a hundred trillion to one. However theinability to categorize loudness and the highly contextual nature of loudness perception makeit virtually impossible to systematically map data to loudness for anything but relativelycrude associations. These issues are exacerbated by masking phenomena, habituation andsatiation of repeated auditory stimuli, and the startle response, all of which can diminish theeffectiveness of PMSon. That said, frequency-dependent amplitude compensation accordingto psychoacoustically derived guidelines offer a means to appropriately map to loudness.
15.11.3 Context
Just as the use of axes and tick marks in visual graphs provide a referential context, it is oftenessential to provide an auditory reference in PMSon. The challenge is to provide additionalcontextual information without overtaxing or cluttering the auditory scene.
It seems that such context can be very beneficial, but only when it adds information, andnot just clutter, to the display [67]. Since most users have little experience with sonification,training is critical. It remains to be determined how best to provide instruction in sonificationcomprehension. As stated earlier, intuitive and easily learned sounds allow for exceptionalsituations in which the instruction to the listener may be simple and unencumbered. Forexample, in vowel-based sonification one might instruct the user to listen for a particularvowel sound which represents a particular condition in the data.
The greatest challenges of PMSon involve the potential for ambiguity in data interpretation

Parameter Mapping Sonification 387
and the risk of incomprehensibility. Furthermore the lack of standards and ubiquity inmapping strategies often makes sonification research akin to working on the tower of Babel.The challenge remains to establish which mappings optimally represent particular datatypes.
Common agreement on what constitutes the best representative sounds for display, and thedecisions of what data dimension will map to one or more attributes of the selected displaysounds remain elusive. There are, broadly speaking, two approaches: symbolic mapping ofdata to sound (in which case the level of abstraction between the sound and the informationdisplayed is highly variable) and iconic mapping. A third method, specifically, the use ofvocal sounds, is considered here as a special case.
In Walker and Kramer’s 1996 study of parameter mapping [79], subjects controlled operationsof a simulated crystal factory with the task of monitoring temperature, pressure, size andrate using sonification to track the parameters simultaneously. Responses and reaction timeswere monitored by instructing subjects to take action in response to auditory cues. Theseincluded turning on a cooling fan when the heat was rising and turning on a pump whenpressure fell. Loudness, pitch, tempo and onset rise-time were the auditory parameters used.The mappings were interchanged in different experiment trials permuting the mappings inwhat the researchers thought would be graduated from most intuitive to seemingly randommappings seen in Table 15.3.
representation temperature pressure rate sizeintuitive pitch onset tempo loudness
okay loudness pitch onset tempobad onset tempo loudness pitch
random tempo loudness pitch onset
Table 15.3: Crystal factory mappings (from Walker & Kramer [79])
Surprisingly, both accuracy and reaction time measurements suggested that the Bad andRandom mappings were more effective than the Intuitive or Okay groups. Furthermore,changing the polarity radically altered these assessments. Ultimately, the most effectivemappings that were found are compiled in Table 15.4:
temperature loudnessrate pitch
onset sizeineffective tempo
Table 15.4: Effective mappings in Walker and Kramer’s 1996 study
Another specific challenge for PMSon is the lack of a consistent set of perceptual guidelinesto distinguish when context sounds are critical and when they are unnecessary or evenobtrusive additions to the auditory display.
In some instances changes in one dimension affect perception in another (for example, con-

388 Grond, Berger
sider how pitch affects loudness perception). Furthermore, many aspects of human hearingare nonlinear and thus the degree of sensitivity is highly variable across auditory dimensions.For example, humans can hear in the order of ten octaves. Discriminatory difference limenhowever differ dramatically across this range. Whereas frequency differences as small asone Hertz can be detected around one kHz the JND at 100 Hz is about three Hertz.
Principles of auditory scene analysis [12] provide the groundwork for perceptually valid soni-fication, particularly as it relates to streaming. Understanding the likelihood for formation ofperceptual streams is key in building displays that will reliably convey the information to thelistener [82]. Conversely, unanticipated perceptual grouping can undermine the effectivenessof auditory display, even when the stimulus was designed to be aurally interesting andappealing. A comparative study of psychophysical scaling of PMSon on sighted and visuallyimpaired listeners suggests that establishing perceptual magnitude scales of sonification isfurther complicated by inconsistency across the two populations [80].
A particular challenge to effective PMSon is the absence of a perceptual metric for timbre. Asdemonstrated with synthetic phoneme-based sonification [4], timbre can be highly effectivein revealing data. Within the sonification community relative timbre assessment has beenused as a basis for data representation including the utilization of vowel space as an intuitivecategorical space [15], crystallization sonification [42], and numerous applications in whichtraditional musical instrument sounds were used to represent data. Alas, since there iscurrently no perceptually valid metric that quantifies the distance between two particularsounds, the use of timbre is restricted to rather broad classes of sounds and necessarilylacks the nuance and fine gradations needed for auditory display of highly detailed data.Recent research on timbre space models [70] while promising, remain incomplete andinconclusive.
There is no consistent guiding set of principles regarding how to train listeners for a soni-fication task. Effective sonification must be intuitive and easily learned. Training shouldoptimally be a minimal investment in time. The issue of training in how to comprehend andinterpret a sonification is addressed in [66]. It is useful to consider how auditory display indirect audification tasks such as medical auscultation is taught.
While visualization has considerable groundwork in this regard, the perceptual reliability ofparameter mapping sonification has piecemeal evidence.
There is empirical support for the ability to interpret a sonified trace of a two-dimensionalline graph with one or two data dimensions [14]. Considerable evidence also supports theability to trace the sonified borders of two-dimensional geometric shapes [73].
15.12 Synthesis and signal processing methods used inPMSon
Most existing PMSon applications use frequency, time, intensity, and, in a broad sense, tim-bre (often as MIDI-based instrument mapping) as principal mapping parameters. However,it is useful to consider synthesis and parameter mappings whose auditory results are notnecessarily directly identifiable as a basic parameter, but that nonetheless may have identifi-able characteristic auditory display properties. For more information on sound synthesis inssonification see also chapter 9.
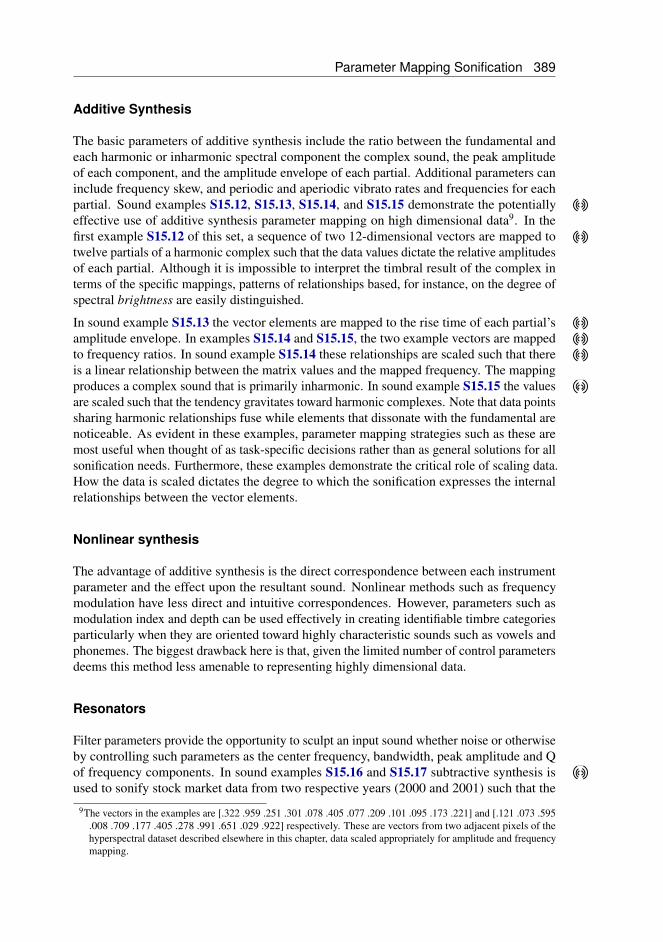
Parameter Mapping Sonification 389
Additive Synthesis
The basic parameters of additive synthesis include the ratio between the fundamental andeach harmonic or inharmonic spectral component the complex sound, the peak amplitudeof each component, and the amplitude envelope of each partial. Additional parameters caninclude frequency skew, and periodic and aperiodic vibrato rates and frequencies for eachpartial. Sound examples S15.12, S15.13, S15.14, and S15.15 demonstrate the potentiallyeffective use of additive synthesis parameter mapping on high dimensional data9. In thefirst example S15.12 of this set, a sequence of two 12-dimensional vectors are mapped totwelve partials of a harmonic complex such that the data values dictate the relative amplitudesof each partial. Although it is impossible to interpret the timbral result of the complex interms of the specific mappings, patterns of relationships based, for instance, on the degree ofspectral brightness are easily distinguished.
In sound example S15.13 the vector elements are mapped to the rise time of each partial’samplitude envelope. In examples S15.14 and S15.15, the two example vectors are mappedto frequency ratios. In sound example S15.14 these relationships are scaled such that thereis a linear relationship between the matrix values and the mapped frequency. The mappingproduces a complex sound that is primarily inharmonic. In sound example S15.15 the valuesare scaled such that the tendency gravitates toward harmonic complexes. Note that data pointssharing harmonic relationships fuse while elements that dissonate with the fundamental arenoticeable. As evident in these examples, parameter mapping strategies such as these aremost useful when thought of as task-specific decisions rather than as general solutions for allsonification needs. Furthermore, these examples demonstrate the critical role of scaling data.How the data is scaled dictates the degree to which the sonification expresses the internalrelationships between the vector elements.
Nonlinear synthesis
The advantage of additive synthesis is the direct correspondence between each instrumentparameter and the effect upon the resultant sound. Nonlinear methods such as frequencymodulation have less direct and intuitive correspondences. However, parameters such asmodulation index and depth can be used effectively in creating identifiable timbre categoriesparticularly when they are oriented toward highly characteristic sounds such as vowels andphonemes. The biggest drawback here is that, given the limited number of control parametersdeems this method less amenable to representing highly dimensional data.
Resonators
Filter parameters provide the opportunity to sculpt an input sound whether noise or otherwiseby controlling such parameters as the center frequency, bandwidth, peak amplitude and Qof frequency components. In sound examples S15.16 and S15.17 subtractive synthesis isused to sonify stock market data from two respective years (2000 and 2001) such that the
9The vectors in the examples are [.322 .959 .251 .301 .078 .405 .077 .209 .101 .095 .173 .221] and [.121 .073 .595.008 .709 .177 .405 .278 .991 .651 .029 .922] respectively. These are vectors from two adjacent pixels of thehyperspectral dataset described elsewhere in this chapter, data scaled appropriately for amplitude and frequencymapping.
390 Grond, Berger
resonances express formant regions producing vowel like sounds that identify particulartrends[4].
Physical models
As mentioned previously, physical models, in which the physical properties and mechanicsof an acoustic sound generator is modeled using a variety of digital filtering methods providea means to map a combination of data to create complex timbral characters (such as vowelsand phonemes). Mapping data to one or more of the filter controls is a potentially effectivemethod of PMSon. Physical models ranging from adaptations of the simple Karplus-Strongplucked string model to more complex models such as Cook’s physical model of the vocaltract have been effectively used for parameter mapping sonification. An example of phyisicalmodel based sonification is the use of a two dimensional waveguide mesh to sonify proximityto data clusters S15.18 and S15.19. In these examples, coded by Greg Sell, the popular gameBattleship is simulated such that the ’ship’ coordinates are mapped to the scatter functions onjunctions along the two dimensional mesh. The proximity of a probe to target data clusters,as well as characteristics of the cluster are audible.
Spectral mapping sonification
Resonators and other digital filter instruments provide a means of mapping multiple time-variant data streams to a sound complex such that the timbral distortion of the sound canprovide useful information about pattern embedded in the data. Another approach to this goalis spectral mapping sonification [40] in which the frequency bands of the short-term Fouriertransform of each time series (in this case EEG data channels) is mapped to a waveformoscillator with parametric control of frequency and amplitude such that the frequency bandis mapped to the time-variant oscillator frequency and the energy is mapped to its amplitude.By ‘tuning’ the bands to a musically consonant interval (in this case a perfect fifth) theresulting sonification is perceptually pleasing and characteristics of the overall EEG areevident.
15.13 Artistic applications of PMSon
Finally we consider the use of PMSon for artistic creation (sometimes referred to as musifica-tion which includes sonifying a-temporal datasets (DNA, for instance, has inspired numerousmusical works), time-based datasets such as solar activity 10, tides, and meteorologicalrecords 11.
The use of geometric relationships and mathematical processes have inspired composers forcenturies. Famous examples include the use of the architectural proportions of Brunelleschi’sBasilica di Santa Maria del Fiore in Dufay’s Nuper Rosarum Flores (1436) , and Xenakis’
10examples can be found in Sol (2005) [31] http://www.sol-sol.de and Brilliant Noise (2006) by semi-conductor http://www.semiconductorfilms.com last checked: 20/08/2011
11see for instance Flood Tide (2008) and Hour Angle (2008) by Eacott: http://www.informal.org lastchecked: 20/08/2011
Parameter Mapping Sonification 391
mapping of statistical and stochastic processes to sound in Metastasis (1965) and otherworks 12.
Another approach to PMSon for musical purposes is the mapping of geographical coordi-nates to sound. Larry Austin’s Canadian Coastlines: Canonic Fractals for Musicians andComputer Band (1981) in which the traced coastal contour dictated compositional data. Amore recent creative example of PMSon is Jonathan Berger’s Jiyeh (2008)13, (of which thereare two versions, one for eight channel computer-generated audio, and another for violin, per-cussion, cimbalom, and string orchestra). Jiyeh maps the contours of oil dispersion patternsfrom a catastrophic oil spill in the Mediterranean Sea. Using a sequence of satellite images,the spread of the oil over a period of time was, in the electroacoustic version, sonified andscaled both temporally and spatially to provide a sense of the enormity of the environmentalevent.
PMSon has been used in sonifying biofeedback. Alvin Lucier’s work Music for Solo Per-former (1965) sounds the composer’s brain activity through electroencephalogram scalpelectrodes and used the speaker output to resonate percussion instruments (an indirect map-ping into instrumental space that, while musically effective renders only limited meaningfulinformation).
Electroencephalography has provided source material for a number of composers. Knappet al. at the Music, Sensors, and Emotion (MUuSE) lab at the Sonic Art Research Centre(SARC) at Queen’s University Belfast 14, continually develop and explore tools to monitorvarious electrical activities of the body through electroencephalogram, electrooculogram,electrocardiogram, and electromyogram, and translate this data into MIDI control messagesand other musical signal representations.
Image based sonifications used for artistic purposes have been realized with the softwareSONART [5]. Tanka has created various works that translate images into sounds amongstwhich Bondage (2004) [69] maps an image to spectral sound features. A similar approachcan be found in Grond’s Along the Line (2008) 15, which explores space filling curves as ameans for spectral mapping.
A great deal of works involving PMSon in motion-tracked dance [53] have been created,and a number of robust software environments such as Isadora 16 have been developed tosupport these efforts. A number of sound installations use environmental data includingBerger’s Echos of Light and Time (2000) which continually polled the intensity of sunlightand temperature over 18 months in a collaboration with sculptor Dale Chihuly. Halbig’sAntarktika (2006) 17 translates ice-core data reflecting the climatic development of our planetinto the score for a string quartet. Chafe’s Tomato Quintet (2007,2011) 18 sonifies the ripeningprocess of tomatoes. The ripening process mapped carbon dioxide, temperature and light
12For a collection of ‘historic’ sonifications and mappings see: http://locusonus.org/nmsat last checked:20/08/2011
13http://ccrma.stanford.edu/~brg/jiyeh/ last checked: 20/08/201114http://www.somasa.qub.ac.uk/~MuSE/?cat=1 last chacked: 20/08/201115http://www.grond.at/html/projects/along_the_line/along_the_line.htm
last checked: 20/08/201116http://www.troikatronix.com/isadora.html last checked: 20/08/201117http://www.antarktika.at last checked: 20/08/201118https://ccrma.stanford.edu/~cc/shtml/2007tomatoQuintet.shtml
last checked: 20/08/2011

392 Grond, Berger
readings from sensors in each vat to synthesis and processing parameters. Subsequently, theduration of the resulting sonification was accelerated to different time scales.
15.14 Conclusion
Virtually every domain of research has been marked by an explosive rise in data. Scientificand diagnostic data has become not only more voluminous but also far more complex. Theneed for effective exploratory analysis of that data bears new demands for novel methods ofinterpretation and representation.
Mapping of a data parameter to an auditory parameter is, in some cases, the most appropriatemeans of representing a data trend. This is particularly true when the purpose of the displayis to represent general trends. The rise and fall of temperature or commodity prices, forexample, can be readily heard. Furthermore, simultaneous display of multiple trends canoften be effectively represented by segregating the mode of representation by distinguishingdata sets according to basic principles of auditory scene analysis. For example, we candistinguish between temperature changes in two locations by spatially segregating the twosets. Similarly, we can retain coherent independent auditory scenes by representing two datasets with highly contrasting timbres.
The degree to which we can maintain perceived integrity of multiple simultaneously displayeddata sets is dependent partly upon the degree of parameter segregation maintained and toindividual abilities.
As new tools and mappings emerge PMSon will undoubtedly continue to seek new meth-ods of auditory display. Among the challenges to be sought is to reach beyond auditoryrepresentation of the gestalts of curves (as in auditory graphs) to represent shapes in higherdimensional data sets.
The opportunities and challenges of PMSon are complicated by the inherent perceptualentanglement of sound synthesis and processing parameters, which constitute the two bigchallenges in the formalization of the mapping function. Establishing perceptually validmappings between data and signal synthesis and/or processing parameters is key. Thisperceptual validity includes not only clearly audible categorical boundaries but also theability to express data with variation in parameter changes that produce appropriately smoothtransitions. Thus, the ‘punchline’ of this chapter is that it is crucial to fully understand themutual influences between data preparation and the selected sound synthesis method, inorder to design a successful auditory display with PMSon.
The PMSon design process diagram in Figure 15.1 is meant to provide the sonificationdesigner with practical guidelines. We hope this diagram helps to identify and to address allchallenges when conceptualizing, programming, tuning, reimplementing, and last but notleast listening to the sounds of a PMSon.
Bibliography
[1] N. H. Adams and G. H. Wakefield. State-space synthesis of virtual auditory space state-space synthesis ofvirtual auditory space state-space synthesis of virtual auditory space. IEEE Transactions on Audio, Speechand Language Processing, 16(5):881–890, July 2008.
Parameter Mapping Sonification 393
[2] S. Barrass. Auditory Information Design. PhD thesis, Australian National University, 1997.
[3] S. Barrass. Some golden rules for designing auditory displays. In R. Boulanger, editor, Csound Textbook –Perspectives in Software Synthesis, Sound Design, Signal Processing and Programming. MIT Press, 1998.
[4] O. Ben-Tal and J. Berger. Creative aspects of sonification. Leonardo, 37(3):229–232, 2004.
[5] O. Ben-Tal, J. Berger, P. R. Cook, M. Daniels, and G. Scavone. SonART: The sonification application researchtoolbox. In R. Nakatsu and H. Kawahara, editors, Proceedings of the 8th International Conference on AuditoryDisplay (ICAD2002), Kyoto, Japan, July 2-5 2002. Advanced Telecommunications Research Institute (ATR),Kyoto, Japan.
[6] M. M. Blattner, R. M. Greenberg, and M. Kamegai. Listening to turbulence: An example of scientificaudiolization. In M. M. Blattner and R. Dannenberg, editors, Multimedia Interface Design, pages 87–107.Addison-Wesley, 1992.
[7] T. L. Bonebright. A suggested agenda for auditory graph research. In E. Brazil, editor, Proceedings of the11th International Conference on Auditory Display (ICAD 2005), pages 398–402, Limerick, Ireland, 2005.Department of Computer Science and Information Systems, University of Limerick.
[8] T. L. Bonebright, M. A. Nees, T. T. Connerley, and G. R. McCain. Testing the effectiveness of sonified graphsfor education: A programmatic research project. In Proc. Int. Conf. Auditory Display, pages 62–66. Citeseer,2001.
[9] T. Bovermann, T. Hermann, and H. Ritter. AudioDB. Get in Touch With Sound. In Proceedings of the 14thInternational Conference on Auditory Display (ICAD 2008), Paris, France, 2008. inproceedings.
[10] T. Bovermann, J. Rohrhuber, and H. Ritter. Durcheinander. understanding clustering via interactive sonification.In Proceedings of the 14th International Conference on Auditory Display (ICAD 2008), Paris, France, 2008.inproceedings.
[11] T. Bovermann, R. Tünnermann, and T. Hermann. Auditory augmentation. International Journal of AmbientComputing and Intelligence (IJACI), 2(2):27–41, 2010.
[12] A. S. Bregman. Auditory scene analysis: The perceptual organization of sound. MITPress, September 1994.
[13] S. A. Brewster. Providing a structured method for integrating non-speech audio into human-computerinterfaces. PhD thesis, University of York, York, UK, 1994.
[14] L. M. Brown and S. A. Brewster. Drawing by Ear: Interpreting Sonified Line Graphs. In Proceedings of the9th International Conference on Auditory Display (ICAD 2002), Boston, Mass., USA, 2003.
[15] R. J. Cassidy, J. Berger, K. Lee, M. Maggioni, and R. R. Coifman. Auditory display of hyperspectral colontissue images using vocal synthesis models. In S. Barrass and P. Vickers, editors, Proceedings of the 10thInternational Conference on Auditory Display (ICAD 2004), Sydney, Australia, 2004.
[16] M. Chion. Guide To Sound Objects: Pierre Schaeffer and Musical Research, trans. John Dack and ChristineNorth. Éditions Buchet/Chastel, 1983.
[17] J. M. Chowning. The simulation of moving sound sources. Computer Music Journal, 1(3):48–52, June 1977.
[18] J. M. Chowning. Frequency modulation synthesis of the singing voice. In M. V. Mathews and J. R. Pierce,editors, Current Directions in Computer Music Research Cambridge, pages 57–63. MIT Press, 1980.
[19] P. R. Cook. Identification of Control Parameters in an Articulatory Vocal Tract Model, with Applications to theSynthesis of Singing (CCRMA thesis). PhD thesis, Elec. Engineering Dept., Stanford University (CCRMA),Dec, 1990.
[20] A. Csapo and P. Baranyi. Perceptua interpolation and open-ended extrapolation of auditory icons and earcons.In Proceedings of the 17th International Conference on Auditory Display (ICAD 2011), June 20 – 24 2011.
[21] A. deCampo. Toward a data sonification design space map. In Gary P Scavone, editor, Proceedings of the13th International Conference on Auditory Display, pages 342–347, Montreal, Canada, 2007. Schulich Schoolof Music, McGill University, Schulich School of Music, McGill University.
[22] S. Devore and B. Delgutte. Effects of reverberation on the directional sensitivity of auditory neurons across thetonotopic axis: Influences of interaural time and level differences. The Journal of Neuroscience, 30(23):7826–7837, June 2010.

394 Grond, Berger
[23] N. Diniz, M. Demey, and M. Leman. An interactive framework for multilevel sonification. In B. Bresin,T. Hermann, and A. Hunt, editors, Proceedings of ISon 2010, 3rd Interactive Sonification Workshop, KTH,Stockholm, Sweden, April 7, 2010, 2010.
[24] J. Feng, D. Yi, R. Krishna, S. Guo, and Buchanan-Wollaston V. Listen to genes: Dealing with microarray datain the frequency domain. PLoS ON, 4:e5098, April 2009.
[25] J. H. Flowers. Thirteen years of reflection on auditory graphing: Promises, pitfalls, and potential newdirections. In Proceedings of ICAD 05-Eleventh Meeting of the International Conference on Auditory Display,,Ireland, Limerick, July 6–9 2005.
[26] J. Fox, J. Carlisle, and J. Berger. Sonimime: sonification of fine motor skills. In Proceedings of the 11thMeeting of the International Conference on Auditory Display (ICAD 2005), Limerick, Ireland, July 6–9 2005.
[27] M. Gröhn and T. Takala. Magicmikes – multiple aerial probes for sonification of spatial datasets. In G. Kramerand S. Smith, editors, Proceedings of the 2nd International Conference on Auditory Display, pages 271–272,Santa Fe, New Mexico, 1994.
[28] F. Grond. Organized Data for Organized Sound Space Filling Curves in Sonification. In G. P. Scavone, editor,Proceedings of the 13th International Conference on Auditory Display, pages 476–482, Montreal, Canada,2007. Schulich School of Music, McGill University, ICAD.
[29] F. Grond, T. Bovermann, and T. Hermann. A supercollider class for vowel synthesis and its use for sonification.In D. Worrall, editor, Proceedings of the 17th International Conference on Auditory Display (ICAD 2011),Budapest, Hungary, June 20–24 2011. OPAKFI.
[30] F. Grond, T. Droßard, and T. Hermann. SonicFunction Experiments with a Functionbrowser for the Blind. InProceedings of the 16th International Conference on Auditory Display (ICAD 2010), pages 15–21, WashingtonD.C., 2010. ICAD.
[31] F. Grond, F. Halbig, J. M. Jensen, and T. Lausten. SOL Expo Nr.16. ISSN 1600-8499. Esbjerg Kunstmuseum,Esbjerg, Denmark, 2005.
[32] F. Grond and T. Hermann. Singing function, exploring auditory graphs with a vowel based sonification.Journal on Multimodal User Interfaces, 2011 in press.
[33] F. Grond, O. Kramer, and T. Hermann. Interactive sonification monitoring in evolutionary optimization.In D. Worrall, editor, Proceedings of the 17th International Conference on Auditory Display (ICAD 2011),Budapest, Hungary, June 20 - 24 2011. OPAKFI.
[34] L. Harrar and T. Stockman. Designing auditory graph overviews: An examination of discrete vs. continuoussound and the influence of presentation speed. In G. P. Scavone, editor, Proceedings of the 13th InternationalConference on Auditory Display (ICAD2007), pages 299–305, Montreal, Canada, 2007. Schulich School ofMusic, McGill University.
[35] S. Haykin. Neural networks - A comprehensive foundation (2nd ed.), chapter Chapter 9 "Self-organizingmaps". Prentice-Hall, 1999.
[36] T. Hermann. Sonification for Exploratory Data Analysis. PhD thesis, Bielefeld University, 2002.
[37] T. Hermann, G. Baier, U. Stephani, and H. Ritter. Vocal sonification of pathologic EEG features. InT. Stockman, editor, Proceedings of the 12th International Conference on Auditory Display, pages 158–163,London, UK, 06 2006. International Community for Auditory Display (ICAD), Department of ComputerScience, Queen Mary, University of London UK.
[38] T. Hermann, G. Baier, U. Stephani, and H. Ritter. Kernel Regression Mapping for Vocal EEG Sonification. InProceedings of the 14th International Conference on Auditory Display, Paris, France, 2008.
[39] T. Hermann, K. Bunte, and H. Ritter. Relevance-based interactive optimization of sonification. In W. Martens,editor, Proceedings of the 13th International Conference on Auditory Display, pages 461–467, Montreal,Canada, 06 2007. International Community for Auditory Display (ICAD), ICAD.
[40] T. Hermann, P. Meinicke, H. Bekel, H. Ritter, H. Müller, and S. Weiss. Sonification for EEG Data Analysis. InR. Nakatsu and H. Kawahara, editors, Proceedings of the 2002 International Conference on Auditory Display,pages 37–41, Kyoto, Japan, July 2002. International Community for Auditory Display (ICAD), ICAD.
[41] T. Hermann and H. Ritter. Listen to your data: Model-based sonification for data analysis. In G. E. Lasker,editor, Advances in intelligent computing and multimedia systems, pages 189–194, Baden-Baden, Germany,
Parameter Mapping Sonification 395
08 1999. Int. Inst. for Advanced Studies in System research and cybernetics.
[42] T. Hermann and H. Ritter. Crystallization sonification of high-dimensional datasets. ACM Trans. AppliedPerception, 2(4):550–558, 10 2005.
[43] A. Hunt and M. M. Wanderley. Mapping performer parameters to synthesis engines. Invited article forOrganised Sound, special issue on Mapping, 7(2):97–108, 2002.
[44] A. D. Hunt, M. Paradis, and M. M. Wanderley. The importance of parameter mapping in electronic instrumentdesign. Invited paper for the Journal of New Music Research, SWETS, special issue on New Interfaces forMusical Performance and Interaction,, 32(4):429–440, December 2003 2003.
[45] I. T. Jolliffe. Principal Component Analysis. Springer-Verlag, 1986.
[46] D. H. Klatt. Software for a cascade/parallel formant synthesizer. Journal of the Acoustical Society of America,67(3):971–995, March 1980.
[47] M. Kleiman-Weiner and J. Berger. The sound of one arm swinging: A model for multidimensional auditorydisplay of physical motion. In Proceedings of the 12th International Conference on Auditory Display, London,UK, 2006.
[48] G. Kramer. Auditory Display: Sonification, Audification, and Auditory Interfaces. Perseus Publishing, 1993.
[49] M. Lagrange, G. Scavone, and P. Depalle. Time-domain analysis / synthesis of the excitation signal in a source/ filter model of contact sounds. In Proceedings of the 14th International Conference on Auditory Display,Paris, France, 2008. inproceedings.
[50] J. Lumsden, S. A. Brewster, M. Crease, and P. Gray. Guidelines for audio-enhancement of graphical userinterface widgets. In Proceedings of People and Computers XVI Memorable Yet Invisible: Human ComputerInteraction 2002 (HCI-2002), London, 2002.
[51] D. L. Mansur, M. M. Blattner, and K. I. Joy. Sound graphs: A numerical data analysis method for the blind.Journal of Medical Systems, 9(3), 1985.
[52] B. C. J. Moore. Chapter thirteen. loudness, pitch and timbre. In E. B. Goldstein, editor, Blackwell Handbookof Sensation and Perception, page 388. Blackwell, 2005.
[53] R. Morales-Manzanares, E. F. Morales, Dannenberg R., and J. Berger. Sicib: An interactive music compositionsystem using body movements. Computer Music Journal, 25(2):25–36, 2001.
[54] M. A. Nees and B. N. Walker. Listener, task, and auditory graph: Toward a conceptual model of auditory graphcomprehension. In Gary P. Scavone, editor, Proceedings of the 13th International Conference on AuditoryDisplay (ICAD2007), pages 266–273, Montreal, Canada, 2007. Schulich School of Music, McGill University.
[55] J. Neuhoff, J. Wayand, and G. Kramer. Pitch and loudness interact in auditory displays: Can the data get lostin the map? Journal of Experimental Psychology: Applied, 8(1):17–25, 2002.
[56] E. O. Otis. President’s Address. Auenbrugger and Laennec, the Discoverers of Percussion and Auscultation.Trans Am Climatol Assoc., 14:1–23, 1898.
[57] G. E. Peterson and H. L. Barn. Control methods used in a study of the vowels. Journal of the AcousticalSociety of America, 24:175–184, 1952.
[58] H. Pollard and E. Janson. A tristimulus method for the specification of musical timbre. Acoustica, 51:162–171,1982.
[59] A. Polli. Atmospherics/weather works: A spatialized meteorological data sonification project. Leonardo,38(1):31–36, 2005.
[60] M. Rath and D. Rocchesso. Continuous sonic feedback from a rolling ball. IEEE Interactive Sonification,2005.
[61] J. Rohrhuber. S – Introducing sonification variables. In Proceedings of the Supercollider Symposium, 2010.
[62] J. B. Rovan, M. M. Wanderley, S. Dubnov, and P. Depalle. Instrumental gestural mapping strategies asexpressivity determinants in computer music performance. In Proceedings of the Kansei – The Technology ofEmotion Workshop, pages 68–73, Genova – Italy, 1997.
[63] P. Schaeffer. Traité des objets musicaux. Le Seuil, Paris, 1997.
396 Grond, Berger
[64] R. Shelton, S. Smith, T. Hodgson, and D. Dexter. Mathtrax website: http://prime.jsc.nasa.gov/MathTrax/index.html.
[65] B. G. Shinn-Cunningham and T. Streeter. Spatial auditory display: Commentary on shinn-cunningham et al.icad 2001. ACM Trans. Applied Perception, 2(4):426–429, 2005.
[66] D. R. Smith and B. Walker. Effects of auditory context cues and training on performance of a point estimationsonification task. Applied Cognitive Psychology, 19:1065–1087, 2005.
[67] D. R. Smith and B. N. Walker. Tick-marks, axes, and labels: The effects of adding context to auditory graphs.In Proceedings of the 8th International Conference on Auditory Display (ICAD2002), pages 362–367, Kyoto,Japan, 2002.
[68] T. Stockman, L. V. Nickerson, and G. Hind. Auditory graphs: A summary of current experience and towards aresearch agenda. In Eoin Brazil, editor, Proceedings of the 11th International Conference on Auditory Display(ICAD 2005), pages 420–422, Limerick, Ireland, 2005. Department of Computer Science and InformationSystems, University of Limerick.
[69] A. Tanaka. The sound of photographic image. Artificial Intelligence and Society, 27(2), 2012.
[70] H. Terasawa, M. Slaney, and J. Berger. Perceptual distance in timbre space. In Eoin Brazil, editor, Proceedingsof the 11th Meeting of the International Conference on Auditory Display (ICAD2005), pages 61–68, Limerick,Ireland, 2005.
[71] D. Van Nort. Modular and Adaptive Control of Sound Processing. PhD thesis, McGill University, 2010.
[72] P. Vickers. Whither And Wherefore The Auditory Graph? Abstractions & Aesthetics In Auditory And SonifiedGraphs. In E. Brazil, editor, Proceedings of ICAD 05-Eleventh Meeting of the International Conference onAuditory Display, pages 423–442. ICAD, 2005.
[73] P. Vickers and J. L. Alty. Towards some organising principles for musical program auralisations. In S. A.Brewster and A. D. N. Edwards, editors, Proceedings of the 5th International Conference on Auditory Display,Glasgow, Scotland, 1998.
[74] K. Vogt. A quantitative evaluation approach to sonification. In D. Worrall, editor, Proceedings of the 17thInternational Conference on Auditory Display (ICAD-2011), Budapest, Hungary, June 20 – 24 2011. OPAKFI.
[75] K. Vogt, T. Bovermann, P. Huber, and A. deCampo. Exploration of 4d-data spaces. sonification in lattice qcd.In Proceedings of the 14th International Conference on Auditory Display, Paris, France, 2008. inproceedings.
[76] K. Vogt, D. Pirro, I. Kobenz, R. Höldrich, and G. Eckel. Physiosonic - movement sonification as auditoryfeedback. In Proceedings of the 15th International Conference on Auditory Display, Copenhagen, Denmark,2009.
[77] B. N. Walker. Magnitude estimation of conceptual data dimensions for use in sonification. PhD thesis, RiceUniversity, Houston, TX., 2000.
[78] B. N. Walker and J. T. Cothran. Sonification sandbox: A graphical toolkit for auditory graphs. In E. Braziland B. Shinn-Cunningham, editors, Proceedings of the 9th International Conference on Auditory Display(ICAD2003), pages 161–163, Boston, USA, 2003. Boston University Publications Production Department.
[79] B. N. Walker and G. Kramer. Mappings and metaphors in auditory displays: An experimental assessment. InProceedings of the Third International Conference on Auditory Display ICAD96, Palo Alto, CA, USA, 1996.
[80] B. N. Walker and D. M. Lane. Psychophysical scaling of sonification mappings: A comparison of visuallyimpaired and sighted listeners. In Proceedings of the Seventh International Conference on Auditory DisplayICAD2001, pages 90–94., 2001.
[81] I. Wallis, T. Ingalls, T. Rikakis, L. Olsen, Y. Chen, W. Xu, and H. Sundaram. Real-time sonification ofmovement for an immersive stroke rehabilitation environment. In Proceedings of the 13th InternationalConference on Auditory Display, Montréal, Canada, 2007.
[82] S. Williams. Perceptual principles in sound grouping. In G. Kramer, editor, Auditory Display: Sonification,Audification and Auditory Interfaces - SFI Studies in the Sciences of Complexity, volume XVIII, Reading,MA., 1994. Addison-Wesley.
[83] D. Worrall. Sonification and Information - Concepts, Instruments and Techniques. PhD thesis, University ofCanberra, 2009.

Parameter Mapping Sonification 397
[84] M. Wright, A. Freed, and A. Momeni. Opensound control: State of the art 2003. In Proceedings of the 2003International Conference on New Interfaces for Musical Expression (NIME, Montreal, Quebec, Canada, 2003.
[85] W. Seung Yeo and J. Berger. A framework for designing image sonification methods. In Proceedings of ICAD05-Eleventh Meeting of the International Conference on Auditory Display, Limerick, Ireland, 2005.
[86] E. Yeung. Pattern recognition by audio representation of multivariate analytical data. Analytical Chemistry,52(7):1120–1123, 1980.
[87] H. Zhao, C. Plaisant, B. Schneiderman, and R. Duraiswami. Sonification of geo-referended data for auditoryinformation seeking: Design principle and pilot study. In Proceedings of the 10th International Conference onAuditory Display (ICAD 2004), 2004.
[88] H. Zhao, B. Shneiderman, C. Plaisant, D. N. Zotkin, and R. Duraiswami. Improving accessibility and usabilityof geo-referenced statistical data. In Proc. of the Digital Government Research Conference, page 147, 2003.


![Fuzzy C-Means Clustering and Sonification of HRV …attention-task performance and regulation of emotions [7]. Sonification can be a useful tool for practicing mindfulness or biofeedback](https://static.fdocuments.in/doc/165x107/5fbe8687451f914baf03cc16/fuzzy-c-means-clustering-and-soniication-of-hrv-attention-task-performance-and.jpg)