The Socio-Economic Impact of Broadband in sub-Saharan Africa
42
The Socio-Economic Impact of Broadband in sub-Saharan Africa: The Satellite Advantage By the Commonwealth Telecommunications Organisation
Transcript of The Socio-Economic Impact of Broadband in sub-Saharan Africa

T h e S o c i o - E c o n o m i c I m p a c t o f B r o a d b a n d i n s u b - S a h a r a n A f r i c a : T h e S a t e l l i t e A d v a n t a g e
P a g e 1
The Socio-Economic Impact ofBroadband in sub-Saharan Africa:The Satellite Advantage
By the Commonwealth Telecommunications Organisation

T h e S o c i o - E c o n o m i c I m p a c t o f B r o a d b a n d i n s u b - S a h a r a n A f r i c a : T h e S a t e l l i t e A d v a n t a g e
P a g e 1
Executive Summary
Broadband is not just a consequence of economic growth, it is also a cause. Sub-Saharan Africa has succeeded in the last decade in bringing voice services within the reach of some three quarters of the population, but the vast majority of the region is falling further behind the rest of the world in terms of broadband connectivity. There are two main reasons for this: supply is limited, and prices have been very high.1
Broadband is the delivery of Internet IP bandwidth (at speeds of 256 Kbps or more), and all of the content, services and applications which consume this bandwidth. The essential underpinning of broadband therefore is the need for a high capacity transmission backbone network capable of delivering this bandwidth. Providing an entry level 256 Kbps broadband service to hundreds, thousands or millions of customers requires a backbone transmission network with sufficient capacity to do so. And each time an operator increases its broadband service from 256 Kbps to 512 Kbps, 2 Mbps, or even 100 Mbps, this in turn escalates the capacity requirements of the transmission backbone network.
The evolving broadband geography of sub-Saharan Africa reflects changes in the underlying level and pattern of supply of this trunk transmission capacity, and the pricing of that capacity. All of Africa’s international Internet bandwidth is supplied by satellite, submarine cables or terrestrial networks connected to submarine cables. These are complementary infrastructures, and Africa’s service providers use a mixture of them to optimally and most cost effectively deliver broadband services. Unlike submarine cables or terrestrial fibre optic networks, satellite bandwidth can be delivered to any location in Africa. Every square inch of the continent is covered with satellite bandwidth. There is, however, only a limited and finite supply of satellite transponder capacity available over the region.
Satellite is used to deliver both the international (trunk) bandwidth to Internet service providers (ISPs), and in the access network from ISPs to customers. For most of the last decade, satellite was the predominant means of providing international trunk Internet bandwidth for sub-Saharan Africa. This dependence on satellite has decreased with the construction of new submarine cables and terrestrial transmission networks connected to them. These submarine and terrestrial fibre optic networks can deliver greater transmission capacity than satellite, and in recent years, and in many places, at a lower price than satellite.
In the access network, satellite broadband services will remain extremely important for Africa’s broadband connectivity. In June 2012, some 341 million people in sub-Saharan Africa lived beyond a 50km range of a terrestrial fibre optic network, more than the population of the USA (314 million). Whilst 50km is the maximum range of a WiMAX broadband wireless network, decreasing the range to 25km increases the number of people living beyond the reach of an operational fibre optic network from 341 million to 518 million. This is greater than the entire population of the European Union (504 million).
1 See in particular "Broadband for Africa: Developing Backbone Communications Networks", M J Williams, 2010. The World Bank. http://www.infodev.org/en/Publication.526.html

Because satellite coverage is ubiquitous and can provide broadband services to any location in Africa, the key constraining factor on broadband uptake is price. In the last decade the price of international bandwidth has fallen from as high as US$12,500 per Mbps per month to as low as US$500 in some places, and in some cases even considerably less. As the cost of international bandwidth has fallen, retail broadband prices have fallen in step and price elasticities of demand have seen the number of fixed and mobile broadband subscribers start to accelerate in those places where this has occurred. Indeed, in areas well served by terrestrial networks across sub-Saharan Africa the pent-up demand of broadband services is being met. For those outside of this curve, retail broadband prices remain dictated by high upstream bandwidth costs, and broadband growth has yet to take off. In June 2012, eight countries remained 100% dependent on satellite for their international connectivity. Even in those countries with national fibre backbones, another 298 million or so people lived beyond the reach of terrestrial fibre networks. For those that live beyond the reach of terrestrial networks the size of the addressable market for satellite broadband services is limited only by price.
At the same time that new submarine and terrestrial fibre optic networks are being built, the supply of satellite capacity is also changing. In particular, the latest generation of Ka-band satellites entering service over the region have considerably more capacity than C-band and Ku-band satellites. Once the current inventory of Ka-band satellites has been launched, the total amount of transponder capacity available on Ka-band satellites over Africa will be more than the total existing stock of C-band and Ku-band. The HYLAS 2 satellite for example which was launched in August 2012 has a capacity of 450 MHz per transponder, as opposed to 36 or 72 MHz transponders on C-band and Ku-band satellites. The transition to Ka-band dramatically reduces the cost of bandwidth and terminal equipment, which is reflected in lower prices for broadband service provision.
Not only is satellite communication the most viable way of ensuring Universal Access to broadband in sub-Saharan Africa, the latest generation of Ka-band satellites will be able to provide a far more cost effective solution than C-band or Ku-band. This dispels the idea that satellite is just too expensive; satellites complement the services offered by terrestrial network operators in the drive to expand broadband in sub-Saharan Africa.
continued...

T h e S o c i o - E c o n o m i c I m p a c t o f B r o a d b a n d i n s u b - S a h a r a n A f r i c a : T h e S a t e l l i t e A d v a n t a g e
P a g e 3
Contents
Introduction ............................................................................................................ 5
Importance of Broadband for the Socio Economic Development of sub-Saharan Africa ................................................................... 6
Recent Developments in International Bandwidth and Terrestrial Broadband Networks in sub-Saharan Africa ..................................11
Satellite Communications forUniversal Broadband Access ............................................................................. 14
Pricing and the Uptake of Broadband Services ................................................ 16
Key Findings and Conclusions ........................................................................... 26
Sectoral Impact of Satellite Communications ........................................................ 30
Section 1.
Section 2.
Section 3.
Section 4.
Section 5.
Annex A.


T h e S o c i o - E c o n o m i c I m p a c t o f B r o a d b a n d i n s u b - S a h a r a n A f r i c a : T h e S a t e l l i t e A d v a n t a g e
P a g e 5
Introduction
This paper assesses the impact of broadband on sub-Saharan Africa and pays particular reference to satellite communications. The CTO is especially interested in broadband access in sub-Saharan Africa due to the impact it could have on socio-economic development. Our focus on satellite communication as a solution to the challenge of providing broadband to all in Africa stemmed from two things. Firstly, there is a belief, amongst some stakeholders, that the proliferation of terrestrial and submarine cables on and around sub-Saharan Africa would, when linked to expanding mobile telecoms infrastructure, provide a comprehensive solution to the challenge of providing broadband to all. Secondly, there is an assertion, espoused by many CTO stakeholders, especially those attending CTO’s Connecting Rural Communities events, that satellite was not part of the solution to Broadband connectivity because it remains too expensive to be sustainable.
This paper, which is sponsored by Avanti Communications Group plc, a CTO Member, argues that satellite communications remains an important part of the solution to providing universal broadband access, a prerequisite for countries that are seeking to become drivers and key participants in the global knowledge economy. Indeed, this paper provides evidence, which indicates that satellite is currently the only technology capable of providing ubiquitous services to all those living and working in sub-Saharan Africa and meeting the region’s pent-up demand for broadband services.
Section 1
Section 2
Section 3
Section 4
Section 5
Annex A
Explains the reasons why a consensus on the importance of broadband for socio-economic development has developed.
Examines the development of broadband infrastructure in sub-Saharan Africa, highlighting the improvements brought by relatively new submarine and terrestrial fibre optic roll-out. It explains why this has reduced the region’s overwhelming dependence on satellite.
Highlights the importance of satellite communications in sub-Saharan Africa for providing universal broadband access. It indicates that despite the growth of fibre optic submarine and terrestrial networks, more than 50% of sub-Saharan Africa may be unable to access broadband services unless they use satellites. Indeed, there are many countries where 75% - 100% of the population may not have the opportunity to access broadband unless they use satellites.
Examines the impact that the pricing of international bandwidth and retail broadband services has on demand. It also illustrates why the price of satellite communications, a key determinant of demand, is set to fall.
Presents the study’s findings and conclusions.
Presents examples of the impact satellites have, and may have, on particular sectors that are recognised as being fundamentally important for the future socio-economic development of SSA, including government, education, agriculture and mining.

Section 1.Importance of Broadband for theSocio Economic Development ofsub-Saharan Africa
Broadband is not just a consequence of economic development, it is also recognised as a cause. In an increasingly information-based world economy, broadband networks are vital arteries of economic activity through which the supply and consumption of information content, services and applications flow.
As an infrastructure, broadband networks can be seen in a similar way to the development of roads, railways, electricity and the way that these networks have transformed economic activities for individuals, companies and governments2. The broadband networks being built today have been likened to “the roads and bridges and railways that were built in previous times”3. These new infrastructures have made economies more efficient, enabled new economic activities which did not exist beforehand, and brought additional new economic growth.
In its “Broadband Challenge”4 published in October 2011, the Broadband Commission for Digital Development recognised that “we believe that the Internet and other Information and Communication Technologies (ICT) now constitute critical modern resources and are a vital pre-requisite for participation in today’s growing digital economy”, and “that communication is not just a human need – it is a right.”
Broadband networks have also profoundly changed the social environment in which we live, work and interact. “The rapid spread of access to information and communications services is changing the way society and business work in Africa,” said Mohsen A. Khalil, Director of the Global Information and Communication Technologies department at the World Bank, “allowing families to stay in touch with each other, governments to deliver services more effectively, and businesses to operate more efficiently”.5
2 “Information and Communications for Development 2009: Extending Reach and Increasing Impact” Chapter 3 - Economic Impacts of Broadband, Christine Zhen-Wei Qiang, Carlo M. Rossotto, Kaoru Kimura, The World Bank.3 As a generator of economic growth, the rollout of broadband networks has been included in the stimulus packages of developed countries including the UK and USA. For example, in January 2009 Britain’s Prime Minister Gordon Brown said that ’When we talk about the roads and bridges and the railways that were built in previous times – and those were anti-recession measures taken to help people through difficult times – you could talk about the digital infrastructure and that form of communications revolution at a period when we want to stimulate the economy”. 4 The Broadband Commission for Digital Development was established in May 2010 as a joint initiative by the International Telecommunications Union (ITU) and the United Nations Educational, Scientific and Cultural Organisation (UNESCO). “The Broadband Challenge”, October 2011 http://www.broadbandcommission.org/Documents/Broadband_Challenge.pdf 5 “Broadband for Africa: Developing Backbone Communications Networks”, M J Williams, 2010. The World Bank. http://www.infodev.org/en/Publication.526.html

T h e S o c i o - E c o n o m i c I m p a c t o f B r o a d b a n d i n s u b - S a h a r a n A f r i c a : T h e S a t e l l i t e A d v a n t a g e
P a g e 7
Charting the Relationship Between Broadband and Economic Development
Chart 1: ICT Development Index (IDI) and Gross National Income (GNI) Per Capita, 2010
Source: Measuring the Information Society 2011, International Telecommunications Union (ITU).http://www.itu.int/ITU-D/ict/publications/idi/index.html
The Maitland Commission Report in 19846 emphasised the existence of ’The Missing Link’ in access to telecommunications between developed and developing countries and, for the first time the existence of a clear link between investment in telecommunications and economic growth. Written nearly thirty years ago, the report noted that “In the industrialised world telecommunications is taken for granted as a key factor in economic, commercial and social activity and as a prime source of cultural enrichment. Moreover, in these countries telecommunications have come to be regarded as an engine of growth and a major source of employment and prosperity. The situation in the developing world is in stark contrast. In a majority of developing countries the telecommunications system is inadequate to sustain essential services. In large tracts of territory there is no system at all.” 7
This ’Missing Link’ of the 1980s later became known as the ’Digital Divide’ during the 1990s, and with technological advancement the emphasis has shifted from access to voice services, to narrowband Internet services, and more recently to broadband Internet services. The ICT Development Index published by the International Telecommunications Union (ITU), and the ICT Price Basket providing data on the cost and affordability of ICT services, clearly show the fundamental relationship between ICTs and the level of economic development 8.
6 The report of the Independent Commission for World Wide Telecommunications Development, better known as the “Maitland Report”, after its chairman Sir Donald Maitland, was published by ITU in 1984. Source: http://www.itu.int/osg/spu/sfo/missinglink/index.html 7 Ibid8 Measuring the Information Society 2011, published by the International Telecommunications Union (ITU). http://www.itu.int/ITU-D/ict/publications/idi/index.html

The Broadband Commission’s report “Broadband: A Platform for Progress“ (June 2011) documents over 100 research reports which quantify the causal relationship between telecommunications and economic development. The World Bank notably found9 in 2009 that in low and middle income countries a 10% increase in fixed line penetration was found to accelerate economic growth by 0.73%, mobile penetration by 0.81%, Internet penetration by 1.12%, and broadband penetration by 1.38%. The effect of broadband in accelerating economic growth was greater in less developed countries like those in sub-Saharan Africa than in more developed countries, and more than for fixed, mobile or Internet penetration.
However, just as one divide is closing, another is widening, notes the World Bank in its 2010 report “Broadband for Africa”. While sub-Saharan Africa has been very successful in increasing access to basic voice comunications, and Africa’s rapid adoption of the mobile phone is quickly closing the ’digital divide’ in voice services, the broadband access gap between the region and the rest of the world is getting wider.
As the ITU Broadband Atlas shows, the penetration broadband services in developed countries has increased at a faster rate than in developing countries, in particular many of those in sub-Saharan Africa.10 The main reasons for this are the limited supply and high retail prices of broadband services in many developing regions. “Broadband is still too expensive in developing countries, where it costs on average more than 100 per cent of monthly income, compared with 1.5 per cent in developed countries,” said Brahima Sanou, Director of the Telecommunication Development Bureau (BDT) at the ITU11. “Countries without affordable broadband access run the risk of falling behind in the global information society.”
9 “Information and Communications for Development 2009: Extending Reach and Increasing Impact” Chapter 3 - Economic Impacts of Broadband, Christine Zhen-Wei Qiang, Carlo M. Rossotto, Kaoru Kimura, The World Bank.10 ITU Broadband Atlas http://www.itu.int/ITU-D/treg/atlas/broadbandatlas.asp11 Measuring the Information Society 2011, published by the International Telecommunications Union (ITU). http://www.itu.int/ITU-D/ict/publications/idi/index.html

T h e S o c i o - E c o n o m i c I m p a c t o f B r o a d b a n d i n s u b - S a h a r a n A f r i c a : T h e S a t e l l i t e A d v a n t a g e
P a g e 9
Figure 1: Fixed Broadband Penetration 2010 Atlas, ITU
Source: ITU Broadband Atlas http://www.itu.int/ITU-D/treg/atlas/broadbandatlas.asp
Broadband Penetration Targets for sub-Saharan AfricaIn its “Broadband Challenge”12 published in October 2011, the Broadband Commission recognised that “broadband technologies are fundamentally transforming the way we live. It is vital that no one be excluded from the new global knowledge societies we are building”, and set a number of key targets for 2015:
By 2015, basic broadband service should cost less than 5% of average monthly income in all countries worldwide. The price of broadband access plays a critical role in terms of broadband diffusion. While broadband is becoming more affordable worldwide, with prices falling everywhere, it nonetheless remains unaffordable in many parts of the developing world.
By 2015, 40% of households in developing countries should have Internet access. In developed countries, more than two thirds of households already had Internet access at the end of 2010, compared to around 16% of households in the developing world.
By 2015, Internet user penetration should reach 60% worldwide, 50% in developing countries and 15% in least developed countries (LDCs). At the end of 2010, just over two billion people were using the Internet – or 30% of the global population. Internet penetration in 2010 stood at 21% in the developing world and at just under 5% in the world’s LDCs.
12 The Broadband Commission for Digital Development was established in May 2010 as a joint initiative by the International Telecommunications Union (ITU) and the United Nations Educational, Scientific and Cultural Organisation (UNESCO). “The Broadband Challenge”, October 2011 http://www.broadbandcommission.org/Documents/Broadband_Challenge.pdf

Inaugural ICT Indaba:African ICT Ministerial Declaration7 June 2012
“We, the Ministers responsible for Information Communication Technologies (ICTs) in our respective countries in Africa, assembled in Cape Town from the 4th – 7th of June 2012 for the Inaugural ICT Indaba … hereby declare our common desire and commitment to eradicate the barriers of poverty through the promotion and use of enabling ICTs to build and foster a people-centred knowledge-based economy in Africa.
We declare access to broadband communication as a basic human right in Africa and commit to increasing broadband penetration to approximately 80 per cent of the population by 2020. This common vision draws its basis from the positive impact exerted on economic growth through increasing Accessibility, Affordability, and Availability to broadband by all”.
Source: Inaugural ICT Indaba: African ICT Ministerial Declaration, 7 June 2012
During June 2012, African Ministers responsible for ICTs attending the inaugural ICT Indaba in South Africa13 went a step further to set a target of achieving a broadband penetration of approximately 80% by 2020.
13 Source: Inaugural ICT Indaba: African ICT Ministerial Declaration, 7 June 2012 http://www.ictindaba.com/2012/images/ICT_Indaba_2012_African_ICT_Ministerial%20Declaration_07June2012.pdf

T h e S o c i o - E c o n o m i c I m p a c t o f B r o a d b a n d i n s u b - S a h a r a n A f r i c a : T h e S a t e l l i t e A d v a n t a g e
P a g e 1 1
Section 2.Recent Developments in International Bandwidth and Terrestrial Broadband Networks in sub-Saharan Africa
Africa’s international Internet bandwidth will reach the 1 Tbps mark during 2012. By December 2011, Africa’s total international Internet bandwidth reached 801 Gbps, a 60% increase compared to 201014. Africa previously reached the 500 Gbps mark in late 2010, and the 100 Gbps mark during 2008. The fifty countries in sub-Saharan Africa reached a total of 368 Gbps in December 2011, up from 202 Gbps in 2010, and 92 Gbps in 2009.15 To put this in perspective, the world’s total international Internet bandwidth has increased from 11 Tbps in 2006 to 80 Tbps in 201116. All of Africa’s international bandwidth is supplied by satellite, submarine cable, or terrestrial links backhauled to submarine cables. These are complementary infrastructures, and Africa’s service providers use a mixture of them to optimally and most cost effectively deliver broadband services.
All three of these types of infrastructure suffer failures from time to time. Submarine cables do occasionally get cut or damaged, and can take days or weeks to repair. Terrestrial fibre optic cables can also be cut or damaged, in some cases severing international backhaul links to submarine cables, and can take hours or days to repair. Satellites are vulnerable too; a number of satellites with coverage over Africa have failed on launch and others have suffered technical problems once in orbit, which have curtailed their services or lifespan. However, as more satellites, submarine cables and terrestrial links are built, this mix of technologies and increased amount of infrastructure is increasing the redundancy, diversity and resilience of service providers’ networks all the time.
The dependency on satellite for international trunk bandwidth has fallen with the construction of new submarine cables and terrestrial fibre optic networks connected to them. The supply of international trunk Internet bandwidth supplied by satellite to the region reached a peak of around 9 Gbps in 2008, but has dropped back since then. Kenya, for example, peaked at about 2 Gbps of international bandwidth supplied entirely by satellite in July 2009 until the entry of the SEACOM (2009), followed by the TEAMS (2009), EASSy (2010) and LION2 (2012) submarine cables. The arrival of multiple, competing submarine cables in Mombasa and terrestrial fibre backbones connecting them to the capital city Nairobi and other major towns and cities has dramatically increased the supply and decreased the cost of international bandwidth. Within two and half years, Kenya’s international bandwidth had increased from 2 Gbps to 53 Gbps by December 2011, but the amount supplied by satellite had shrunk to 108 Mbps (source: CCK)17.
14 Source: ’Africa’s International Bandwidth Approaches 1 Tbps Mark’, Africa Bandwidth Maps, 19 April 2012 http://www.africabandwidthmaps.com/?p=278715 Africa Bandwidth Maps, 201216 Source: ’ICT Facts and Figures’, ITU. http://www.itu.int/ITU-D/ict/facts/2011/material/ICTFactsFigures2011.pdf17 Source: ’Quarterly Sector Statistics Report, October – December 2011/12’, 17 April 2012, Communications Commission of Kenya (CCK) http://www.cck.go.ke/resc/downloads/SECTOR_STATISTICS_REPORT_Q2_2011-12.pdf

Figure 2: Fibre Reach Statistics sub-Saharan Africa Q2 2012
Africa’s inventory of terrestrial transmission network reached 732,662 route kilometres in the second quarter of 201218. This compared to 660,230km in June 2011, 585,468km in June 2010 and 465,659km in June 200919. The Fibre Reach map below shows the 396,766 kilometres of live terrestrial fibre optic networks in Q1 201220. It clearly shows that most of Africa’s main urban hubs are now reached by fibre transmission backbones connected to submarine cable landing points. It also shows the steady deployment of national fibre transmission backbones to secondary cities, and regional fibre connectivity to landlocked countries.
In the same way that dependence on satellite for international bandwidth has decreased, the expansion of national backbones is softening the dependence within countries as well. The table below shows that in June 2012 a total of 40.1 million people lived within a 25km range of a submarine cable landing point, but 345.1 million people lived within a 25km range of a terrestrial fibre optic node. This number has increased from 259.3 million in July 2010 and 313.2 million in July 2011, and continues to grow as new network is deployed. By the time networks, which are currently under construction, enter service in the next twelve to eighteen months, the number will increase from 345.1 million to 377.9 million, and once networks which are planned or proposed are completed in the next three to five years this number will increase again to 438.8 million. However, this will still leave 423.2 million people, or 49.1% of the population, beyond a 25km reach of a terrestrial fibre optic node.
Source: Africa Bandwidth Maps http://www.africabandwidthmaps.com
40.1 million people within 25km reach of submarine cable landing point.
173.9 million people within 10km reach of terrestrial fibre node.
345.1 million people within 25km reach of terrestrial fibre node.
522.3 million people within 50km reach of terrestrial fibre node.
341.0 million people beyond the reach ofterrestrial fibre node.
18 Source: ’Africa’s International Bandwidth Approaches 1 Tbps Mark’, Africa Bandwidth Maps, 19 April 2012 http://www.africabandwidthmaps.com/?p=278719 Source: ’Africa’s Fibre Roll-Out: 138 RouteKms of New Fibre Network Enters Service Per Day’, Africa Bandwidth Maps, 1 November 2011 http://www.africabandwidthmaps.com/?p=257220 Source: Fibre Reach Mobile App, Africa Bandwidth Maps, http://www.africabandwidthmaps.com

T h e S o c i o - E c o n o m i c I m p a c t o f B r o a d b a n d i n s u b - S a h a r a n A f r i c a : T h e S a t e l l i t e A d v a n t a g e
P a g e 1 3
Date Within 10km Reach Within 25km Reach Within 50km Reach
Submarine cable landing point operational Q2 2010 15.3 m 1.8%
37.4 m 4.4%
49.8 m 5.9%
Submarine cable landing point operational Q2 2011 15.3 m 1.8%
37.4 m 4.4%
49.8 m 5.9%
Submarine cable landing point operational Q2 2012 16.5 m 1.9%
40.1m 4.6%
53.1 m 6.2%
Submarine cable landing pointUnder construction or planned
20.8 m 2.5%
46.6 m 5.5%
61.3 m 7.2%
Range from Terrestrial Fibre Node Operational Q2 2010 131.2 m 15.6%
259.3 m 30.8%
401.1 m 47.7%
Range from Terrestrial Fibre Node Operational Q2 2011 160.6 m 18.6%
313.2 m 36.3%
483.9 m 56.1%
Range from Terrestrial Fibre Node Operational Q2 2012 173.9 m 20.2%
345.1 m 40.0%
522.3 m 60.6%
Range from Terrestrial Fibre Under Construction Q2 2012 193.8 m 22.5%
377.9 m 47.4%
561.5 m 65.1%
Range from Terrestrial Fibre Planned or Proposed Q2 2012 225.1 m 26.1%
438.8 m 50.9%
645.7 m 74.9%
Table 1: Fibre Reach, sub-Saharan Africa Q2 2010 – Q2 2012 Number of people within 10, 25 and 50km range of submarine cable landing points and nodes on terrestrial fibre optic networks, sub-Saharan Africa.
Source: Africa Bandwidth Maps http://www.africabandwidthmaps.com

Section 3.Satellite Communications forUniversal Broadband Access
Satellite is the only viable means of providing universal broadband access beyond the reach of terrestrial transmission networks. The table below shows that in June 2012, a total of 341 million people in sub-Saharan Africa lived beyond a 50km range of an operational fibre optic network. This is greater than the population of the USA (314 million), representing a huge market. Whilst 50km is the maximum theoretical range of a WiMAX broadband wireless site, decreasing the range to 25km increases the number of people living beyond the reach of an operational fibre optic network from 341 million to 518 million. This is greater than the entire population of the European Union (504 million). The only means of reaching these people with a high capacity transmission network currently is by satellite.
Eight out of 50 countries in sub-Saharan Africa still did not have an operational fibre backbone in June 2012. Over 50 million people living in these eight countries relied exclusively on satellite and terrestrial microwave networks for their national and international connectivity: Burundi, Central African Republic, Guinea Conakry, Liberia, Sao Tome and Principe, Sierra Leone, Somalia, and South Sudan.
Even in those countries which do have terrestrial fibre networks, some 289 million people lived beyond a 50km reach of a terrestrial fibre backbone. As the case study of South African farming community below shows, there is still a significant requirement for satellite connectivity in what is the most developed country in the region. Only in the relatively small countries of Cape Verde, Comoros, Mayotte, Reunion, Rwanda, Swaziland and The Gambia was the entire population within a 50km reach. The Seychelles is an interesting example: the SEAS cable landed at Beau Vallon on the island of Mahe on 27 May 2012, but this does not reach some 19,350 people living on the other inhabited islands of the archipelago. The Seychelles archipelago comprises of 115 islands.

T h e S o c i o - E c o n o m i c I m p a c t o f B r o a d b a n d i n s u b - S a h a r a n A f r i c a : T h e S a t e l l i t e A d v a n t a g e
P a g e 1 5
Table 2: Population That Can Only Be Reached By Satellite, SSA Q2 2012
Source: Africa Bandwidth Maps http://www.africabandwidthmaps.com
Country Beyond 10km Reach of Fibre Network
Beyond 25km Reach of Fibre Network
Beyond 50km Reach of Fibre Network
DRC 64,752,420 59,492,689 55,645,653
Nigeria 127,968,365 91,116,356 44,974,654
Ethiopia 79,800,446 67,301,162 39,614,887
Tanzania 34,373,440 27,809,987 18,479,967
Niger 14,850,641 14,529,554 13,530,278
Guinea 11,305,000 11,301,299 11,245,514
Sudan 23,600,878 18,015,247 11,198,304
Madagascar 19,011,029 15,657,209 11,058,508
South Sudan 10,625,176 10,625,176 10,625,176
Somalia 9,627,725 9,606,590 9,500,768
Angola 14,756,906 11,589,508 9,199,086
Mozambique 17,701,668 13,643,040 8,552,215
Cameroon 14,863,140 11,492,766 8,122,392
Chad 9,367,332 8,979,646 7,722,286
Burkina Faso 13,622,582 11,374,136 7,493,359
Mali 11,873,483 9,949,333 7,346,440
Zambia 8,221,275 7,479,690 6,416,504
Sierra Leone 6,358,000 6,358,000 6,358,000
Cote d’Ivoire 17,028,296 11,932,510 6,323,828
Uganda 28,040,939 17,430,475 6,291,249
Zimbabwe 8,915,692 6,660,764 4,711,150
Central African Republic 4,607,787 4,592,439 4,528,203
Burundi 8,186,978 6,762,577 4,325,750
Liberia 3,965,000 3,965,000 3,965,000
Kenya 26,035,410 12,337,080 3,597,767
Malawi 12,207,316 9,162,736 3,516,146
Ghana 16,939,679 9,009,467 3,234,218
Eritrea 4,851,962 4,067,430 2,783,894
Congo 2,960,889 1,934,840 1,753,361
Mauritania 2,616,590 2,278,727 1,729,253
Gabon 1,056,220 969,835 942,022
Senegal 8,081,649 3,597,029 885,414
Benin 5,812,216 3,030,550 845,230
Guinea-Bissau 1,323,595 1,202,884 771,697
Equatorial Guinea 1,215,647 935,983 647,951
Namibia 1,346,042 1,063,719 606,093
Togo 4,925,910 2,413,461 489,449
Lesotho 1,912,018 1,249,391 441,430
South Africa 25,543,204 4,914,045 326,759
Botswana 1,145,157 727,172 296,924
Sao Tome and Principe 168,000 168,000 168,000
Djibouti 222,152 160,225 56,292
Mauritius 438,735 38,257 27,341
Seychelles 28,724 19,350 19,350
Swaziland 718,464 256,990 -
Rwanda 4,838,592 202,950 -
The Gambia 475,624 80,676 -
Cape Verde 91,593 9,941 -
Mayotte 104,631 366 -
Comoros 86,390 - -
Reunion 120,484 - -
sub-Saharan Africa 688,691,091 517,496,257 340,367,762

Section 4.Pricing and the Uptake ofBroadband Services
The evolving geography of broadband in sub-Saharan Africa reflects not only these changes in the underlying pattern and level of supply of this trunk transmission capacity, but crucially the pricing of that capacity. Historically, the high price of bandwidth has been the single-most important factor limiting the growth of Internet and broadband services in Africa.
Not only does Africa have some of the lowest income countries in the world, it has some of the highest bandwidth costs. Whilst the average price of a broadband connection represents just 1.5% of monthly income in Europe, the average in developing countries is over 100% and it can run into several thousand percent for some African countries. This level of affordability varies tremendously across sub-Saharan Africa as well, with the cost of broadband access ranging from 5.7% of Gross National Income (GNI) per capita in South Africa, to 59.9% in Kenya, 259% in Madagascar, 1,070.8% in Ethiopia and 2,595% in Guinea Conakry (source: ITU21). This has had a direct corresponding effect on broadband uptake. In those countries recently connected to submarine cables, broadband has become much more affordable and the growth in broadband subscribers has accelerated. Following the entry into service of the SEACOM and EASSy submarine cables in Kenya, for example, the price of fixed broadband decreased from 261.2% of GNI per capita in 2008 to 59.9% in 2010, in Mozambique from 311.9% in 2008 to 59.8% in 2010, and in Tanzania from 174.4% in 2008 to 50% in 2010.
This pattern also applies to those landlocked countries which have become connected to submarine cables by fibre optic networks through neighbouring countries. These include Uganda (via Kenya) where the price of fixed broadband decreased from 374.9% of GNI per capita in 2008 to 35.9% in 2010, Ethiopia (via Sudan and Djibouti) from 2,721.4% in 2008 to 1,070.8% in 2010, and Burkina Faso (via Senegal, Cote d’Ivoire, and Benin) which decreased from 4,466.2% of GNI per capita in 2008 to 194.2% in 2010. In Guinea Conakry, one of the eight countries that is wholly dependent on Ku and C band satellites, the monthly price of fixed broadband usage has decreased slightly to 2,595% of GNI per capita in 2010 compared to 2,823.5% in 2008 (source: ITU22). Guinea had 33,079 Internet subscribers in 2010, a penetration rate of 0.3%, split between 11,856 fixed and 21,223 mobile Internet subscribers23.
21 “Measuring the Information Society 2011”, published by the International Telecommunications Union (ITU). http://www.itu.int/ITU-D/ict/publications/idi/index.html22 Source: ITU Broadband Atlas http://www.itu.int/ITU-D/treg/atlas/broadbandatlas.asp23 Source: ARPT Guinee http://www.arptguinee.org/ObservatoireGuinee2010Internet.pdf

T h e S o c i o - E c o n o m i c I m p a c t o f B r o a d b a n d i n s u b - S a h a r a n A f r i c a : T h e S a t e l l i t e A d v a n t a g e
P a g e 1 7
Sierra Leone, another country that is wholly dependent on Ku and C band satellites, had an international bandwidth of 155 Mbps in 2011 for a population of 6.358 million. “Connectivity between Sierra Leone and the outside world relies exclusively on expensive satellite with limited availability of high-capacity bandwidth,” said the Information Minister of Sierra Leone speaking in June 2011 “As a result, Sierra Leone currently has some of the highest connectivity costs in the world - with average satellite prices between US$4,000 - $5,000 for 1 Mbps (compared with about US$200 in the US, and approximately US$500 in East Africa). Limited speed monthly packages are US$200 a month, representing 56.8% of GDP per capita. This, coupled with a lack of national backbone infrastructure has created a difficult environment for expanding availability of Internet services and advanced applications” 24.
This situation will change once the ACE submarine cable enters service in October 2012. It will connect Guinea, Sierra Leone, Liberia as well as Sao Tome and Principe for the first time. This will remove dependence on satellite for international trunk Internet bandwidth, but until fibre optic backbones are built connecting the submarine cable landing points to the rest of the country, satellite will continue to play a crucial role in providing connectivity outside the capital cities of Conakry (Guinea), Freetown (Sierra Leone) and Monrovia (Liberia).
The key factor underlying this transition from satellite to fibre for international trunk Internet bandwidth has been price. For some time, bandwidth on submarine cables was considerably more expensive than satellite. In 2001 only 4 out of 49 countries were connected to submarine cables (Cape Verde, Djibouti, Senegal and South Africa), and until as recently as 2009 the seven submarine cables serving sub-Saharan Africa25 connected only 12 countries (Angola, Benin, Cameroon, Cote d’Ivoire, Djibouti, Ghana, Cape Verde, Mauritius, Nigeria, Reunion, Senegal, and South Africa). Prices on the SAFE and SAT-3 submarine cables were high, and were initially much higher than for satellite bandwidth. In 2002, an E1 (2 Mbps) International Private Leased Circuit (IPLC) on SAFE cost US$ 22,239 per month from Mauritius to France. In 2003, an E1 circuit on SAT-3 to Portugal cost US$ 25,000 per month in Angola, US$ 22,400 in Cameroon, and US$ 22,000 in Ghana. By 2006 these tariffs had decreased to US$ 7,900 in Mauritius, US$ 14,400 in Angola, US$ 4,400 in Cameroon, and as low as US$ 4,100 in Ghana26. From around 2006 onwards in different countries at different times, tariffs on submarine cables started to decrease below the cost of satellite capacity.
Price Dictates Transition from Satellite to Fibre for International Trunking
24 Source: “Strategic Impact On Fiber Optic Communications Infrastructure On ICT Development in Sierra Leone”, Concord Times, 15 June 2011. 25 Submarine cables serving sub-sub-sub-Saharan Africa 2002 – 2009: SEAMEWE-3, SAT-2, Atlantis-2, SAT-3, SAFE, SAS-1 and FLAG Falcon.26 Source: Abiodun Jagun, “The Case for “Open Access” Communications Infrastructure in Africa: The SAT-3/WASC cable – A Briefing”, May 2008 APC Publications. http://www.apc.org/en/system/files/APC_SAT3Briefing_20080515.pdf

Case Study:Mauritius
Mauritius has been connected to the SAFE submarine cable since 2002. The price for a full E1 IPLC circuit (2 Mbps) has been reduced from US$ 22,239 per month in 2002 to US$ 4,100 in 2011. In January 2012 tariffs were reduced further to US$ 3,500, an 84% decrease since the SAFE cable first entered service. Mauritius’ international bandwidth increased from 36 Mbps to 10 Gbps during this ten-year period, and the chart below describes the relationship between price decrease and bandwidth increase.
Notably the key turning point in this curve came in 2009 when tariffs were lowered by 22% to US$ 4,900, which resulted in a 304% increase in bandwidth to 1.864 Gbps, a price elasticity of demand (PED) of -13.7%. Retail broadband tariffs decreased in this period, becoming much more affordable, and stimulating much greater uptake: entry level 512 ADSL package nearly halved in price from Rupees 1,360 (US$ 43) per month in 2008 to Rs 750 (US$ 24) per month in 2009, and a 1 Mbps ADSL package from Rs 5,990 (US$ 188) in 2008 to Rs 1,360 (US$ 43) in 2009. Between 2008 and 2010, the price of fixed broadband decreased from 4.6% of GNI per capita in 2008 to 2.7% in 2010 (source: ITU).
Chart 2: Reduction in Tariff of Full E1 International Private Leased Circuit (IPLC) on SAFE Submarine Cable from Mauritius to France, USD per month.
-
5,000
10,000
15,000
20,000
25,000
- 2,000 4,000 6,000 8,000 10,000
Int'l Bandwidth (Mbps)
Mauritius: Tariff vs Volume on SAFE Cable, 2002 - 2012
US
D p
er E
1 p
er m
ont
h

T h e S o c i o - E c o n o m i c I m p a c t o f B r o a d b a n d i n s u b - S a h a r a n A f r i c a : T h e S a t e l l i t e A d v a n t a g e
P a g e 1 9
Table 3: Mauritius’s Falling Cost of Capacity
2002 2003 2004 2005 2006 2007 2008 2009 2010 2011 2012
USD 22,239 12,600 12,600 12,600 7,900 6,300 6,300 4,900 4,900 4,100 3,500
Mbps 36 45 61 90 153 285 462 1,864 3,390 5,806 10,000
Source: ICTA, Mauritius Telecom27.
The pricing of capacity on submarine cables is only one part of the supply chain. Whilst 40.1 million people live within reach of a submarine cable landing point, 345.1 million live within reach of a fibre optic node connected to these cables (Q2, 2012). Even where the cost of capacity on submarine cables has in some cases dropped below US$ 500 per Mbps per month, the costs to backhaul traffic on national and cross-border terrestrial transmission networks to these submarine cables must be added to the cost of submarine cables. In Nigeria for example, where four submarine cables land at Lagos (SAT-3, Main One, GLO-1, and WACS), it is still apparently more expensive to buy terrestrial capacity from Abuja (the capital) to Port Harcourt or Lagos then it is from Lagos to London (UK)28. For landlocked countries, which must transit across another country to reach submarine cable landing points, the costs are also higher. As a result, the retail cost of broadband services tends to be higher in these landlocked countries.
The supply of international trunk bandwidth supplied by satellite to Africa reached a peak of around 9 Gbps in 2008. There is, however, only a finite and limited supply of satellite transponder capacity available over the region. There are nearly 60 satellites with coverage over Africa and the amount of total transponder capacity changes as new satellites are launched, existing satellites are repositioned, or old satellites exit service. For much of the last decade, with limited fibre connectivity and pricing on submarine cables still at a high level, there was a greater demand for Internet bandwidth in Africa than there was a supply of satellite transponder capacity over the region. This supply shortage had the effect of pushing prices up for a time, in particular for C-band capacity.
Whilst new submarine and terrestrial fibre optic networks are being built, the supply of satellite capacity is also changing. In particular, the latest generation of Ka-band satellites entering service have considerably more capacity than C-band and Ku-band satellites. Each Ka-band transponder has more capacity (MHz) than Ku-band or C-band transponders. The HYLAS 2 satellite, for example, launched on 2 August 2012 and has a capacity of 450 MHz per transponder, as opposed to 36 or 72 MHz transponders on C-band and Ku-band satellites. Meanwhile, Eutelsat’s KA-Sat satellite has a total payload capacity of 70 Gbps with coverage of Europe and the Mediterranean basin, and the Viasat-1 satellite has a capacity of 100 Gbps over North America.
Supply Level of Satellite Transponders Affects Price
27 Source: ‘National Broadband Policy 2012 – 2020’, Ministry of Information and Communication Technology, January 2012. http://www.icta.mu/documents/nationalbroadbandpolicy2012.pdf International bandwidth figures until 2011 sourced from ICTA http://www.icta.mu, figure for 2012 sourced from Mauritius Telecom as at 31 March 2012. 28 See for example “Broadband Nigeria – The Next Frontier?”, April 2012, Paper presented by Main One Cable Company Nigeria Limited at the Nigerian Communication Commission’s Stakeholders Consultative Forum for the Year 2013 – 2017 Strategic Management Plan. http://www.mainonecable.com

Once the current inventory of Ka-band satellites has been launched, the total amount of transponder capacity available on Ka-band satellites over Africa will be more than the total existing stock of C-band and Ku-band. Avanti Communications will launch a International IP Trunking service on the HYLAS 2 satellite across Africa and the Middle East with prices as low as US$ 500 per Mbps per month29. The increase in supply brought by Ka-band satellites is enabling the lowering of prices, making it a more viable proposition, and will stimulate growth back beyond the 9 Gbps level seen in 2008. As Ka-band satellites have greater MHz capacity per transponder than both Ku-band and C-band satellites, the unit cost per Mbps can be much lower. To give one example, the Intelsat New Dawn satellite launched in 2010 cost approximately US$250 million. It is equipped with 28 C-band and 24 Ku-band 36-MHz transponders, a total design capacity of 1,872 MHz of capacity at launch. The HYLAS 2 satellite launched by Avanti Communications cost some US$328 million (launch and in-orbit insurance sum assured), is equipped with 24 fixed Ka-band transponders, and has a total design capacity of 8,300 MHz. 30 The unit cost per MHz of capacity on Ka-band is lower than for C-band and Ku-band services.
29 Source: ‘Avanti powers digital economies across Africa and Middle East with new Ka-band International IP Trunking using NovelSat’s NS3 Technology’, 23 May 2012, Avanti Communications http://www.avantiplc.com/news/press-releases/avanti-powers-digital-economies-across-africa-and-middle-east-new-ka-band-intern30 Source: http://www.stockmarketwire.com/article/4232201/Avanti-completes-in-orbit-insurance-for-HYLAS-2.html and http://www.londonstockexchange.com/exchange/news/market-news/market-news-detail.html?announcementId=1110619831 Price elasticity of demand (PED) is measured as the percentage change in quantity demanded that occurs in response to a percentage change in price. For example, if, in response to a 10% fall in the price of a good, the quantity demanded increases by 20%, the price elasticity of demand would be 20%/ −10% = −21.32 The period 2004 – 2008 is used here with ARPU on a comparable basis before the impact of mandatory SIM card registration (RICA) which had the effect of reducing registered pre-paid SIM cards, and prior to the implementation by Vodacom of a new definition of active subscriptions.
In most developed markets, the retail price of broadband service represents such a small fraction of average monthly income, it is generally recognised that there is little or no price elasticity of demand. In less developed markets such as Africa which are highly price-sensitive, an extremely strong statistical correlation between price and volume is found to exist31.
For voice services, the chart opposite for South Africa shows the average revenue per user (ARPU) for mobile operator Vodacom over a five-year period from 2004 – 2008, with ARPU expressed as a percent of average GDP per capita . Blue points are post-paid (contract) subscribers, and red points are pre-paid customers. The curve describes the statistical relationship between average spend on GSM as a percentage of GDP per capita 32, and the number of subscribers (penetration) which was achieved at that level of spend. This example shows that there is an extremely strong correlation between spend on telecommunication and penetration.
Price Elasticity of Demand

T h e S o c i o - E c o n o m i c I m p a c t o f B r o a d b a n d i n s u b - S a h a r a n A f r i c a : T h e S a t e l l i t e A d v a n t a g e
P a g e 2 1
-
5
10
15
20
25
30
- 5 10 15 20 25 30 35 40 45
% Penetration
Post-paid Subscribers
Pre-paid Subscribers
Affordability Curve%
of G
DP
per
cap
ita
The chart shows that as tariffs decrease, penetration increases only gradually until it drops beyond a certain price point when the rate of penetration (slope of curve) accelerates and penetration starts to increase much more rapidly. Because this curve describes the historic spend on telecom (mobile voice) services, it can also be used to calculate estimated penetration of other telecom services, including broadband. By expressing this relationship in a different way, it is possible to calculate the subscriber demand requirement for telecom services at different price points. Chart 4 on the next page, takes the same formula for the ARPU/penetration curve as shown above, and is restated to show the estimated number of subscribers at different price points in the range from US$ 500 per month to US$ 6 per month.
This chart shows that in South Africa the rate of subscriber growth increases below the US$ 100 per month mark, and starts to accelerate once it drops below around US$ 50 per month so that penetration goes on to exceed 100% as mobile voice subscriptions have done. Reflecting one of the global targets for 2015 set by the Broadband Commission, growth of subscribers really starts to accelerate past the threshold of 5% of GDP per capita per month, at which point along this curve in South Africa US$ 34 per month results in a penetration rate of 17.3%, and an estimated market sizing of 8.731 million people. In order to reach an 80% penetration rate in South Africa, the retail price (spend) would need to fall to some US$ 8.4 (ZAR 70) per month.
Chart 3: Affordability Curve, Vodacom South Africa
Source: Vodacom.
-
10
20
30
40
50
60
$500
$480
$460
$440
$420
$400
$380
$360
$340
$320
$300
$280
$260
$240
$220
$200
$180
$160
$140
$120
$100 $80
$60
$40
$20 $6
Retail Price/ Spend, USD per month
Sub
scrib
ers
(Mill
ion)
$70
3.981
DSTV Subscribers, March 2012
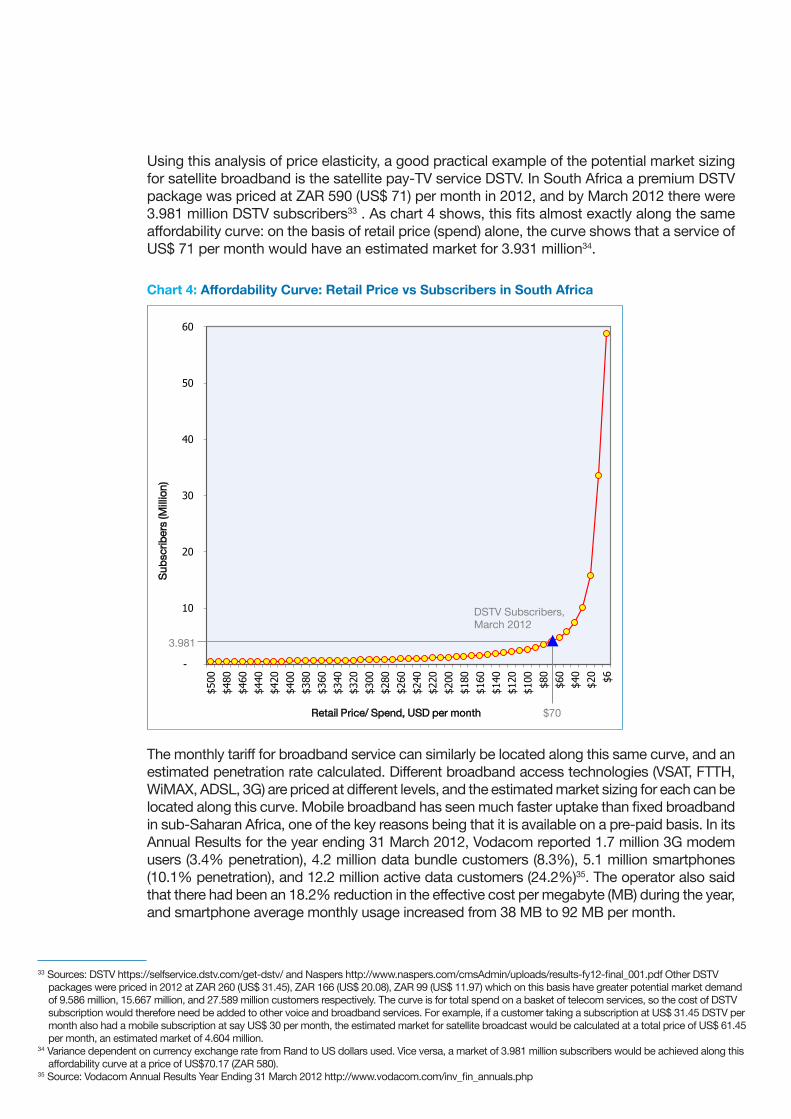
Using this analysis of price elasticity, a good practical example of the potential market sizing for satellite broadband is the satellite pay-TV service DSTV. In South Africa a premium DSTV package was priced at ZAR 590 (US$ 71) per month in 2012, and by March 2012 there were 3.981 million DSTV subscribers33 . As chart 4 shows, this fits almost exactly along the same affordability curve: on the basis of retail price (spend) alone, the curve shows that a service of US$ 71 per month would have an estimated market for 3.931 million34.
The monthly tariff for broadband service can similarly be located along this same curve, and an estimated penetration rate calculated. Different broadband access technologies (VSAT, FTTH, WiMAX, ADSL, 3G) are priced at different levels, and the estimated market sizing for each can be located along this curve. Mobile broadband has seen much faster uptake than fixed broadband in sub-Saharan Africa, one of the key reasons being that it is available on a pre-paid basis. In its Annual Results for the year ending 31 March 2012, Vodacom reported 1.7 million 3G modem users (3.4% penetration), 4.2 million data bundle customers (8.3%), 5.1 million smartphones (10.1% penetration), and 12.2 million active data customers (24.2%)35. The operator also said that there had been an 18.2% reduction in the effective cost per megabyte (MB) during the year, and smartphone average monthly usage increased from 38 MB to 92 MB per month.
33 Sources: DSTV https://selfservice.dstv.com/get-dstv/ and Naspers http://www.naspers.com/cmsAdmin/uploads/results-fy12-final_001.pdf Other DSTV packages were priced in 2012 at ZAR 260 (US$ 31.45), ZAR 166 (US$ 20.08), ZAR 99 (US$ 11.97) which on this basis have greater potential market demand of 9.586 million, 15.667 million, and 27.589 million customers respectively. The curve is for total spend on a basket of telecom services, so the cost of DSTV subscription would therefore need be added to other voice and broadband services. For example, if a customer taking a subscription at US$ 31.45 DSTV per month also had a mobile subscription at say US$ 30 per month, the estimated market for satellite broadcast would be calculated at a total price of US$ 61.45 per month, an estimated market of 4.604 million. 34 Variance dependent on currency exchange rate from Rand to US dollars used. Vice versa, a market of 3.981 million subscribers would be achieved along this affordability curve at a price of US$70.17 (ZAR 580).35 Source: Vodacom Annual Results Year Ending 31 March 2012 http://www.vodacom.com/inv_fin_annuals.php
Chart 4: Affordability Curve: Retail Price vs Subscribers in South Africa

T h e S o c i o - E c o n o m i c I m p a c t o f B r o a d b a n d i n s u b - S a h a r a n A f r i c a : T h e S a t e l l i t e A d v a n t a g e
P a g e 2 3
Chart 4 indicates that a service priced at US$ 250 per month in South Africa would have an estimated market of 990,634 subscribers, at US$ 100 of 2.7 million subscribers, at US$ 30 of 10 million subscribers, and at US$ 10 of 33.6 million subscribers (bearing in mind that this curve is for total spend on telecom, value for money and supply constraint, i.e. that a broadband service could be in addition to voice service, and that subscribers would opt to take a cheaper equivalent service if it was available in their area).
To calculate potential market demand sizing for satellite broadband based on price, this analysis can be taken a step further to factor for the upstream supply situation vis-à-vis broadband service delivered by terrestrial fibre optic networks. If it can be assumed that subscribers would opt to take a less expensive equivalent terrestrially delivered broadband service if it was available in their area, the market sizing for satellite broadband can be calculated by excluding those populations within various ranges of a fibre optic node. The chart and table below shows the estimated number of subscribers for satellite broadband service in South Africa at different price points, at different ranges beyond the reach of terrestrial fibre optic nodes.

-
10
20
30
40
50
60
$500
$480
$460
$440
$420
$400
$380
$360
$340
$320
$300
$280
$260
$240
$220
$200
$180
$160
$140
$120
$100 $80
$60
$40
$20 $6
Retail Price/ Spend, USD per month
Total Market
Beyond 10km of Fibre Node
Beyond 25km of Fibre Node
Beyond 50km of Fibre Node
Sub
scrib
ers
(Mill
ion)
Chart 5: Estimated Demand for Satellite Broadband At Different Price Points, In Zones Beyond Range of Terrestrial Fibre Nodes, South Africa 2012
Table 4: Estimated Demand for Satellite Broadband At Different Price Points, In Zones Beyond Range of Terrestrial Fibre Nodes, South Africa 2012
Notes: Estimates based on total spend on telecommunications per month (i.e. the cost of fixed and/or mobile to be added on top of broadband service), does not account for installation and equipment costs, assumes an equal spatial distribution of monthly income across populations within and beyond different ranges of fibre optic nodes.
Price per month US$ 500 US$ 250 US$ 150 US$ 100 US$ 71 US$ 50
Total 463,814 990,634 1,732,986 2,701,351 3,930,288 5,769,666
Beyond 10km 232,455 496,487 868,540 1,353,866 1,969,787 2,891,649
Beyond 25km 44,720 95,515 167,091 260,459 378,951 556,300
Beyond 50km 2,974 6,351 11,111 17,319 25,198 36,991

T h e S o c i o - E c o n o m i c I m p a c t o f B r o a d b a n d i n s u b - S a h a r a n A f r i c a : T h e S a t e l l i t e A d v a n t a g e
P a g e 2 5
The real effects of price elasticity start to take effect where trunk satellite bandwidth is distributed through a broadband access network, and subscribers pay much lower monthly subscriptions. In the Scottish case study on page 30, Avanti provide a broadband solution using the HYLAS 1 Ka-band satellite, based on providing satellite broadband to individual homes and businesses, and linking properties in larger communities through WiFi and providing a single high bandwidth satellite connection to the Internet.
In this model, if a host were to charge its neighbours for WiFi access in order to cover the cost of the satellite link, controlling the number of users with a paid-for network password, these small wireless clusters may enable the pricing per user to fall very significantly. For example, if a satellite service was priced at US$ 100 per month and a host provides WiFi to three neighbours, the satellite broadband cost is covered if each user paid US$ 25 per month. If the WiFi was provided to nine neighbours, the quality of service may decrease at peak times of the day when more users access the internet, but the cost falls to US$ 10 per user per month. This is also scaleable: greater capacity would be required as the number of users increased, so the host could therefore upgrade from a 512 Kbps package to 1 Mbps, 2 Mbps and so on to maintain quality levels.

Section 5.Key Findings and Conclusions
The Broadband Commission in its Broadband Challenge36 published in October 2011 recognised that: “Broadband technologies are fundamentally transforming the way we live. It is vital that no one be excluded from the new global knowledge societies we are building”, “that communication is not just a human need – it is a right” and that “The benefits of broadband are profound – in opening up young minds to new horizons through educational technologies; in empowering women to expand their opportunities through genuine choices; in improving awareness of hygiene and healthcare; and in helping family breadwinners find work, a better salary or return on their goods. Through broadband, the provision of public services is transformed to make them global public goods for the global good. Greater access to the Internet and broadband applications and services help accelerate achievement of internationally-agreed development goals, including the Millennium Development Goals (MDGs)”.
36 http://www.broadbandcommission.org/Documents/Broadband_Challenge.pdf
“Broadband is certainly the next tipping point, the next truly transformational technology. It can generate jobs, drive growth and productivity, and underpin long-term economic competitiveness. It is also the most powerful tool that we have at our disposal in our race to meet the Millennium Development Goals”.
Dr Hamadoun I. TouréSecretary-General of the International Telecommunication Union (ITU)

T h e S o c i o - E c o n o m i c I m p a c t o f B r o a d b a n d i n s u b - S a h a r a n A f r i c a : T h e S a t e l l i t e A d v a n t a g e
P a g e 2 7
Broadband has been shown to be not solely a consequence of economic development but a cause accelerating economic growth by 1.38%37 with every 10% increase in broadband penetration. However, despite recent growth, Africa still has very limited fibre capacity, with more than 341 million people living beyond the reach of a terrestrial fibre node, which will severely impact on the development of digital based economies. Extending or constructing new fibre networks will take considerable time and involve extensive costs. The introduction of Ka-band International IP Trunking capable of delivering high capacity bi-directional data links will transform international IP trunking across Africa.
Satellites and especially the new generation of high throughput Ka-Band satellites such as Avanti’s HYLAS 2, have a vital role to play in ensuring that no one should ever be excluded from the knowledge society. Avanti’s satellite-based International IP Trunking proposition and others like it will help sub-Saharan African ISPs, mobile operators and large corporate network operators step these constraints and keep pace with market growth.
37 World Bank “Information and Communications for Development 2009: Extending Reach and Increasing Impact” (2009).

The perception that satellite broadband services are too expensive for mass market uptake is no longer valid. The supply situation has changed fundamentally: the recent introduction of Ka-band satellites have brought much more satellite capacity to the region, and the lower unit costs of Ka-band compared to Ku-band and C-band services enables significantly lower retail pricing for satellite broadband services.
Satellite networks are complementary to terrestrial and submarine cable networks, and enhance the broadband delivery ecosystem. Africa’s service providers use a mixture of terrestrial and satellite transmission and access networks in order to optimally and most cost-effectively deliver broadband services.
Despite the spread of fibre optic submarine and terrestrial cables across sub-Saharan Africa, these cable networks inevitably remain vulnerable to being cut or damaged, which has resulted in some downtime. Services have been restored during these outages using other networks, and satellite has played an extremely important role in this.
Satellite broadband is the key to achieving rural access and therefore a key ingredient for equitable socio-economic development. Unlike submarine cables or terrestrial fibre optic networks, satellite bandwidth can be delivered to any location in Africa. The socio-economic benefits of providing broadband through satellites in rural areas include helping to redress the urban/rural divide in broadband access, and the implications for economic growth associated with broadband.
Ka–band satellite broadband services can make an important contribution to meeting African governments’ broadband targets, including bringing Internet access to 40% of households in developing countries by 2015, and increasing the penetration of broadband to approximately 80% of Africans by 2020.
Policy and regulations designed to enhance broadband should recognise the role that satellites can play in delivering cost effective services. At one level this can include limiting taxation on ICT services to enable broadband markets to realise their full growth potential. At another level, it includes the promotion of coordinated international standards for interoperability, addressing the availability of adequate radio frequency spectrum, and recognizing that spectrum should be regarded as a resource for socio-economic development.
Conclusions
1.
2.
3.
4.
5.
6.

T h e S o c i o - E c o n o m i c I m p a c t o f B r o a d b a n d i n s u b - S a h a r a n A f r i c a : T h e S a t e l l i t e A d v a n t a g e
P a g e 2 9

Annex A.Sectoral Impact ofSatellite Communications
What is clear is that within the communities of 341 million people beyond a 50km range of an operational fibre optic network, and the 522 million beyond a 25km reach, there are tens of thousands of government offices, schools, universities, hospitals, health centres, and businesses in different sectors such as mining, oil and gas, agriculture, and tourism that can only receive broadband through satellite. Africa is not unique in this situation, and the Broadband for Scotland case study below demonstrates how Avanti is effectively delivering Ka-band satellite broadband in other parts of the world.
In August 2001, Scottish broadband coverage, as a result of the private sector’s commercial investment, was just 43% compared to 63% in the UK. The Scottish Executive’s Broadband Strategy was launched; its aim was for pervasive and affordable broadband in Scotland.
Initial action was to stimulate the market through awareness raising and encouraging consumer and business take-up. By creating the market demand for broadband, BT and others responded to the commercial opportunity and improved their roll-out of broadband infrastructure to cover around 97% of the Country.
In June 2004, a target of affordable broadband to every community by the end of 2005 was set, reflecting the need to deliver to rural and remote areas where broadband was still unavailable. This was achieved by a supply-side intervention – the Broadband for Scotland project.
The first phase of the project was to encourage further expansion in fixed line broadband infrastructure (ADSL). Following an open procurement, a contract was awarded to BT to upgrade 378 Scottish telephone exchange areas that were not commercially viable for broadband. However, a substantial number of homes and businesses across Scotland remained beyond the reach of the extended broadband network; fixed-line technology simply could not deliver service to them.
Broadband for Scotland Case Study
Rural Broadband Becomes The Challenge

T h e S o c i o - E c o n o m i c I m p a c t o f B r o a d b a n d i n s u b - S a h a r a n A f r i c a : T h e S a t e l l i t e A d v a n t a g e
P a g e 3 1
These “Not-Spots” were not restricted to the Highlands and Islands, communities across the whole of Scotland were affected by the digital divide. The Scottish Government built up a database of 1600 individuals and businesses that could not access broadband; this was subsequently used to encourage telecommunications providers to recognise the commercial opportunity that Not Spots provided.
An additional £3.3 million was made available for further activity to deliver broadband to those areas without coverage. An industry event was held in May 2007, with over 30 potential suppliers and other interested bodies at the meeting. The options around the delivery of alternative broadband solutions (e.g. small wireless networks) were explored in detail, given that there was no BT solution to the Broadband Reach problem.
The Scottish Government considered two funding models and decided that:
A community grant scheme would not produce the scale necessary to create a workable solution across the Country, particularly for smaller communities.
The procurement approach represented the best mechanism to achieve its objective of delivering an affordable and sustainable broadband solution to all of its Not Spots.
The Government wanted to create a solution that was sustainable without further investment of public funds in the future. Funding was therefore capital only; no on-going support of end user pricing was available to the bidders.
The Choice Of The Best Funding Model
Scotland Broadband Not-Spots – November 2007 (Source: Scottish Government)

The project’s success depended on reaching as many potential customers as possible. The Scottish Government launched a national marketing campaign using press (see right), radio, internet and direct advertising aimed at narrow band internet users who could not access broadband.
This generated a large number of enquiries which led in turn to the trebling of the number of households and businesses expressing serious interest in buying broadband. At the time of the contract the total number of registrants was nearly 4000.
An OJEU procurement began in October 2007 and attracted 20 companies who expressed an early interest. From a final short list of 4 companies, Avanti was awarded the contract in June 2008.
Avanti became the primary supplier of a satellite based broadband solution and over 2000 installations were completed bringing broadband to parts of rural Scotland for the very first time. Its solution was based on:
Satellite broadband to individual homes and businesses.
Linking properties in larger communities through WiFi and providing a single high bandwidth satellite connection to the Internet.
The ISP services including e-mail and web-hosting.
Marketing To The People
Procuring The Best Solution
Avanti’s Winning Solution
T h e S o c i o - E c o n o m i c I m p a c t o f B r o a d b a n d i n s u b - S a h a r a n A f r i c a : T h e S a t e l l i t e A d v a n t a g e
P a g e 3 3
No one solution fits everywhere:
Standalone satellite for remote locations
Small wireless clusters with satellite backhaul can be very cost effective where fixed line broadband is non-existent or of poor quality
Bandwidth choice is valued. With ADSL / cable, the maximum bandwidth is determined by locality and is very low for rural populations.
The Scottish Government ensured project success by effective marketing to its constituents – this provided a platform of customers to attract industry interest.
Central procurement offered better scale than community grants.
The Scottish Government tender was technology neutral – this ensured that all potential technologies could be considered and ensured value-for-money for the people of Scotland.
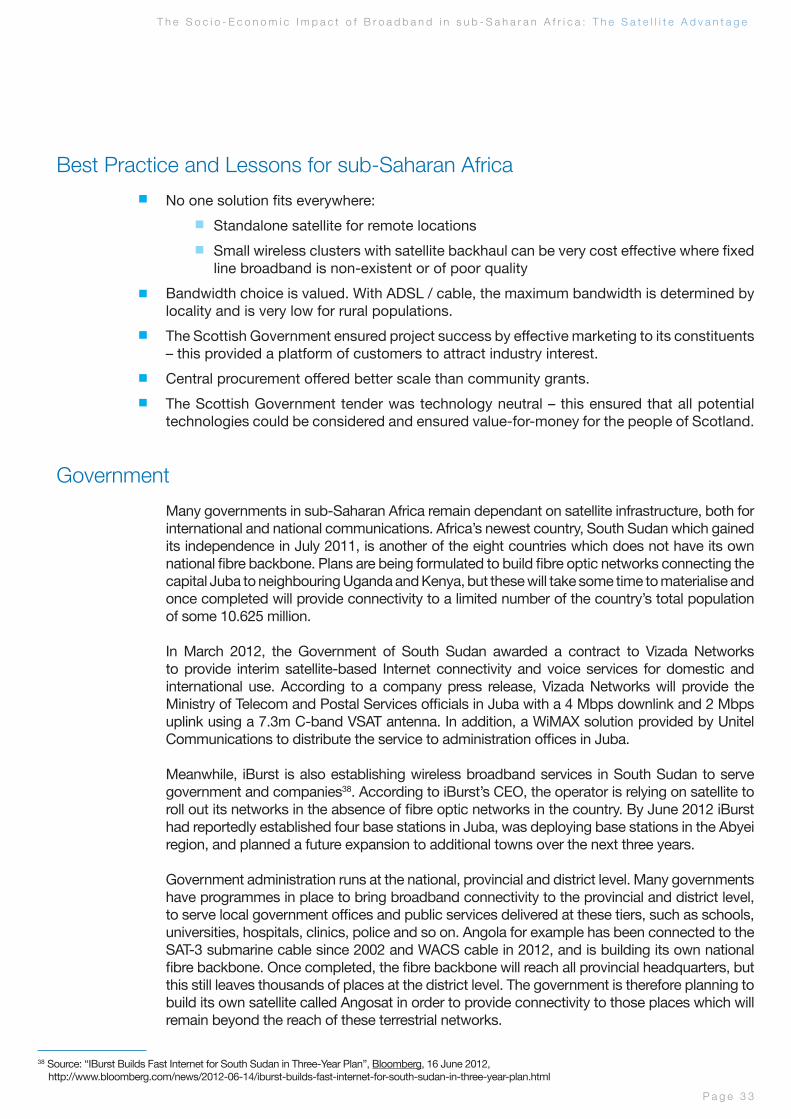
Many governments in sub-Saharan Africa remain dependant on satellite infrastructure, both for international and national communications. Africa’s newest country, South Sudan which gained its independence in July 2011, is another of the eight countries which does not have its own national fibre backbone. Plans are being formulated to build fibre optic networks connecting the capital Juba to neighbouring Uganda and Kenya, but these will take some time to materialise and once completed will provide connectivity to a limited number of the country’s total population of some 10.625 million.
In March 2012, the Government of South Sudan awarded a contract to Vizada Networks to provide interim satellite-based Internet connectivity and voice services for domestic and international use. According to a company press release, Vizada Networks will provide the Ministry of Telecom and Postal Services officials in Juba with a 4 Mbps downlink and 2 Mbps uplink using a 7.3m C-band VSAT antenna. In addition, a WiMAX solution provided by Unitel Communications to distribute the service to administration offices in Juba.
Meanwhile, iBurst is also establishing wireless broadband services in South Sudan to serve government and companies38. According to iBurst’s CEO, the operator is relying on satellite to roll out its networks in the absence of fibre optic networks in the country. By June 2012 iBurst had reportedly established four base stations in Juba, was deploying base stations in the Abyei region, and planned a future expansion to additional towns over the next three years.
Government administration runs at the national, provincial and district level. Many governments have programmes in place to bring broadband connectivity to the provincial and district level, to serve local government offices and public services delivered at these tiers, such as schools, universities, hospitals, clinics, police and so on. Angola for example has been connected to the SAT-3 submarine cable since 2002 and WACS cable in 2012, and is building its own national fibre backbone. Once completed, the fibre backbone will reach all provincial headquarters, but this still leaves thousands of places at the district level. The government is therefore planning to build its own satellite called Angosat in order to provide connectivity to those places which will remain beyond the reach of these terrestrial networks.
Best Practice and Lessons for sub-Saharan Africa
Government
38 Source: “IBurst Builds Fast Internet for South Sudan in Three-Year Plan”, Bloomberg, 16 June 2012, http://www.bloomberg.com/news/2012-06-14/iburst-builds-fast-internet-for-south-sudan-in-three-year-plan.html

Africa is the world’s youngest continent; some 70% of people are under the age of 30 and 48.2% aged 14 or younger. This means effective education remains critically important for the future of the region39. School pupils and university students represent the next generation of Internet users, which are entering the labour market each year. The Association of African Universities (AAU) conducted a connectivity survey40 during 2008 from universities in West and Central Africa. The study identified a bandwidth deficit for universities in the region and that under current procurement arrangements, these universities would fall further and further behind their own estimated bandwidth requirements and the level of bandwidth which is required for performance-leading work and teaching conditions.
The total Internet bandwidth of the 51 universities included in the survey was 73.7 Mbps (download) and 41.8 Mbps (upload) in 2008. Of this total, 48% of the total bandwidth (35.3 Mbps) was supplied by satellite and in Nigeria which has been connected by submarine cable at Lagos since 2002 some 17 out of 19 universities relied on satellite for their Internet bandwidth. The universities with the highest bandwidth were the University of Ibadan (Nigeria) with 10.392 Mbps (download), Kwame Nkrumah University of Science and Technology (Ghana) with 9 Mbps (download) and the University of Ghana (Legon) with 7.168 Mbps (download). One university, the Sa’Adatu Rimi College of Education (Nigeria) had one single computer connected to the Internet with one dial-up link of 56 Kbps, for a student population of 21,000 and 320 members of teaching and research staff.
Education
39 Source: Regional Overview of United Nations Economic Commission for Africa and the United Nations Programme on Youth, 2012. 40 Source: AAU Connectivity Survey: Addressing the Demand for Connectivity of Higher Education Institutions (HEIs) in the West and Central Africa Region”, October 2008 http://events.aau.org/userfiles/file/AAU_Connectivity%20Survey_2010_PHamilton.pdf

T h e S o c i o - E c o n o m i c I m p a c t o f B r o a d b a n d i n s u b - S a h a r a n A f r i c a : T h e S a t e l l i t e A d v a n t a g e
P a g e 3 5
The average price paid by these West African universities had decreased dramatically between 2004 and 2008 to a third of the average of US$ 9,220 per Mbps per month. This had dropped to US$ 2,980 per Mbps (2008), from US$ 3,570 per Mbps (2007), US$ 5,590 per Mbps (2006) and US$ 9,220 per Mbps (2005). The chart below shows that the price paid for satellite capacity fluctuated between about US$ 3,500 and US$ 4,500 per Mbps during the period, and indeed had increased during 2008 due to the shortage of supply.
The study found that if the price that West and Central African universities paid for their bandwidth decreased to the same level that universities in the US and OECD countries pay for their connectivity (US$ 120 per Mbps), they would with the same budget that they already had in 2008 be able to afford to buy enough bandwidth to meet their own estimated requirements over the next five years. If the price for bandwidth decreased, using the same budget that they had in 2008, in order to buy enough bandwidth to meet these requirements the price per Mbps per month would have to decrease to US$ 430 to reach their current (2008) requirement, US$ 230 to reach their estimated requirement in 2010, and US$120 to meet their estimated requirement in 2013.
41 Source: AAU Connectivity Survey http://connectsurvey.aau.org
Bandwidth Usage Vs Estimated Requirement: Comparison of Survey HEIs, Survey Countries and Total Region (Subscribed Bandwidth)
17 41 59 74
329466
603
788972
1,156
965
1,172
1,378
1,700
2,021
2,343
1,071
1,322
1,572
1,953
2,334
2,716
-
500
1,000
1,500
2,000
2,500
3,000
2005 2006 2007 2008 2009 2010 2011 2012 2013
Mbp
sActual Survey HEIs
Estimated RequirementSurvey HEIsEstimated RequirementSurvey CountriesEstimated Requirement AllCountries
Chart 6: Bandwidth Usage Vs Estimated Requirement: Comparison of Survey HEIs, Survey Countries and Total Region (Subscribed Bandwidth)
Source: AAU Connectivity Survey41
Deficit

Average Price Per Kbps West African HEIs, By Type of Connectivity
-
1.00
2.00
3.00
4.00
5.00
6.00
7.00
8.00
2005 2006 2007 2008
US$
per K
bps
1. Leased line – fibre2. Leased line – wireline3. Leased line – wireless/ radio link4. Satellite or VSAT
Chart 7: Average Price Paid Per Kbps of Bandwidth, West African Universities
Chart 8: Average Price Paid Per Kbps of Bandwidth By Type Of Connectivity, West African Universities
Table 5: Average Price Paid By Universities For Their Internet Connectivity (US$ Per Mbps Per Month), Average and By Type Of Connectivity
Average Price Per Kbps, West African HEIs
9.22
5.59
3.572.98
-
1.00
2.00
3.00
4.00
5.00
6.00
7.00
8.00
9.00
10.00
2005 2006 2007 2008
USD
per K
bps
Source: AAU Connectivity Survey
Source: AAU Connectivity Survey
Source: AAU Connectivity Survey42
2005 2006 2007 2008
Average 9,222 5,588 3,570 2,982
Leased Line – Fibre 4,149 4,149 2,270 1,235
Leased Line – Wireline 3,990 3,507 3,494
Leased Line – Wireless 7,000 4,876 3,506 2,605
Satellite or VSAT 3,461 4,737 3,582 4,479
42 Source: AAU Connectivity Survey http://connectsurvey.aau.org

T h e S o c i o - E c o n o m i c I m p a c t o f B r o a d b a n d i n s u b - S a h a r a n A f r i c a : T h e S a t e l l i t e A d v a n t a g e
P a g e 3 7
For decades the development and modernisation of the agricultural sector in sub-Saharan Africa has been seen as a necessary condition if it is to be a key driver of socio-ecnomic development. In South Africa, more than 99% of the population lives within range of a GSM signal for voice services, and the mobile penetration rate is now over 100%. South Africa also has the highest number of broadband subscribers in sub-Saharan Africa, and in 2010 the broadband penetration rate was 1.48% for fixed and 16.2% for mobile broadband services (source: ITU, Wireless Intelligence43). But even in South Africa, which has the regions highest amount of international bandwidth supplied by submarine cable, and the most extensive terrestrial fibre network, there remains a significant market for satellite broadband services.
As the Fibre Reach map shows, South Africa’s towns and cities are pretty comprehensively covered with terrestrial fibre optic networks. In June 2012, almost half of all South Africans (24.9 million) lived within a 10km range of a live fibre optic network connected to a submarine cable. South Africa is now served by six submarine cables landing in Mtunzini, Melkosstrand and Yzerfontein: SAT-2, SAT-3, SAFE, SEACOM, EASSy, and WACS. Telkom SA has deployed over 146,000 route-km of terrestrial fibre across South Africa, more than any other African operator, and more than a third of the total for sub-Saharan Africa. Market liberalisation has also seen the entrance of a number of other operators building their own long-haul and metropolitan fibre optic networks. Beyond this core fibre backbone, South Africa’s mobile operators have also built extensive microwave networks which have the capacity to provide 2G and 2.5G services.
As a result of this investment in infrastructure and competiton, the average price of fixed broadband access in South Africa has decreased to 5.7% of GNI per capita (source: ITU44), one of the lowest in Africa. This is successfully stimulating the uptake of broadband services among those within physical reach of a broadband network, as the case study for Vodacom demonstrates. In the first half of 2012, South Africa had over a million fixed broadband subscribers (827,091 ADSL subscribers and 192,000 broadband wireless subscribers), 3.5 million 3G and HSPA subscribers, and a total of 23.2 million mobile data users45.
Nonetheless, South Africa is a vast country, and table 2 shows that 25.5 million South Africans still live beyond a 10km reach, 4.9 million beyond a 25km reach, and 326,759 beyond a 50km reach of an operational fibre optic node. Whilst mobile data GPRS and EDGE services are being extended to cover the whole of the 2G footprint, the coverage of not just fixed but also mobile 3G and HSPA broadband networks are constrained to the availability of fibre nodes. In rural areas beyond the reach of these fibre networks for example, many of South Africa’s communities, businesses such as farmers and lodges for example rely for their Internet connectivity on EDGE mobile services46 and are turning increasingly to satellite broadband services. In the second half of 2012 South Africa is now seeing the entrance of competitively priced Ka-band satellite broadband services, which are priced at less than half that of existing satellite broadband services47 and even compete against fixed broadband services48.
Agriculture
43 Source: ITU Broadband Atlas http://www.itu.int/ITU-D/treg/atlas/broadbandatlas.asp 44 Measuring the Information Society 2011, published by the International Telecommunications Union (ITU). http://www.itu.int/ITU-D/ict/publications/idi/index.html45 Source: Vodacom Annual Results, Telkom Annual Results, “South African Broadband Numbers”, MyBroadband.co.za, 22 April 2012 http://mybroadband.co.za/news/broadband/45153-south-african-broadband-numbers.html 46 See for example “Affordable Satellite Bandwidth for SA”, MyBroadband.co.za, 21 May 2012 http://mybroadband.co.za/news/broadband/50585-affordable-satellite-bandwidth-for-sa.html and “Uncapped Satellite Broadband For Rural SA”, MyBroadband.co.za,29 July 2011 http://mybroadband.co.za/news/broadband/30326-uncapped-satellite-broadband-for-rural-sa.html 47 Source: “Satellite Broadband Pricing Comparison” MyBroadband.co.za, 25 January 2012 http://mybroadband.co.za/news/broadband/41753-satellite-broadband-pricing-comparison.html48 Source: “The Curious Case of Cheap Satellite Broadband in SA”, MyBroadband.co.za, 28 May 2012 http://mybroadband.co.za/news/broadband/50911-the-curious-case-of-cheap-satellite-broadband-in-sa.html

49 Source: “Infrastructure and Growth in Sierra Leone“, African Development Bank (AfDB), 2011p.31- 33 http://www.afdb.org/fileadmin/uploads/afdb/Documents/Project-and-Operations/Infrastructure%20and%20Growth%20in%20Sierra%20Leone.pdf50 Source: “Strategic Impact On Fiber Optic Communications Infrastructure On ICT Development in Sierra Leone”, Concord Times, 15 June 2011.
Sierra Leone, another of the eight countries that remained wholly dependent on satellite, provides an example of how satellite broadband serves the mining sector. Sierra Leone is richly endowed with precious minerals and metals, base and ferrous metals, and petroleum and gas have also been discovered offshore. Minerals accounted for over 90% of Sierra Leone’s exports until 2007, and even with the expansion of other economic sectors since then still accounted for 55% of exports by 2010 according to the African Development Bank (AfDB)49. Sierra Leone’s mining sector comprises of artisanal mining, and the industrial mining of both precious metals and non-precious metals. These mineral deposits and the mining companies extracting them are located across the country, often in difficult-to-reach hilly terrain. The nearest diamond mines, for example, are located nearly 100km to the north of the capital Freetown, and many are over 250km from the capital towards the borders with Guinea and Liberia. Most of the country’s gold deposits are located in a belt running some 180km to 280km to the north east of Freetown. However, the AfDB reports that obstacles to the development of the sector include poor roads, a lack of rail transport, a lack of electricity and the poor state of repair of port facilities. As a result of these obstacles, those companies presently running mining operations must be largely self-sufficient in addressing their own infrastructure requirements. Sierra Leone will be connected to the ACE submarine cable in October 2012, and plans to build a fibre backbone of over 1,000km along the major roads connecting to neighbouring Guinea and Liberia, and also main towns throughout the country. The government also plans to deploy WiMAX sites at nodes on this fibre backbone, but until this is completed and afterwards there will continue to remain many sites which can only be reached by satellite. “Connectivity between Sierra Leone and the outside world relies exclusively on expensive satellite with limited availability of high-capacity bandwidth,” said the Information Minister of Sierra Leone speaking in June 201150. “As a result, Sierra Leone has some of the highest connectivity costs in the world - with average satellite prices between US$4,000 - 5,000 for 1 Mbps (compared with about US$200 in the US, and approximately US$500 in East Africa). Limited speed monthly packages are US$200 a month, representing 56.8% of GDP per capita. This, coupled with a lack of national backbone infrastructure has created a difficult environment for expanding availability of Internet services and advanced applications”.
Mining

T h e S o c i o - E c o n o m i c I m p a c t o f B r o a d b a n d i n s u b - S a h a r a n A f r i c a : T h e S a t e l l i t e A d v a n t a g e
P a g e 3 9
Fibre Reach Mobile App, Africa Bandwidth Maps, http//www.africabandwidthmaps.com
“AAU Conectivity Survey: Addressing the Demand for Connectivity of Higher Education Institutions (HEIs) in the West and Central Africa Region”, Association of African Universities (AAU), October 2008. http://connectsurvey.aau.org
“Africa’s International Bandwidth Approaches 1 Tbps Mark”, Africa Bandwidth Maps, 19 April 2012 http://www.africabandwidthmaps.com/?p=2787
“Africa’s Fibre Roll-Out: 138 RouteKms of New Fibre Network Enters Service Per Day”, Africa Bandwidth Maps, 1 November 2011 http://www.africabandwidthmaps.com/?p=2572
“Infrastructure and Growth in Sierra Leone“, African Development Bank (AfDB), 2011 p.31- 33 http://www.afdb.org/fileadmin/uploads/afdb/Documents/Project-and-Operations/Infrastructure%20and%20Growth%20in%20Sierra%20Leone.pdf
“The Case for “Open Access” Communications Infrastructure in Africa: The SAT-3/WASC cable – A Briefing”, May 2008 APC Publications, Abiodun Jagun et al. http://www.apc.org/en/system/files/APC_SAT3Briefing_20080515.pdf
ARPT Guinee http://www.arptguinee.org/ObservatoireGuinee2010Internet.pdf
“Avanti Powers Digital Economies Across Africa and Middle East With New Ka-band International IP Trunking Using Novelsat’s NS3 Technology”, Avanti Communications, 23 May 2012. http://www.avantiplc.com/news/press-releases/avanti-powers-digital-economies-across-africa-and-middle-east-new-ka-band-intern
“The Broadband Challenge”, Broadband Commission for Digital Development, October 2011 http://www.broadbandcommission.org/Documents/Broadband_Challenge.pdf
“Quarterly Sector Statistics Report, October – December 2011/12”, 17 April 2012, Communications Commission of Kenya (CCK) http://www.cck.go.ke/resc/downloads/SECTOR_STATISTICS_REPORT_Q2_2011-12.pdf
“Strategic Impact On Fiber Optic Communications Infrastructure On ICT Development in Sierra Leone”, Concord Times, 15 June 2011.
“Broadband Nigeria – The Next Frontier?”, April 2012, Paper presented by Main One Cable Company Nigeria Limited at the Nigerian Communication Commission’s Stakeholders Consultative Forum for the Year 2013 – 2017 Strategic Management Plan. http://www.mainonecable.com
‘National Broadband Policy 2012 – 2020’, Mauritius Ministry of Information and Communication Technology, January 2012. http://www.icta.mu/documents/nationalbroadbandpolicy2012.pdf
ITU Broadband Atlas, International Telecommunications Union (ITU), http://www.itu.int/ITU-D/treg/atlas/broadbandatlas.asp
“2011 ICT Facts and Figures”, International Telecommunications Union (ITU). http://www.itu.int/ITU-D/ict/facts/2011/material/ICTFactsFigures2011.pdf
“The Missing Link”. The report of the Independent Commission for World Wide Telecommunications Development, better known as the “Maitland Report”, after its chairman Sir Donald Maitland, was published by ITU in 1984. Source: http://www.itu.int/osg/spu/sfo/missinglink/index.html
“Measuring the Information Society 2011”, International Telecommunications Union (ITU). http://www.itu.int/ITU-D/ict/publications/idi/index.html
“Broadband for Africa: Developing Backbone Communications Networks”, M J Williams, 2010. The World Bank. http://www.infodev.org/en/Publication.526.html
“Information and Communications for Development 2009: Extending Reach and Increasing Impact” Chapter 3 - Economic Impacts of Broadband, Christine Zhen-Wei Qiang, Carlo M. Rossotto, Kaoru Kimura, The World Bank.http://web.worldbank.org/WBSITE/EXTERNAL/TOPICS/EXTINFORMATIONANDCOMMUNICATIONANDTECHNOLOGIES/EXTIC4D/0,,contentMDK:22229759~menuPK:5870649~pagePK:64168445~piPK:64168309~theSitePK:5870636,00.html
Bibliography

The Commonwealth Telecommunications Organisation (CTO) is the oldest and largest Commonwealth organisation in the field of Information and Communication Technologies (ICTs). With a history dating back to 1901, we bring together Commonwealth & non-Commonwealth governments, regulatory agencies, operating companies, technology providers and civil society organisations, in multi-stakeholder partnerships. Our mission is to promote, facilitate and guide members in using ICTs to deliver effective development interventions and we deliver on our mandate through research & consultancies, training & capacity building, and international events & conferences. We use our experience and expertise to support members in leveraging ICTs to advance socio-economic development in order to emancipate, enrich, equalise and empower all peoples within the Commonwealth and beyond.
Avanti sells satellite data communications services to telecoms companies which use them to supply residential, enterprise and institutional users. Avanti’s first satellite, called HYLAS 1, launched on November 26th 2010 and was the first Ka-band satellite launched in Europe. Avanti’s second satellite, HYLAS 2, will extend Avanti’s coverage to Africa and the Middle East. Avanti’s third satellite HYLAS 3, to be launched in partnership with ESA in 2015, will provide further capacity in the EMEA region. Some 80% of Avanti’s fleet capacity will address the emerging telecommunications markets of Africa and the Middle East.
Commonwealth Telecommunications Organisation
Avanti Communications Group plc

+44 (0)20 7749 [email protected]
Go where you want to go +44 (0) 20 8600 3800 [email protected] www.cto.int