THE SOCIO-ECONOMIC ANALYSIS OF AGRITOURISM IN TWO RURAL COMMUNITIES IN THE
84
THE SOCIO-ECONOMIC ANALYSIS OF AGRITOURISM IN TWO RURAL COMMUNITIES IN THE LIMPOPO PROVINCE by KHEHLA ISAAC MNGUNI Submitted in accordance with the requirements for the degree of MASTER OF SCIENCE in the subject AGRICULTURE at the UNIVERSITY OF SOUTH AFRICA SUPERVISOR: PROF. FDK ANIM JANUARY 2010
Transcript of THE SOCIO-ECONOMIC ANALYSIS OF AGRITOURISM IN TWO RURAL COMMUNITIES IN THE

THE SOCIO-ECONOMIC ANALYSIS OF AGRITOURISM IN TWO RURAL
COMMUNITIES IN THE LIMPOPO PROVINCE
by
KHEHLA ISAAC MNGUNI
Submitted in accordance with the requirements for
the degree of
MASTER OF SCIENCE
in the subject
AGRICULTURE
at the
UNIVERSITY OF SOUTH AFRICA
SUPERVISOR: PROF. FDK ANIM
JANUARY 2010

2
DECLARATION
I declare that THE SOCIO-ECONOMIC ANALYSIS OF AGRITOURISM IN TWO
RURAL COMMUNITIES IN THE LIMPOPO PROVINCE is my original work and
that all the resources that have been used or quoted have been indicated and
acknowledged by means of complete references.
_____________________________ ____________________________
SIGNATURE DATE
(Mr. KI Mnguni)

3
DEDICATION
This work is dedicated to my wife Glenda Ntsako Hlongwane
and my child Khanyisile Fortunate Mnguni.
4
ACKNOWLEDGMENTS
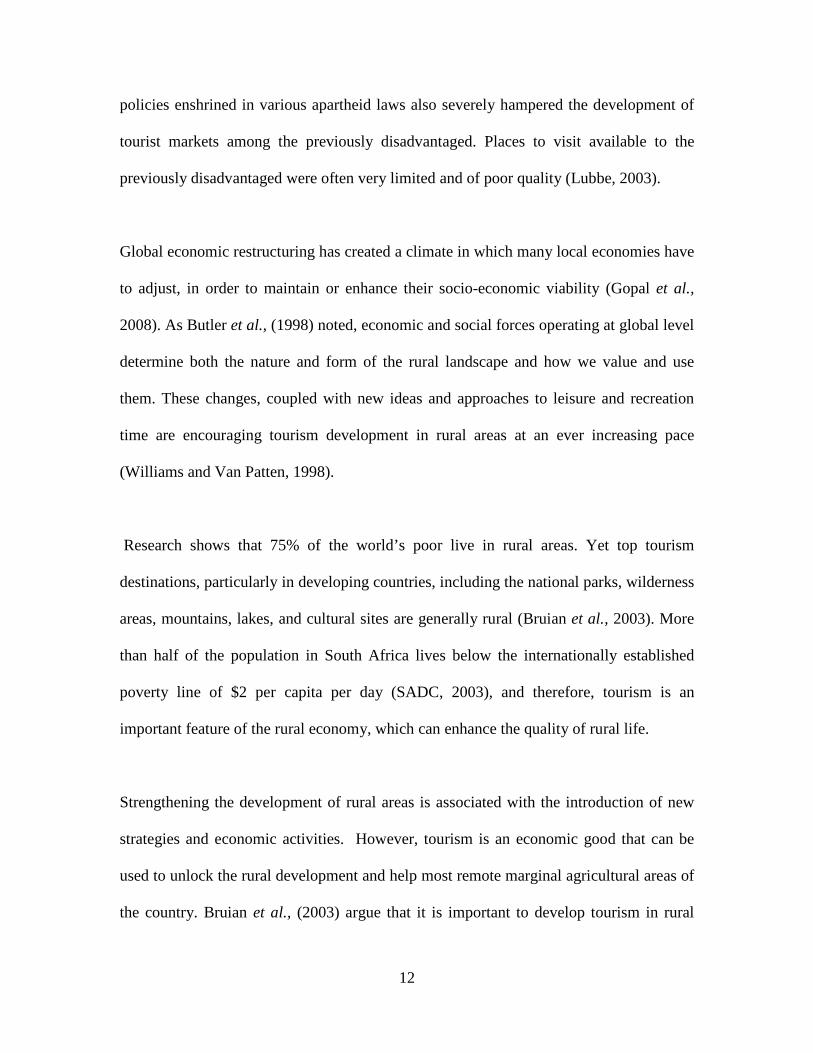
I would like to thank the Almighty God for making this study possible. I would also like
to extend gratitude to my promoter Professor Francis Anim for his hard work and time he
invested in this study. In the absence of his supervision this study would not have
succeeded. Special thanks are due to my parents, Nkosana and Ntswaki Mnguni for being
good and supportive parents.
This thesis was made possible through the financial support of the National Research
Foundation and the Centre for Rural Community Empowerment of the University of
Limpopo. I appreciate the assistance they offered me because it would not have been
possible to complete this study without financial support from them.
Lastly, I am highly indebted to individuals who were consulted during data collection
and thesis writing. Let me recognize the extension officers and farmers from Greater
Tzaneen Municipality area who assisted and made this study to be possible through their
valuable inputs.

5
THE SOCIO-ECONOMIC ANALYSIS OF AGRITOURISM IN TWO RURAL
COMMUNITIES IN THE LIMPOPO PROVINCE
BY
KHEHLA ISAAC MNGUNI
Degree: MSc in Agriculture (Agricultural Economics)
Department: Agriculture, Animal Health and Human Ecology
Promoter: PROF. FDK ANIM
ABSTRACT
The main aim of the study was to analyze the socio-economic variables effecting
agritourism business using data from two rural communities of the Limpopo province,
Nwa’metwa and Lenyenye. The results showed that there are significant socio-economic
differences among agritourism and non-agritourism farmers. The socio-economic
variables used are literacy, gender, age, land size and family size.
Two multinomial models were used to model agritourism behavior. The two models,
namely fully and partially registered agritourism farmers were estimated. Non-registered
agritourism farmers were used as the reference group. These models denoted the relative
probability of both fully and partially registered agritourism farmers to the probability of
the non-registered agritourism farmers.

6
The logarithm results implied that older farmers were less likely to prefer to operate
business as a fully or partially registered agritourism farmer compared to the non-
registered agritourism group. Farmers’ decisions in business operation were informed by
their level of education, experience as well as social networks.
Key terms: Tourism; Agritourism; Rural communities; Rural development, Sustainable
agricultural diversity, Socio-economic development; Rural economy; Tourism life cycle
model; Modelling agritourism farmer behavior; Multinomial logit

7
TABLE OF CONTENTS
PAGE
ACKNOWLEDGMENTS ................................................................................................ 4
TABLE OF CONTENTS ................................................................................................. 7
ACRONYMS AND ABBREVIATIONS ....................................................................... 10
CHAPTER 1 .................................................................................................................... 11
INTRODUCTION ........................................................................................................... 11
1.0 Background ................................................................................................................. 11
1.1 Problem statement and justification ............................................................................ 14
1.1.1 Problem statement ................................................................................................ 14
1.1.2 Justification .......................................................................................................... 17
1.2 Aim and objectives ..................................................................................................... 18
1.2.1 Aim ...................................................................................................................... 18
1.2.2 Objectives ............................................................................................................ 19
1.3 Hypotheses .................................................................................................................. 19
1.4 Outline of the study ..................................................................................................... 19
CHAPTER 2 .................................................................................................................... 21
LITERATURE REVIEW .............................................................................................. 21
2.0 Theoretical concepts ................................................................................................... 21
2.1 Tourism area life cycle model ..................................................................................... 21
2.2 Forms of agritourism enterprises ................................................................................ 24
2.2.1 Supplementary enterprise ..................................................................................... 24
2.2.2 Complementary enterprise ................................................................................... 24

8
2.2.3 Primary enterprise ................................................................................................ 25
2.3 Agritourism in rural areas of South Africa ................................................................. 25
CHAPTER 3 .................................................................................................................... 28
STUDY AREA AND METHODOLOGY ..................................................................... 28
3.0 Introduction ................................................................................................................. 28
3.1 Research design .......................................................................................................... 30
3.2 Data collection ............................................................................................................ 31
3.3 Econometric model ..................................................................................................... 31
3.3.1 Framework for econometric analysis ................................................................... 31
3.3.2 Modelling agritourism farmer behaviour using multinomial logit model ........... 32
3.3.3 Empirical model ................................................................................................... 35
3.3.4 Characteristics of variables used for this study .................................................... 38
CHAPTER 4 .................................................................................................................... 42
RESULTS AND DISCUSSION ..................................................................................... 42
4.0 Introduction ................................................................................................................. 42
4.1 Descriptive statistics summary ................................................................................... 45
4.2 Correlation matrix summary ....................................................................................... 47
4.3 Analysis of Variance summary ................................................................................... 49
4.4 Summary of implications of results ............................................................................ 53
CHAPTER 5 .................................................................................................................... 55
SUMMARY AND CONCLUSION ............................................................................... 55
REFERENCES ................................................................................................................ 57
APPENDIX ...................................................................................................................... 72

9
LIST OF TABLES
PAGE
Table 1: Dependent variable classified by three categories………………………….42
Table 2: Variable names and definitions of variables used………………………….43
Table 3: Case processing summary……………………………………………………43
Table 4: Descriptive statistics for explanatory variables included in the analysis....44
Table 5: Correlation matrix……………………………………………………………46
Table 6: ANOVA (Mean values)……………………………………………………….48
Table 7: Results of the Multinomial Logistic Regression (Parameter estimates)…. 50
LIST OF FIGURES
Figure 2.1 Butler’s tourism area life cycle model……………………………………….22
Figure 3.1 Detailed map of Tzaneen and surrounding area………………………...……29

10
ACRONYMS AND ABBREVIATIONS
ANOVA ANALYSIS OF VARIANCE
CDF CUMULATIVE DISTRIBUTION FUNCTION
DFID DEPARTMENT FOR INTERNATIONAL DEVELOPMENT
ESCOR ECONOMIC AND SOCIAL RESEARCH UNIT
GDP GROSS DOMESTIC PRODUCT
GOE GOVERNMENT OF ETHIOPIA
LDFED LIMPOPO DEPARTMENT OF FINANCE & ECONOMIC
DEVELOPMENT
MEMB MEMBERSHIP STATE
PDF PROBABILITY DENSITY FUNCTION
RMN REGIONAL MUNICIPALITY OF NIAGARA
SADEAT SOUTH AFRICA DEPARTMENT OF ENVIRONMENTAL AFFAIRS
AND TOURISM
SAG SOUTH AFRICAN GOVERNMENT
SADC
SPSS STATISTICAL PACKAGE FOR THE SOCIAL SCIENCES
SOUTHERN AFRICAN DEVELOPMENT COMMUNITY
UNEP UNITED NATIONS ENVIRONMENT PROGRAMME AND THE
CONVENTION ON BIOLOGICAL DIVERSITY

11
CHAPTER 1
INTRODUCTION
1.0 Background
South Africa has a unique biological diversity and has two core challenges of
sustainability, i.e. the fight against poverty and exclusion, and a growing environmental
crisis (Crane, 2007). There are various species, ecosystems and ecological processes
occurring in this country, and they attract various tourists to visit the country regularly,
especially the international tourists (Jonker, 2004), hence stimulating agricultural and
rural development. South Africa is also regarded as a centre of attraction for most tourists
although it is ranked the third most biologically diverse country in the world, and is of
major global importance for biodiversity conservation (World Conservation Monitoring
Centre, 1992 & SADEAT, 1997). There are many economic opportunities resulting from
the beauty of nature and these include rural development. Furthermore, biodiversity also
provides generic resources for food and agriculture, and therefore constitutes the
biological basis for world food security and support for human livelihoods (Kepe et al.,
2001); UNEP, 2002).
Prior to the election of a democratic government in 1994, tourism in general had been
protected from foreign competition (there were limited international investments in the
tourism facilities), demanding and long-stay tourists (Jonker, 2004). For example, in the
early 80’s and 90’s, the apartheid regime drastically slowed down the growth of tourism
in South Africa as international boycotts and sanctions took effect. The segregation
12
policies enshrined in various apartheid laws also severely hampered the development of
tourist markets among the previously disadvantaged. Places to visit available to the
previously disadvantaged were often very limited and of poor quality (Lubbe, 2003).
Global economic restructuring has created a climate in which many local economies have
to adjust, in order to maintain or enhance their socio-economic viability (Gopal et al.,
2008). As Butler et al., (1998) noted, economic and social forces operating at global level
determine both the nature and form of the rural landscape and how we value and use
them. These changes, coupled with new ideas and approaches to leisure and recreation
time are encouraging tourism development in rural areas at an ever increasing pace
(Williams and Van Patten, 1998).
Research shows that 75% of the world’s poor live in rural areas. Yet top tourism
destinations, particularly in developing countries, including the national parks, wilderness
areas, mountains, lakes, and cultural sites are generally rural (Bruian et al., 2003). More
than half of the population in South Africa lives below the internationally established
poverty line of $2 per capita per day (SADC, 2003), and therefore, tourism is an
important feature of the rural economy, which can enhance the quality of rural life.
Strengthening the development of rural areas is associated with the introduction of new
strategies and economic activities. However, tourism is an economic good that can be
used to unlock the rural development and help most remote marginal agricultural areas of
the country. Bruian et al., (2003) argue that it is important to develop tourism in rural

13
areas as this improves the wealth of the area. From an agricultural perspective, tourism is
defined as the selling of agricultural products and services to the travelers/ agritourists.
Literature has shown that little research has been conducted around agritourism
particularly in the developing countries, South Africa included. The empirical research
has indicated that agritourism has massive socio-economic benefits to the country. As a
result, this study will focus mainly on agritourism. In general, agritourism is the practice
of attracting travelers and visitors to an area or areas used primarily for agricultural
purposes, generally for educational and recreational purposes (Blacka et al., 2001).
However, these attractions often include the interaction between tourists and local farm
producers or local agricultural products (RMN, 2003).
The scope of agritourism varies drastically depending on the type of farm, available land
and how much of the business is aimed at the agritourism market. There are several
agritourism activities that farmers practice to attract agritourists to their site of operations.
These activities include wineries, aquaculture, farmer’s markets, petting farms, roadside
stands, pick-your-own operations (these are for example, fruits and farms or orchards
where the farmers’ customers harvest the commodities of their choice), overnight farm or
ranch stays, and visiting agriculture-related festivals, museums, and other such attractions
(Brown, 2002).
Hilchey (1993a) notes that long-term trends in consumer demand for tourism and
recreation suggest that agritourism enterprises can help provide an important niche

14
market for farmers throughout the nation. Among other factors, Hilchey (1993b) also
noted that there are three factors that are often the key to successful agritourism activities
namely: social skills of farm-based entrepreneurs, farm aesthetics, and proximity of farms
to urban centers.
1.1 Problem statement and justification
1.1.1 Problem statement
The poor state of the environment in rural areas of South Africa leads to a decrease in
profits to the farmers and reversal of development gains. This reduces agricultural and
rural development as well as the gross domestic products (GDP) of both national
agricultural and tourism sectors (LDFED, 2004). Agriculture remains a crucial economic
activity for majority of population in South Africa and its sustainability is mainly affected
and challenged by uncertain climatic conditions and adoption of new technology by
farmers. As a result, food security and the country’s economy are threatened by
inadequate resources in hands of farmers as well as in accessibility of agricultural
funding. There is considerable literature indicating that farmers’ production decisions are
driven by adequate resources (Berger et al., 2006; Breen et al., 2005; Mitchell and Topp,
2003; Walford, 2002).
South Africa’s agriculture is lagging behind other sectors and contributes only 2.7
percent to GDP. This poor contribution to GDP has been going on for years since 1960
(Global Insight, 2008). Therefore, the upliftment of the rural situation depends on the

15
decentralization of rural economy by means of farms’ diversification, and the
introduction of agritourism as a sustainable development strategy for a distressed rural
community.
In addition to the identified problems, there is also a risk of agrochemicals usages. The
use of agrochemicals violates the principles of organic farming. Agritourism farming like
organic farming is an environmentally responsible approach to produce high quality food.
It prohibits the use of toxic agrochemicals such as pesticides and herbicides for pest and
weed control respectively, increasing demand for family and hired labour (Crabtree et al.,
2001). The uses of these agrochemicals poses both known and unknown risks to
biodiversity which impact negatively on the success of wildlife and further reduce the
habitat quality and biodiversity of agricultural and surrounding ecosystems (Edge, 2000).
For example, most farmers in Greater Tzaneen areas practice conventional agricultural
farming with the usage of toxic agrochemicals that they apply on their farms to increase
product output, and this impacts on natural environment negatively.
Some farms are located nearer to rivers and dams, and during rainy times, chemical
pollution occurs in water and affects health status of downstream users negatively
(humans and livestock), decrease fish productivity and disturb aquatic ecosystem in
different ways. These recipients of negative external effects have no way of charging the
upstream users, the farmers polluting water. Hence farmers using chemicals impose costs
to other members of the society.

16
The agrochemicals used are also increasing the susceptibility of certain plants to diseases,
and this poses a special threat to endangered plant species (Riley and Silver, 2001).
Furthermore, there are some endangered bird species that could attract agritourists in
places such as Limpopo. Examples are the big six namely: Ephippiorhynchus
senegalensis, Scotopelia peli, Torgos tracheliotus, Ardeotis kori, Polemaetus bellicosus
and Bucorvus leadeateri available in some areas of Limpopo province including Greater
Tzaneen area, and they could be vulnerable to some agrochemicals (Engelbrecht, 2005).
The prolific bird life of Greater Tzaneen area makes it a great attraction for bird lovers,
researchers and tourists alike. To avoid the extinction of these bird species,
conservationists and environmentalists should provide farmers with information such as
the risks of chemicals that could harm the environment. Chemicals minimize biodiversity
conservation, resulting in a degradation of rural tourism opportunities.
Environmental problems related to agricultural and rural development have been a major
public concern in South Africa, as elsewhere, in recent years (Anim, 1998), and South
Africa is considered as a major global importance for biodiversity conservation
(SADEAT, 1997). Therefore, it is a tremendous responsibility of the farmers and
employees to maintain and improve the management of natural resources (De Klerk,
2003).

17
1.1.2 Justification
This study was aimed at analysing the socio-economic variables effecting agritourism
business in two rural communities of Greater Tzaneen area. The research findings are
intended to be of benefit to the individual farmers and residents of the Greater Tzaneen,
because agritourism business has potential to stimulate rural development. Agritourism
promotes environmentally sound farming production methods that do not only increase
productivity, but also arrest land degradation as well as reclaim, rehabilitate, restore and
enhance biological diversity and monitor adverse effects on sustainable agricultural
diversity (Clemens, 2004). Fadeyibi and Oredegbe (2009) indicated that agritourism is
also a mitigating factor for farm income losses.
The great opportunities of agritourism can be attained in South Africa if there is sound
and economic management of natural resources (renewable and non-renewable). This can
lead to improvement of socio-economic development of most rural areas (Burian et al.,
2003). Agritourism does not promote any market externality (e.g. water and environment
pollution) instead it promotes natural and healthy life. For example, all the downstream
users whose health status are negatively affected by the usages of polluted water caused
by agrochemicals used by the surrounding farmers (the non-agritourism farmers) can be
improved if most farmers can adapt and adopt agritourism technology on the their farms,
because this type of farming is critical and could succeed if farmers can take precautions
against agrochemicals and any other sources that can pollute environment.

18
Moreover, the majority of rural areas is vulnerable to high level of poverty, and
characterized by low levels of economic activity, infrastructural development, and access
to essential services (Burian et al., 2003). Approximately 70% of South Africans are rural
and poor, and therefore, their incomes are constrained because the rural economy is not
sufficiently vibrant to provide them with remunerative jobs (SAG, 2000). According to
Gannon (1994); and Keiselbach and Lon (1990), agritourism existence can help to
address various economic problems through economic diversification and stabilization,
employment creation, infrastructural improvements, protection and improvement of both
natural and built environment. With improved farming practices, more investors will be
attracted into agricultural business, leading to more jobs created, thus attracting tourists
who are eager to learn.
Agritourism has potential to improve South Africa’s economic performance as well as
contribute to rural development and employment creation (Kepe et al., 2001). It can also
be hypothesized that rural community life can be of high standard if agritourism can be
developed by most local farmers, as well as introduction and development of better
methods of farming.
1.2 Aim and objectives
1.2.1 Aim
The main aim of this study is to analyse the socio-economic variables affecting
agritourism business using data from two rural communities.

19
1.2.2 Objectives
(i) To investigate the socio-economic differences between agritourism and non-
agritourism farmers in two rural communities.
(ii) To find out the impact of socio-economic variables on agritourism business.
1.3 Hypotheses
(i) There are socio-economic differences among agritourism and non-agritourism
farmers.
(ii) Socio-economic variables namely literacy, gender, age, land size and family size have
effect on agritourism business.
1.4 Outline of the study
This study is structured into five chapters. In Chapter two the focus is on the
circumstances under which the economic thought on agritourism has developed. The
chapter reveals that rural economy is overshadowed due to the fact that agritourism
opportunities are not yet been fully realized by majority of South African farmers who
are operating in the second economy. Literature indicates that unawareness of farmers
about agritourism limits economic opportunities such as job creation, food security, farm
revenues and the enrichment levels of the economic welfare of the marginalized rural
areas.
Chapter three discusses the research methodology and design. The study adapted a case
study design, and Multinomial Logit framework was used for modeling discrete choices

20
of farmers’ category in terms of membership. The empirical model for estimating
farmers’ state of membership was also explained.
Chapter four represents the results and discussions of the empirical analysis and the
estimated econometric models. The analysis of the results of the estimated models, fully
and partially registered agritourism farmers relative to the non-agritourism farmers and
their implications are analyzed. Summary and conclusion were presented in Chapter five.

21
CHAPTER 2
LITERATURE REVIEW
2.0 Theoretical concepts
Agritourism can be a way of sustaining the economy of the hinterland and giving city
dwellers a rural experience in South Africa (Myles, 1999). It ventures the demand for
travel experiences in rural settings and the marketplace is interested in learning more
about agricultural landscape (Dossa, et al., 2001). In most developing countries including
South Africa, agritourism opportunities are not yet been fully realized. This may be
caused by the insufficient availability of resources to the hand of the majority of farmers
(Bruian et al., 2003).
There is an enormous potential for development in rural areas that may sustain rural
economy (Ramsey and Schaumleffel, 2006), hence rural economy is overshadowed.
Furthermore, since South Africa is dominated by small-scale farmers that operate in the
second economy, the existence and practice of agritourism farming on their farms will
empower their businesses and promote them so that they operate as professionally and
successfully as any first world agritourism operators (Didiza, 2005).
2.1 Tourism area life cycle model
Life cycle is a graphical tool that represents a succession of phases in a normally long
period of time for monitoring several areas of knowledge (e.g. agritourism). Life cycle

22
concerns economic production by phases. The specific approach to life cycle modelling
was launched in the 60’s by the researchers analyzed tourism activity (Alvares and
Lourenço, 2009).
Like most products, agritourism destination follows a determined product life cycle. This
is supported by Butler’s 1980 tourism area life cycle model. The model states that tourist
areas go through a recognizable cycle of evolution. Evolution is brought about by a
variety of factors, this includes changes in preferences and needs of tourists, the gradual
deterioration and possible replacement of physical plant and facilities, and the change of
the original natural and cultural attractions, which is responsible for the initial popularity
of the area. Figure 2.1 illustrates different stages of tourism development.
Source: Butler, 1980
Figure 2.1 Butler’s tourism area life cycle model

23
In the initial stage, exploration, agritourism operator is expected to receive a small
number of visitors due to the fact that business is new and not popular to the most
agritourists. The agritourism products and services demanded are assumed to be
imperfect due to the lack of agritourism facilities and knowledge.
The second stage is development stage. The tourism phenomenon grows spectacularly
and very quickly because it is assumed that tourists discover the destination and its
attractions in majority. Due to a massive number of tourists arrival to the agritourism
destination, more revenue is generated. The business rise from exploration to stagnation
often happens very rapidly, as implied by the exponential nature of the growth curve.
The third stage is stagnation, in which saturation is reached. At this stage business is no
longer generating enough profit than in the development stage because there is a stable
demand for products and services. Immediately after stagnation stage, the possible
trajectories indicated by dotted lines A-E are possible outcomes beyond stagnation.
The Law of Diminishing Returns could cause a destination to follow trajectories similar
to those of C or D, and that the concepts and practices of destination recovery, as applied
to destinations recovering from a disaster, could easily be applied to a destination in
decline as a result of the Law of Diminishing Returns.

24
2.2 Forms of agritourism enterprises
When a farm is diversified into agritourism venture, the farm nature will turn to operate
as a supplementary, complementary or primary enterprise (Blacka et al., 2001). All these
agritourism enterprises are indispensable to protect the environment and they are
considered to be of benefit to the farm business as they are promoting sustainable
consumption and production of agricultural goods and services in the societies (GOE,
2007).
2.2.1 Supplementary enterprise
As a supplementary enterprise, agritourism supports the farm's primary role, it could be a
minor activity that would support the production of commodities that still generate most
of the farm income (Lobo, 2001). For instance, if the farm primary enterprise is dairy
production, farm owners may decide to invite school groups to the farm for several days
or months to learn about the animals on the farm. If a farmer hosts guests occasionally on
his farm, this would make agritourism a supplementary enterprise to his primary
enterprise because the agritourism activities were a minor part of his farm product mix.
2.2.2 Complementary enterprise
As a complementary enterprise, agritourism activities would share equal footing with
other enterprises in the farm product mix. If a farmer produces one or more different
commodities, agritourism would generate the same profits as other farming activities
(Blacka et al., 2001). An example of this would be a mango producer who sells half of

25
his produce to a wholesaler (who then supplies different markets) and the remainder to
paying guests through pick-your-own operation (it is an activity where the commodity
buyers harvest the crops of their own choice. Consumers preferences are diverse in
nature). The two enterprises (the wholesale market and the direct market) would be
complementary enterprises because they are expected to spawn an equal amount on
business.
2.2.3 Primary enterprise
As the primary enterprise, agritourism would be the dominant activity on the farm. For
instance, a fruit producer may open a winery on his farm and invite guests to spend the
day or the weekend tasting wine. As part of the wine tasting package, the farmer may also
include overnight lodging in a cottage on his property. However, because agritourism
would be the main part of his farm product mix, therefore, agritourism will be considered
as a primary activity. The farm will benefit from additional revenues and from increased
public exposure.
2.3 Agritourism in rural areas of South Africa
Rural areas have distinctive characteristics for social and economic interaction in the
countryside (Bramwell, 1994). The rural economy of South Africa is primarily
agricultural and it grows gradually. This growth results from the fact that the majority of
farmers receive inadequate information. There are number of strategies that can be used
to improve the economic status of rural economy. Among those strategies, agritourism
can be used. Brown (2002) found that in developing countries agritourism has been

26
given little consideration mostly by small-scale farmers, and it consequently affects rural
economy by limiting the economic opportunities such as job creation, food security, farm
revenue, a viability of rural society and a sustainable and diverse environment.
In most cases almost all agritourism entrepreneurs’ main motives for farming amongst
others include the reasons of food security and to make as much profit as they can, but
due to some certain constraints such as limited resources, most of them fail to achieve
these objectives. Sufficient farming skills and planning are required in order for a farm to
receive the best results from the time and money invested into an agritourism operation,
because well-developed agritourism systems in rural areas have the potential to reverse
negative economic trends by bringing in visitors and creating new jobs and local business
ventures for rural residents (Ramsey and Schaumleffel, 2006).
South Africa’s rural community development has been hampered by the demise of family
farms, which has been a subject of significant concern among the agritourism business
for sometime (Barboza, 1999: Lasley et al., 1995). Agritourism can be a true rural
economic and community development driver if the entire community supports it. For
example, the non-agritourism farming coupled with rising input costs and is slowly but
substantially eroding small farm incomes (Blacka et al., (2001). As a result, some non-
agritourism farmers are acquiring second jobs and others are leaving their farms
altogether in order to maintain a living income and to sustain their household.
Communities can support agritourism business by provision of labour to those farmers
for the reduction of input costs. Thereafter, the availability of labourers will make non-
27
agritourism farmers to be involved or practice the agritourism farming. Hence, quality
agritourism products will be produced at a cheaper price and can be marketed
domestically and to the broader commercial markets.
Agritourism is increasingly recognized as a means of enterprise diversification for most
agricultural producers and in most cases, it is developed and adopted by developed
farmers, worldwide (Sullins et al, 2006). Agritourism has ability to increase cash flows to
the farms and their surrounding communities, because of the excessive various products
demanded by consumers within this sector. Hence, agritourism can be considered as an
economic growth strategy that can improve levels of economic welfare of the
marginalized rural areas in South Africa.

28
CHAPTER 3
STUDY AREA AND METHODOLOGY
3.0 Introduction
This study utilized data that was collected from two villages (Nwa’metwa and Lenyenye)
in the Greater Tzaneen municipality area within the Mopani district area of Limpopo
Province. The two villages were chosen due to the presence of agritourism farmers. Due
to the natural beauty of this district, Mopani is generally considered as the destination
with the greatest potential for tourism growth for the country. Farmers within Mopani
district are equivalent in terms of business opportunities even though they are
heterogeneously distributed in terms of business locations and status.
The district contributes significantly towards the activity of agriculture on the provincial
level. About 50% of the farm income in the province from horticulture is earned in the
district. Most important crops in terms of monetary value are citrus, vegetables and
subtropical fruit. Moreover, the Greater Tzaneen municipality area is one of the two
leading municipalities in terms of the agriculture, forestry and tourism. The area is
characterized by extensive and intensive farming activities, mountainous, inaccessible
terrain in the west and south, and un-even topography (gentle slopes) to the north and
east, and the area also boasts a plethora of historical, cultural and ethnic attractions.
Figure 2 is a map depicting the locality of the Greater Tzaneen Municipal.

29
Source: www.Tzaneen.co.za/index.htm
Figure 3.1 Detailed map of Tzaneen and surrounding area

30
3.1 Research design
This study adapted a case study design because only two villages were considered and
used as farmers’ representatives for the Greater Tzaneen municipality. Due to the
determined relationship between dependent and independent variables, this research
design was found to be descriptive in nature.
The total number of farmers in Nwa’metwa and Lenyenye was estimated to be 50 and 40
respectively. The statistics was provided by the local Department of Agriculture as it
keeps the records of surrounding farmers. Questionnaires were distributed and
administered to 90 farmers, but only 45 questionnaires were completed and used as a
sample size. The follow up was also made to the non-respondent farmers and they
continued showing no interest in participating in this study.
Farmers interviewed belonged to various associations such as Limpopo Tomato Grower
Association, Organic farmers Association, Mango Growers Association, Citrus Farmers
Association and Grains Farmers Associations and other farmers who did not register with
any association. As these farmers were interviewed, they also provided extra information
that was not contained in the questionnaire such as the participation level in their
associations. Hence, this changed the structure of questionnaire as farmers categorized
themselves to be operating in three groups namely; fully and partially agritourism farmers
as well as non-agritourism farmers. Therefore, stratified sampling technique was applied
to reach a satisfactory number of respondents as 15 questionnaires were completed on
each group of membership.

31
3.2 Data collection
A questionnaire survey and personal interviews (face to face interview) were employed to
gather relevant information from the black male and female farmers, 49% and 51%
respectively. Data used for this study was collected in the year 2008. The total sample
size (45) was made up of 15 fully registered agritourism farmers (Y1), partially registered
agritourism farmers (Y2) and 15 non-registered agritourism farmers (Y3). Therefore, Y3
respondents represented the households that had not joined the agritourism group, but
who resided in the same area.
Y1 is considered to be the farmers engaged on agritourism business on full time basis for
the period of more than 5years, while Y2
is considered to be farmers who sometimes
were involved in other jobs and they had been participating on agritourism business for
the period of 5 years and less.
3.3 Econometric model
3.3.1 Framework for econometric analysis
The Multinomial Logit model has been used in agricultural production economics
literature to model acreage share choices (Bewley et al., 1987; Caswell and Zilberman
1985; Lichtenberg 1989; Segerson and Wu 1995), and land use decisions (Lubowski et
al., 2006). Therefore, it is also considered to be relevant for this study because the
acreage share models built within the Multinomial Logit framework are mainly used for
three reasons namely; they ensure that the predicted share functions (strictly) lie in the
interior of the zero-one interval, they are parsimonious in parameters and they are

32
empirically tractable. The Multinomial Logit framework is used for modeling discrete
choices (McFadden 1974) and mainly employed for modeling farmers’ membership
category on discrete decisions.
3.3.2 Modelling agritourism farmer behaviour using multinomial logit model
Multinomial regression models can be used to assess the effectiveness of a range of
predictor variables in explaining a defined set of outcomes. This study used a
multinomial logit model to identify predictor variables that explain membership
categories. The model simultaneously distinguishes agritourism farmers while explaining
more subtitle differences between full member, partial member and non-members.
Explanatory variables included in the model extended beyond farm and farmer
characteristics to include measures of transaction costs that may either encourage or
discourage collective action (Matungul, 2002).
The dependent variable under consideration (membership) is a nominal measure taking
on three arbitrary and unordered values. Such a general unordered multinomial discrete
choice problem can be described by the utility theory argument (Judge et al., 2000). The
ith
ijY ∗
farmer’s utility received from agritourism membership type (fully registered, partially
registered and non-members) can be presented by
jix β.= + ijε
where,
(1)
ijY ∗ represent the utility that the thi farmer obtains from choosing the thj state
of membership, ix is vector of explanatory variables, jβ is a vector of their weights,

33
and tε
j
represents the residuals of the utility function. The farmer obtains from
selecting a state of membership and is unobservable but the membership choices made
are observed. If, farmers are rational in their decisions they would select the state of
membership from a possible choice set k that maximises their utility. The probability that
an alternative is chosen by the thi individual if ijY ∗ > ikY ∗ k∀ ≠ j and ijε are
independently and identical distributed, each with the cumulative distribution function
(CDF) and probability density function (PDF) of
ƒ( z ) = ze− zze−− and F( z ) =
zee−−
(Crabtree et al, 2001)
respectively given by:
(2)
== )1*( ijYP jkYYP ikij ≠∀>∗ ),*(
P [ ] =≠∀−−⟩∈−∈ jkx kjiikij ),( ββ ijg ( jix β. )
jixe β= jixejk β∑ = 1
/ for i=1…n and j 1= ,… k (3)
This logistic function is characterised by independence of irrelevant alternatives (Dupraz
et al., 2002). The differences in the error term ( ijε ikε− ) follow a logistic function in
multinomial logistic model where iX is a vector of explanatory variables and jβ are the
estimated parameters that weight the exogenous variables to estimate utility j. A problem
with this model is that the parameter vectors jβ j, 1= … k are not identified. The
identification problem according to Green (1997) is mitigated by restricting the first
parameter vector to zero (i.e. 01 =β ) in which case the remaining parameters are
identified with resultant multinomial probabilities represented by

34
ijP ijg *= ( jix β. ) = jixe β ∑ = 1jk
/1 + jixe β j for 2≥ (Dupraz et al., 2002)
(4)
and
ijP ijg ∗= ( jix β. ) = 1/1 + ∑ = 1jk
jixe β jfor 1= (5)
which is similar to the binary choice case when j 2= . The log-likelihood model to be
estimated is represented by:
=));(( yLIn β
+− ∑∑
==
k
j
xyii
n
i
jieInx21
)1( ββ (6)
and the marginal effects of the explanatory variables ijx are derived from equation (1)
and are represented by the partial derivative:
−=∂∂ ∑
=
k
jkikjijiij PPxP
2./ ββ (7)
Therefore, the marginal effects measure the expected change in the probability of a
particular choice being made with respect to a unit change in an explanatory variable
(Green, 2000; Long, 1997). Alternatively the log-odds are less complicated in function
from than partial derivatives. Normalising on the first alterative choice with β1
≡ 0, the
log-odds ratios are calculated as follows:
jiiij xPPIn β=)/( 1
The other alternatives besides the first one can be normalised using the general log-odds
formula:
(8)
)()/( 1 kjiiij xPPIn ββ −=
(Judge et al., 2000) (9)

35
3.3.3 Empirical model
Following the explanatory data analysis, and with reference to previous participatory
studies, a number of predictor variables were identified for inclusion in the model
(Molinas, 1998; Delvaux et al., 2000). The state of membership (MEMB) chosen by a
farmer is the model’s dependent variable taking the values of 0 for fully registered
agritourism members, 1 for partially registered agritourism members, and 2 for non-
registered agritourism members. The empirical model for estimating the state of
membership that maximises a respondent’s utility was postulated as:
ikiiiiiiiiiiij HBYFHMFMFBWLFBGENDAGEMEMB εββββββ ++−−−−= 55443322110*
(10)
Where
ijMEMB*
= Farmer state of membership (fully, partially and non-registered
agritourism members);
iAGE = Age of the farmer (years);
iGEND
= 0, female farmer;
= Gender of farmer, 1 if farmer is male
iWLFB
= 2, Sepedi,
= Language used by farmer for business purposes, 1 if a farmer
prefers Afrikaans,
= 3, Xitsonga,
= 4, Tshivhenda,
= 5, More than one,

36
= 6, other;
iHMFMFB = Number of family members employed farming business;
iHBFY = Farm size (Ha);
0β = constant;
iβ = weighting coefficients; and
The explanatory variables considered and used for the empirical estimation consist of
socio-economic factors. It assumed that coefficients of AGE, GEND, WLFB and
HMFMFB are expected to be negative, while variable HBFY is expected to have positive
coefficient. These estimated coefficients probably answer the questions that motivated the
study. The theoretical bases upon which the expected signs of the coefficients are based
can be explained as follows:
(i) AGE
The influence of AGE on farmer state of membership decision has been found in the
literature to be varied. Some studies have found that AGE had no influence on a farmer’s
decision to participate in either agritourism or non-agritourism activities (Bekele &
Drake, 2003; Anim 1999; Lee et al., 1997). Other studies, however, found that AGE is
significantly and negatively related to farmers’ decisions (Anley et al., 2007, Carter et al.,
2007; Burton et al., 1999; Lapar & Pandely, 1999: Feartherstone & Goodwin, 1993;
Gould et al., 1989). Based on this captured literature, this study hypothesize that the AGE

37
of the farmers has negative impacts on different types of farming business, especially on
agritourism business.
(ii) GEND
The empirical studies have shown that GEND describe the socially determined attributes
of male and female farmers, including their roles. McGehee and Kim (2004) found that
there is GEND differences among farmers in farming business, and women founded to be
more motivated than men counterparts to be involved in any type of farming, agritourism
farming included (Chiappe and Flora, 1998). Bekele and Drake (2003) found that some
household gender was not a significant factor influencing farmers’ decision to adopt
agritourism. Therefore, GEND may be negatively associated with the type of membership
category as most farmers both males and females are not yet exposed to the agritourism
farming.
(iii) HMFMFB
Empirical adoption literature shows that household size has mixed impacts on farmers’
adoption of agricultural technologies (Nhemachena, 2009). Larger family is expected to
enable farmers to implement various adaptation measures when these are labour intensive
(Carter et al., 2006; Anley et al., 2007; Birungi, 2007). Mixed farming system like
agritourism farming system is considered to be labour intensive and hence expects a
positive influence of family size on the adoption of agritourism technology and business.
This implies that farm households with more labour are better off than farm households

38
with few labours because they increase opportunity cost of labour among the household
member.
(iv) WLFB
In business industry, english is most preferable and used by seller and customer. It is
assumed that WLFB will have negative sign since most farmers use local languages in
their businesses rather than english. The farmers market in Greater Tzaneen area is
dominated by local people, and besides most farmers do not have formal education and it
is difficult for them to speak english.
(v) HBFY
During data collection, the respondents highlighted that the factors of production were in
place excluding capital in the form of cash. Most farmers needed financial assistances to
expand their businesses. Out of this fact, it is then assumed that HBFY might have
positive sign since land size and human capital (labour) were not the constraints for the
performed farm activities. Most respondents were concerned about their farm structures,
the way their farms were organized.
3.3.4 Characteristics of variables used for this study
Variables explaining MEMB* are represented by the broad categories of farmer and farm
characteristics. Previous studies have shown that farmer participation in organized

39
schemes depends on farm and farmer characteristics (Bergstro et al., 1999). A number of
variables such as HBFY and HMFMFB were used to represent farm characteristics as
they determine the potential net benefit of participating in collective action. HBFY
includes the cropland that belongs to the household (family farm), both under cultivation
and fallow.
Large farm sizes were expected to improve household’s ability to produce surplus crops
for the market after factoring in subsistence constraints (Promar International, 1999).
They were also predicted to make it feasible for farmers to produce extensive commercial
crops, than intensive agritourism crops. Furthermore, certification of agritourism crops
becomes complicated and extensive when they are produced in close proximity to non-
agritourism crops on small farms.
HMFMFB also has implications for decisions to adopt agritourism technology.
Agritourism farming like organic farming prohibits the uses of pesticides and herbicides
for pest and weed control respectively, increasing demand for family and hired labour
(Crabtree et al, 2001). As a result, agritourism farming is categorised as labour intensive.
HMFMFB is proxy for the household’s supply farm labour in this study (Molinas, 1998).
Empirical studies have shown that potential income benefits from farm size impacts
strongly on smallholder decisions (Brady et al., 1995).
Conventional farmers are more likely to consider agritourism farming if it is more
profitable, if there are strong market signals from both the local and export market and if

40
it is technically feasible and sustainable in the long term (Mackay, 2002). Variables
representing individual characteristics of the head of household are AGE, GEND and
WLFB. Empirical studies have shown that younger people are more likely to be involved
in collective action as they are more innovative and risk-tolerant than old people
(Molinas, 1998). In this study WLFB is measured by dummy variable indicating the
ability of the household head to read and understand english, the lingua franca of
commerce and business in the Limpopo Province (Matungul, 2002).
Members and non-members of agritourism, face different transaction costs. Participating
in agritourism activities presents whole new set of transaction costs that non-members do
not incur, such as membership fees and the opportunity cost of time attending agritourism
meetings. Other sources of transaction costs considered in the study relate to problems of
price uncertainty in fresh produce markets, tractor availability for tillage, finding and
supervising additional labour for agritourism crop production, acquiring information and
manure and securing transport to distant market. These problems are rated by
respondents as serious (3), moderate (2) or no problem (1).
Interactions between farmer characteristics and transaction cost may occur. For example,
AGE may be negatively associated with transaction costs as older farmers tend to have
more experience and stronger social networks. Educated farmers are better able to
assemble and interpret information and are expected to face lower transaction costs than
less educated farmers when accessing markets as individuals or through collective action.
A characteristic like WLFB may be important but non-significant if it contributes equally

41
to the above mentioned sources of transaction costs of both individual and collective
action. Indeed, it may not be possible to anticipate the direction of impact that many of
these farmer characteristics will have on agritourism membership.

42
CHAPTER 4
RESULTS AND DISCUSSION
4.0 Introduction
This chapter discusses the results analyzed using Statistical Package for the Social
Sciences program (SPSS Version 17, 2009). The multinomial logit analysis of the socio-
economic study of agritourism in Nametwa’ and Lenyenye village was performed. The
analysis contains 3 categorical dependent variables which represent farmers’ choice in
terms of business operation and this was showed in Table 1. The analysis covered the
descriptive statistics, correlation matrix, ANOVA (mean values) and multinomial
regression model. Each table was displayed in this chapter.
Table 1: Dependent variable classified by three categories
0 Fully registered agritourism farmers
Category Description
1 Partially registered agritourism farmers
2 Non-registered agritourism farmers

43
Table 2: Variable names and definitions of variables used
AGE Age of the farmer (years)
Variable Description
GEND Gender of farmer (Male=0, Female=1)
WLFB Which other language/s do you use in your
farming business? Afrikaans=1,
Sepedi=2, Xitsonga=3, Tshivhenda=4, More
than one=5, other = 6)
HMFMFB How many family members are employed in
your farming business? (number)
HBYF How big is your farm? (Ha)
Table 3: Case processing summary
Membership category
N Marginal Percentage
0 15 33.3%
1 15 33.3%
2 15 33.3%
Total 45 100%
The above table showed the case processing summary that represents the number and
percentage of cases in each level of the response variables. These response variables were

44
categorised into three groups as presented in Table 1. The total number of observations
that were used in the analysis was 45 and it indicated the 100% marginal percentage of
the observations. Each membership category represented by 33.3% from total number of
the observations.
Table 4: Descriptive statistics for explanatory variables included in the analysis
AGE 45 33 71 52.36 11.807
N Minimum Maximum Mean Std. Deviation
GEND 45 0 1 0.49 0.506
WLFB 45 2 5 4.56 0.990
HMFMFB 45 0 10 2.42 2.291
HBYF 45 1 155 36.26 42.895
The above table represents the descriptive statistics of the explanatory variables used in
the analysis. Out of the total number of sample size used for the study, it was found that
farmers who participated differed in terms of age, the minimal farmers’ age was 33 while
the maximum age was 71years. The majority of these farmers were multilingual because
they used more than one language for business communication, english included. This
added more advantage for business growth because most agritourists and non-agritourists
customers use different languages and prefer to be assisted by people who do understand
and talk their language even if not perfectly. The evidence of this is also provided by the
Table 4. The table showed that very few respondents used one language (Xitsonga) for

45
communication. This was indicated by mean 4.56. Further, none farmers spoke either
Afrikaans or other language than the one indicated in Table 2.
Any farm related business, either agritourism business or any hardcore farm business
depends on the factors of production such as labour and land for production and service
rendering. The agritourism and non-agritourism farmers operated their businesses on a
land size ranges from 1 hectare to 155 hectares together with their family members
employed full time and on part-time bases. Farmers who operated individually in the
business were 2.24 %. The average size of holding was 36.26 hectares. The research
results also found that the majority of farmers participated were women.
4.1 Descriptive statistics summary
Farmers who participated in this study differed in terms of age, the minimal farmers’ age
was 33 and the maximum age was 71years. The majority of these farmers were
multilingual and they used more than one language for business communication. Both
agritourism and non-agritourism farmers operated their businesses on a land size ranges
from 1 hectare to 155 hectares together with their family members employed full time
and on part-time bases. The majority of farmers participated were women.

46
Table 5: Correlation matrix MEMB AGE GEND WLFB HMFMFB HBYF
MEMB Person Correlation 1
Sig. (2-tailed)
N 45
AGE Person Correlation -0.399** 1
Sig. (2-tailed) 0.007
N 45 45
GEND Person Correlation 0.381** -0.502** 1
Sig. (2-tailed) 0.010 0.000
N 45 45 45
WLFB Person Correlation -0.222 0.125 -0.056 1
Sig. (2-tailed) 0.1420 0.415 0.717
N 45 45 45 45
HMFMFB Person Correlation -0.144 0.209 -0.241 0.095 1
Sig. (2-tailed) 0.345 0.169 0.111 0.536
N 45 45 45 45 45
HBYF Person Correlation -0.802** 0.480** -0.415** 0.237* 0.312* 1
Sig. (2-tailed) 0.000 0.001 0.005 0.028 0.37
N 45 45 45 45 45 45
__________________________________________________________
**Correlation is significant at the 0.01 level (2-tailed); *Correlation is significant at the 0.05 level (2-tailed)
Table 5 represents the correlation coefficients between pairs of relevant variables
observed from all respondents. The results of the correlations show positive and negative
relationship among the selected socio-economic variables. Further, the analysis of the
correlation matrix indicated that few of the observed relationships were very strong. The
strongest relationship was between the socio-economic variables AGE and HBYF
followed by MEMB and GEND. These pairs of variables were both significant at the
significance level of 0.01. The highest positive correlation between AGE and HBYF is
indicated by 0.480, followed by MEMB and GEND at 0.381. These variables were

47
statistically significant at the significance level of 0.001 and 0.010 respectively. These
results mean that both pairs of variables were significantly and positively related because
older farmers both agritourism and non-agritourism farmers were likely to operate their
farming businesses on large farms than the young farmers (youth). The results also
indicated that both male and female farmers participated more or less equally in three
forms of state of membership.
Furthermore, the correlation matrix shows that variable MEMB was negatively correlated
with both AGE (-0.399) and HBYF (-0.802) at the significance level of 0.007 and 0.000
respectively, The negative correlation of MEMB with variable AGE and HBYF mean
that most farmers who participated were younger people and they operated their
businesses in small farm sizes.
Moreover, there was a negative relationship between AGE and GEND (-0.502) at the
significance level of 0.000, while GEND had negative correlation with HBYF (-0.415) at
the significance level of 0.005. These results implied that most respondents were young
and less educated, further the negative correlation between GEND and FBYF showed that
young farmers operated farming business without relevant skills. The results also
suggested that young farmers skills might impacted businesses growth negatively.
4.2 Correlation matrix summary
The socio-economic variables used in this study have indicated that older agritourism and
non-agritourism farmers operated on large farms, while young farmers were found to be

48
less educated. Therefore, these conclusions are possible because of the sign of the
correlation coefficients.
Table 6. ANOVA (Mean values)
Variable Fully registered Partially registered Non-registered Sig.
n1=15 n2=15 n3
________________________________________________________________________
=15
AGE 61.13 46.20 49.73 0.001
GEND 0.20 0.60 0.67 0.020
WLYF 5.00 4.20 4.47 0.076
HMFMFB 2.67 2.73 1.87 0.525
HBYF 85.67 20.73 2.37 0.00
N = 45
Analysis of Variance (ANOVA) was conducted to find out if there were socio-economic
differences among fully, partially and non-registered agritourism farmers in terms of
socio-economic factors (independent variables). To test this hypothesis, the significance
of the differences between the mean values of respondents assigned was used. The null
hypothesis was mathematically expressed as H0: µ1i = µ2i = µ3i with the alternative
hypothesis H1: µ1i ≠ µ2i ≠ µ3i. Results in Table 6 showed that the mean of the variables
(AGE, GEND, WLYF and HBYF) differed significantly, while variable HMFMFB was
statically found to be insignificant (p = 0.525). The results implied that there are socio-
economic differences among the three groups of farmers, and they also mean that

49
variables AGE, GEND, WLYF, HMFMFB and HBYF have unique relationship with
fully, partially and non-registered agritourism farmers. Therefore, H1: µ1i ≠ µ2i ≠ µ3i
was
accepted.
4.3 Analysis of Variance summary
There are socio-economic differences among fully registered, partially registered and
non-agritourism farmers. This was statistically proven and showed by the analysis of
variance Table. The mean of the socio-economic variables AGE, GEND, WLYF and
HBYF differed significantly, while variable HMFMFB was statically found to be
insignificant.

50
Table 7: Results of the Multinomial Logistic Regression (Parameter estimates)
Membership category B Std. Error Wald df Sig
Fully registered Intercept 521.081 19380.369 0.001 1 0.979
agritourism AGE -4.926 1.885 6.826 1 0.009
farmers GEND -128.747 18477.079 0.000 1 0.994
WLFB -64.510 1169.555 0.003 1 0.956
HMFMFB -164.031 16.975 93.373 1 0.000
HBYF 89.589 0.292 94343.721 1 0.000
Partially registered Intercept 559.048 19205.283 0.001 1 0.977
agritourism AGE -5.419 1.822 8.819 1 0.003
farmers GEND -130.743 18476.983 0.000 1 0.994
WLFB -64.843 1047.670 0.004 1 0.951
HMFMFB -161.145 16.791 92.108 1 0.000
HBYF 89.248 0.000 1
-2 log Likelihood 6.559 (P < 0.000)
Chi-Square 92.316 (P < 0.000)
α 5%
The reference category is: Non-registered agritourism farmers (2)
The Table 7 represents the multinomial logistic regression with two parts, labeled
membership category fully registered agritourism farmers (category 0) and partially
registered agritourism farmers (category 1). Category non-registered agritourism farmers
(category 2) was chosen and used as the comparison category. Table also shows the raw
regression coefficients (B), their standard errors, and the Wald test and associated p-
values (sig.). The coefficient signs for the variables AGE, GEND, WLFB and HMFMFB
51
in both categories (1 and 2) are negative, while that for HBYF is positive as expected. If
B’s are negative, the corresponding variables reduce the odds and vice-versa.
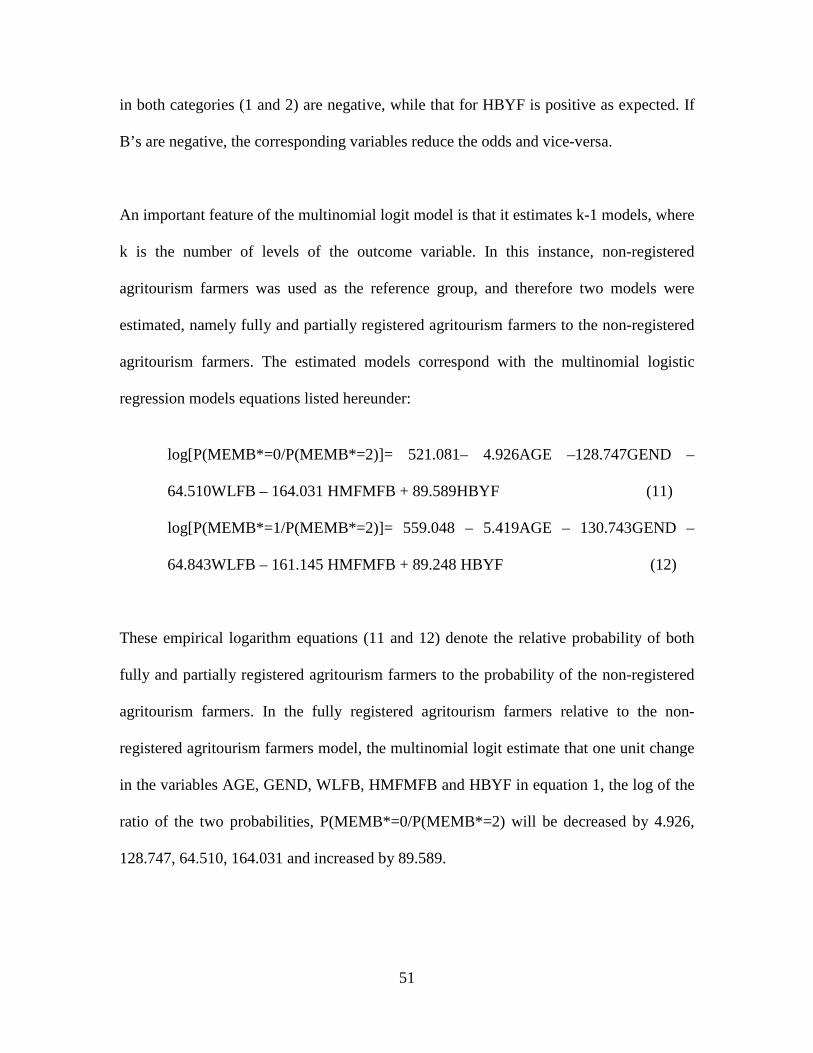
An important feature of the multinomial logit model is that it estimates k-1 models, where
k is the number of levels of the outcome variable. In this instance, non-registered
agritourism farmers was used as the reference group, and therefore two models were
estimated, namely fully and partially registered agritourism farmers to the non-registered
agritourism farmers. The estimated models correspond with the multinomial logistic
regression models equations listed hereunder:
log[P(MEMB*=0/P(MEMB*=2)]= 521.081– 4.926AGE –128.747GEND –
64.510WLFB – 164.031 HMFMFB + 89.589HBYF (11)
log[P(MEMB*=1/P(MEMB*=2)]= 559.048 – 5.419AGE – 130.743GEND –
64.843WLFB – 161.145 HMFMFB + 89.248 HBYF (12)
These empirical logarithm equations (11 and 12) denote the relative probability of both
fully and partially registered agritourism farmers to the probability of the non-registered
agritourism farmers. In the fully registered agritourism farmers relative to the non-
registered agritourism farmers model, the multinomial logit estimate that one unit change
in the variables AGE, GEND, WLFB, HMFMFB and HBYF in equation 1, the log of the
ratio of the two probabilities, P(MEMB*=0/P(MEMB*=2) will be decreased by 4.926,
128.747, 64.510, 164.031 and increased by 89.589.

52
However, in partially registered agritourism farmers relative to the non-registered
agritourism farmers model (equation 2), the multinomial estimate that one unit change in
the variables AGE, GEND, WLFB, HMFMFB and HBYF, the log of the ratio of the two
probabilities, P(MEMB*=1/P(MEMB*=2) will be decreased by 5.419, 130.743, 64.843,
161.145 and increased by 89.248. Therefore, these logarithm results imply that older
farmers were less likely to prefer to operate business as a fully or partially registered
agritourism farmer compared to the non-registered agritourism group. Furthermore,
farmers’ decisions in business operation were also informed by their level of education,
experience as well as social networks. The more a farmer is educated and strong in terms
of social networking, the lesser risk he or she can fail to operate farming business in
either fully or partially agritourism farming.
Hypothesis test for regression coefficient (testing that variables have no effect)
A hypothesis test was conducted to determine whether the socio-economic variables
namely literacy (WLFB), gender (GEND), age (AGE), land size (HBYF) and family size
(HMFMFB) have effect on agritourism business. The p-values associated with these
socio-economic variables parameters in comparison to the significance level (α = 5%) in
the estimated multinomial logistic results presented in Table 7 was used to test the
hypothesis. If there is significant linear relationship between farmers’ membership
categories (1 and 2) and the socio-economic variables, then regression coefficients will
not equal to zero. Therefore, the null hypothesis can mathematically be written as H0: B1i
= 0 and alternative hypothesis as H1: B1i
≠ 0.

53
Table 7 shows that there is a significant relationship between fully registered agritourism
farmers and variables AGE, HMFMFB and HBYF. The p-values associated with
variables AGE, HMFMFB and HBYF (0.009, 0.000 and 0.000, respectively) are less than
the significance level (0.05). Therefore, these results imply that that null hypothesis can
be rejected.
In partially registered agritourism farmers’ category, variables AGE and HMFMFB
showed a significant relationship among other variables. The p-values associated with
AGE and HMFMFB are 0.003 and 0.000, respectively. These two p-values are both less
than significance level (0.05). These results also suggest that null hypothesis be rejected.
Furthermore, H0: B1i
= 0 can be rejected since Chi-square test is highly significant (p
=0.000). Variables GEND and WLFB were statistically found to have insignificant
relationship with the estimated models, fully and partially registered agritourism farmers
relative to non-registered agritourism farmers.
4.4 Summary of implications of results
Two models were estimated, namely fully and partially registered agritourism farmers to
the non-registered agritourism farmers. These models denote the relative probability of
both fully and partially registered agritourism farmers to the probability of the non-
registered agritourism farmers. In the fully registered agritourism farmers relative to the
non-registered agritourism farmers model, the multinomial logit estimated that one unit
change in the variables AGE, GEND, WLFB, HMFMFB and HBYF, the log of the ratio

54
of the two probabilities, P(MEMB*=0/P(MEMB*=2) was decreased by 4.926, 128.747,
64.510, 164.031 and increased by 89.589.
However, in partially registered agritourism farmers relative to the non-registered
agritourism farmers model, the multinomial estimated that one unit change in the
variables AGE, GEND, WLFB, HMFMFB and HBYF, the log of the ratio of the two
probabilities, P(MEMB*=1/P(MEMB*=2) was decreased by 5.419, 130.743, 64.843,
161.145 and increased by 89.248. Therefore, older farmers were less likely to prefer to
operate businesses as fully or partially registered agritourism farmers compared to the
non-registered agritourism group. Farmers’ decisions in business operation were
informed by their level of education, experience as well as social networks. Finally, there
is a significant relationship between socio-economic variables and agritourism business.

55
CHAPTER 5
SUMMARY AND CONCLUSION
The study analysed the socio-economic variables affecting agritourism business using
data from Nwa’metwa and Lenyeye communities. Two logarithm models were estimated,
namely fully and partially registered agritourism farmers to the non-registered
agritourism farmers. These models denote the relative probability of both fully and
partially registered agritourism farmers to the probability of the non-registered
agritourism farmers. In the fully registered agritourism farmers relative to the non-
registered agritourism farmers model, the multinomial logit estimated that one unit
change in the variables AGE, GEND, WLFB, HMFMFB and HBYF, the log of the ratio
of the two probabilities, P(MEMB*=0/P(MEMB*=2) was decreased by 4.926, 128.747,
64.510, 164.031 and increased by 89.589.
However, in partially registered agritourism farmers relative to the non-registered
agritourism farmers model, the multinomial estimated that one unit change in the
variables AGE, GEND, WLFB, HMFMFB and HBYF, the log of the ratio of the two
probabilities, P(MEMB*=1/P(MEMB*=2) was decreased by 5.419, 130.743,
64.843,161.145 and increased by 89.248. Therefore, older farmers were less likely to
prefer to operate businesses as fully or partially registered agritourism farmers compared
to the non-registered agritourism group. Farmers’ decisions in business operation were
informed by their level of education, experience as well as social networks.

56
The study confirmed that there are socio-economic differences among fully registered,
partially registered and non-agritourism farmers. The socio-economic variables used in
this study have indicated that older agritourism and non-agritourism farmers operated on
large farms, while young farmers were found to be less educated. Both agritourism and
non-agritourism farmers operated their businesses on a land size ranges from 1 hectare
to155 hectares together with their family members employed full time and on part-time
bases. The research also found that there is a significant relationship between socio-
economic variables and agritourism business. Further, the majority of farmers who
participated were multilingual and they used more than one language for business
communication. Among the farmers who participated, women dominated.
Lastly, there is less agritourism literature available in the country. Therefore, it is
recommended that researchers participate on agritourism studies so that more information
be available for the public and policy makers. It is hoped that this study results will
provide guideline and serve as baseline information to the Greater Tzaneen municipality
policy makers for the formulation of policy measures on farmers who are currently and
interested on practicing either agritourism or non-agritourism business.

57
REFERENCES
ALVARES, D. & LOURENÇO, J. (2009). Life cycle modelling for tourism areas.
University of Minho, Guimarães, Portugal
ANLEY, Y., BOGALE, A. & HAILE-GABRIEL, A. (2007). Adoption decision and used
intensity of soil and water conservation measures by smallholder subsistence farmers in
Dedo district, Western Ethiopia. Land Degradation and Development, 18, 289-302.
ANIM, F.D.K. (1998). A Note on the Adoption of Soil Conservation Measures in the
Northern Province of South Africa. Agrekon, 50 (2), 336 - 345.
ANIM, F.D.K. (1999). Organic vegetable farming in the rural areas of the Northern
Province, Agrekon, 38 (4), 645.
ANIM, F.D.K. & LYNE, M.C. (1994). Econometric Analysis of Private Access to
Communal Grazing Lands in South Africa: A Case Study of Ciskei. Pietermaritzburg,
Republic of South Africa. Agricultural systems, 46, 461-4
BALSLEY, H.L. (1970). Quantitative research methods for business and economics.
New York: Random House.
BARBOZA, D. (1999). Is the sun setting on farmers? New York Times (November 28):
Sec. 3, 1.
58
BEKELE, W. & DRAKE, L. (2003). Soil and water conservation decision behavior of
subsistence farmers in the Eastern Highlands of Ethopia: a case study of the Hunde-Lafto
area. Ecological Economics, 46, 437-451.
BERGSTRO, P., DRAKE, L. & SVDSATER, H. (1999). Farmers’ attitude and uptake.
In: Huylenbroeck GV and M. Whitby (ed.). Countryside Stewardship: farmers, policies
and markets. Oxford, UK Elsevier Science.
BERGER, G., KAECHELE, H. & PFERFFER, H. (2006). The greening of the European
common agricultural policy by linking the European-wide obligation of set-aside with
voluntary agri-environmental measures on a regional scale. Ecological Economics, 9 (6),
509-524.
BEWLEY, R., COLMAN, D. & YOUNG, T. (1987). “A System Approach to Modelling
Supply Equations in Agriculture.” Journal of Agricultural Economics, 38 (2), 151-166.
BLACKA, A., COALE, P., COUTURE, P., DOOLEY, J., HANKINS, A., LASTOVICA,
A., MIHÁLIK, B., REED, C. & UYSAL, M. (2001). Agri-tourism. Retrieved November
25, 2007, from Virginia Cooperative Extension. Website:http://www.ext.vt.edu/pubs/
agritour/310-003/310-003.html
BOGDAN, R. & TAYLOR, S.J. (1975). Introduction to qualitative research methods.
New York: John Wiley.

59
BRADY, H., SCHLOZMAN, L.K. & VERBA, S. (1995). Voice and Equality: Civic
Voluntarism in American Politics, Harvard University Press.
BRAMWELL, B (1994). Rural tourism and sustainable rural tourism, Journal of
Sustainable Tourism, 2, 1-6
BREEN, J.P., HENNESSY, T.C. & THORNE, F.S., (2005). The effect of decoupling on
the decision to produce: An Irish case study. Food Policy, 30 (2), 129-144.
BROWN, D.M. (2002). Rural Tourism: An Annotated Bibliography. United States
Department of Agriculture, 1800 M St., N.W., Washington, DC 2003.
BURIAN, M., DIXEY, L. & HOLLAND, J. (2003). Tourism in Poor Rural Area.
Diversify the product and expanding the benefits in rural Uganda and the Czech
Republic. Economic and Social Research Unit (ESCOR) of the UK Department for
International Development (DFID). Pro-poor tourism working paper no.12
BURTON, M., RIGBY, D. & YOUNG, T. (1999). Analysis of the determinants of
adoption of organic horticultural techniques in the UK. Journal of Agricultural
Economics, 50, 47-67.

60
BUTLER, R. (1980). "The Concept of a Tourist Area of Life Cycle of Evolution:
Implications for Management of Resources. Canadian Geographer, 19: 5-12
BUTLER, R.W., HALL, C.M. & JENKIS, J. (1998), Tourism and Recreation in Rural
Areas, John Wiley & Sons, Toronto.
CARTER, R.D., DOLISCA, F., JOLLY, C.M., McDANIEL, J.M. & SHANNON, D.A.
(2006). Factors influencing farmers’ participation in forestry management programs: A
case study from Haiti. Forest Ecology and Management, 236, 324-331.
CASWELL M. & ZILBERMMAN, D. (1985). The Choice of Irrigation Technologies in
California. American Journal of Agricultural Economics, 67 (2), 224-234.
CHIAPPE, M.B. & FLORA, C.B. (1998). Gendered elements of the alternative
agriculture paradigm. Rural Sociology, 63 (3), 372-393.
CLEMENS, R. (2004). Keeping Farmers on the Land: Adding Value in Agriculture in the
Veneto Region of Italy. Midwest Agribusiness Trade Research and Information Center,
Iowa State University. Matric Briefing Paper 04-MBP 8.
CRABTREE, R., POTTS, J. & WYNN, G. (2001). Modelling farmer entry into the
environmentally sensitive area schemes in Scotland. Journal of Agricultural Economics,
52 (1), 65-82.

61
CRANE, W. (2007). Led and the Biodiversity economy: Who benefits most? Briefing 7.
DE KLERK, A. (2003). The Waterberg Biosphere Reserve: A land use model for
ecotourism development.. Magister Scientiae thesis, Department of Botany, University of
Pretoria.
DOSSA, K., DUMAIS M,. PARIDAEN, M. & WILLIAMS, P. (2001). Agritourism
market and Product Development Status Report. Centre for Tourism policy and research,
Simon Fraser University Burnaby.
DIDIZA, T. (2005). Agri-tourism programme. Department of Agriculture.
DUPRAZ, P., HYLENBROECK, V.G. & VANSLEMBROUCK, I. (2002). Farmers
participation in European Agri-environmental policies. Department of Agricultural
Economics, Ghent University.
DELVAUX, L., DUPRAZ P., DE FRAHAN, B.H. & VERMERSCH, D.B. (2000).
Production de biens publics par des ménages: une application á l’offre environnementale
des agriculteurs, Revue d’Economie politique, Vol. 110 (2), pp. 267-291.
ECKEL, C.C. & GROSSMAN, P.J. (1998). Are women less selfish than men? Evidence
from dictator experiments. Economic Journal, Royal Economic Society, 108 (448), 726-
35.

62
EDGE, D. (2000). Wildlife and Agricultural Ecosystems. Department of Fisheries and
Wildlife, Oregon State University.
EMBACHER, H. (1994). Marketing for agritourism in Austria: Strategy and realization
in a highly developed tourist destination. Journal of Sustainable Tourism, 2 (1&2), 61-76
ENGELBRECHT, D. (2005). The big six in big trouble. Unpublished Report. Department
of Zoology, University of Limpopo.
FADEYIBI, A. & OREDEGBE, I. (2009). Diversification into farm tourism.
International Conference on regional and urban modeling, University of Ottawa, Ontario.
FEATHERSTONE, A.M. & GOODWIN, B.K. (1993). Factors influencing a farmer’s
decision to invest in long-term conservation improvements. Land Economics, 69, 67-81.
FENNELL, D. A. & WEAVER, D.B. (1997). Vacation Farms and Ecotourism in
Saskatchewan, Canada. Journal of Rural Studies, 13 (4), 467-475.
FRANKFORT-NACHMIAS, C. & NACHMIAS, D. (1992). Research methods in the
social sciences, 4th
edition. New York: St. Martin's Press.
GANNON, A. (1994). Rural tourism as a factor in rural community economic
development for economies in transition. Journal of Sustainable Tourism, 2 (1+2), 51-60.

63
GLOBAL INSIGHT, 2008. Seminar, Economics and Application. Centurion, South
Africa.
GOPAL, R., VARMA, S. & GOPINATHAN, R. (2008). Rural Tourism Development:
Constraints and Possibilities with a special reference to Agri Tourism. A Case Study on
Agri Tourism Destination. Malegoan Village, Taluka Baramati, District Pune,
Maharashtra.
GOULD, B.W., KLEMME, R.M. & SAUPE, W.E. (1989). Conservation tillage: the role
of farm and operator characteristics and the perception of soil erosion. Land Economics,
65, 167-182.
GOVERNMENT OF ETHIOPIA (GOE) (2007). Ethiopia: towards a strategy for pro-
poor tourism development. Policy Research Working Paper
, WPS4442.
GREENE, W.H. (1997). Econometric Analysis, 3rd
edition, London: Prentice Hall.
GREENE, W.H. (2000). Econometric Analysis, 4th
edition. New Jersey: Prentice Hall.
GREENE, W.H. (2003). Econometric Analysis. 5th
edition, Harlow: Prentice Hall.
GUJARATI, D.N. (1992). Basic Econometrics, 2nd
edition. McGraw-Hill, Singapore.
HASSEN, S.S. (2000). Determinant of market competitiveness in an environmentally

64
sustainable tourism industry, Journal of Travel Research, 38 (3), 239-245.
HEALTH, E.T. (2000). Strategic destination marketing principles and perspectives.
Unpublished Report, Pretoria. University of Pretoria
HILCHEY, D. (1993a). Agritourism in New York State: Opportunities and Challenges in
Farm-Based Recreation and Hospitality. Ithaca, New York: Farming Alternatives
Program, Department. of Rural Sociology, Cornell University.
HILCHEY, D. (1993b). “Leisure Trends Create Opportunities for Farmers,” AgFocus,
pg 10.
HOLLOWAY, J. C. (2004). Marketing for Tourism. 4th
edition, Harlow: Prentice Hall.
HOPKINS, G.W. (2000). Quantitative Research Design. Department of Physiology and
School of Physical Education, University of Otago, Dunedin, New Zealand 9001.
HOSMER, D.W. & LEMESHOW, S. (2000). Applied Logistic Regression, second
edition, Wiley Series in Probability and Statistics. John and Wiley & Sons, incl., 111
River Street, Hoboken, New York.
HSIAO, C. (2003). Analysis of Panel Data, Second Edition Cambridge University Press.
Human Science Research Council 2007.

65
JOLLY, D. (1999). Agricultural tourism: Emerging opportunity. Small Farm News.
Summer. p.1, 4–5.
JONKER, J.A. (2004). The strategic identification and integration of critical success
factors to achieve international competitiveness for South Africa as a tourism destination.
Doctor commercii. University of Pretoria etd.
JUDGE, G.G., MILLER, J.D. & MITTELHAMMER, C.R. (2000). Econometric
Foundations. Cambridge University Press, UK.
KEPE, T., NTSEBEZA, L. & PITHERS, L. (2001). Agri-tourism Spatial Development
Initiatives in South Africa: are they enhancing rural livelihoods? Natural Resource
Perspectives. Overseas Development Institute (ODI). 111 Westminster Bridge Road,
London SE1 7JD, UK.
KEY, J.P. (1997). Research Design in Occupational Education. Oklahoma State
University.
KIESELBACH, S. & LONG, P. (1990). Tourism and the rural revitalization movement.
Parks and Recreation, 25 (3), 62-66.
KIM, K. & McGEHEE, N.G. (2004). Motivation for agri-tourism entrepreneurship.
Journal of Travel Research, 43 (20, 161-170

66
KIRK, J. & MILLER, M.L. (1986). Reliability and validity in qualitative research.
Qualitative Research Methods Series, 1. Beverly Hills, CA: Sage Publications.
KUEPPER, G. (2002). Organic Farm Certification & the National Organic Program.
Appropriate Technology Transfer for Rural Areas.
LAPAR, M.L.A. & PANDELY (1999), Adoption of soil conservation: the case of
Phillipine uplands. Agricultural |Economics, 21, 241-256.
LEE, D.R., SCHELHAS, J.W. & THACHER, T. (1997). Farmer participation in
reforestation incentive programs in Costa Rica. Agroforestry Systems, 35, (3), 269-289.
LASLEY, P., LEISTRITZ, F.L., LOBAO, L. & MEYER, K. (1995). Beyond the amber
waves of grain: An examination of social and economic restructuring in the heartland.
Boulder, CO: Westview Press.
LIMPOPO DEPARTMENT OF FINANCE & ECONOMIC DEVELOPMENT
(LDFED), (2004). A tourism growth strategy for Limpopo Province.
LITCHTENBERG, E. (1989). Land Quality, Irrigation Development and Cropping
Pattern in the Northern High Plains. American Journal of Agricultural Economics, 71
(1), 187-94.

67
LOBO, R. (2001). “Helpful Agricultural Tourism (Agri-tourism) Definitions.” Web
Site:http://www.sfc.ucdavis.edu/agritourism/definition.html.
LONG, J.S. (1997). Regression models for categorical and limited dependent variables:
advanced quantitative techniques in the social science. Series 7, Thousand Oaks,
California: Sage Publications.
LUBBE, B. (2003). Tourism management in Southern Africa. Cape Town: Pearson
Education.
LUBOWSKI, R.N., PLANTINGA, A.J. & STAVINS, R.N (2006). Land-use and carbon
sinks: Econometric estimation of the carbon sequestration supply function. Journal of
Environmental Economics and Management, 51 (2), 135-152.
MACKAY, A. (2002). Understanding the cost and risks of conversion to organic
production system, MAF technical paper no. 2002/1, prepared for MAF policy.
www.maf.govt.nz. Accessed 5th
August 2006.
MATUNGUL, .P. (2002). Marketing constraints faced by communal farmers in
KwaZulu-Natal, South Africa: case study of transaction costs. Unpublished PhD Thesis,
University of Natal, Agricultural Economics, Pietermaritzburg.
68
McFADDEN, D. (1974). Conditional logit analysis of qualitative choice behavior.
Frontiers in Econometrics, Zarembka P (ed.). Academic Press, New York.
MITCHELL, M. & TOPP, C.F.E. (2003). Forecasting the environmental and
Socioeconomic consequences of changes in the Common Agricultural Policy.
Agricultural Systems, 23 (1), 227–252.
MOLINAS, R.J. (1998). Who cooperates? A study of membership in peasant
cooperatives. Instituto desarrollo, Paraguay. www.deesarrollo.du.py. Accessed 20th
July
2006.
MOPANI DISTRICT MUNICIPALITY, (2005). Draft Local Economic Development
Strategy.
RAFT LOCAL ECONOMICDRAFT LOCAL E
MYLES, P. (1999). Agritourism a new drawcard for SA visitors. Tourism 2000 network.
NAICKER, K. & VILJOEN, J.H. (2000). Nature-based tourism on communal land: the
Mavhulani experience. Development Southern Africa, 17 (1), 135– 148.UYYYYYYMENT
NHEMACHENA, C. (2009). Agriculture and future climate Dynamics in Africa: Impacts
and Adaptation Options. PhD thesis, University of Pretoria, Department of. Agricultural
Economics, Extension and Rural Development.

69
NORUŠIS, M.J. (1997). SPSS ® 7.5 Guide to Data Analysis, 444 North Michagan
Avenue, Chicago, IL60611, A Simon and Schuster Company
PROMAR INTERNATIONAL (1999). From sub-culture to supermarket: Organic foods
grow up: Volume 1: Meeting supply side realities, Management Summary,1101 King
Street, Suite 444, Alexandria, VA 22314, USA. www.promarinternational.com. Accessed
2nd May 2006.
REGIONAL MUNICIPALITY OF NIAGARA (RMN). (2003). Regional Agricultural
Economic Impact Study.
RAMSEY, M. & SCHAUMLEFFEL, N.A. (2006). Agritourism and Rural Economic
Development. Indiana State University, Indianapolis.
REGIONAL MUNICIPALITY
OF NIAGARA (RMN) (2003). Regional Agricultural
Economic Impact Study. Planscape – Building Community through Planning.
RILEY, B. & SILVER, J. (2001). Environmental Impact of Pesticides Commonly Used
on Urban Landscapes, Restoring Healthy School Landscapes, Northwest Coalition for
alternatives to pesticides/ncap, Eugene, Oregon.

70
SEGERSON, K. & WU, J. (1995). The Impact of Policies and Land Characteristics on
Potential Groundwater Pollution in Wisconsin. American Journal of Agricultural
Economic, 77, 1033 - 1047.
SOUTH AFRICA DEPARTMENT OF ENVIRONMENTAL AFFAIRS AND
TOURISM (SADEAT), (1997). White paper on the conservation and sustainable use of
South Africa's biological diversity. GENERAL NOTICE, NOTICE 1095 OF 1997.
SOUTH AFRICAN GOVERNMENT (SAG) (2000). The integrated sustainable rural
development strategy.
SOUTHERN AFRICAN DEVELOPMENT COMMUNITY (
SADC) (2003). Regional
indicative strategic development plan. SADC secretariat.
SULLINS, M., THILMANY, D & WILSON, J. (2006). Economic Development Report.
Colorado State University.
UNITED NATIONS ENVIRONMENT PROGRAMME AND THE CONVENTION ON
BIOLOGICAL DIVERSITY (UNEP), (2002). Biological Diversity and Tourism.
International Guidelines for Sustainable Tourism. Switzerland.
71
WALFORD, N., (2002). Agricultural adjustment: adoption of and adaptation to policy
Reform measures by large-scale commercial farmers. Land Use Policy, 19 (3), 243-
257.
WILLIAMS, D. R. & VAN PATTEN, S. (1998). Back to the future? Tourism, place, and
sustainability. In L. Anderson and T. Blom (Eds.), Sustainability and development: On
the future of small society in a dynamic economy (Proceedings of the Karlsbad
International seminar), pp. 359-369. Karlsbad, Sweden, University of Karlsbad.
WORLD CONSERVATION MONITORING CENTRE, (1992). Global Biodiversity:
Status of the Earth’s Living Resources. Compiled by the World Conservation Monitoring
Centre, Cambridge, U.K. Chapman and Hally. London.

72
APPENDIX

73
SOCIO-ECONOMIC ANALYSIS OF AGRITOURISM IN TWO RURAL
COMMUNITIES IN THE LIMPOPO PROVINCE.
SURVEY QUESTIONNAIRE
Dear farmer, it would be a great pleasure if you could take part in assisting in this
research by answering this questionnaire. The main purpose of the study is to analyse the
socio-economic factors affecting agritourism business in your area. Information provided
will help a great deal in the study.
Many thanks for your interest and time.
Questionnaire no.............. Researcher: Khehla Mnguni

74
1. Farmer characteristics
Age ……………years.
Gender
Male = 0 Female = 1
Do you read and write English?
No = 0 Yes = 1
Which other language/s do you use in your farming business?
No = 0 Yes = 1
Afrikaans
Sepedi
Xitsonga
Tshivenda
More than one
Other
What is your highest educational qualification?
None Primary school Secondary school College University

75
2. Farm characteristics
i. How many family members are employed in your farming business?
……………………………………….
ii. How big is your farm?………………………………ha

76
iii. Farm income
a. Please provide the following information for agritourism products produced during the various production seasons in 2004, 2005
and 2006.
Table 1
Vegetables
e.g.
Cabbages,
Onion, etc.
Planted area under
Dry land
(hectares)
Planted area under
Irrigated
(hectares)
Quantity harvested
Dry land
(metric tones)
Quantity harvested
Irrigated
(metric tones)
Net farming income
(Rand)
2004 2005 2006 2004 2005 2006 2004 2005 2006 2004 2005 2006 2004 2005 2006
Total net income earned from vegetables
Average net income earned from vegetables ……………………………………

77
Table 2
Subtropical
fruit, e.g.
mangoes,
banana, etc.
Planted area under
Dry land
(hectares)
Planted area under
Irrigated
(hectares)
Quantity harvested
Dry land
(metric tones)
Quantity harvested
Irrigated
(metric tones)
Net farming income
(Rand)
2004 2005 2006 2004 2005 2006 2004 2005 2006 2004 2005 2006 2004 2005 2006
Total net income earned from subtropical fruits
Average net income earned from subtropical fruits …………………………………

78
Table 3
Field crops,
e.g. maize,
sorghum,
etc.
Planted area under
Dry land
(hectares)
Planted area under
Irrigated
(hectares)
Quantity harvested
Dry land
(metric tones)
Quantity harvested
Irrigated
(metric tones)
Net farming income
(Rand)
2004 2005 2006 2004 2005 2006 2004 2005 2006 2004 2005 2006 2004 2005 2006
Total net income earned from field products
Average gross income earned from field products ……………………………………

79
b. Please provide the following information for the animals produced and sold during the various production seasons in 2004, 2005
and 2006.
Table 4 Animals, e.g.
goats, cattle,
chickens, etc.
Number of animals sold to abattoirs
Number of animals sold elsewhere
Net farming income (Rand)
2004 2005 2006 2004 2005 2006 2004 2005 2006
Total net income earned from number of animals sold

80
Average net income earned from animals sold ……………………………
c. Please provides the information about tourism services that took place during the various periods in 2004, 2005 and 2006.
Table 5 Transport type, e.g.
vehicles, donkeys,
horses, etc.
Number
Net income generated from the transport usages
(Rand)
2004 2005 2006 2004 2005 2006
Total net income earned from transport
Average net income earned from transport ………………………………….

81
Table 6
Residence Number of guest houses
Number of guests accommodated
Net income (Rand)
2004 2005 2006 2004 2005 2006 2004 2005 2006
Accommodation
Total net income earned from accommodation
Average net income earned from accommodation ………………………………….
Total farming income earned between 2004, 2005 and 2006……………………………
How satisfied were you with the profit of agritourism products and services?
Very dissatisfied = 1 Dissatisfied = 2 Somewhat satisfied = 3 Satisfied =4 Very satisfied = 5

82
3. Transaction costs
Do you have rented land for agritourism business? No = 0 Yes = 1
If yes, how many hectares are rented? ……………………………………………………..
How much do you pay for leasing? ……………………..…………………………………
What is your total land size?..................................................................................................
Do you have a secured transport to distribute agritourism products?
No = 0 Yes = 1
If no, how serious do you encounter transportation problems?
Not serious at all = 1 Not serious = 2 Moderate = 3 Serious = 4 Very serious = 5
Do you have a secured market for your products?
No = 0 Yes = 1
If no, how serious do you encounter market problems?
Not serious at all = 1 Not serious = 2 Moderate = 3 Serious = 4 Very serious = 5
How do you market your products?
………...…………………………………………………………………………………….

83
…………………………………………………………………………………………………
……………………………………………………………………………………………
Do you encounter price uncertainty in the market?
No = 0 Yes = 1
If yes, how serious is this problem?
Not serious at all = 1 Not serious = 2 Moderate = 3 Serious = 4 Very serious = 5
Do you have access to tractor for tillage purposes?
No = 0 Yes = 1
If no, how serious is this problem?
Not serious at all = 1 Not serious = 2 Moderate = 3 Serious = 4 Very serious = 5
Do you have additional labour for agritourism crop production?
No = 0 Yes = 1
If no, how serious is this problem?
Not serious at all = 1 Not serious = 2 Moderate = 3 Serious = 4 Very serious = 5

84
Do you have access to manure when needed?
No = 0 Yes = 1
If no, how serious is this problem?
Not serious at all = 1 Not serious = 2 Moderate = 3 Serious = 4 Very serious = 5
Do you have access to agritourism/organic information?
No = 0 Yes = 1
If no, how serious is this problem?
Not serious at all = 1 Not serious = 2 Moderate = 3 Serious = 4 Very serious = 5
What are the main constraints do you face?
Answer:…………………………………………………………………………………….
………………………………………………………………………………………
………………………………………………………………………………………
………………………………………………………………………………………
What are the most essential services do you need?
Answer:…………………………………………………………………………………….
………………………………………………………………………………………
…………………………………………………………………………………………………
…………………………………………………………………………………