the society of motor manufacturers and traders motor ... · 12 Land Rover Solihull and Halewood Car...
44
THE SOCIETY OF MOTOR MANUFACTURERS AND TRADERS MOTOR INDUSTRY FACTS 2011
Transcript of the society of motor manufacturers and traders motor ... · 12 Land Rover Solihull and Halewood Car...
the society of motor manufacturers and traders motor industry facts 2011
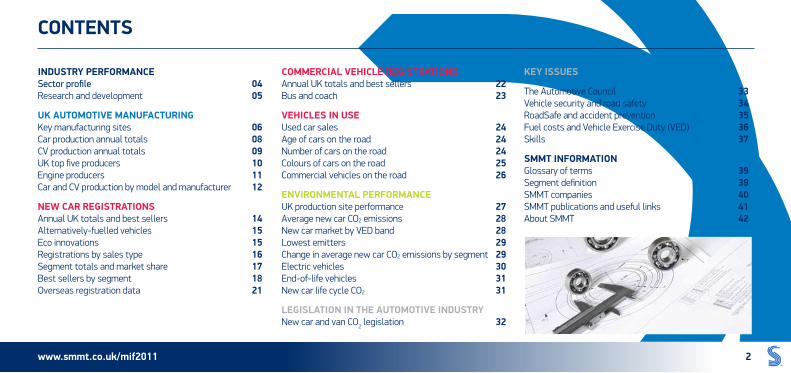
industry performancesector profile 04Research and development 05
uK automotive manufacturingKey manufacturing sites 06Car production annual totals 08CV production annual totals 09UK top five producers 10Engine producers 11Car and CV production by model and manufacturer 12
new car registrationsAnnual UK totals and best sellers 14Alternatively-fuelled vehicles 15Eco innovations 15Registrations by sales type 16Segment totals and market share 17Best sellers by segment 18Overseas registration data 21
contents
commercial vehicle registrationsAnnual UK totals and best sellers 22Bus and coach 23
vehicles in useUsed car sales 24Age of cars on the road 24Number of cars on the road 24Colours of cars on the road 25Commercial vehicles on the road 26
environmental performanceUK production site performance 27Average new car CO2 emissions 28New car market by VED band 28Lowest emitters 29Change in average new car CO2 emissions by segment 29Electric vehicles 30End-of-life vehicles 31New car life cycle CO2 31
legislation in the automotive industry New car and van CO2 legislation 32
Key issues
The Automotive Council 33Vehicle security and road safety 34RoadSafe and accident prevention 35Fuel costs and Vehicle Exercise Duty (VED) 36Skills 37
smmt informationGlossary of terms 39Segment definition 39SMMT companies 40SMMT publications and useful links 41About SMMT 42
www.smmt.co.uk/mif2011 2
smmt automotive information services (ais) is the primary source for motor industry data. from production and first registration data to on the road vehicle sales, smmt holds over 100 years of detailed uK automotive industry and vehicle data.
to find out more go to www.smmt.co.uk/dataservices
www.smmt.co.uk/mif2011 3
industry performance
the automotive industry is a vital part of the uK economy.• The UK produces over one million cars and commercial
vehicles and over two million engines annually.
• The automotive sector contributes over 10% of total UK exports, delivering an average annual export value of more than £25bn over the last five years.*
• The UK automotive sector exports to over 100 markets worldwide.
• The UK had the fourth highest R&D spend in Europe and represented a fifth of core global R&D activity in 2010.*
• The automotive industry employs over 700,000 people from manufacturing to retailing and contributes £8.5bn added value to the economy.
• In 2010, the UK exported 75% of the vehicles it manufactured.
• Average new car CO2 emissions have fallen 20.3% in the last 10 years to 144.2g/km CO2.
the uK is home to:• Seven volume car manufacturers and eight
CV manufacturers.
• The largest number of specialist sports car manufacturers in the world and 19 of the world’s top 20 suppliers.
• Eight Formula One teams, supported by more than 300 specialist motorsport companies, employing nearly 50,000 people in motorsport valley.
• The motor industry in the UK has a strong future and is at the heart of the low carbon agenda, investing in R&D that will deliver ever cleaner, safer and more fuel-efficient cars.
Source: *Department for Business Innovation and Skills (BIS) 2010 R&D Scoreboard
www.smmt.co.uk/mif2011 4
research and developmentInnovation, design and engineering are at the heart of the UK automotive industry.
Over £1.5bn is spent annually on automotive R&D in the UK and strategic government support for the transition to low carbon will continue to support over 700,000 jobs in the UK that rely on automotive manufacturing.
In 2009, UK R&D investment in automobile and parts grew 9%.*
Eight of the top 25 global and four of the top 25 UK R&D investors are from the automobile and parts sector.*
In total, there are 31 automobile and parts companies in the UK1000 and 72 in the G1000.
(UK1000 is the top 1000 manufacturing companies in the UK. G1000 is the top 100 global manufacturing companies*).
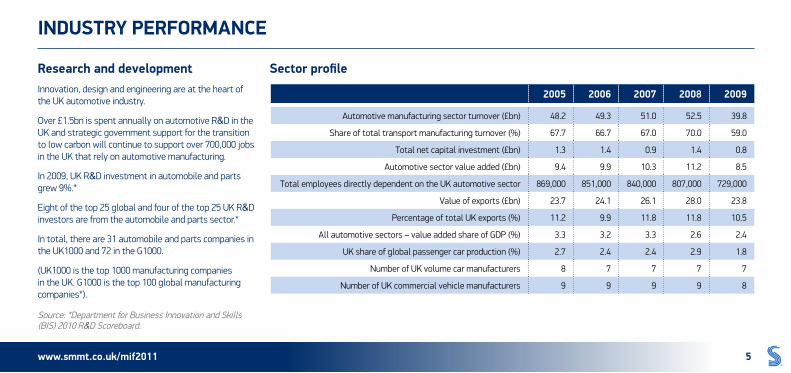
sector profile
Source: *Department for Business Innovation and Skills (BIS) 2010 R&D Scoreboard.
2005 2006 2007 2008 2009
Automotive manufacturing sector turnover (£bn) 48.2 49.3 51.0 52.5 39.8
Share of total transport manufacturing turnover (%) 67.7 66.7 67.0 70.0 59.0
Total net capital investment (£bn) 1.3 1.4 0.9 1.4 0.8
Automotive sector value added (£bn) 9.4 9.9 10.3 11.2 8.5
Total employees directly dependent on the UK automotive sector 869,000 851,000 840,000 807,000 729,000
Value of exports (£bn) 23.7 24.1 26.1 28.0 23.8
Percentage of total UK exports (%) 11.2 9.9 11.8 11.8 10.5
All automotive sectors – value added share of GDP (%) 3.3 3.2 3.3 2.6 2.4
UK share of global passenger car production (%) 2.7 2.4 2.4 2.9 1.8
Number of UK volume car manufacturers 8 7 7 7 7
Number of UK commercial vehicle manufacturers 9 9 9 9 8
industry performance
www.smmt.co.uk/mif2011 5
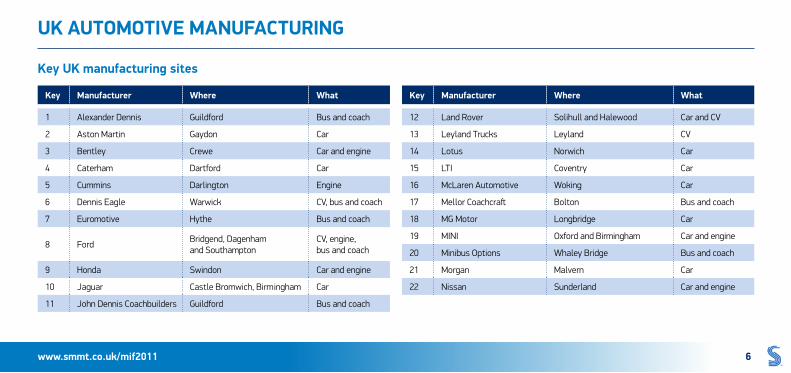
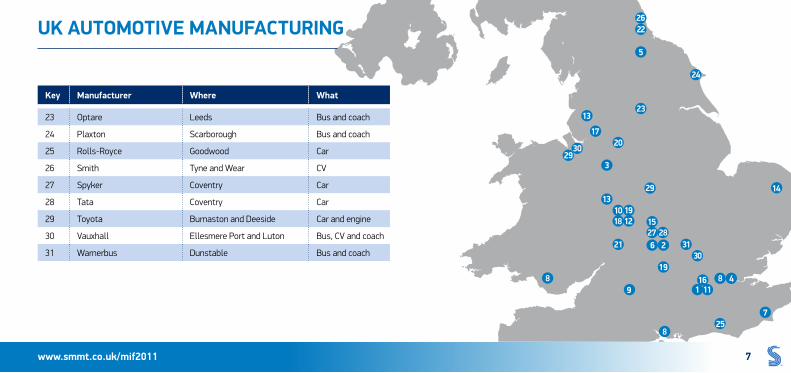
Key uK manufacturing sites
uK automotive manufacturing
Key manufacturer where what
1 Alexander Dennis Guildford Bus and coach
2 Aston Martin Gaydon Car
3 Bentley Crewe Car and engine
4 Caterham Dartford Car
5 Cummins Darlington Engine
6 Dennis Eagle Warwick CV, bus and coach
7 Euromotive Hythe Bus and coach
8 FordBridgend, Dagenham and Southampton
CV, engine, bus and coach
9 Honda Swindon Car and engine
10 Jaguar Castle Bromwich, Birmingham Car
11 John Dennis Coachbuilders Guildford Bus and coach
Key manufacturer where what
12 Land Rover Solihull and Halewood Car and CV
13 Leyland Trucks Leyland CV
14 Lotus Norwich Car
15 LTI Coventry Car
16 McLaren Automotive Woking Car
17 Mellor Coachcraft Bolton Bus and coach
18 MG Motor Longbridge Car
19 MINI Oxford and Birmingham Car and engine
20 Minibus Options Whaley Bridge Bus and coach
21 Morgan Malvern Car
22 Nissan Sunderland Car and engine
www.smmt.co.uk/mif2011 6
1 11
2
3
194
5
6
1527 28
7
8
8
9
3031
10 1912
1314
17
13
20
16
18
21
22
23
24
25
26
29
3029
8
uK automotive manufacturing
Key manufacturer where what
23 Optare Leeds Bus and coach
24 Plaxton Scarborough Bus and coach
25 Rolls-Royce Goodwood Car
26 Smith Tyne and Wear CV
27 Spyker Coventry Car
28 Tata Coventry Car
29 Toyota Burnaston and Deeside Car and engine
30 Vauxhall Ellesmere Port and Luton Bus, CV and coach
31 Warnerbus Dunstable Bus and coach
www.smmt.co.uk/mif2011 7
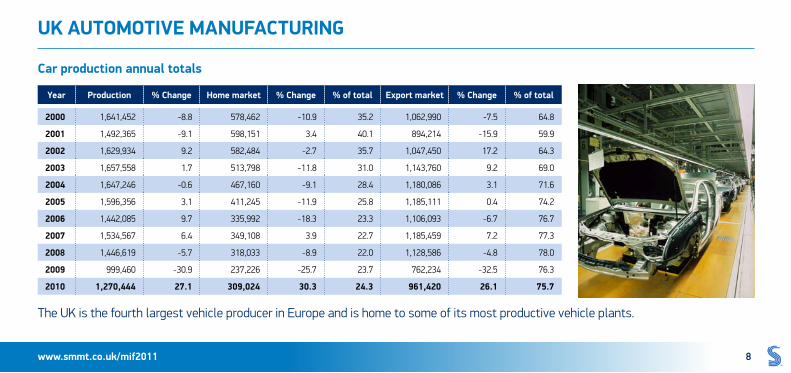
car production annual totals
year production % change home market % change % of total export market % change % of total
2000 1,641,452 -8.8 578,462 -10.9 35.2 1,062,990 -7.5 64.8
2001 1,492,365 -9.1 598,151 3.4 40.1 894,214 -15.9 59.9
2002 1,629,934 9.2 582,484 -2.7 35.7 1,047,450 17.2 64.3
2003 1,657,558 1.7 513,798 -11.8 31.0 1,143,760 9.2 69.0
2004 1,647,246 -0.6 467,160 -9.1 28.4 1,180,086 3.1 71.6
2005 1,596,356 3.1 411,245 -11.9 25.8 1,185,111 0.4 74.2
2006 1,442,085 9.7 335,992 -18.3 23.3 1,106,093 -6.7 76.7
2007 1,534,567 6.4 349,108 3.9 22.7 1,185,459 7.2 77.3
2008 1,446,619 -5.7 318,033 -8.9 22.0 1,128,586 -4.8 78.0
2009 999,460 -30.9 237,226 -25.7 23.7 762,234 -32.5 76.3
2010 1,270,444 27.1 309,024 30.3 24.3 961,420 26.1 75.7
The UK is the fourth largest vehicle producer in Europe and is home to some of its most productive vehicle plants.
uK automotive manufacturing
www.smmt.co.uk/mif2011 8
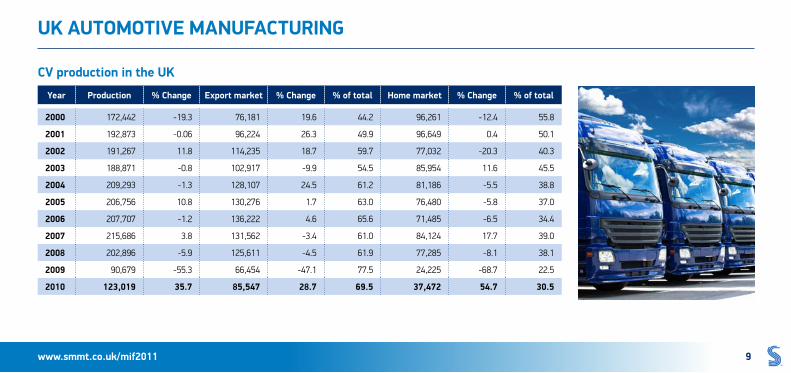
cv production in the uK
uK automotive manufacturing
year production % change export market % change % of total home market % change % of total
2000 172,442 -19.3 76,181 19.6 44.2 96,261 -12.4 55.8
2001 192,873 -0.06 96,224 26.3 49.9 96,649 0.4 50.1
2002 191,267 11.8 114,235 18.7 59.7 77,032 -20.3 40.3
2003 188,871 -0.8 102,917 -9.9 54.5 85,954 11.6 45.5
2004 209,293 -1.3 128,107 24.5 61.2 81,186 -5.5 38.8
2005 206,756 10.8 130,276 1.7 63.0 76,480 -5.8 37.0
2006 207,707 -1.2 136,222 4.6 65.6 71,485 -6.5 34.4
2007 215,686 3.8 131,562 -3.4 61.0 84,124 17.7 39.0
2008 202,896 -5.9 125,611 -4.5 61.9 77,285 -8.1 38.1
2009 90,679 -55.3 66,454 -47.1 77.5 24,225 -68.7 22.5
2010 123,019 35.7 85,547 28.7 69.5 37,472 54.7 30.5
www.smmt.co.uk/mif2011 9
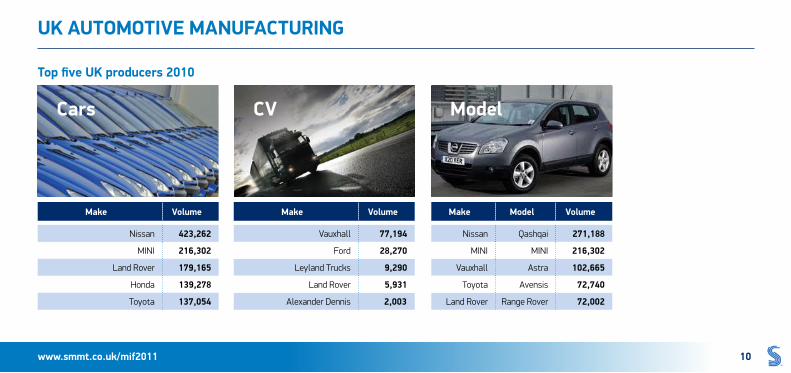
top five uK producers 2010
uK automotive manufacturing
model
make model volume
Nissan Qashqai 271,188
MINI MINI 216,302
Vauxhall Astra 102,665
Toyota Avensis 72,740
Land Rover Range Rover 72,002
cv
make volume
Vauxhall 77,194
Ford 28,270
Leyland Trucks 9,290
Land Rover 5,931
Alexander Dennis 2,003
cars
make volume
Nissan 423,262
MINI 216,302
Land Rover 179,165
Honda 139,278
Toyota 137,054
www.smmt.co.uk/mif2011 10
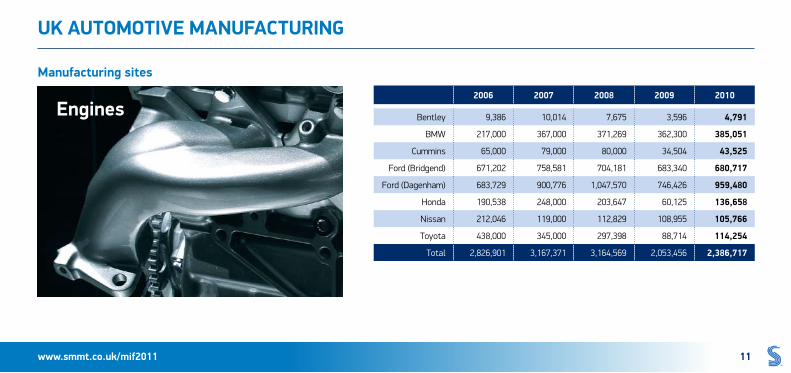
manufacturing sites
engines
uK automotive manufacturing
2006 2007 2008 2009 2010
Bentley 9,386 10,014 7,675 3,596 4,791
BMW 217,000 367,000 371,269 362,300 385,051
Cummins 65,000 79,000 80,000 34,504 43,525
Ford (Bridgend) 671,202 758,581 704,181 683,340 680,717
Ford (Dagenham) 683,729 900,776 1,047,570 746,426 959,480
Honda 190,538 248,000 203,647 60,125 136,658
Nissan 212,046 119,000 112,829 108,955 105,766
Toyota 438,000 345,000 297,398 88,714 114,254
Total 2,826,901 3,167,371 3,164,569 2,053,456 2,386,717
www.smmt.co.uk/mif2011 11
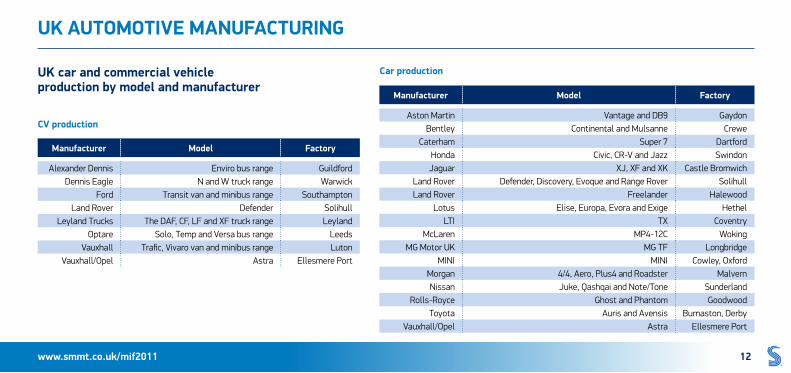
uK car and commercial vehicle production by model and manufacturer
car production
cv production
uK automotive manufacturing
manufacturer model factory
Alexander Dennis Enviro bus range Guildford Dennis Eagle N and W truck range Warwick
Ford Transit van and minibus range Southampton Land Rover Defender Solihull
Leyland Trucks The DAF, CF, LF and XF truck range Leyland Optare Solo, Temp and Versa bus range Leeds
Vauxhall Trafic, Vivaro van and minibus range Luton Vauxhall/Opel Astra Ellesmere Port
manufacturer model factory
Aston Martin Vantage and DB9 GaydonBentley Continental and Mulsanne Crewe
Caterham Super 7 DartfordHonda Civic, CR-V and Jazz SwindonJaguar XJ, XF and XK Castle Bromwich
Land Rover Defender, Discovery, Evoque and Range Rover SolihullLand Rover Freelander Halewood
Lotus Elise, Europa, Evora and Exige HethelLTI TX Coventry
McLaren MP4-12C WokingMG Motor UK MG TF Longbridge
MINI MINI Cowley, OxfordMorgan 4/4, Aero, Plus4 and Roadster MalvernNissan Juke, Qashqai and Note/Tone Sunderland
Rolls-Royce Ghost and Phantom GoodwoodToyota Auris and Avensis Burnaston, Derby
Vauxhall/Opel Astra Ellesmere Port
www.smmt.co.uk/mif2011 12
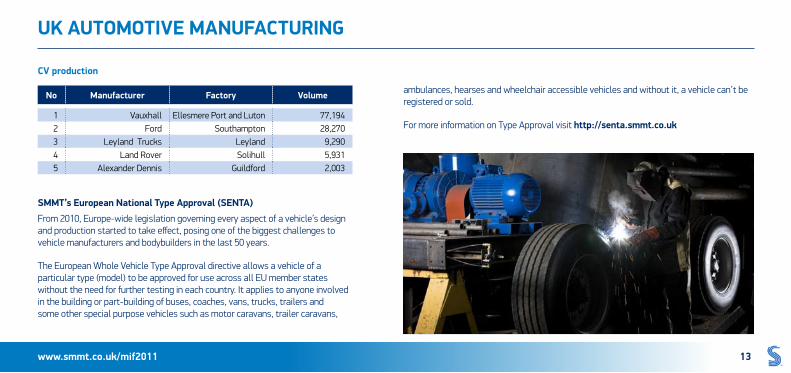
cv production
uK automotive manufacturing
no manufacturer factory volume
1 Vauxhall Ellesmere Port and Luton 77,1942 Ford Southampton 28,2703 Leyland Trucks Leyland 9,2904 Land Rover Solihull 5,9315 Alexander Dennis Guildford 2,003
smmt’s european national type approval (senta) From 2010, Europe-wide legislation governing every aspect of a vehicle’s design and production started to take effect, posing one of the biggest challenges to vehicle manufacturers and bodybuilders in the last 50 years.
The European Whole Vehicle Type Approval directive allows a vehicle of a particular type (model) to be approved for use across all EU member states without the need for further testing in each country. It applies to anyone involved in the building or part-building of buses, coaches, vans, trucks, trailers and some other special purpose vehicles such as motor caravans, trailer caravans,
ambulances, hearses and wheelchair accessible vehicles and without it, a vehicle can’t be registered or sold.
For more information on Type Approval visit http://senta.smmt.co.uk
www.smmt.co.uk/mif2011 13
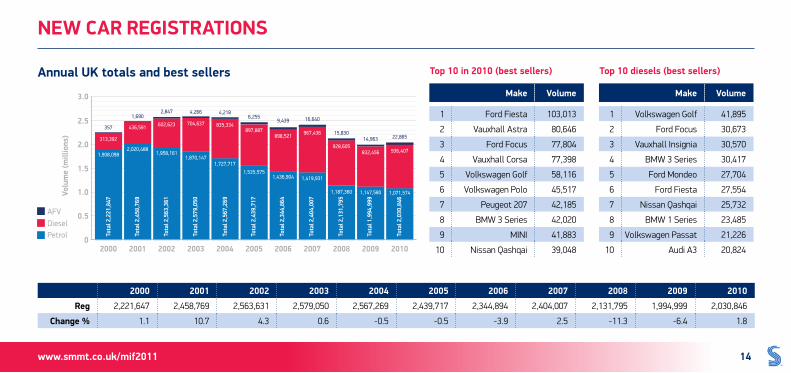
annual uK totals and best sellers top 10 diesels (best sellers)
2000 2001 2002 2003 2004 2005 2006 2007 2008 2009 2010
AFVDieselPetrol 0
0.5
1.0
1.5
2.0
2.5
3.0
Volu
me
(mill
ions
)
Tota
l 2,2
21,8
47
Tota
l 2,4
58,7
69
Tota
l 2,5
63,3
61
Tota
l 2,5
79,0
50
Tota
l 2,5
67,2
69
Tota
l 2,4
39,7
17
Tota
l 2,3
44,8
64
Tota
l 2,4
04,0
07
Tota
l 2,1
31,7
95
Tota
l 1,9
94,9
99
Tota
l 2,0
30,8
46
2010 UK totals and best sellers by fuel type Year Petrol Diesel AFV2000 1,908,098 313,192 3572001 2,020,488 436,591 1,6902002 1,958,161 602,623 2,8472003 1,870,147 704,637 4,2662004 1,727,717 835,334 4,2182005 1,535,575 897,887 6,2552006 1,436,904 898,521 9,4392007 1,419,931 967,436 16,6402008 1,187,360 928,605 15,8302009 1,147,580 832,456 14,9632010 1,071,574 936,407 22,865
1,908,0982,020,488
1,958,1611,870,147
1,727,7171,535,575
1,436,904 1,419,931
1,187,360 1,147,580 1,071,574
313,392
436,591 602,623 704,637 835,334897,887
898,521 967,436
928,605832,456 936,407
357
1,6902,847 4,266 4,218
6,2559,439 16,640
15,83014,963 22,865
top 10 in 2010 (best sellers)
new car registrations
make volume
1 Ford Fiesta 103,013
2 Vauxhall Astra 80,646
3 Ford Focus 77,804
4 Vauxhall Corsa 77,398
5 Volkswagen Golf 58,116
6 Volkswagen Polo 45,517
7 Peugeot 207 42,185
8 BMW 3 Series 42,020
9 MINI 41,883
10 Nissan Qashqai 39,048
2000 2001 2002 2003 2004 2005 2006 2007 2008 2009 2010
reg 2,221,647 2,458,769 2,563,631 2,579,050 2,567,269 2,439,717 2,344,894 2,404,007 2,131,795 1,994,999 2,030,846
change % 1.1 10.7 4.3 0.6 -0.5 -0.5 -3.9 2.5 -11.3 -6.4 1.8
make volume
1 Volkswagen Golf 41,895
2 Ford Focus 30,673
3 Vauxhall Insignia 30,570
4 BMW 3 Series 30,417
5 Ford Mondeo 27,704
6 Ford Fiesta 27,554
7 Nissan Qashqai 25,732
8 BMW 1 Series 23,485
9 Volkswagen Passat 21,226
10 Audi A3 20,824
www.smmt.co.uk/mif2011 14
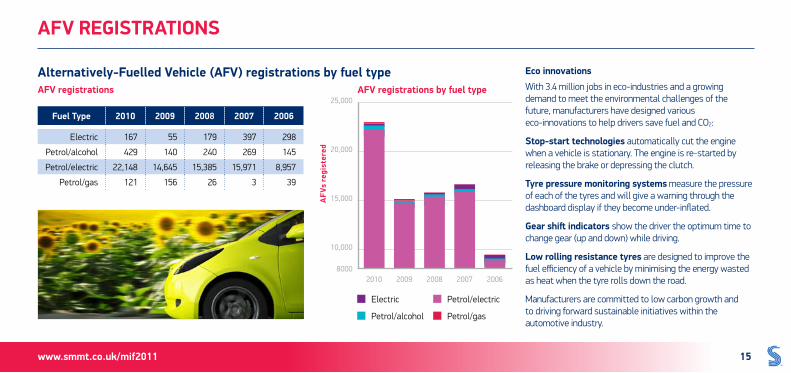
alternatively-fuelled vehicle (afv) registrations by fuel type eco innovationsWith 3.4 million jobs in eco-industries and a growing demand to meet the environmental challenges of the future, manufacturers have designed various eco-innovations to help drivers save fuel and CO2:
stop-start technologies automatically cut the engine when a vehicle is stationary. The engine is re-started by releasing the brake or depressing the clutch.
tyre pressure monitoring systems measure the pressure of each of the tyres and will give a warning through the dashboard display if they become under-inflated.
gear shift indicators show the driver the optimum time to change gear (up and down) while driving.
low rolling resistance tyres are designed to improve the fuel efficiency of a vehicle by minimising the energy wasted as heat when the tyre rolls down the road.
Manufacturers are committed to low carbon growth and to driving forward sustainable initiatives within the automotive industry.
afv registrations
fuel type 2010 2009 2008 2007 2006
Electric 167 55 179 397 298
Petrol/alcohol 429 140 240 269 145
Petrol/electric 22,148 14,645 15,385 15,971 8,957
Petrol/gas 121 156 26 3 39
afv registrations by fuel type
20108000
10,000
15,000
20,000
25,000
2009 2008 2007 2006
afv
s re
gist
ered
Electric
Petrol/alcohol
Petrol/electric
Petrol/gas
www.smmt.co.uk/mif2011 15
afv registrations
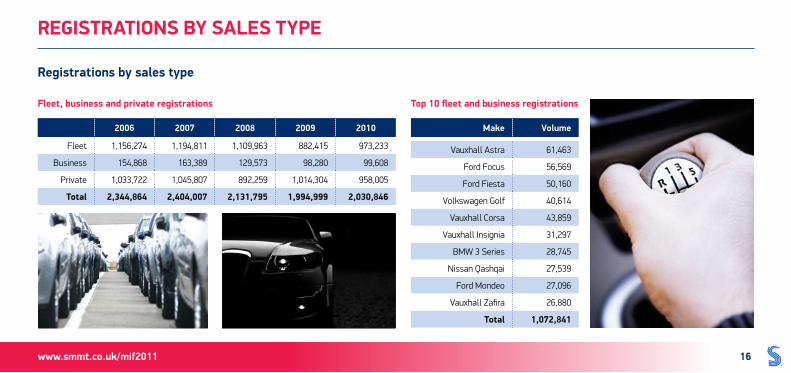
fleet, business and private registrations top 10 fleet and business registrations
registrations by sales type
registrations by sales type
2006 2007 2008 2009 2010
Fleet 1,156,274 1,194,811 1,109,963 882,415 973,233
Business 154,868 163,389 129,573 98,280 99,608
Private 1,033,722 1,045,807 892,259 1,014,304 958,005
total 2,344,864 2,404,007 2,131,795 1,994,999 2,030,846
make volume
Vauxhall Astra 61,463
Ford Focus 56,569
Ford Fiesta 50,160
Volkswagen Golf 40,614
Vauxhall Corsa 43,859
Vauxhall Insignia 31,297
BMW 3 Series 28,745
Nissan Qashqai 27,539
Ford Mondeo 27,096
Vauxhall Zafira 26,880
total 1,072,841
www.smmt.co.uk/mif2011 16
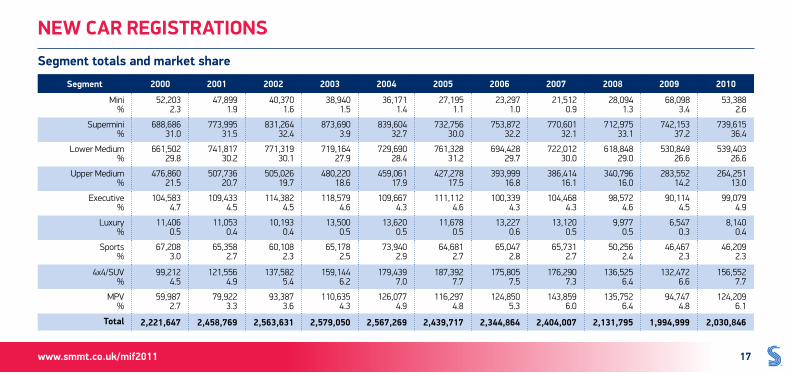
segment totals and market share
new car registrations
segment 2000 2001 2002 2003 2004 2005 2006 2007 2008 2009 2010
Mini %
52,203 2.3
47,899 1.9
40,370 1.6
38,940 1.5
36,171 1.4
27,195 1.1
23,297 1.0
21,512 0.9
28,094 1.3
68,098 3.4
53,388 2.6
Supermini %
688,686 31.0
773,995 31.5
831,264 32.4
873,690 3.9
839,604 32.7
732,756 30.0
753,872 32.2
770,601 32.1
712,975 33.1
742,153 37.2
739,615 36.4
Lower Medium %
661,502 29.8
741,817 30.2
771,319 30.1
719,164 27.9
729,690 28.4
761,328 31.2
694,428 29.7
722,012 30.0
618,848 29.0
530,849 26.6
539,403 26.6
Upper Medium %
476,860 21.5
507,736 20.7
505,026 19.7
480,220 18.6
459,061 17.9
427,278 17.5
393,999 16.8
386,414 16.1
340,796 16.0
283,552 14.2
264,251 13.0
Executive %
104,583 4.7
109,433 4.5
114,382 4.5
118,579 4.6
109,667 4.3
111,112 4.6
100,339 4.3
104,468 4.3
98,572 4.6
90,114 4.5
99,079 4.9
Luxury %
11,406 0.5
11,053 0.4
10,193 0.4
13,500 0.5
13,620 0.5
11,678 0.5
13,227 0.6
13,120 0.5
9,977 0.5
6,547 0.3
8,140 0.4
Sports %
67,208 3.0
65,358 2.7
60,108 2.3
65,178 2.5
73,940 2.9
64,681 2.7
65,047 2.8
65,731 2.7
50,256 2.4
46,467 2.3
46,209 2.3
4x4/SUV %
99,212 4.5
121,556 4.9
137,582 5.4
159,144 6.2
179,439 7.0
187,392 7.7
175,805 7.5
176,290 7.3
136,525 6.4
132,472 6.6
156,552 7.7
MPV %
59,987 2.7
79,922 3.3
93,387 3.6
110,635 4.3
126,077 4.9
116,297 4.8
124,850 5.3
143,859 6.0
135,752 6.4
94,747 4.8
124,209 6.1
total 2,221,647 2,458,769 2,563,631 2,579,050 2,567,269 2,439,717 2,344,864 2,404,007 2,131,795 1,994,999 2,030,846
www.smmt.co.uk/mif2011 17
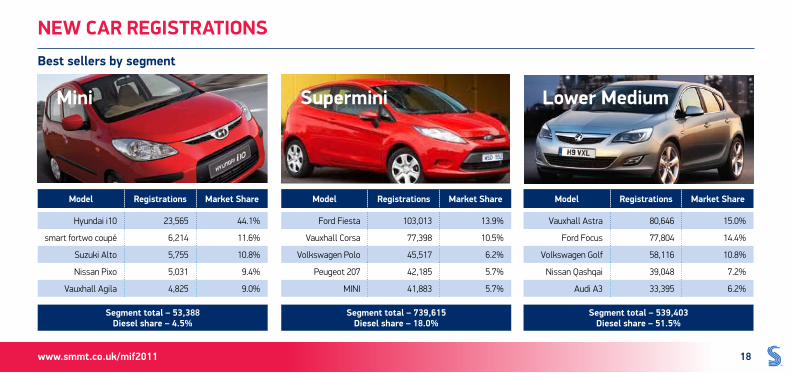
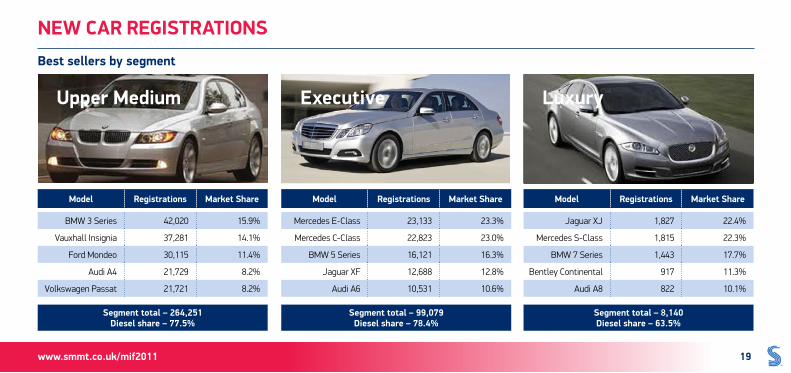
best sellers by segment
mini supermini lower medium
new car registrations
model registrations market share
Hyundai i10 23,565 44.1%
smart fortwo coupé 6,214 11.6%
Suzuki Alto 5,755 10.8%
Nissan Pixo 5,031 9.4%
Vauxhall Agila 4,825 9.0%
segment total – 53,388 diesel share – 4.5%
model registrations market share
Ford Fiesta 103,013 13.9%
Vauxhall Corsa 77,398 10.5%
Volkswagen Polo 45,517 6.2%
Peugeot 207 42,185 5.7%
MINI 41,883 5.7%
segment total – 739,615 diesel share – 18.0%
model registrations market share
Vauxhall Astra 80,646 15.0%
Ford Focus 77,804 14.4%
Volkswagen Golf 58,116 10.8%
Nissan Qashqai 39,048 7.2%
Audi A3 33,395 6.2%
segment total – 539,403 diesel share – 51.5%
www.smmt.co.uk/mif2011 18
best sellers by segment
upper medium executive luxury
model registrations market share
BMW 3 Series 42,020 15.9%
Vauxhall Insignia 37,281 14.1%
Ford Mondeo 30,115 11.4%
Audi A4 21,729 8.2%
Volkswagen Passat 21,721 8.2%
segment total – 264,251 diesel share – 77.5%
model registrations market share
Mercedes E-Class 23,133 23.3%
Mercedes C-Class 22,823 23.0%
BMW 5 Series 16,121 16.3%
Jaguar XF 12,688 12.8%
Audi A6 10,531 10.6%
segment total – 99,079 diesel share – 78.4%
model registrations market share
Jaguar XJ 1,827 22.4%
Mercedes S-Class 1,815 22.3%
BMW 7 Series 1,443 17.7%
Bentley Continental 917 11.3%
Audi A8 822 10.1%
segment total – 8,140 diesel share – 63.5%
www.smmt.co.uk/mif2011 19
new car registrations
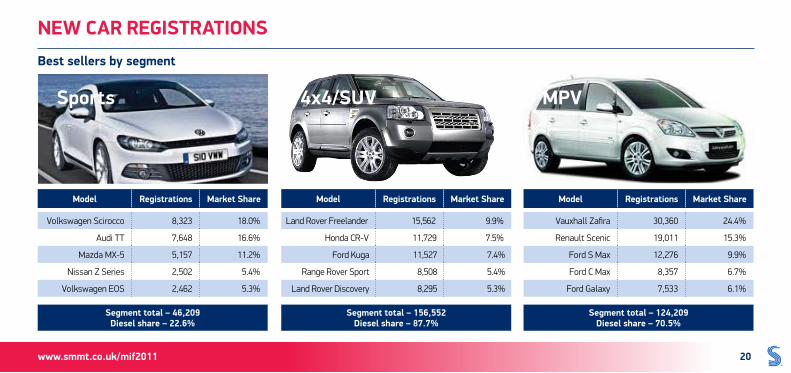
best sellers by segment
sports 4x4/suv mpv
model registrations market share
Volkswagen Scirocco 8,323 18.0%
Audi TT 7,648 16.6%
Mazda MX-5 5,157 11.2%
Nissan Z Series 2,502 5.4%
Volkswagen EOS 2,462 5.3%
segment total – 46,209 diesel share – 22.6%
model registrations market share
Land Rover Freelander 15,562 9.9%
Honda CR-V 11,729 7.5%
Ford Kuga 11,527 7.4%
Range Rover Sport 8,508 5.4%
Land Rover Discovery 8,295 5.3%
segment total – 156,552 diesel share – 87.7%
model registrations market share
Vauxhall Zafira 30,360 24.4%
Renault Scenic 19,011 15.3%
Ford S Max 12,276 9.9%
Ford C Max 8,357 6.7%
Ford Galaxy 7,533 6.1%
segment total – 124,209 diesel share – 70.5%
www.smmt.co.uk/mif2011 20
new car registrations
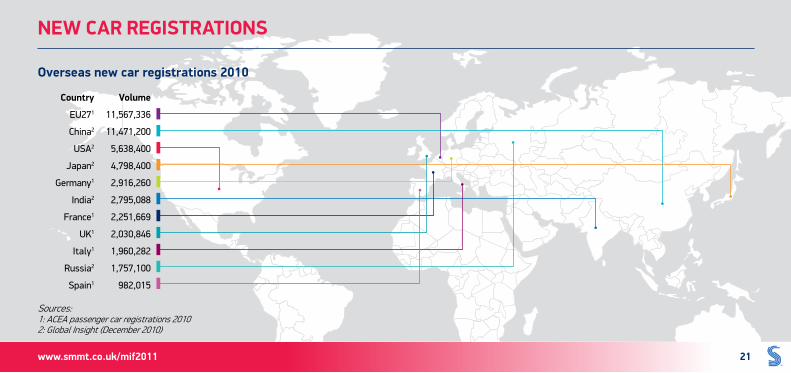
country volume
Eu271 11,567,336
china2 11,471,200
usa2 5,638,400
Japan2 4,798,400
Germany1 2,916,260
india2 2,795,088
france1 2,251,669
uK1 2,030,846
italy1 1,960,282
russia2 1,757,100
spain1 982,015
overseas new car registrations 2010
Sources: 1: ACEA passenger car registrations 2010 2: Global Insight (December 2010)
new car registrations
www.smmt.co.uk/mif2011 21
annual registrations by segment
annual uK totals
2000200
225
250
275
300
325
350
375
400
volu
me
(tho
usan
ds)
2001 2002 2003 2004 2005 2006 2007 2008 2009 2010
298,
043
270,
818
313,
411
322,
258
363,
687
389,
923
385,
969
386,
968
392,
481
351,
384 22
5,45
5
3.5%
20.1
2%5.2% 2.
8%
12.9
%
2.8%
-1.0
%
0.0% 1.
5%
-10.
5%
-35.
8%
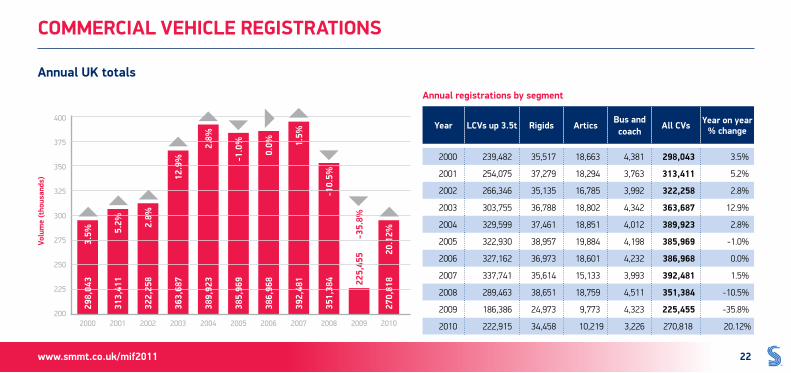
commercial vehicle registrations
year lcvs up 3.5t rigids articsbus and coach
all cvs year on year % change
2000 239,482 35,517 18,663 4,381 298,043 3.5%
2001 254,075 37,279 18,294 3,763 313,411 5.2%
2002 266,346 35,135 16,785 3,992 322,258 2.8%
2003 303,755 36,788 18,802 4,342 363,687 12.9%
2004 329,599 37,461 18,851 4,012 389,923 2.8%
2005 322,930 38,957 19,884 4,198 385,969 -1.0%
2006 327,162 36,973 18,601 4,232 386,968 0.0%
2007 337,741 35,614 15,133 3,993 392,481 1.5%
2008 289,463 38,651 18,759 4,511 351,384 -10.5%
2009 186,386 24,973 9,773 4,323 225,455 -35.8%
2010 222,915 34,458 10,219 3,226 270,818 20.12%
www.smmt.co.uk/mif2011 22
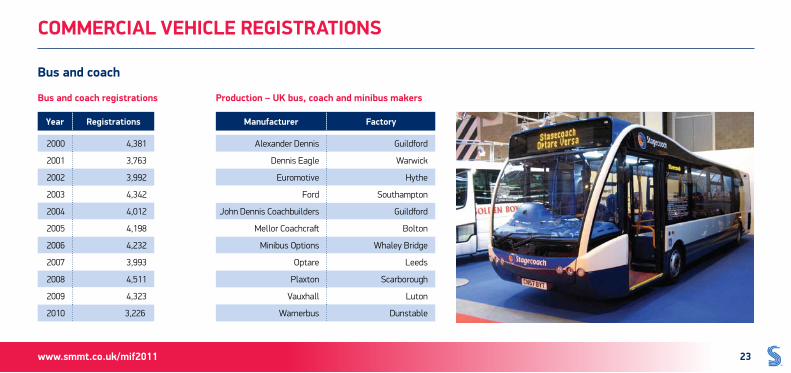
bus and coach
bus and coach registrations production – uK bus, coach and minibus makers
commercial vehicle registrations
year registrations
2000 4,381
2001 3,763
2002 3,992
2003 4,342
2004 4,012
2005 4,198
2006 4,232
2007 3,993
2008 4,511
2009 4,323
2010 3,226
manufacturer factory
Alexander Dennis Guildford
Dennis Eagle Warwick
Euromotive Hythe
Ford Southampton
John Dennis Coachbuilders Guildford
Mellor Coachcraft Bolton
Minibus Options Whaley Bridge
Optare Leeds
Plaxton Scarborough
Vauxhall Luton
Warnerbus Dunstable
www.smmt.co.uk/mif2011 23
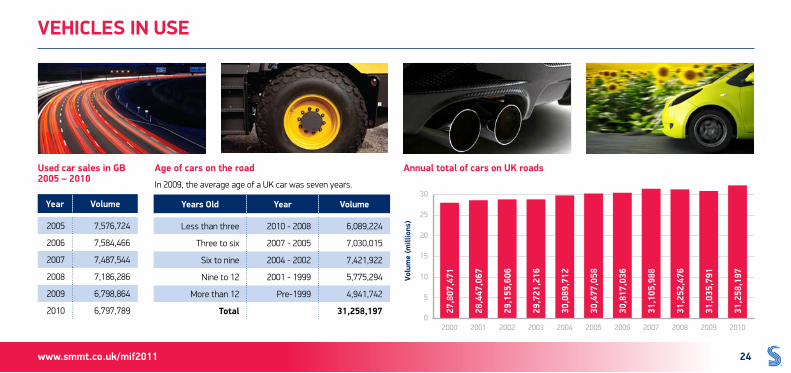
used car sales in gb 2005 – 2010
age of cars on the road annual total of cars on uK roads
0
5
10
15
20
25
30
volu
me
(mill
ions
)
2000
27,8
07,4
71
2001
28,4
47,0
67
2002
29,1
55,6
06
2003
29,7
21,2
16
2004
30,0
89,7
12
2005
30,4
77,0
58
2006
30,8
17,0
36
2007
31,1
05,9
88
2008
31,2
52,4
76
2009
31,0
35,7
91
2010
31,2
58,1
97
In 2009, the average age of a UK car was seven years.
vehicles in use
year volume
2005 7,576,724
2006 7,584,466
2007 7,487,544
2008 7,186,286
2009 6,798,864
2010 6,797,789
years old year volume
Less than three 2010 - 2008 6,089,224
Three to six 2007 - 2005 7,030,015
Six to nine 2004 - 2002 7,421,922
Nine to 12 2001 - 1999 5,775,294
More than 12 Pre-1999 4,941,742
total 31,258,197
www.smmt.co.uk/mif2011 24
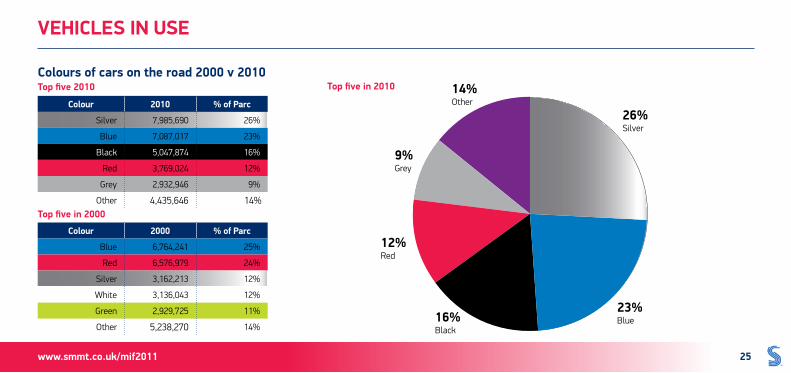
colours of cars on the road 2000 v 2010
vehicles in use
top five 2010
top five in 2000
top five in 2010
colour 2010 % of parc
Silver 7,985,690 26%
Blue 7,087,017 23%
Black 5,047,874 16%
Red 3,769,024 12%
Grey 2,932,946 9%
Other 4,435,646 14%
colour 2000 % of parc
Blue 6,764,241 25%
Red 6,576,979 24%
Silver 3,162,213 12%
White 3,136,043 12%
Green 2,929,725 11%
Other 5,238,270 14%
26% Silver
23% Blue
12% Red
16% Black
9% Grey
14% Other
www.smmt.co.uk/mif2011 25
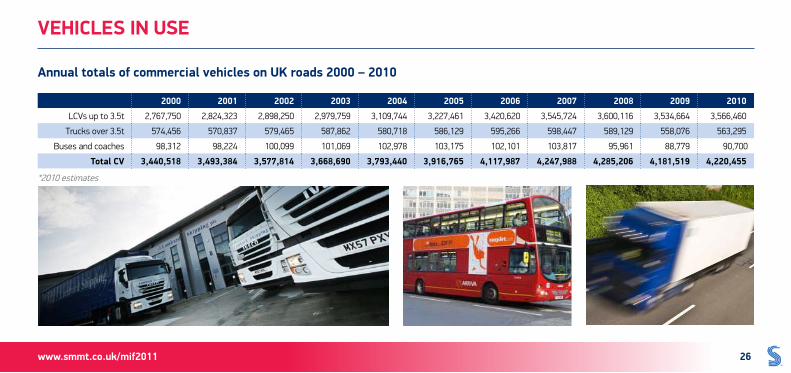
annual totals of commercial vehicles on uK roads 2000 – 2010
2000 2001 2002 2003 2004 2005 2006 2007 2008 2009 2010
LCVs up to 3.5t 2,767,750 2,824,323 2,898,250 2,979,759 3,109,744 3,227,461 3,420,620 3,545,724 3,600,116 3,534,664 3,566,460
Trucks over 3.5t 574,456 570,837 579,465 587,862 580,718 586,129 595,266 598,447 589,129 558,076 563,295
Buses and coaches 98,312 98,224 100,099 101,069 102,978 103,175 102,101 103,817 95,961 88,779 90,700
total cv 3,440,518 3,493,384 3,577,814 3,668,690 3,793,440 3,916,765 4,117,987 4,247,988 4,285,206 4,181,519 4,220,455
*2010 estimates
www.smmt.co.uk/mif2011 26
vehicles in use
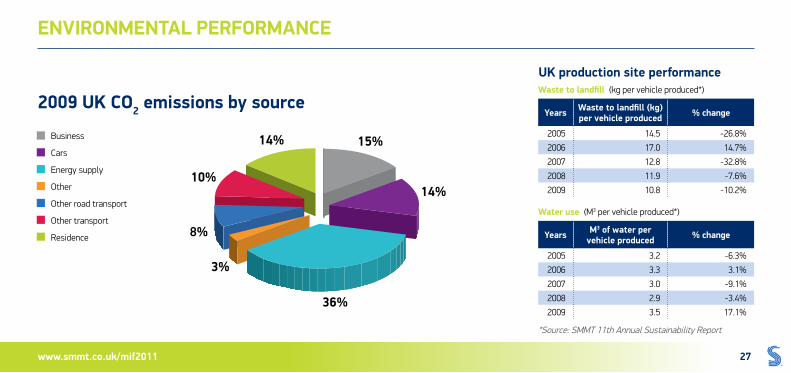
2009 uK co2 emissions by source
Business
Cars
Energy supply
Other
Other road transport
Other transport
Residence
waste to landfill (kg per vehicle produced*)
years waste to landfill (kg) per vehicle produced % change
2005 14.5 -26.8%
2006 17.0 14.7%
2007 12.8 -32.8%
2008 11.9 -7.6%
2009 10.8 -10.2%
water use (M3 per vehicle produced*)
years m3 of water per vehicle produced % change
2005 3.2 -6.3%
2006 3.3 3.1%
2007 3.0 -9.1%
2008 2.9 -3.4%
2009 3.5 17.1%
*Source: SMMT 11th Annual Sustainability Report
Business
Cars
Energy supply
Other
Other road transport
Other transport
Residence
uK production site performance
15%
14%
36%
3%
8%
10%
14%
www.smmt.co.uk/mif2011 27
environmental performance
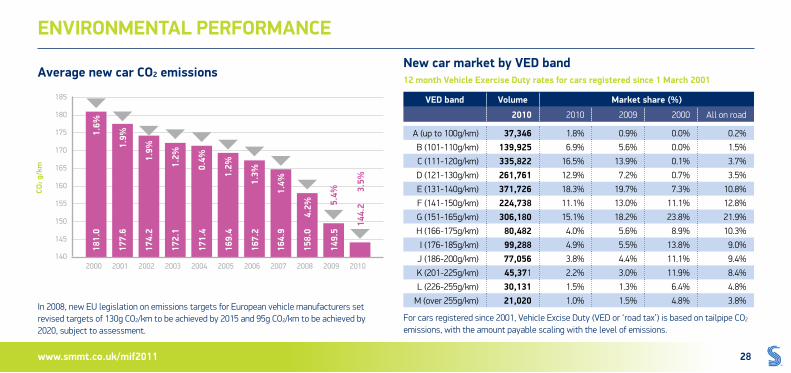
average new car co2 emissionsnew car market by ved band12 month vehicle exercise duty rates for cars registered since 1 march 2001
In 2008, new EU legislation on emissions targets for European vehicle manufacturers set revised targets of 130g CO2/km to be achieved by 2015 and 95g CO2/km to be achieved by 2020, subject to assessment.
For cars registered since 2001, Vehicle Excise Duty (VED or ‘road tax’) is based on tailpipe CO2 emissions, with the amount payable scaling with the level of emissions.
2000 140
145
150
155
160
165
170
175
180
185
co2 g
/km
2001 2002 2003 2004 2005 2006 2007 2008 2009 2010
1.6%
1.9%
1.9%
1.2%
0.4%
1.2%
1.3%
1.4%
4.2%
144.
2 3.
5%
5.4%
ved band volume market share (%)
2010 2010 2009 2000 All on road
A (up to 100g/km) 37,346 1.8% 0.9% 0.0% 0.2%
B (101-110g/km) 139,925 6.9% 5.6% 0.0% 1.5%
C (111-120g/km) 335,822 16.5% 13.9% 0.1% 3.7%
D (121-130g/km) 261,761 12.9% 7.2% 0.7% 3.5%
E (131-140g/km) 371,726 18.3% 19.7% 7.3% 10.8%
F (141-150g/km) 224,738 11.1% 13.0% 11.1% 12.8%
G (151-165g/km) 306,180 15.1% 18.2% 23.8% 21.9%
H (166-175g/km) 80,482 4.0% 5.6% 8.9% 10.3%
I (176-185g/km) 99,288 4.9% 5.5% 13.8% 9.0%
J (186-200g/km) 77,056 3.8% 4.4% 11.1% 9.4%
K (201-225g/km) 45,371 2.2% 3.0% 11.9% 8.4%
L (226-255g/km) 30,131 1.5% 1.3% 6.4% 4.8%
M (over 255g/km) 21,020 1.0% 1.5% 4.8% 3.8%
181.
0
177.
6
174.
2
172.
1
171.
4
169.
4
167.
2
164.
9
158.
0
149.
5
www.smmt.co.uk/mif2011 28
environmental performance
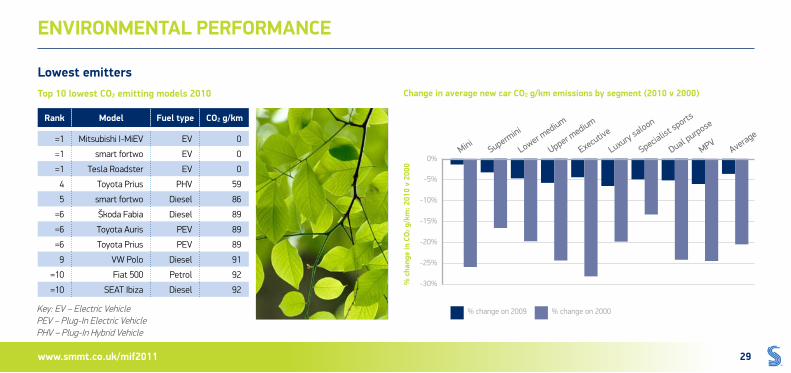
Key: EV – Electric Vehicle PEV – Plug-In Electric Vehicle PHV – Plug-In Hybrid Vehicle
change in average new car co2 g/km emissions by segment (2010 v 2000)top 10 lowest co2 emitting models 2010
lowest emitters
-5%
-10%
-15%
-20%
-25%
-30%
% change on 2009 % change on 2000
0%mini
supermini
Lower medium
upper medium
Executive
Luxury saloon
specialist sports
dual purpose
mPVaverage
% c
hang
e in
co
2 g/k
m: 2
010
v 20
00
rank model fuel type co2 g/km
=1 Mitsubishi I-MiEV EV 0
=1 smart fortwo EV 0
=1 Tesla Roadster EV 0
4 Toyota Prius PHV 59
5 smart fortwo Diesel 86
=6 Škoda Fabia Diesel 89
=6 Toyota Auris PEV 89
=6 Toyota Prius PEV 89
9 VW Polo Diesel 91
=10 Fiat 500 Petrol 92
=10 SEAT Ibiza Diesel 92
www.smmt.co.uk/mif2011 29
environmental performance
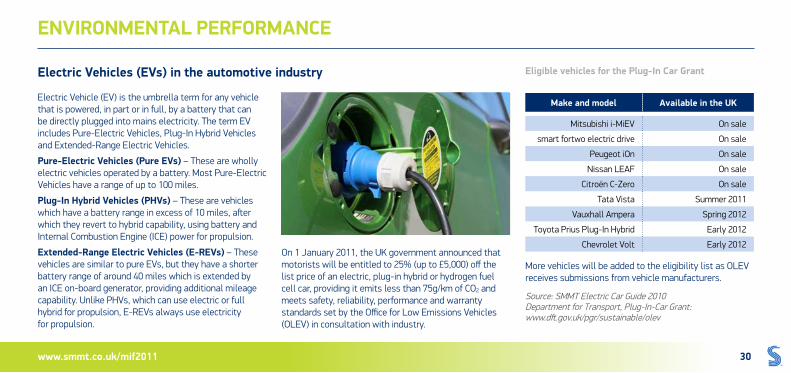
electric vehicles (evs) in the automotive industry
Electric Vehicle (EV) is the umbrella term for any vehicle that is powered, in part or in full, by a battery that can be directly plugged into mains electricity. The term EV includes Pure-Electric Vehicles, Plug-In Hybrid Vehicles and Extended-Range Electric Vehicles.
pure-electric vehicles (pure evs) – These are wholly electric vehicles operated by a battery. Most Pure-Electric Vehicles have a range of up to 100 miles.
plug-in hybrid vehicles (phvs) – These are vehicles which have a battery range in excess of 10 miles, after which they revert to hybrid capability, using battery and Internal Combustion Engine (ICE) power for propulsion.
extended-range electric vehicles (e-revs) – These vehicles are similar to pure EVs, but they have a shorter battery range of around 40 miles which is extended by an ICE on-board generator, providing additional mileage capability. Unlike PHVs, which can use electric or full hybrid for propulsion, E-REVs always use electricity for propulsion.
On 1 January 2011, the UK government announced that motorists will be entitled to 25% (up to £5,000) off the list price of an electric, plug-in hybrid or hydrogen fuel cell car, providing it emits less than 75g/km of CO2 and meets safety, reliability, performance and warranty standards set by the Office for Low Emissions Vehicles (OLEV) in consultation with industry.
More vehicles will be added to the eligibility list as OLEV receives submissions from vehicle manufacturers.
Source: SMMT Electric Car Guide 2010 Department for Transport, Plug-In-Car Grant: www.dft.gov.uk/pgr/sustainable/olev
eligible vehicles for the plug-in car grant
make and model available in the uK
Mitsubishi i-MiEV On sale
smart fortwo electric drive On sale
Peugeot iOn On sale
Nissan LEAF On sale
Citroёn C-Zero On sale
Tata Vista Summer 2011
Vauxhall Ampera Spring 2012
Toyota Prius Plug-In Hybrid Early 2012
Chevrolet Volt Early 2012
www.smmt.co.uk/mif2011 30
environmental performance
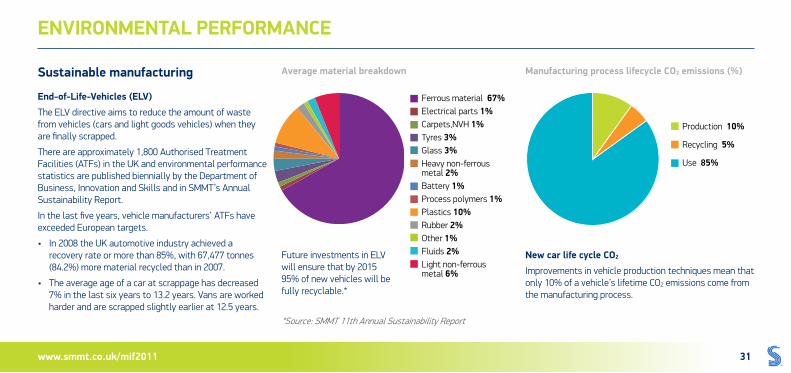
sustainable manufacturing
end-of-life-vehicles (elv) The ELV directive aims to reduce the amount of waste from vehicles (cars and light goods vehicles) when they are finally scrapped.
There are approximately 1,800 Authorised Treatment Facilities (ATFs) in the UK and environmental performance statistics are published biennially by the Department of Business, Innovation and Skills and in SMMT’s Annual Sustainability Report.
In the last five years, vehicle manufacturers’ ATFs have exceeded European targets.
• In2008theUKautomotiveindustryachievedarecovery rate or more than 85%, with 67,477 tonnes (84.2%) more material recycled than in 2007.
• Theaverageageofacaratscrappagehasdecreased7% in the last six years to 13.2 years. Vans are worked harder and are scrapped slightly earlier at 12.5 years.
Future investments in ELV will ensure that by 2015 95% of new vehicles will be fully recyclable.*
new car life cycle co2 Improvements in vehicle production techniques mean that only 10% of a vehicle’s lifetime CO2 emissions come from the manufacturing process.
average material breakdown
*Source: SMMT 11th Annual Sustainability Report
Ferrous material 67%Electrical parts 1%Carpets,NVH 1%Tyres 3%Glass 3%Heavy non-ferrous metal 2%Battery 1%Process polymers 1%Plastics 10%Rubber 2%Other 1%Fluids 2%Light non-ferrous metal 6%
manufacturing process lifecycle co2 emissions (%)
Production 10%
Recycling 5%
Use 85%
www.smmt.co.uk/mif2011 31
environmental performance
new car and van co2 legislation Industry has made significant improvements to CO2 emission levels in recent years and recognises its responsibility to deliver environmental improvements.
Constant innovation by vehicle manufacturers has seen CO2 emission levels drop dramatically and in 2010, average emissions for all new cars fell 3.5% on 2009 figures to 144.2g/km CO2, 36.8g/km or 20.3% below the level in 2000.
new car co2 regulation In 2008, legislation committing vehicle manufacturers to specific CO2 emission targets for new car registrations was passed. Subject to their individual targets, vehicle manufacturers will have to comply with new car average CO2 emission targets of 130g/km CO2 by 2015 and 95g/km CO2 by 2020.
The legislation sets out an exacting programme for car manufacturers with 65% of new cars averaging the 130g/km target by 2012, 75% by 2013, 85% by 2014 and 100% by 2015.
van co2 regulation In February 2011, the European Commission agreed an initial CO2/km emissions target for vans and LCVs.
From 2017, vans and LCVs will be required to meet an emissions target of 175g/km CO2 (phased in annual compliance levels of 70%, 75% and 80% respectively between 2014-2016), with all manufacturers reaching the 100% target emissions levels from 2017 onwards.
Manufacturers who fail to reach the targets will be fined €95 per additional gram of CO2 emitted, for every car registered across Europe.
For more detail on how the automotive industry is reducing its environmental impact, visit www.smmt.co.uk.
www.smmt.co.uk/mif2011 32
legislation in the automotive industry
the automotive council The Automotive Council was established in 2009, as a partnership between industry and government, to consider the strategic development of the UK automotive industry.
The remit of the Automotive Council is to position the UK as a compelling investment proposition, transforming the business environment in the UK and enabling it to secure funding for the research and development of new technology, collaborative research and testing facilities.
Its role is to promote investment for upgrades to existing research and manufacturing facilities in the UK by co-ordinating nation-wide activity and supporting key initiatives in the UK’s automotive industry, including:
• TheTechnologyGroup–strategicsupportforautomotiveresearchand development, through the New Automotive Innovation and Growth Team’s technology roadmap.
• TheSupplyChainGroup–feedingintotheAutomotiveCouncilandfocused on the development of a strong automotive supply base in the UK.
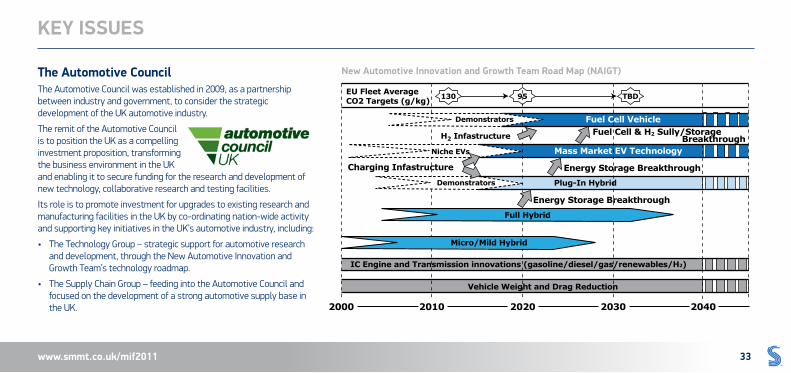
new automotive innovation and growth team road map (naigt)
EU Fleet AverageCO2 Targets (g/kg)
2000 2010 2020 2030 2040
Demonstrators
130 95 TBD
Fuel Cell Vehicle
Energy Storage Breakthrough
Fuel Cell & H2 Sully/Storage Breakthrough
Energy Storage Breakthrough
Mass Market EV Technology
H2 Infastructure
Demonstrators
Niche EVs
Charging Infastructure
IC Engine and Transmission innovations (gasoline/diesel/gas/renewables/H2)
Vehicle Weight and Drag Reduction
Full Hybrid
Plug-In Hybrid
Micro/Mild Hybrid
www.smmt.co.uk/mif2011 33
Key issues
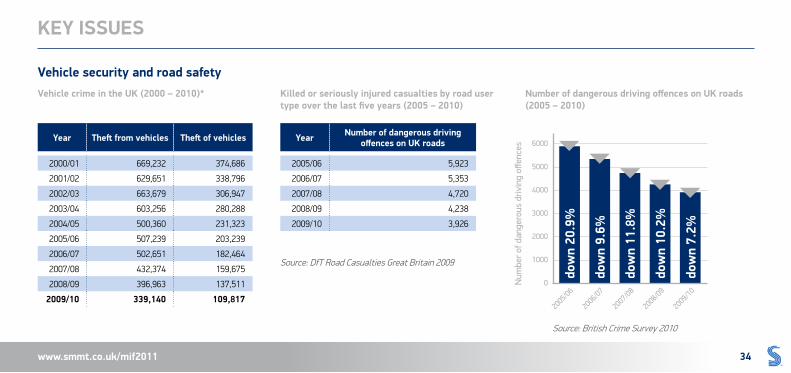
vehicle security and road safetyvehicle crime in the uK (2000 – 2010)* Killed or seriously injured casualties by road user
type over the last five years (2005 – 2010) number of dangerous driving offences on uK roads (2005 – 2010)
Source: DfT Road Casualties Great Britain 2009
Source: British Crime Survey 2010
year theft from vehicles theft of vehicles
2000/01 669,232 374,686
2001/02 629,651 338,796
2002/03 663,679 306,947
2003/04 603,256 280,288
2004/05 500,360 231,323
2005/06 507,239 203,239
2006/07 502,651 182,464
2007/08 432,374 159,675
2008/09 396,963 137,511
2009/10 339,140 109,817
year number of dangerous driving offences on uK roads
2005/06 5,923
2006/07 5,353
2007/08 4,720
2008/09 4,238
2009/10 3,926
2005
/06
2006
/07
2007
/08
2008
/09
2009
/100
1000
2000
3000
4000
5000
6000
dow
n 20
.9%
dow
n 9.
6%
dow
n 11
.8%
dow
n 10
.2%
dow
n 7.
2%
num
ber o
f dan
gero
us d
rivin
g off
ence
s
www.smmt.co.uk/mif2011 34
Key issues
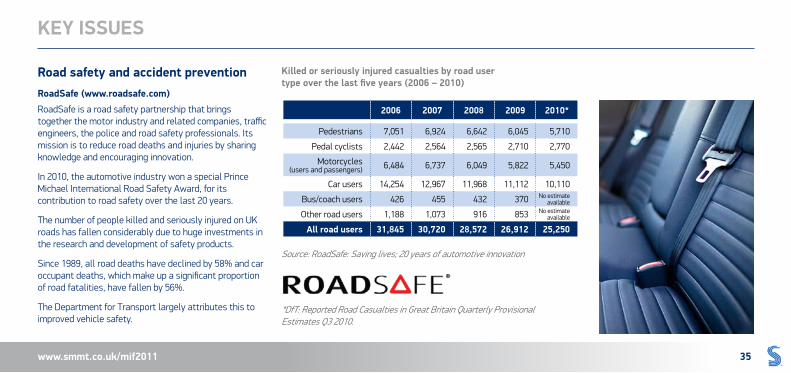
roadsafe (www.roadsafe.com)RoadSafe is a road safety partnership that brings together the motor industry and related companies, traffic engineers, the police and road safety professionals. Its mission is to reduce road deaths and injuries by sharing knowledge and encouraging innovation.
In 2010, the automotive industry won a special Prince Michael International Road Safety Award, for its contribution to road safety over the last 20 years.
The number of people killed and seriously injured on UK roads has fallen considerably due to huge investments in the research and development of safety products.
Since 1989, all road deaths have declined by 58% and car occupant deaths, which make up a significant proportion of road fatalities, have fallen by 56%.
The Department for Transport largely attributes this to improved vehicle safety.
road safety and accident prevention
Source: RoadSafe: Saving lives; 20 years of automotive innovation
*DfT: Reported Road Casualties in Great Britain Quarterly Provisional Estimates Q3 2010.
Killed or seriously injured casualties by road user type over the last five years (2006 – 2010)
2006 2007 2008 2009 2010*
Pedestrians 7,051 6,924 6,642 6,045 5,710
Pedal cyclists 2,442 2,564 2,565 2,710 2,770
Motorcycles (users and passengers) 6,484 6,737 6,049 5,822 5,450
Car users 14,254 12,967 11,968 11,112 10,110
Bus/coach users 426 455 432 370 No estimate available
Other road users 1,188 1,073 916 853 No estimate available
all road users 31,845 30,720 28,572 26,912 25,250
www.smmt.co.uk/mif2011 35
Key issues
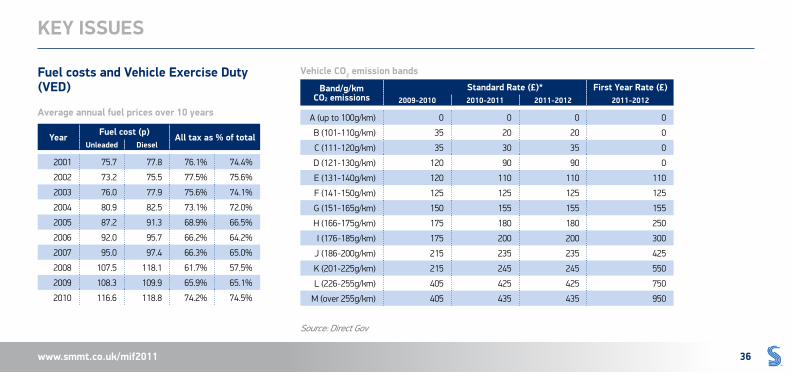
fuel costs and vehicle exercise duty (ved)
Source: Direct Gov
average annual fuel prices over 10 years
vehicle co2 emission bands
year fuel cost (p) all tax as % of totalunleaded diesel
2001 75.7 77.8 76.1% 74.4%
2002 73.2 75.5 77.5% 75.6%
2003 76.0 77.9 75.6% 74.1%
2004 80.9 82.5 73.1% 72.0%
2005 87.2 91.3 68.9% 66.5%
2006 92.0 95.7 66.2% 64.2%
2007 95.0 97.4 66.3% 65.0%
2008 107.5 118.1 61.7% 57.5%
2009 108.3 109.9 65.9% 65.1%
2010 116.6 118.8 74.2% 74.5%
band/g/km co2 emissions
standard rate (£)* first year rate (£)2009-2010 2010-2011 2011-2012 2011-2012
A (up to 100g/km) 0 0 0 0
B (101-110g/km) 35 20 20 0
C (111-120g/km) 35 30 35 0
D (121-130g/km) 120 90 90 0
E (131-140g/km) 120 110 110 110
F (141-150g/km) 125 125 125 125
G (151-165g/km) 150 155 155 155
H (166-175g/km) 175 180 180 250
I (176-185g/km) 175 200 200 300
J (186-200g/km) 215 235 235 425
K (201-225g/km) 215 245 245 550
L (226-255g/km) 405 425 425 750
M (over 255g/km) 405 435 435 950
www.smmt.co.uk/mif2011 36
Key issues
skills• TheUKisakeyplayerintheglobalautomotiveindustry
and a strong skills base will enable it to remain competitive within a global market.
• Automotivecompaniescontinuetoinvestheavilyintraining programmes to increase skills at all levels.
• SMMTisengagedwithskillsproviders,fundingagenciesand government to ensure training and skills provision is accessible, properly funded, and suitably targeted.
• Theskillsagendashouldbelinkedtothefuturetechnology agenda, identifying trends to appropriate skill sets.
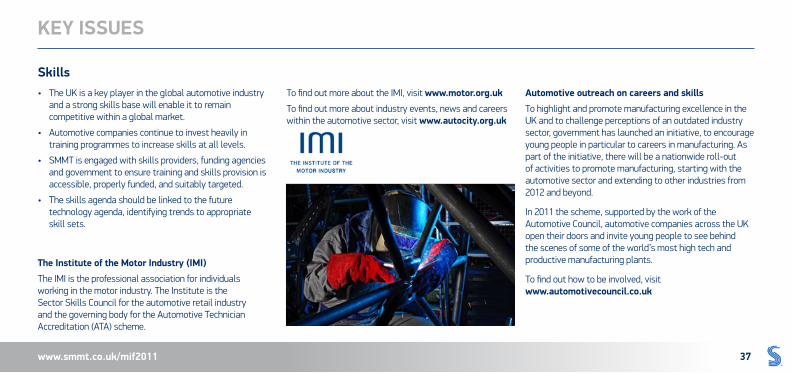
the institute of the motor industry (imi)The IMI is the professional association for individuals working in the motor industry. The Institute is the Sector Skills Council for the automotive retail industry and the governing body for the Automotive Technician Accreditation (ATA) scheme.
To find out more about the IMI, visit www.motor.org.ukTo find out more about industry events, news and careers within the automotive sector, visit www.autocity.org.uk
automotive outreach on careers and skills To highlight and promote manufacturing excellence in the UK and to challenge perceptions of an outdated industry sector, government has launched an initiative, to encourage young people in particular to careers in manufacturing. As part of the initiative, there will be a nationwide roll-out of activities to promote manufacturing, starting with the automotive sector and extending to other industries from 2012 and beyond.
In 2011 the scheme, supported by the work of the Automotive Council, automotive companies across the UK open their doors and invite young people to see behind the scenes of some of the world’s most high tech and productive manufacturing plants.
To find out how to be involved, visit www.automotivecouncil.co.uk
www.smmt.co.uk/mif2011 37
Key issues
market segmentationglossary of termssmmt segmentationA Mini eg Hyundai i10B Supermini eg Ford FiestaC Lower Medium eg Vauxhall AstraD Upper Medium eg BMW 3 SeriesE Executive eg Mercedes E-ClassF Luxury Saloon eg Jaguar XJG Specialist Sports eg Volkswagen SciroccoH Dual Purpose (4x4/SUV) eg Land Rover FreelanderI Multi-Purpose Vehicle eg Vauxhall Zafira
segment a – mini• Normallylessthan1.0cc• Bodystyle‘miniature’• Normallytwo-door• Lengthnormallynotexceeding3050mm(10ft)
segment b – supermini• Normallybetween1.0–1.4cc• Bodystylebiggerthanmini• Lengthnormallynotexceeding3745mm(12.5ft)• Performancegreaterthanmini• Morevarietyoftrimsperrange
segment c – lower medium• Normallybetween1.3–2.0cc• Lengthunder4230mm(14ft)
segment d – upper medium• Normallybetween1.6–2.8cc• Lengthnormallyunder4470mm(14.9ft)
segment e – executive• Normallybetween2.0–3.5cc• Bodystylegenerallybiggerthanuppermedium• Normallyfour-door• Lengthnormallyunder4800mm(16ft)• Moreluxuriouslyappointed
segment f – luxury saloon• Normallyupwardfrom3.5cc• Mostluxuriousavailable
segment g – specialist sports• Sportscoupé• Sportssaloons• Traditionalsports
segment h – dual purpose (4x4/suv)• 4x4offroad
segment i – multi-purpose vehicle (mpv)• 4x2or4x4estateswithaseatingcapacityofupto
eight people
www.smmt.co.uk/mif2011 38
smmt information
segment definition fleet If the vehicle is being sold to/registered for a company that operates a fleet of 25 or more vehicles, it should be designated a fleet sale. This includes dealer demonstrators and motability-leased vehicles.
business If the vehicle is being sold to/registered for a company that operates up to 24 vehicles, it should be designated a business sale. This includes dealer demonstrators.
private If the vehicle is being sold primarily for the personal use of a private individual, it should be designated a private sale.
www.smmt.co.uk/mif2011 39
smmt information
motor codes
Motor Codes Ltd was established by the motor industry to act as the self-regulatory body for the automotive sector and is a wholly-owned subsidiary of the Society of Motor Manufacturers and Traders.
Motor Codes is responsible for operating three automotive codes:
• TheMotorIndustryCodeofPracticeforNewCars.
• TheMotorIndustryCodeofPracticeforServiceandRepair.
• TheMotorIndustryCodeofPracticeforVehicleWarranty Products.
industry forum
The Industry Forum programme delivers ‘learning by doing’ training, teaching companies practical skills to help reduce waste, improve productivity and lower costs throughout the supply chain www.industryforum.co.uk.
smmt companies Key features for motorists:
• Freeadviceline:0800 692 0825.
• Freeconciliationandlowcost,legallybindingarbitration.
• Garagesearchfacility.
• Garagesurvey.
• FreeMOTandservicereminder.
• Individualgarageprofilesandcustomerratings.
For more information, visit www.motorcodes.co.uk
www.smmt.co.uk/mif2011 40
smmt information
smmt publications and useful links Act on CO2 http://actonco2.direct.gov.uk/home.html
Association des Constructeurs Européens d’Automobiles (ACEA) www.acea.be/
Automotive Council www.automotivecouncil.co.uk/
British Vehicle Rental and Leasing Association (BVRLA)www.bvrla.co.uk/
Council of the European Union http://europa.eu/institutions/inst/council/ index_en.htm
Department for Business, Innovation and Skills (BIS) www.bis.gov.uk/
Driver and Vehicle Licensing Agency (DVLA) www.dft.gov.uk/dvla/
European Commission http://ec.europa.eu/index_en.htm
European Parliament www.europarl.europa.eu/news/public/ default_en.htm
Freight Transport Association (FTA) www.fta.co.uk/
Institute of Advanced Motorists (IAM) www.iam.org.uk/
Motor Codes www.motorcodes.co.uk/
Road Haulage Association www.rha.uk.net/
RoadSafe www.roadsafe.com/
smmt publications New car CO2 Report 2011 www.smmt.co.uk/shop/new-car-co2-report-mar-2011/
Electric Car Guide 2010 www.smmt.co.uk/shop/electric-car-guide-2010/
11th Annual Sustainability Report www.smmt.co.uk/shop/eleventh-sustainability-report/
www.smmt.co.uk/mif2011 41
smmt information
THE SOCIETY OF MOTOR
MANUFACTURERS AND TRADERS
NEW CAR CO 2 REPORT 2011
THE SOCIETY OF MOTOR MANUFACTURERS AND TRADERS11th ANNUAL SUSTAINABILITY REPORT
THE SOCIETY OF MOTOR MANUFACTURERS AND TRADERS
ELECTRIC CAR GUIDE 2010
The Society of Motor Manufacturers and Traders (SMMT) is one of the largest and most influential trade associations in the UK. It supports the interests of the UK automotive industry at home and abroad, promoting a united position to government, stakeholders and the media.
As a membership organisation, SMMT represents a significant number of companies in the UK, providing them with a principal forum to voice their views on issues affecting the automotive sector, helping to guide strategies and build positive relationships with government and regulatory authorities.
To find out how to join SMMT and for more information, visit www.smmt.co.uk/memberservices or e-mail [email protected].
Produced for SMMT by AdStorm Marketing & Advertising www.adstorm.co.uk2011
about smmt
www.smmt.co.uk/mif2011 42
smmt information

smmt information
This publication contains general information and, although SMMT endeavours to ensure that the content is accurate and up-to-date at the date of publication, no representation or warranty, express or implied, is made as to its accuracy or completeness and therefore the information in this publication should not be relied upon. Readers should always seek appropriate advice from a suitably qualified expert before taking, or refraining from taking, any action. The contents of this publication should not be construed as advice or guidance and SMMT disclaims liability for any loss, howsoever caused, arising directly or indirectly from reliance on the information in this publication.
www.smmt.co.uk/mif2011
thE sociEty of motor manufacturErs and tradErs LimitEdTel: +44 (0)20 7235 7000 Fax: +44 (0)20 7235 7112
e-mail: [email protected] www.smmt.co.uk/mif2011