The social wellbeing of rural Australians · marginally better than for urban people. Rural people...
37
127 It’s about people: Changing Perspectives on Dryness The social wellbeing of rural Australians: An analysis of the Household, Income and Labour Dynamics in Australia (HILDA) longitudinal dataset Report prepared for the Drought Review Branch, Australian Government Department of Agriculture, Fisheries and Forestry Anthony Hogan, Cain Polidano, Jacqui Russell and Patrick Stakelum September 2008 This paper uses unit record data from the Household, Income and Labour Dynamics in Australia (HILDA) Survey. The HILDA Project was initiated and is funded by the Australian Government Department of Families, Housing, Community Services and Indigenous Affairs (FaHCSIA) and is managed by the Melbourne Institute of Applied Economic and Social Research (MIAESR). The findings and views reported in this paper, however, are those of the authors and should not be attributed to either FaHCSIA or the MIAESR. © Commonwealth of Australia 2008 This work is copyright. Apart from any use as permitted under the Copyright Act 1968, no part may be reproduced by any process without prior written permission from the Commonwealth. Requests and inquiries concerning reproduction and rights should be addressed to the Commonwealth Copyright Administration, Attorney General’s Department, Robert Garran Offices, National Circuit, Barton ACT 2600 or posted at http://www.ag.gov.au/cca. The Australian Government acting through the Bureau of Rural Sciences (BRS) has exercised due care and skill in the preparation and compilation of the information and data set out in this publication. Notwithstanding, the Bureau of Rural Sciences, its employees and advisers disclaim all liability, including liability for negligence, for any loss, damage, injury, expense or cost incurred by any person as a result of accessing, using or relying upon any of the information or data set out in this publication to the maximum extent permitted by law. Postal address: Bureau of Rural Sciences GPO Box 858 Canberra, ACT 2601 Appendix 10
Transcript of The social wellbeing of rural Australians · marginally better than for urban people. Rural people...
127 It’s about people: Changing Perspectives on Dryness
The social wellbeing of rural
Australians:
An analysis of the Household, Income and Labour
Dynamics in Australia (HILDA) longitudinal dataset
Report prepared for the Drought Review Branch, Australian Government Department
of Agriculture, Fisheries and Forestry
Anthony Hogan, Cain Polidano, Jacqui Russell and Patrick Stakelum
September 2008
This paper uses unit record data from the Household, Income and Labour Dynamics in Australia (HILDA) Sur vey. The HILDA Project was initiated and is funded by the Australian Government Department of Families, Housing, Community Ser vices and Indigenous Affairs (FaHCSIA) and is managed by the Melbourne Institute of Applied Economic and Social Research (MIAESR). The findings and views reported in this paper, however, are those of the authors and should not be attributed to either FaHCSIA or the MIAESR.
© Commonwealth of Australia 2008
This work is copyright. Apart from any use as permitted under the Copyright Act 1968, no part may be reproduced by any process without prior written permission from the Commonwealth. Requests and inquiries concerning reproduction and rights should be addressed to the Commonwealth Copyright Administration, Attorney General’s Department, Robert Garran Offices, National Circuit, Barton ACT 2600 or posted at http://www.ag.gov.au/cca.
The Australian Government acting through the Bureau of Rural Sciences (BRS) has exercised due care and skill in the preparation and compilation of the information and data set out in this publication. Notwithstanding, the Bureau of Rural Sciences, its employees and advisers disclaim all liability, including liability for negligence, for any loss, damage, injur y, expense or cost incurred by any person as a result of accessing, using or relying upon any of the information or data set out in this publication to the maximum extent permitted by law.
Postal address:Bureau of Rural SciencesGPO Box 858Canberra, ACT 2601
Appendix 10
It’s about people: Changing Perspectives on Dryness 128
Key findings
Background
This report is one of three prepared by the Social Sciences Program, Bureau of Rural Sciences, to support investigations of the social impacts of drought as part of the National Review of Drought Policy. It reports on the social wellbeing of rural Australians using the Household, Income and Labour Dynamics in Australia (HILDA) dataset.
The HILDA dataset
The HILDA Sur vey is a national study that asks a wide range of questions covering matters such as financial and emotional wellbeing, health-related quality of life and social connectedness. In this study, rural people are those living in rural areas and small towns with fewer than 1000 people.
Rural people report being more satisfied with some aspects of their lives
HILDA data show that rural people express greater satisfaction across a variety of measures (satisfaction with relationships and financial situation) compared with urban people. Levels of connectedness are similar between communities.
Rural people are less satisfied with access to services than people in urban areas
Rural people are significantly less satisfied with access to ser vices than urban people. This difference between urban and rural people is the most marked of the indicators.
Rural people report poorer physical health Rural peoples’ summar y quality of life scores show higher levels of physical pain and reduced body functioning. Mental health scores for rural people are marginally better than for urban people.
Rural people face higher transport costs
Motor vehicle and fuel costs are higher for rural people. Urban people score at both extremes (low and high) of the index of social disadvantage.
Rural people are happier at work but their workplace stress is increasing
Rural people are more likely to report higher levels of control over their daily work than urban people. However, over the period of the study, rural people moved from being less stressed than urban people to being equally stressed by their work.
Limitations of this analysis
People living in remote areas, and Aboriginal and Torres Strait Islander people in particular, are under-represented in HILDA data. Wave 6 of the data (collected in 2006) was not available at the time of this analysis. Comparative analysis of wealth and social capital would be possible with use of Wave 6 data.
Appendix 10
129 It’s about people: Changing Perspectives on Dryness
List of acronyms
ABARE Australian Bureau of Agricultural and Resource Economics
ABS Australian Bureau of Statistics
ANZSIC Australian and New Zealand Standard Industrial Classification
BRS Bureau of Rural Sciences
DAFF Australian Government Department of Agriculture, Fisheries and Forestr y
EC Exceptional Circumstances: EC events are rare and severe events that are outside those that a farmer could normally be expected to manage using responsible farm management strategies. To be classified as an EC event, the event:
• must be rare, that is it must not have occurred more than once on average in every 20 to 25 years
• must result in a rare and severe downturn in farm income over a prolonged period of time (e.g. greater than 12 months)
• must be a discrete event that is not part of long-term structural adjustment processes or normal fluctuations in commodity prices
MP Member of Parliament
SSP Social Sciences Program, Bureau of Rural Sciences
Appendix 10
It’s about people: Changing Perspectives on Dryness 130
Contents
Key findings 128
List of acronyms 129
Background 132
Methods 133
Findings 134
Satisfaction with life 134
Connectedness 134
Access to services 135
Health status 135
Disadvantage in rural communities 136
Financial issues 137
Workplace issues 138
References 140
Appendix A: Scale development and analysis 141
Figures
1 Comparison of satisfaction with life for rural and urban
populations, 2005 134
2 Comparison of social and economic disadvantage (SEIFA scores),
2005 136
3 Ratio of income to living expenses, 2005 137
4 Annual household motor vehicle fuel costs, 2005 138
5 Annual household motor vehicle maintenance costs, 2005 138
6 Financial stressors, 2001 to 2005 139
7 Job latitude, 2005 139
Appendix 10
131 It’s about people: Changing Perspectives on Dryness
Tables
1 Indicators of social connectedness (per cent agreeing), 2005 135
2 Adequacy of access to services (per cent), 2002 135
3 Health-related measures of quality of life (SF 36) (per cent), 2005 136
4 Workplace stressors (per cent), 2005 139
Appendix 10
It’s about people: Changing Perspectives on Dryness 132
Background
In June 2008, the Social Sciences Program (SSP) of the Bureau of Rural Sciences (BRS) was asked by the Drought Review Branch of the Department of Agriculture, Fisheries and Forestr y (DAFF) to examine the social impacts of drought on farm families and rural communities as part of its National Review of Drought Policy (The Hon. Tony Burke MP 2008a).This review follows on from the Primar y Industries Ministerial Forum in Cairns earlier in 2008, where Ministers agreed that current approaches to drought and Exceptional Circumstances (EC) might no longer be the most appropriate in the context of a changing climate (PIMC 2008, The Hon. Tony Burke MP 2008b). Ministers saw that drought policy needed to be improved to create an environment of self-reliance and preparedness, and to encourage the adoption of appropriate climate change management practices.
As part of the review process the Minister for Agriculture, Fisheries and Forestr y appointed a seven member Expert Social Panel (2008) to:
• assess the social impact of drought on farm families and rural communities
• identify gaps and areas for improvement in Australian, state and territory government social support services that are designed to mitigate the impact of drought on farm families and rural communities.
To support the work of the Expert Social Panel, the SSP was asked by the Drought Review Branch to:
• provide an analysis of the social circumstances of rural people and communities (compared with urban communities) based on previously unanalysed dimensions from the Household Income and Labour Dynamics in Australia (HILDA) survey
• provide an analysis of the social circumstances, perceptions, and behaviour of farmers (including issues of concern, risk management, perceptions of drought, management of challenges) from the June 2008 SSP climate change and industry adaptation survey of farmers (Hogan et al. 2008a)
• provide an analysis of the Quality of Life survey of farmers and farm workers in drought areas (compared with the total Australian community) using the recognised Deakin Wellbeing Index (based on a national Newspoll survey conducted in mid July 2008) (Hogan et al. 2008b).
This report responds to the first of these requests in relation to the social wellbeing of rural Australians using the HILDA dataset.
Appendix 10
133 It’s about people: Changing Perspectives on Dryness
Methods
The HILDA sur vey is a longitudinal household-based study that began in 2001. The same respondents in each household are sur veyed each year, regardless of whether they have moved to another residence. The sur vey is funded by the Commonwealth Department of Families, Housing, Community Ser vices and Indigenous Affairs (FaHCSIA). HILDA has the following features:
1 it collects information about economic and subjective wellbeing, as well as labour market and family dynamics
2 the study has funds for twelve annual surveys, or ‘waves’
3 special thematic modules are included in each wave
4 Wave 1, conducted in 2001, consisted of 7682 households and 19 914 individuals. Interviews are conducted annually with all adult members of each household.
The HILDA sur vey asks respondents a wide range of questions covering matters such as financial and emotional wellbeing, health-related quality of life and social connectedness.
The analysis in this paper is concerned with a comparison of social and economic wellbeing between urban and rural Australians. Within the HILDA dataset, individuals can be defined as being of urban or rural domicile, using one of several variables. For the purposes of this study, the Section of State (HHSOS) was the derived spatial variable that was used to assign respondents to a group as either Urban or Rural. The HHSOS classification is a standard geographic classification used by the Australian Bureau of Statistics and is employed in the HILDA studies.1 Within HHSOS, respondents can be coded as major urban, other urban, bounded locality or rural balance.
In this report, a new variable was created that consisted of ‘urban’ (major and other urban) and ‘rural’ (bounded locality and rural balance, which includes people living in small towns, villages and rural areas with fewer than 1000 people). These two groupings constituted 84 per cent and 16 per cent of the sample respectively. In 2006, ‘rural’ comprised 12 per cent of the total Australian population (2.3 million people) (BRS 2008).
The sample size in the designated rural areas enables comparisons to be made between the social circumstances of people living in rural areas and those living in urban areas. However, it should be noted that the people living in rural areas (in places with fewer than 1000 people) include a range of different occupations, including working on farms, working in small towns, and people of retirement age.
The data from five annual sur veys or waves (2001 to 2005) were available for this analysis. Not all questions were asked in all waves. For example, questions on access to ser vices were only asked in Wave 2. Although not available at the time of the analysis, the inclusion of Wave 6 data would enable a comparison of respondents’ changes in wealth between 2002 and 2006. In addition, Wave 6 data contain more in-depth information on social capital.
The aim of this analysis is to provide information to the Expert Social Panel (the Panel) on the wellbeing of rural Australians. Sets of items within the HILDA sur veys likely to be of interest to the Panel were identified.
Appendix 10
It’s about people: Changing Perspectives on Dryness 134
Thematically these are:
1 Satisfaction with life
2 Connectedness
3 Access to services
4 Health status
5 Disadvantage in rural communities
6 Financial issues
7 Workplace issues.
Since many of these sections of HILDA contained a number of sur vey questions, scaled variables were derived from the data for life satisfaction, financial stress, disposable income and workplace stress. Details on how these scales were derived can be found in Appendix A. The following sections in this report compare the various social circumstances of people living in rural areas with those of people living in urban communities. Statistically significant differences are reported for differences between urban and rural populations where differences were less than 0.05 .
Findings
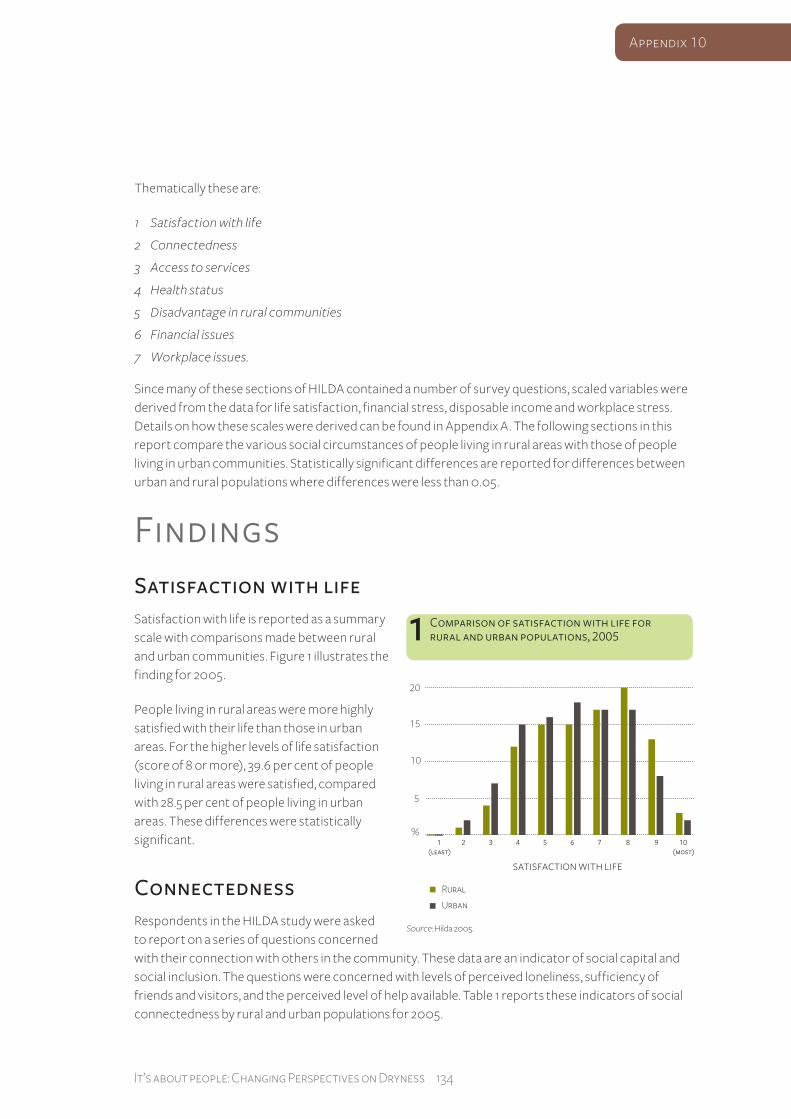
Satisfaction with life
Satisfaction with life is reported as a summar y scale with comparisons made between rural and urban communities. Figure 1 illustrates the finding for 2005 .
People living in rural areas were more highly satisfied with their life than those in urban areas. For the higher levels of life satisfaction (score of 8 or more), 39.6 per cent of people living in rural areas were satisfied, compared with 28.5 per cent of people living in urban areas. These differences were statistically significant.
Connectedness
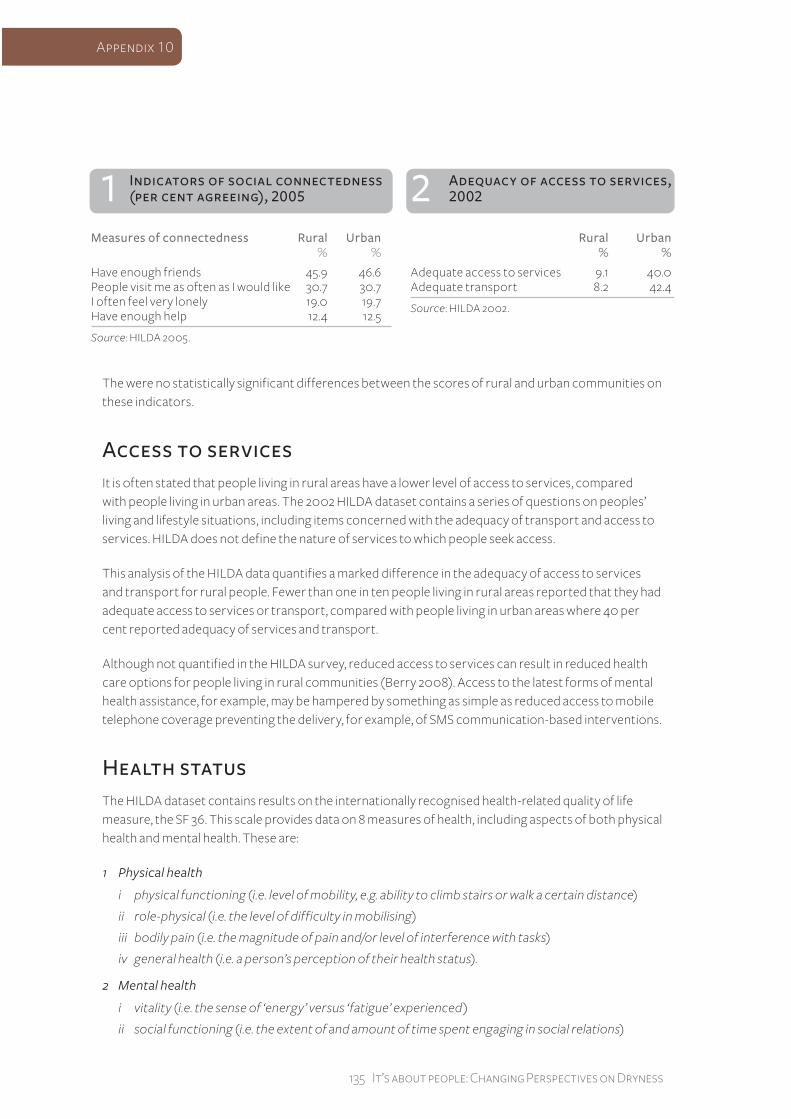
Respondents in the HILDA study were asked to report on a series of questions concerned with their connection with others in the community. These data are an indicator of social capital and social inclusion. The questions were concerned with levels of perceived loneliness, sufficiency of friends and visitors, and the perceived level of help available. Table 1 reports these indicators of social connectedness by rural and urban populations for 2005 .
Appendix 10
135 It’s about people: Changing Perspectives on Dryness
The were no statistically significant differences between the scores of rural and urban communities on these indicators.
Access to services
It is often stated that people living in rural areas have a lower level of access to ser vices, compared with people living in urban areas. The 2002 HILDA dataset contains a series of questions on peoples’ living and lifestyle situations, including items concerned with the adequacy of transport and access to ser vices. HILDA does not define the nature of ser vices to which people seek access.
This analysis of the HILDA data quantifies a marked difference in the adequacy of access to ser vices and transport for rural people. Fewer than one in ten people living in rural areas reported that they had adequate access to ser vices or transport, compared with people living in urban areas where 40 per cent reported adequacy of ser vices and transport.
Although not quantified in the HILDA sur vey, reduced access to ser vices can result in reduced health care options for people living in rural communities (Berr y 2008). Access to the latest forms of mental health assistance, for example, may be hampered by something as simple as reduced access to mobile telephone coverage preventing the deliver y, for example, of SMS communication-based inter ventions.
Health status
The HILDA dataset contains results on the internationally recognised health-related quality of life measure, the SF 36. This scale provides data on 8 measures of health, including aspects of both physical health and mental health. These are:
1 Physical health
i physical functioning (i.e. level of mobility, e.g. ability to climb stairs or walk a certain distance)
ii role-physical (i.e. the level of difficulty in mobilising)
iii bodily pain (i.e. the magnitude of pain and/or level of interference with tasks)
iv general health (i.e. a person’s perception of their health status).
2 Mental health
i vitality (i.e. the sense of ‘energy’ versus ‘fatigue’ experienced )
ii social functioning (i.e. the extent of and amount of time spent engaging in social relations)
Appendix 10
2 Adequacy of access to services,
2002
Rural Urban % %
Adequate access to services 9.1 40.0Adequate transport 8.2 42.4
Source: HILDA 2002.
1 Indicators of social connectedness
(per cent agreeing), 2005
Measures of connectedness Rural Urban % %
Have enough friends 45.9 46.6People visit me as often as I would like 30.7 30.7I often feel very lonely 19.0 19.7Have enough help 12.4 12.5
Source: HILDA 2005 .
It’s about people: Changing Perspectives on Dryness 136
iii role-emotional (i.e. perceptions of ability to accomplish tasks or degree of care taken in accomplishing tasks)
iv mental health (i.e. a person’s sense of their mental health, e.g. ‘down in the dumps’ or ‘happy’ ).
The raw scores on the SF 36 are transformed to a 0 – 100 scale where the higher score reflects better health.
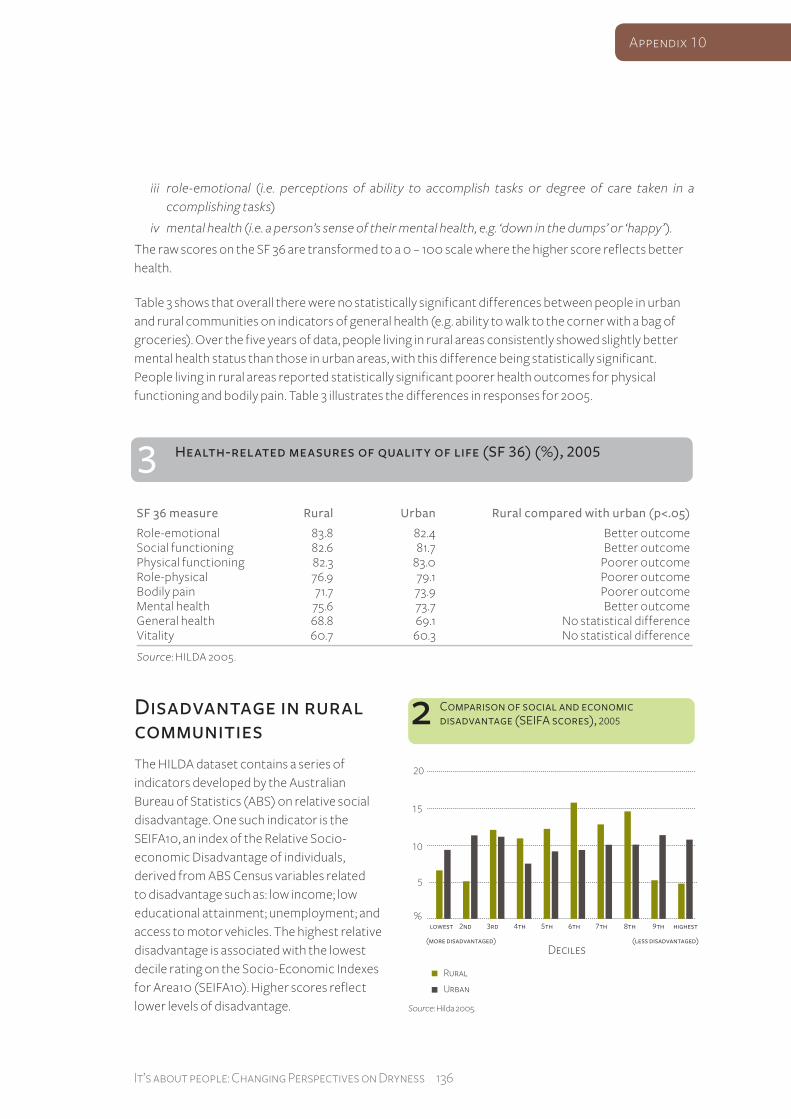
Table 3 shows that overall there were no statistically significant differences between people in urban and rural communities on indicators of general health (e.g. ability to walk to the corner with a bag of groceries). Over the five years of data, people living in rural areas consistently showed slightly better mental health status than those in urban areas, with this difference being statistically significant. People living in rural areas reported statistically significant poorer health outcomes for physical functioning and bodily pain. Table 3 illustrates the differences in responses for 2005 .
Disadvantage in rural
communities
The HILDA dataset contains a series of indicators developed by the Australian Bureau of Statistics (ABS) on relative social disadvantage. One such indicator is the SEIFA10, an index of the Relative Socio-economic Disadvantage of individuals, derived from ABS Census variables related to disadvantage such as: low income; low educational attainment; unemployment; and access to motor vehicles. The highest relative disadvantage is associated with the lowest decile rating on the Socio-Economic Indexes for Area10 (SEIFA10). Higher scores reflect lower levels of disadvantage.
3 Health-related measures of quality of life (SF 36) (%), 2005
SF 36 measure Rural Urban Rural compared with urban (p<.05)
Role-emotional 83.8 82.4 Better outcomeSocial functioning 82.6 81.7 Better outcomePhysical functioning 82.3 83.0 Poorer outcomeRole-physical 76.9 79.1 Poorer outcomeBodily pain 71.7 73.9 Poorer outcomeMental health 75.6 73.7 Better outcomeGeneral health 68.8 69.1 No statistical differenceVitality 60.7 60.3 No statistical difference
Source: HILDA 2005 .
Appendix 10
137 It’s about people: Changing Perspectives on Dryness
Figure 2 illustrates the differences in the levels of disadvantage calculated using the SEIFA10 index for 2005 .
Figure 2 shows that people living in rural areas are proportionately more highly represented from the third to the eighth deciles of the SEIFA scores. They are less likely than urban people to rank amongst the most disadvantaged or least disadvantaged people. These differences were persistent over time.
Financial issues
Expenditure patterns in households The HILDA dataset contains information on annual household income and expenditure. From these data a ratio was derived (see Appendix A) of the level of expenditure relative to available income. It is an indicator of the relative cost of living. Expenditures included in the ratio are:
1 Groceries
2 Alcohol
3 Cigarettes
4 Public transport and taxis
5 Meals eaten out, hobbies
6 Sports, gambling, and entertainment
7 Motor vehicle fuel
8 Clothing and footwear
9 Telephone rent and calls (excluding internet charges)
10 Holidays and holiday travel
11 Private health and accident insurance
12 Health Care
13 Home repairs/renovations/maintenance
14 Motor vehicle repairs/maintenance
15 Education fees
16 Electricity bills, gas bills and other heating fuel.
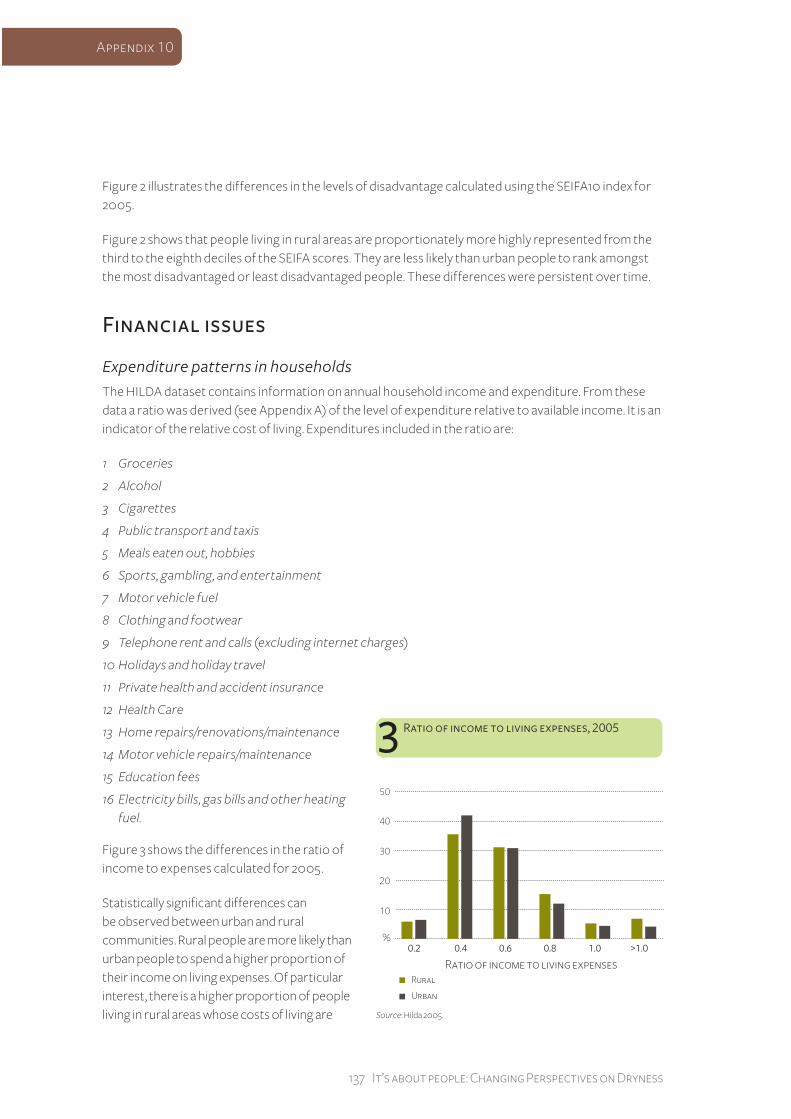
Figure 3 shows the differences in the ratio of income to expenses calculated for 2005 .
Statistically significant differences can be observed between urban and rural communities. Rural people are more likely than urban people to spend a higher proportion of their income on living expenses. Of particular interest, there is a higher proportion of people living in rural areas whose costs of living are
Appendix 10
It’s about people: Changing Perspectives on Dryness 138
either equal to or in excess of their income. At a summary level it can be said that people living in rural areas are over-represented when the ratio of costs to income is 80 per cent or greater (approximately 27 per cent versus 20 per cent).
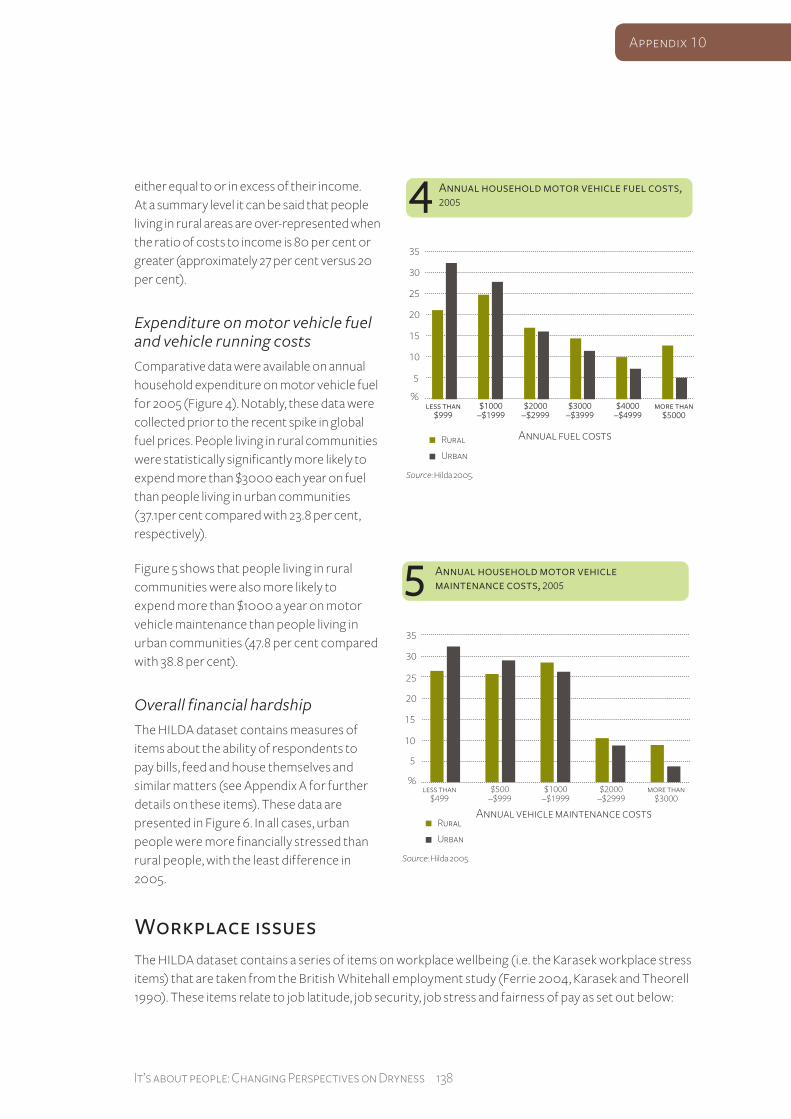
Expenditure on motor vehicle fuel and vehicle running costsComparative data were available on annual household expenditure on motor vehicle fuel for 2005 (Figure 4). Notably, these data were collected prior to the recent spike in global fuel prices. People living in rural communities were statistically significantly more likely to expend more than $3000 each year on fuel than people living in urban communities (37.1per cent compared with 23.8 per cent, respectively).
Figure 5 shows that people living in rural communities were also more likely to expend more than $1000 a year on motor vehicle maintenance than people living in urban communities (47.8 per cent compared with 38.8 per cent).
Overall financial hardshipThe HILDA dataset contains measures of items about the ability of respondents to pay bills, feed and house themselves and similar matters (see Appendix A for further details on these items). These data are presented in Figure 6. In all cases, urban people were more financially stressed than rural people, with the least difference in 2005 .
Workplace issues
The HILDA dataset contains a series of items on workplace wellbeing (i.e. the Karasek workplace stress items) that are taken from the British Whitehall employment study (Ferrie 2004 , Karasek and Theorell 1990). These items relate to job latitude, job security, job stress and fairness of pay as set out below:
Appendix 10
139 It’s about people: Changing Perspectives on Dryness
i Job latitude:
• I have a lot of freedom to decide how I do my own work
• I have a lot of say about what happens on my job
• I have a lot of freedom to decide when I do my work.
ii Job security:
• I have a secure future in my job
• The company I work for will still be in business five years from now
• I worry about the future of my job.
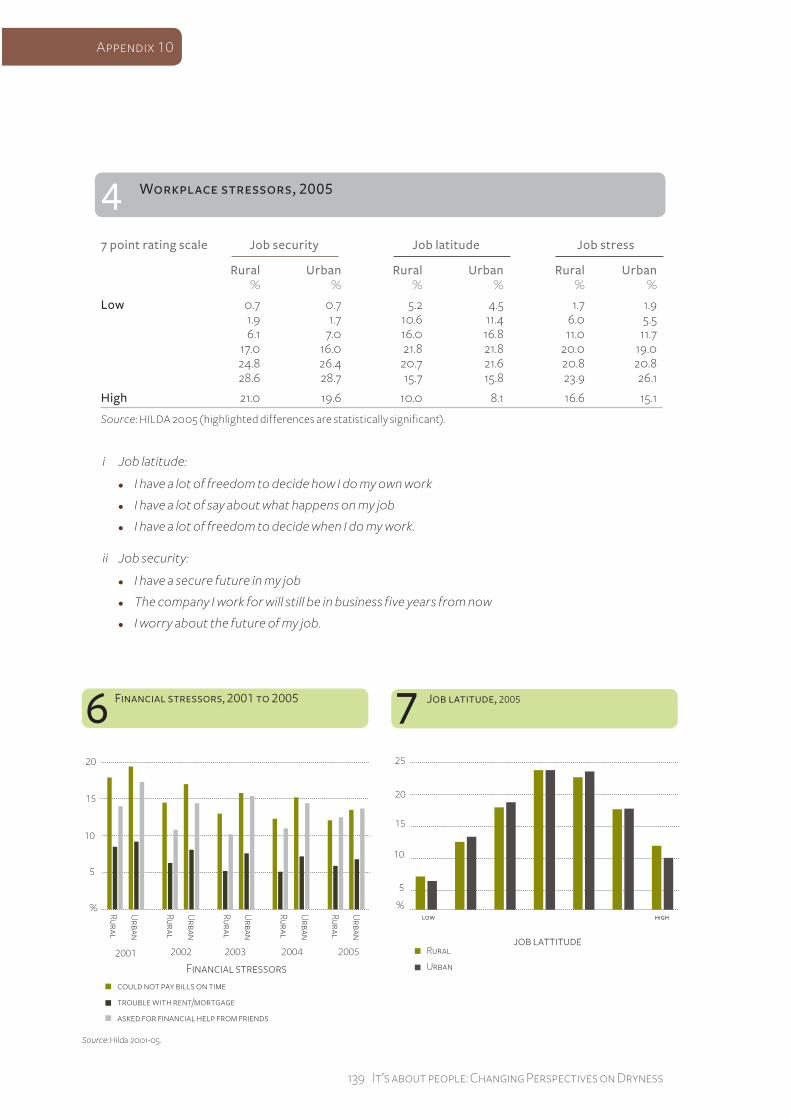
4 Workplace stressors, 2005
7 point rating scale Job security Job latitude Job stress
Rural Urban Rural Urban Rural Urban % % % % % %
Low 0.7 0.7 5.2 4.5 1.7 1.9 1.9 1.7 10.6 11.4 6.0 5.5 6.1 7.0 16.0 16.8 11.0 11.7 17.0 16.0 21.8 21.8 20.0 19.0 24.8 26.4 20.7 21.6 20.8 20.8 28.6 28.7 15.7 15.8 23.9 26.1
High 21.0 19.6 10.0 8.1 16.6 15.1
Source: HILDA 2005 (highlighted differences are statistically significant).
Appendix 10
It’s about people: Changing Perspectives on Dryness 140
iii Job stress:
• My job is complex and difficult
• My job often requires me to learn new skills
• My job is more stressful than I had ever imagined
• I fear that the amount of stress in my job will make me physically ill.
iv Fairness of pay:
• I get paid fairly for the things I do in my job.
Figure 7 and Table 4 indicate that rural workers were statistically more likely than urban workers to report slightly higher levels of latitude in their jobs (20 per cent more likely). Initially rural workers reported being less stressed than urban workers, however, over the course of 2001 to 2005 this gap closed. There were no statistical differences in relation to job security and fair pay.
References
Berry, H (2008) Personal communication. National Centre for Epidemiology and Population Health, Australian National University.
BRS (2008) 2008 Social Atlas of Rural and Regional Australia: Country Matters. Bureau of Rural Sciences, Australian Government, Available: http://affashop.gov.au/product.asp?prodid=13896 [Accessed 6 August 2008]
Expert Social Panel (2008) Drought policy review Expert Social Panel: assessment of the social impacts of drought and related government and non-government social support services - Issues paper, June 2008, Available: http://www.daff.gov.au/_ _data/assets/pdf_file/0004/710644/social_panels_isues_paper.pdf [Accessed 2 July 2008]
Ferrie, JE (Ed.) (2004) Work, Stress, Health: The Whitehall II Study: Department of Epidemiology and Public Health, International Centre for Health and Society, University College London [Available: http://www.ucl.ac.uk/whitehallII/findings/Whitehallbooklet.pdf ].
Hogan, A, M Hanslip, R Kancans, J Russell and B Maguire (2008a) Climate risk and adaptation among primary producers: Topline results focusing on primary producers reporting the effects of adverse seasonal conditions, Report prepared for the Drought Review Branch, Australian Government Department of Agriculture, Fisheries and Forestry, September 2008. Canberra: Bureau of Rural Sciences.
Hogan, A, B Maguire, J Russell and P Stakelum (2008b) The social wellbeing of rural Australians: A comparative analysis of farmers and people working in agriculture in drought-affected areas and the Australian population using the Deakin Personal Wellbeing Index, Report prepared for the Drought Review Branch, Australian Government Department of Agriculture, Fisheries and Forestry, September 2008. Canberra: Bureau of Rural Sciences.
Appendix 10
141 It’s about people: Changing Perspectives on Dryness
Karasek, R (1979) Job demands, job decision latitude, and mental strain: implications for job redesign. 24: 285-307.
Karasek, R and T Theorell (1990) Healthy work: stress, productivity, and the reconstruction of working life, New York: Basic Books.
PIMC (2008) Communique of the Primary Industries Ministerial Council - Meeting held in Melbourne, 17 April 2008, Available: http://www.daff.gov.au/_ _data/assets/pdf_file/0007/625624/pimc-13.pdf [Accessed 25 July 2008]
The Hon. Tony Burke MP (2008a) Expert Panel to review social impacts of drought. Media release. Office of the Minister of Agriculture, Fisheries and Forestry.
The Hon. Tony Burke MP (2008b) Primary Industries Ministerial Forum Communique, Cairns, 28-29 February 2008, Available: http://www.maff.gov.au/media/media _releases/february_ 2008/primary_industries_ministerial_forum_communique [Accessed 2 September 2008]
Appendix a
Scale development and analysis
Much of the work of social scientists is to identify and report on social attitudes, motivations, values and behaviours. While behaviours (e.g. voting behaviour) and social indicators (e.g. annual income) can be independently obser ved, attitudes and motivations are things that exist inside peoples’ heads and as such, are more difficult to obser ve and report on. A number of analytical techniques are reported in this study. Techniques such as reliability analysis and factor analysis are commonly used in social science research to assess the extent to which larger numbers of sur vey items work well together to assess higher level constructs. These analyses are important to ensure that the data reported are statistically reliable and robust. In this section, typical methods used to assess the quality of social sur veys are reported. This summar y is intended to aid the reader in understanding how the analysis of data in this paper has been approached by the research team.
ConstructsIt is rare that an attitude, value or motivation (henceforth referred to as attitudes) is determined by just one thing. Typically in sur vey work, attitudes are measured as constructs, higher level concepts made up of a variety of factors that go together to form an overall whole. The construct is usually informed by a theoretical framework that the researchers have brought to bear on the project. Extensive psychometric work goes into the development of a reliable sur vey instrument including qualitative research, cognitive testing, sur vey piloting, construct testing and cross validation of sur vey results. Given this amount of work, researchers are reluctant to change an item in a validated sur vey without repeating this series of studies.
Appendix 10
It’s about people: Changing Perspectives on Dryness 142
Reliability analysisIn this paper a reliability analysis was applied to the sur vey data to ensure that the variables behaved properly in psychometric terms. Reliability analysis tests whether or not the sur vey items work together to make a coherent scale. If they do, an analyst may calculate a summar y scale variable and use this instead of the larger number of sur vey items used in the original study. Once again, this makes reporting the data simpler and more coherent.
While there are some similarities between reliability analysis and factor analysis, reliability analysis is much more finely focused on assessing one central theme from a set of items, whereas factor analysis can deal with multiple themes at the one time. Reliability analysis is concerned to ensure that respondents respond to sur vey questions in a similar way such that a set of items could be said to make up a consistent scale. Reliability analysis tests these items to see if they go well together as a scale and, if they do, an analyst can compute a summar y variable for the scale that is made up of these variables (by using the average for each item for example). When the new scale variable is produced it retains the sur vey ’s original scale (for example scores of 1 to 5 where 1 means strongly disagree and 5 means strongly agree). A common statistic produced by this routine is called the Cronbach Alpha. Like factor analysis, one looks for a score of around 70 per cent (or 0.7) to be satisfied that the items are working well together.
Psychometric analysis of scales used in this study
Life satisfaction scale
Within the HILDA dataset, a variety of variables are used to describe life satisfaction. These items included satisfaction with partner, children, financial situation and life generally. Respondents rated their satisfaction for each item on a score of 0 (totally dissatisfied) to 10 (totally satisfied). To simplify reporting, a life satisfaction scale was derived from these data using reliability analysis. The Cronbach Alpha for this scale was an acceptable 0.67.
Disposable income
The HILDA dataset contains information on a wide range of household expenses such as food, clothing, fuel, and holidays. It also contains information on annual household income. To simplify reporting on these data a ratio of disposable income was calculated as a ratio of expenses over income.
Financial stress
The HILDA dataset contains information on a range of variables concerned with financial stress. These questions related to:
1 the ability to pay electricity, gas or telephone bills on time
2 the ability to pay the mortgage or rent on time
3 the need to pawn or sell something
4 going without meals
5 ability to heat the home
Appendix 10
143 It’s about people: Changing Perspectives on Dryness
6 requests for financial help from friends or family
7 requests for help from welfare/community organisations.
Reliability analysis was used to develop a scale of financial hardship. The scale showed good internal reliability with an acceptable Cronbach Alpha of 0.70.
Conditions at work
The HILDA dataset contains information on a range of variables concerned with wellbeing at work. These items have been drawn from the internationally recognised Whitehall study of workplace stress (Ferrie 2004 , Karasek 1979) and include constructs such as job security, job latitude and job stress. Reliability analysis was used to check the internal reliability of these scales.
i The job security scale consisted of the following items:
• I have a secure future in my job
• The company I work for will still be in business in 5 years’ time
• I (do not) worry about the future of my job.
The Cronbach Alpha for this scale was an acceptable 0.64.
ii The job latitude scale consisted of the following items:
• I have a lot of freedom to decide how I do my own work
• I have a lot of say about what happens on my job
• I have a lot of freedom to decide when I do my work.
The Cronbach Alpha for this scale was an acceptable 0.82.
iii The job stress scale consisted of the following items:
• My job is complex and difficult
• My job often requires me to learn new skills
• My job is more stressful than I had ever imagined
• I fear that the amount of stress in my job will make me physically ill
The Cronbach Alpha for this scale was an acceptable 0.79.
Appendix 10
It’s about people: Changing Perspectives on Dryness 144
The social wellbeing of rural
Australians:
A comparative analysis of agricultural workers in
drought-affected areas and the Australian population
using the Deakin Personal Wellbeing Index
Report prepared for the Drought Review Branch, Australian Government Department of
Agriculture, Fisheries and Forestry
Anthony Hogan, Brigit Maguire, Jacqui Russell and Patrick Stakelum
September 2008
© Commonwealth of Australia 2008
This work is copyright. Apart from any use as permitted under the Copyright Act 1968, no part may be reproduced by any process without prior written permission from the Commonwealth. Requests and inquiries concerning reproduction and rights should be addressed to the Commonwealth Copyright Administration, Attorney General’s Department, Robert Garran Offices, National Circuit, Barton ACT 2600 or posted at http://www.ag.gov.au/cca.
The Australian Government acting through the Bureau of Rural Sciences (BRS) has exercised due care and skill in the preparation and compilation of the information and data set out in this publication. Notwithstanding, the Bureau of Rural Sciences, its employees and advisers disclaim all liability, including liability for negligence, for any loss, damage, injur y, expense or cost incurred by any person as a result of accessing, using or relying upon any of the information or data set out in this publication to the maximum extent permitted by law.
Postal address:Bureau of Rural SciencesGPO Box 858Canberra, ACT 2601
Appendix 11
145 It’s about people: Changing Perspectives on Dryness
Key findings
Background
This report is one of three prepared by the Social Sciences Program, Bureau of Rural Sciences, to support investigations of the social impacts of drought as part of the National Review of Drought Policy.
The paper reports on a comparison of wellbeing of two populations:
• a sample of 500 agricultural workers in drought-affected areas
• a nationally representative sample of 1203 individuals of the Australian population aged 18 years and over.
Methods
This study used the Deakin Personal Wellbeing Index, which contains eight items of life satisfaction or wellbeing measures, each one corresponding to a quality of life domain:
• standard of living
• health
• achieving in life
• personal relationships
• safety
• community-connectedness
• future security
• spirituality or religion.
It also contains a ninth summar y question on overall wellbeing (life as a whole). A series of standard Newspoll Omnibus sur vey questions was also asked to both populations. These included gender, age, educational levels, and household income.
Comparing wellbeing
For eight of the nine wellbeing measures, there was a significant difference between agricultural workers in drought-affected areas and the Australian population. Agricultural workers in drought-affected areas were less satisfied with their lives as a whole. There was no statistical difference between the two samples in satisfaction with what they are achieving in life.
For people working in agriculture in drought-affected areas, both white-collar workers (e.g. farm managers), and blue-collar workers (e.g. farm labourers), had similar measures of wellbeing.
Agricultural workers in drought-affected areas are less satisfied with their future security
The most striking finding from the study is that agricultural workers in drought-affected areas were up to 40 per cent more likely to report feeling less satisfied with their future security than Australians in general.
Appendix 11
It’s about people: Changing Perspectives on Dryness 146
Descriptive statistics
There are fewer young people (under 34) working in drought-affected areas compared with the Australian population as a whole.
In comparison to the Australian population in general, agricultural workers in drought-affected areas were more likely to:
• have children
• be married or living together
• finish school in Year 10
• have a diploma or certificate from a college or TAFE (including an apprenticeship) but less likely to have a degree or diploma from a university.
List of acronyms
ABARE Australian Bureau of Agricultural and Resource Economics
ABS Australian Bureau of Statistics
ANZSIC Australian and New Zealand Standard Industrial Classification
BRS Bureau of Rural Sciences
DAFF Australian Government Department of Agriculture, Fisheries and Forestr y
EC Exceptional Circumstances: EC events are rare and severe events that are outside those that a farmer could normally be expected to manage using responsible farm management strategies. To be classified as an EC event, the event:
• must be rare, that is it must not have occurred more than once on average in every 20 to 25 years
• must result in a rare and severe downturn in farm income over a prolonged period of time (e.g. greater than 12 months)
• must be a discrete event that is not part of long-term structural adjustment processes or normal fluctuations in commodity prices
MP Member of Parliament
SSP Social Sciences Program, Bureau of Rural Sciences
Appendix 11
147 It’s about people: Changing Perspectives on Dryness
Contents
Key findings 145
List of acronyms 146
1 Background 149
2 Methods 150
3 Comparing wellbeing 152
4 Descriptive statistics 155
References 159
Appendix A: Details on statistical analyses
conducted in this study 160
Figures
1 Agricultural workers in drought-affected areas and the Australian
population by age 155
2 The number of adults in households of agricultural workers in
drought-affected areas compared with households of the
Australian population 156
3 The number of children in households of agricultural workers in
drought-affected areas compared with the Australian population 157
4 Level of school education of agricultural workers in
drought-affected areas compared with the Australian population 157
5 Level of post-school education of agricultural workers in
drought-affected areas compared with the Australian population 157
6 Marital status of agricultural workers in drought-affected areas
compared with the Australian population 158
7 Household income of agricultural workers in drought-affected
areas compared with the Australian population 158
Appendix 11
It’s about people: Changing Perspectives on Dryness 148
tables
1 Wellbeing of agricultural workers in drought-affected areas
compared with the Australian population 152
2 Wellbeing of agricultural workers in drought-affected areas
compared with the Australian population* 153
3 Agricultural workers in drought-affected areas and the Australian
population by gender 155
4 Ages of children in households of agricultural workers in
drought-affected areas compared with households of the
Australian population 156
5 Comparison of number of white collar and blue collar workers
(per cent) 157
Appendix 11
149 It’s about people: Changing Perspectives on Dryness
Background
In June 2008, the Social Sciences Program (SSP) of the Bureau of Rural Sciences (BRS) was asked by the Drought Review Branch of the Department of Agriculture, Fisheries and Forestr y (DAFF) to examine the social impacts of drought on farm families and rural communities as part of its National Review of Drought Policy (The Hon. Tony Burke MP 2008a). This review follows on from the Primar y Industries Ministerial Forum in Cairns earlier in 2008, where Ministers agreed that current approaches to drought and Exceptional Circumstances (EC) might no longer be the most appropriate in the context of a changing climate (PIMC 2008, The Hon. Tony Burke MP 2008b). Ministers saw that drought policy needed to be improved to create an environment of self-reliance and preparedness, and to encourage the adoption of appropriate climate change management practices.
As part of the review process the Minister for Agriculture, Fisheries and Forestr y appointed a seven member Expert Social Panel (2008) to:
• assess the social impact of drought on farm families and rural communities
• identify gaps and areas for improvement in Australian, state and territory government social support services that are designed to mitigate the impact of drought on farm families and rural communities.
To support the work of the Expert Social Panel, the SSP was asked by the Drought Review Branch to:
• provide an analysis of the Quality of Life survey of farmers and farm workers in drought areas (compared with the total Australian community) using the recognised Deakin Wellbeing Index (based on a national Newspoll survey conducted in mid July 2008)
• provide an analysis of the social circumstances of rural people and communities (compared with urban communities) based on previously unanalysed dimensions from the Household Income and Labour Dynamics in Australia (HILDA) survey (Hogan et al. 2008b)
• provide an analysis of the social circumstances, perceptions, and behaviour of farmers (including issues of concern, risk management, perceptions of drought, management of challenges) from the June 2008 SSP climate change and industry adaptation survey of farmers (Hogan et al. 2008a).
This paper responds to the first of these requests, reporting on the wellbeing study of agricultural workers in drought-affected areas, and compares their wellbeing with that of a nationally representative sample of Australians aged 18 years and over. It provides findings in relation to the question of whether the quality of life of people and communities in drought-affected areas differs from that of Australians in general.
Appendix 11
It’s about people: Changing Perspectives on Dryness 150
Methods
This study was provided to the Drought Review Branch in response to a request by the Expert Social Panel (the Panel) that a study be undertaken on the social wellbeing of agricultural workers in drought-affected areas, and to compare their wellbeing with that of Australians in general. There was a specific request by the Panel that the comparison be based upon the Deakin Personal Wellbeing Index (PWI).
The PWI was developed from the Comprehensive Quality of Life Scale (ComQol) by Cummins et al. (2005 , 1994). The method underpinning the ComQol focused on the interaction of how happy a person is with aspects of life that are important to them.
The PWI scale contains eight items of satisfaction, each one corresponding with a quality of life domain.
The index asks:
Thinking about how satisfied you are with particular aspects of your life. Using a scale from 0 to 10, where 0 is not at all satisfied and 10 is extremely satisfied, how satisfied are you with each of the following:
1 your standard of living
2 your health
3 what you are achieving in life
4 your personal relationships
5 how safe you feel
6 feeling part of your community
7 your future security
8 your spirituality or religion.
A ninth item measures overall wellbeing:
Thinking now about your own life and personal circumstances, using a scale from 0 to 10, where 0 is not at all satisfied and 10 is extremely satisfied, how satisfied are you with your life as a whole?
The PWI provides a reliable measure of social wellbeing. Details about the robustness of the measure can be found in Appendix A. The appendix also provides an explanation of statistical tests used in the study.
In this study, respondents completed the study in two groups:
1 as part of a national telephone Omnibus study conducted by Newspoll on a nationally representative sample of Australians aged 18 years and over (n=1203)
2 as part of a nationally representative telephone sample of Australians aged 18 years and over, who were working in agriculture (including farm owners and farm workers) in 23 drought declared areas in Australia (n=500).
Appendix 11
151 It’s about people: Changing Perspectives on Dryness
In addition to the PWI, a series of standard Newspoll Omnibus sur vey questions was also asked of both populations. These included gender, age, educational levels, and household income. Reliability and factor analysis were conducted on the data (see Appendix A for further details). These analyses confirmed that the data are robust.
In the national sur vey, inter views were conducted between 18 and 20 July 2008 by fully trained and personally briefed inter viewers. The study of agricultural workers in drought-affected areas was conducted the following week. A system of call backs was put in place so as to include those people who were frequently away from home. To reflect the population distribution, results were post-weighted to Australian Bureau of Statistics (ABS) data on age, highest level of schooling completed, gender and area. Analysis was conducted on both weighted and unweighted datasets. There was ver y little difference between the two analyses. However, as the weights for each study are calculated differently it is not possible to simply put the datasets together. Certain statistical routines can become problematic when using weighted data (e.g. for regression). For these reasons the results reported in this paper are for unweighted data. The data reported compare outcomes for agricultural workers (farmers and farm workers) in drought-affected areas with the Australian population. For ease of reading, the data from agricultural workers in drought-affected areas in this report is at times referred to as ‘drought-affected’ and is compared with ‘the Australian population’.
The data are reported in three sections. First, respondents’ mean scores on the PWI items are reported by sub-group (agricultural workers in drought-affected areas and the Australian population), and statistical differences are reported. Second, since perceptions of wellbeing can be influenced by social factors, these results are subjected to further analysis that controls for the effects of age and income. Logistic regression is used for this analysis, comparing outcomes for the two samples—those in drought-affected areas and the national sample. Third, the demographics are reported for the two samples.
Appendix 11
It’s about people: Changing Perspectives on Dryness 152
Comparing wellbeing
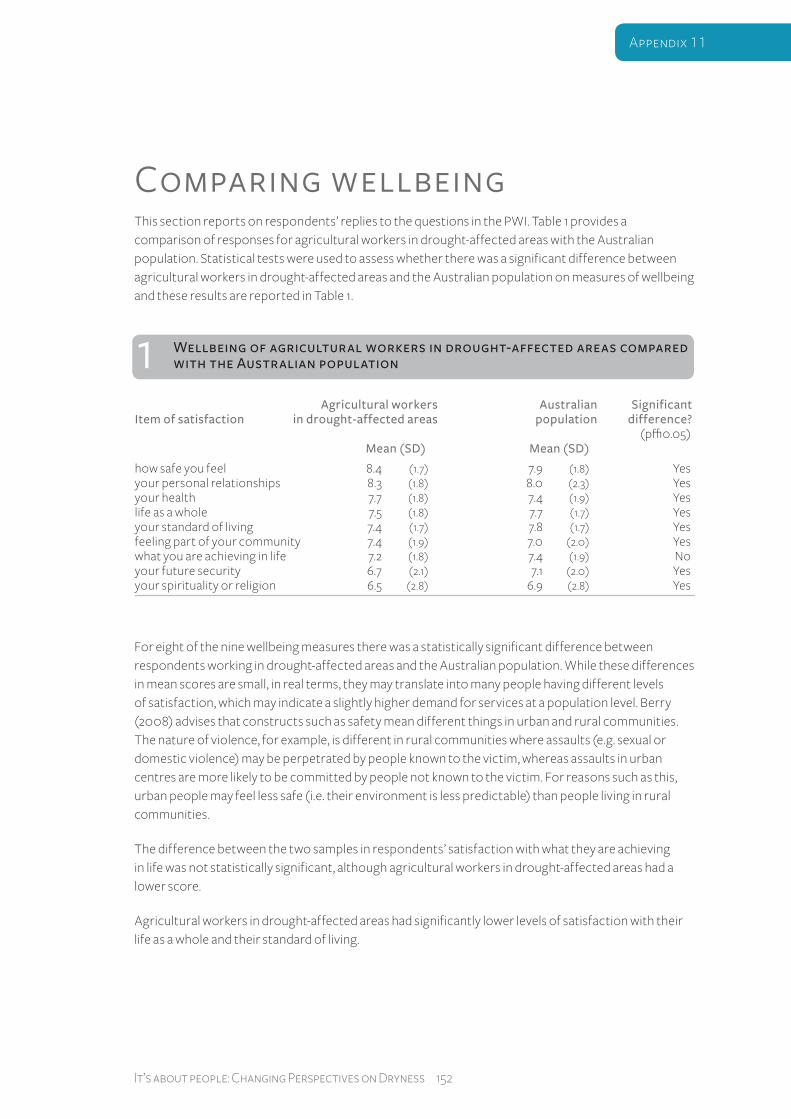
This section reports on respondents’ replies to the questions in the PWI. Table 1 provides a comparison of responses for agricultural workers in drought-affected areas with the Australian population. Statistical tests were used to assess whether there was a significant difference between agricultural workers in drought-affected areas and the Australian population on measures of wellbeing and these results are reported in Table 1.
For eight of the nine wellbeing measures there was a statistically significant difference between respondents working in drought-affected areas and the Australian population. While these differences in mean scores are small, in real terms, they may translate into many people having different levels of satisfaction, which may indicate a slightly higher demand for ser vices at a population level. Berr y (2008) advises that constructs such as safety mean different things in urban and rural communities. The nature of violence, for example, is different in rural communities where assaults (e.g. sexual or domestic violence) may be perpetrated by people known to the victim, whereas assaults in urban centres are more likely to be committed by people not known to the victim. For reasons such as this, urban people may feel less safe (i.e. their environment is less predictable) than people living in rural communities.
The difference between the two samples in respondents’ satisfaction with what they are achieving in life was not statistically significant, although agricultural workers in drought-affected areas had a lower score.
Agricultural workers in drought-affected areas had significantly lower levels of satisfaction with their life as a whole and their standard of living.
1 Wellbeing of agricultural workers in drought-affected areas compared
with the Australian population
Agricultural workers Australian SignificantItem of satisfaction in drought-affected areas population difference? (p≤0.05) Mean (SD) Mean (SD)
how safe you feel 8.4 (1.7) 7.9 (1.8) Yesyour personal relationships 8.3 (1.8) 8.0 (2.3) Yesyour health 7.7 (1.8) 7.4 (1.9) Yeslife as a whole 7.5 (1.8) 7.7 (1.7) Yesyour standard of living 7.4 (1.7) 7.8 (1.7) Yesfeeling part of your community 7.4 (1.9) 7.0 (2.0) Yeswhat you are achieving in life 7.2 (1.8) 7.4 (1.9) Noyour future security 6.7 (2.1) 7.1 (2.0) Yesyour spirituality or religion 6.5 (2.8) 6.9 (2.8) Yes
Appendix 11
153 It’s about people: Changing Perspectives on Dryness
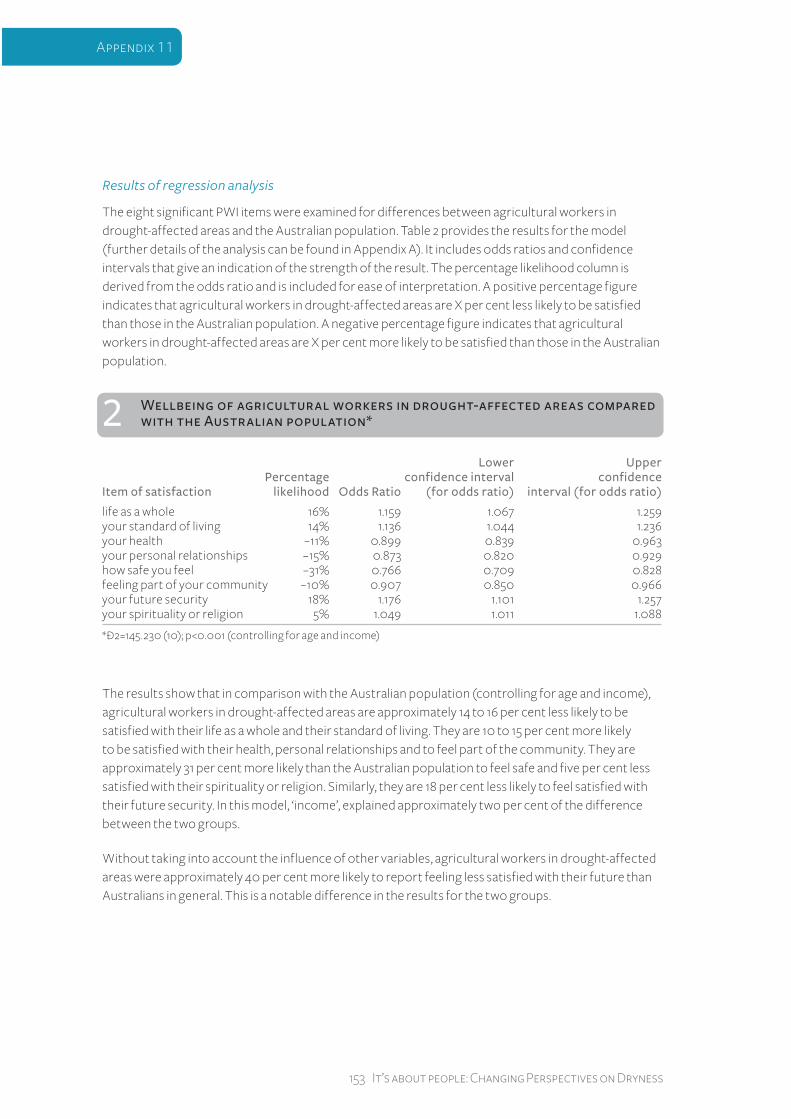
Results of regression analysis
The eight significant PWI items were examined for differences between agricultural workers in drought-affected areas and the Australian population. Table 2 provides the results for the model (further details of the analysis can be found in Appendix A). It includes odds ratios and confidence inter vals that give an indication of the strength of the result. The percentage likelihood column is derived from the odds ratio and is included for ease of interpretation. A positive percentage figure indicates that agricultural workers in drought-affected areas are X per cent less likely to be satisfied than those in the Australian population. A negative percentage figure indicates that agricultural workers in drought-affected areas are X per cent more likely to be satisfied than those in the Australian population.
The results show that in comparison with the Australian population (controlling for age and income), agricultural workers in drought-affected areas are approximately 14 to 16 per cent less likely to be satisfied with their life as a whole and their standard of living. They are 10 to 15 per cent more likely to be satisfied with their health, personal relationships and to feel part of the community. They are approximately 31 per cent more likely than the Australian population to feel safe and five per cent less satisfied with their spirituality or religion. Similarly, they are 18 per cent less likely to feel satisfied with their future security. In this model, ‘income’, explained approximately two per cent of the difference between the two groups.
Without taking into account the influence of other variables, agricultural workers in drought-affected areas were approximately 40 per cent more likely to report feeling less satisfied with their future than Australians in general. This is a notable difference in the results for the two groups.
2 Wellbeing of agricultural workers in drought-affected areas compared
with the Australian population*
Lower Upper Percentage confidence interval confidenceItem of satisfaction likelihood Odds Ratio (for odds ratio) interval (for odds ratio)
life as a whole 16% 1.159 1.067 1.259your standard of living 14% 1.136 1.044 1.236your health –11% 0.899 0.839 0.963your personal relationships –15% 0.873 0.820 0.929how safe you feel –31% 0.766 0.709 0.828feeling part of your community –10% 0.907 0.850 0.966your future security 18% 1.176 1.101 1.257your spirituality or religion 5% 1.049 1.011 1.088
*Ð2=145 .230 (10); p<0.001 (controlling for age and income)
Appendix 11
It’s about people: Changing Perspectives on Dryness 154
Respondents in drought-aff ected areas who were dissatisfi ed with their future security were more likely to:
• be over 40 years of age
• be male (although this may be because of the greater proportion of males in the drought-affected sample)
• have two adults in the household
• not have children
• work full time
• have Year 11 or 12 education
• be married
• earn under $30 000
• have no post-school qualifications.
It is possible that there may be some differences in wellbeing between farm owners and managers, and farm workers. This question was explored for the drought-affected respondents only, using white/blue collar coding according to the Australian Standard Classification of Occupations (ASCO).
Independent samples t-tests on agricultural workers in drought-affected areas revealed no significant differences between white-collar respondents and blue-collar respondents on measures of wellbeing. This result was confirmed using regression analysis controlling for income and gender.
Appendix 11
155 It’s about people: Changing Perspectives on Dryness
3 Agricultural workers in drought-
affected areas and the Australian
population by gender
Agricultural workers in AustralianGender drought-affected areas population % %
Male 73 50Female 27 50
Descriptive statistics
The sur vey results provide descriptive information about the respondents, including:
• age
• gender
• household structure
• school education
• post-school education
• marital status
• work status
• blue/white collar workers
• household income.
These variables can be used to compare the respondents who were agricultural workers in drought-affected areas and respondents from the nationally representative sample of Australians.
Since the drought sample was specifically targeted at people employed in the agricultural sector and not the general rural population, it is not appropriate to statistically compare this sample with the randomly collected Australian population sample on demographic items. Rather, general trends are described to illustrate differences between the respondents working in agriculture in drought-affected areas and the Australian population generally.
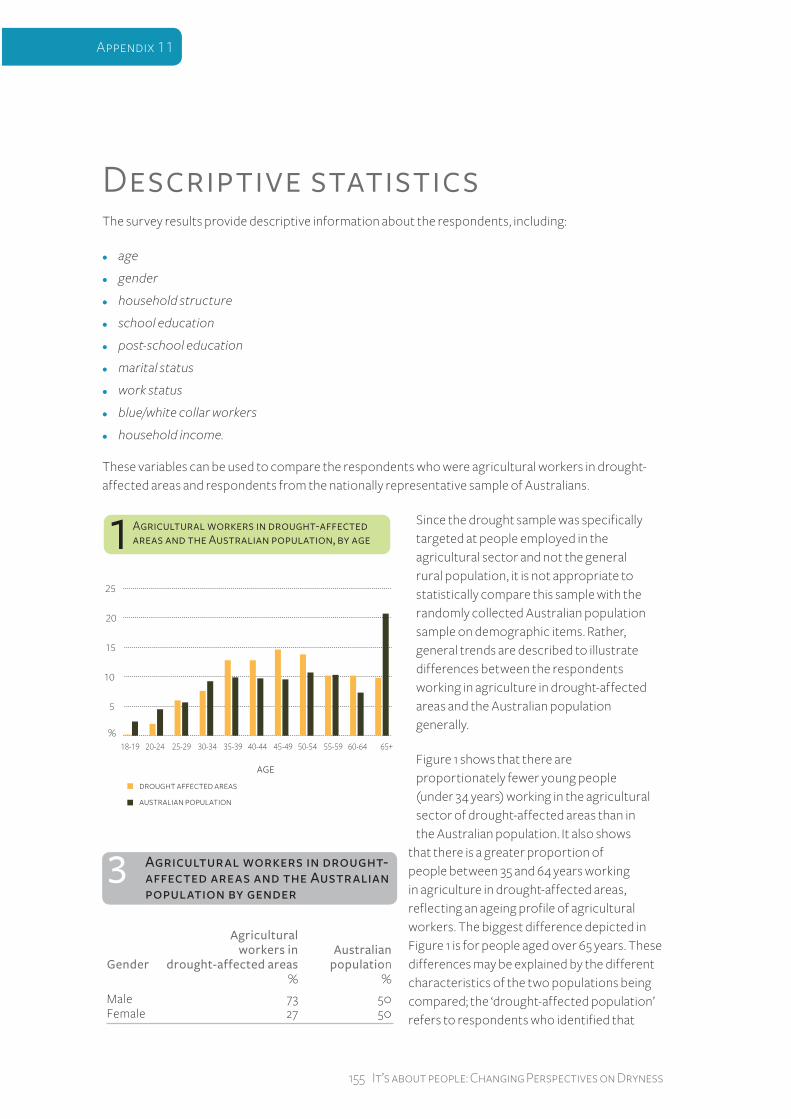
Figure 1 shows that there are proportionately fewer young people (under 34 years) working in the agricultural sector of drought-affected areas than in the Australian population. It also shows
that there is a greater proportion of people between 35 and 64 years working in agriculture in drought-affected areas, reflecting an ageing profile of agricultural workers. The biggest difference depicted in Figure 1 is for people aged over 65 years. These differences may be explained by the different characteristics of the two populations being compared; the ‘drought-affected population’ refers to respondents who identified that
Appendix 11
It’s about people: Changing Perspectives on Dryness 156
they were working in the agricultural sector, whereas the ‘Australian population’ refers to a nationally representative sample of individuals of the Australian population aged 18 years and over.
Table 3 reports respondents by gender. The population sample used quotas to ensure equal representation by gender. The sample of respondents working in agriculture in drought-affected areas targeted only those employed in agricultural work and results in an anticipated gender split of males to female.
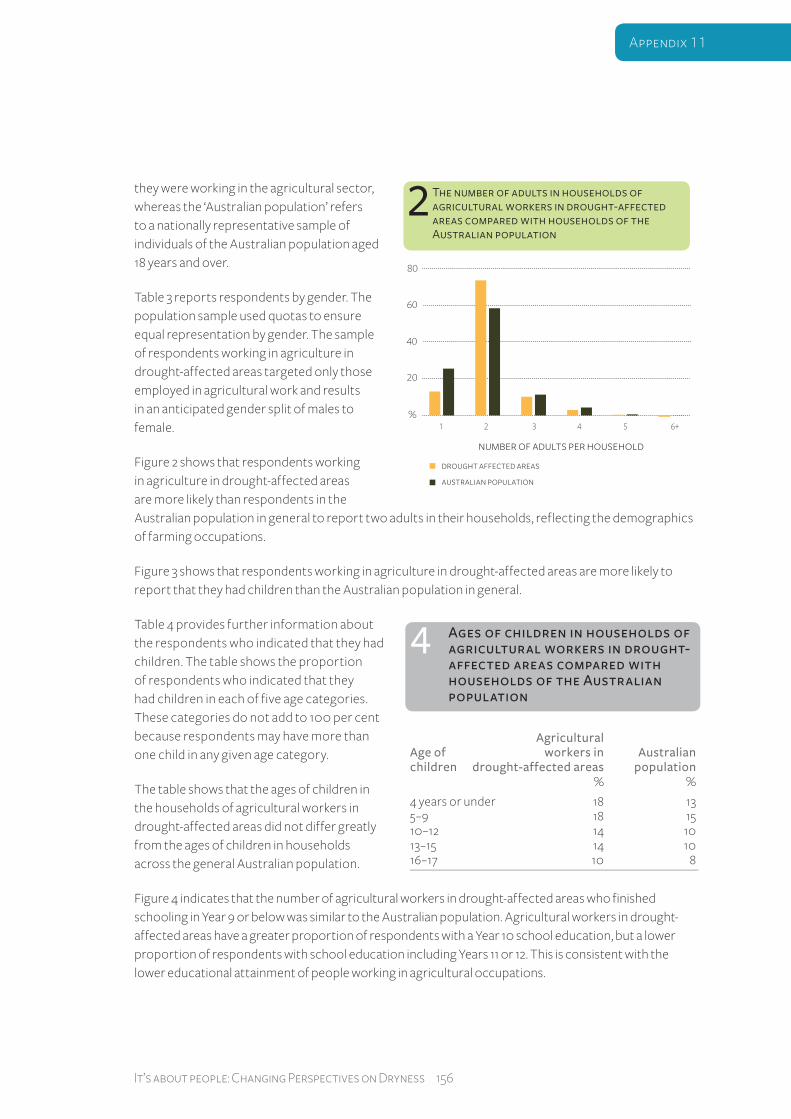
Figure 2 shows that respondents working in agriculture in drought-affected areas are more likely than respondents in the Australian population in general to report two adults in their households, reflecting the demographics of farming occupations.
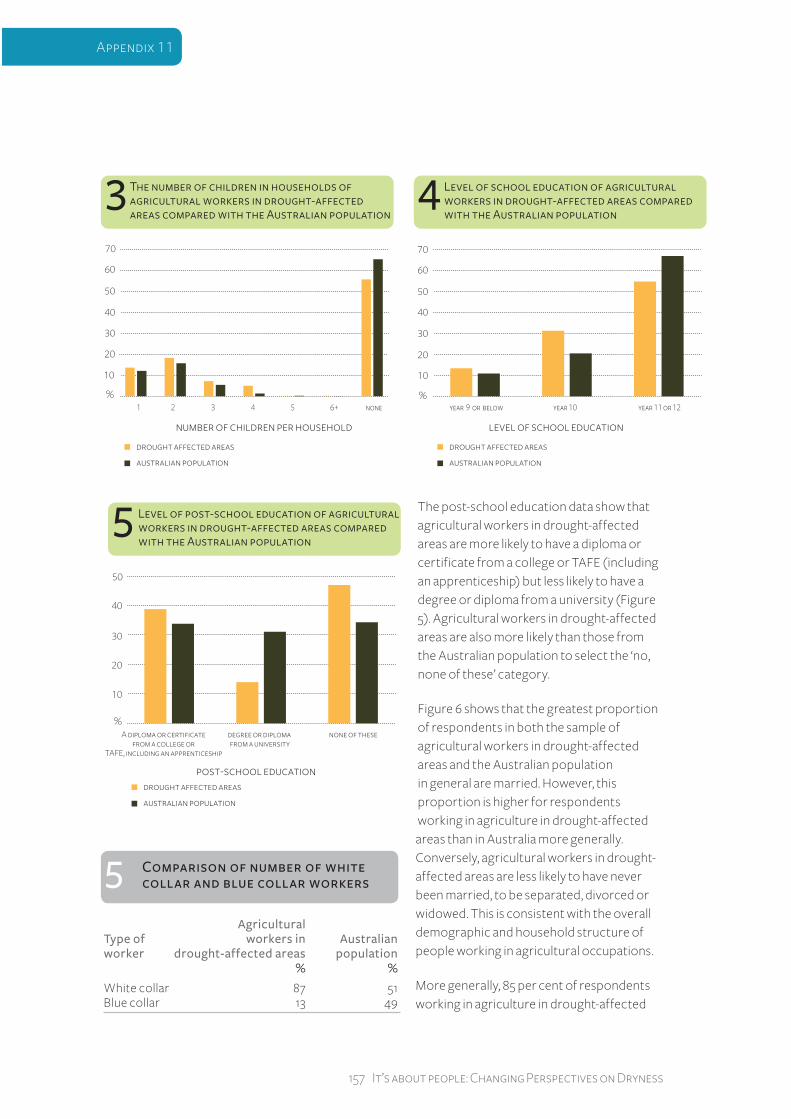
Figure 3 shows that respondents working in agriculture in drought-affected areas are more likely to report that they had children than the Australian population in general.
Table 4 provides fur ther information about the respondents who indicated that they had children. The table shows the propor tion of respondents who indicated that they had children in each of five age categories. These categories do not add to 100 per cent because respondents may have more than one child in any given age categor y.
The table shows that the ages of children in the households of agricultural workers in drought-affected areas did not differ greatly from the ages of children in households across the general Australian population.
Figure 4 indicates that the number of agricultural workers in drought-affected areas who finished schooling in Year 9 or below was similar to the Australian population. Agricultural workers in drought-affected areas have a greater proportion of respondents with a Year 10 school education, but a lower proportion of respondents with school education including Years 11 or 12. This is consistent with the lower educational attainment of people working in agricultural occupations.
4 Ages of children in households of
agricultural workers in drought-
affected areas compared with
households of the Australian
population
Agricultural Age of workers in Australianchildren drought-affected areas population % %
4 years or under 18 135–9 18 1510–12 14 1013–15 14 1016–17 10 8
Appendix 11
157 It’s about people: Changing Perspectives on Dryness
The post-school education data show that agricultural workers in drought-affected areas are more likely to have a diploma or certificate from a college or TAFE (including an apprenticeship) but less likely to have a degree or diploma from a university (Figure 5). Agricultural workers in drought-affected areas are also more likely than those from the Australian population to select the ‘no, none of these’ categor y.
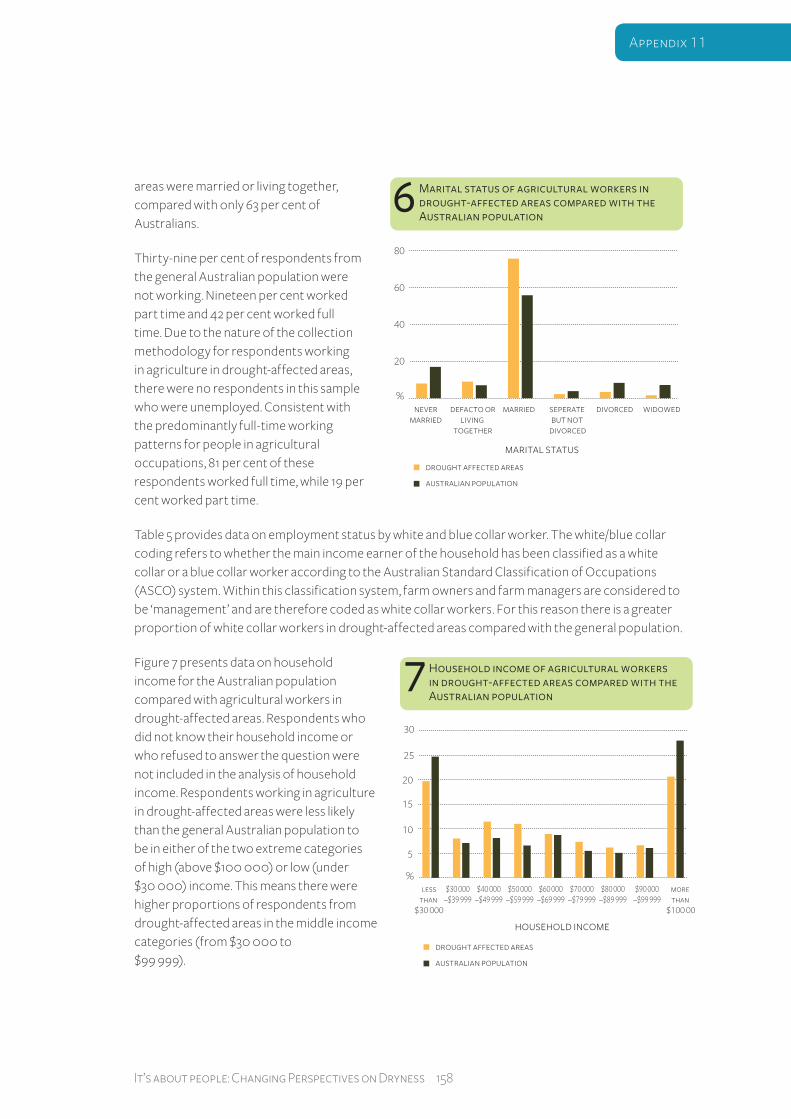
Figure 6 shows that the greatest proportion of respondents in both the sample of agricultural workers in drought-affected areas and the Australian population in general are married. However, this proportion is higher for respondents working in agriculture in drought-affected
areas than in Australia more generally. Conversely, agricultural workers in drought-affected areas are less likely to have never been married, to be separated, divorced or widowed. This is consistent with the overall demographic and household structure of people working in agricultural occupations.
More generally, 85 per cent of respondents working in agriculture in drought-affected
5 Comparison of number of white
collar and blue collar workers
Agricultural Type of workers in Australianworker drought-affected areas population % %
White collar 87 51Blue collar 13 49
Appendix 11
It’s about people: Changing Perspectives on Dryness 158
areas were married or living together, compared with only 63 per cent of Australians.
Thirty-nine per cent of respondents from the general Australian population were not working. Nineteen per cent worked part time and 42 per cent worked full time. Due to the nature of the collection methodolog y for respondents working in agriculture in drought-affected areas, there were no respondents in this sample who were unemployed. Consistent with the predominantly full-time working patterns for people in agricultural occupations, 81 per cent of these respondents worked full time, while 19 per cent worked part time.
Table 5 provides data on employment status by white and blue collar worker. The white/blue collar coding refers to whether the main income earner of the household has been classified as a white collar or a blue collar worker according to the Australian Standard Classification of Occupations (ASCO) system. Within this classification system, farm owners and farm managers are considered to be ‘management’ and are therefore coded as white collar workers. For this reason there is a greater proportion of white collar workers in drought-affected areas compared with the general population.
Figure 7 presents data on household income for the Australian population compared with agricultural workers in drought-affected areas. Respondents who did not know their household income or who refused to answer the question were not included in the analysis of household income. Respondents working in agriculture in drought-affected areas were less likely than the general Australian population to be in either of the two extreme categories of high (above $100 000) or low (under $30 000) income. This means there were higher proportions of respondents from drought-affected areas in the middle income categories (from $30 000 to $99 999).
Appendix 11
159 It’s about people: Changing Perspectives on Dryness
References
Cummins, RA, R Eckersley, E Okerstrom, SK Lo, M Davern, B Hunter and J Woerner (2005) The Australian Unity Wellbeing Index: 2004 update. Available: http://www.deakin.edu.au/research/acqol/Conferences/abstracts_papers/2004/Cummins_ AWI_update.ppt#1Australian, Centre on Quality of Life - Deakin University.
Cummins, RA, MP McCabe, Y Romeo and E Gullone (1994) The Comprehensive Quality of Life Scale: Instrument development and psychometric evaluation on tertiary staff and students. Educational and Psychological Measurement, 54: 372-82.
Expert Social Panel (2008) Drought policy review Expert Social Panel: assessment of the social impacts of drought and related government and non-government social support services - Issues paper, June 2008, Available: http://www.daff.gov.au/_ _data/assets/pdf_file/0004/710644/social_panels_isues_paper.pdf [Accessed 2 July 2008]
Hogan, A, M Hanslip, R Kancans, J Russell and B Maguire (2008a) Climate risk and adaptation among primary producers: Topline results focusing on primary producers reporting the effects of adverse seasonal conditions, Report prepared for the Drought Review Branch, Australian Government Department of Agriculture, Fisheries and Forestry, September 2008. Canberra: Bureau of Rural Sciences.
Hogan, A, C Polidano, J Russell and P Stakelum (2008b) The social wellbeing of rural Australians: an analysis of the Household, Income and Labour Dynamics in Australia (HILDA) study, Report prepared for the Drought Review Branch, Australian Government Department of Agriculture, Fisheries and Forestry, September 2008. Canberra: Bureau of Rural Sciences.
PIMC (2008) Communique of the Primary Industries Ministerial Council - Meeting held in Melbourne, 17 April 2008, Available: http://www.daff.gov.au/_ _data/assets/pdf_file/0007/625624/pimc-13.pdf [Accessed 25 July 2008]
The Hon. Tony Burke MP (2008a) Expert Panel to review social impacts of drought. Media release. Office of the Minister of Agriculture, Fisheries and Forestry.
The Hon. Tony Burke MP (2008b) Primary Industries Ministerial Forum Communique, Cairns, 28-29 February 2008, Available: http://www.maff.gov.au/media/media _releases/february_ 2008/primary_industries_ministerial_forum_communique [Accessed 2 September 2008]
Appendix 11
It’s about people: Changing Perspectives on Dryness 160
Appendix a
Details on statistical analyses
conducted in this study
Much of the work of social scientists is to identif y and repor t on social attitudes, motivations, values and behaviours. While behaviours (eg voting behaviour) and social indicators (e.g. annual income) can be independently obser ved, attitudes and motivations are things that exist inside peoples’ heads and as such, are more difficult to obser ve and repor t on. A number of analytical techniques were repor ted in this study. Techniques such as reliability analysis and factor analysis are commonly used in social science research to assess the extent to which larger numbers of sur vey items work well together to assess higher-level constructs. These analyses are impor tant to ensure that the data repor ted are statistically reliable and robust. In this section, typical methods used to assess the quality of social sur veys are repor ted. This summar y is intended to aid the reader in understanding how the analysis of data in this paper has been approached by the research team.
ConstructsIt is rare that an attitude, value or motivation (henceforth referred to as attitudes) is determined by just one thing. Typically in sur vey work, attitudes are measured as constructs, higher level concepts made up of a variety of factors that go together to form an overall whole. The construct is usually informed by a theoretical framework that the researchers have brought to bear on the project. Extensive psychometric work goes into the development of a reliable sur vey instrument including qualitative research, cognitive testing, sur vey piloting, construct testing and cross validation of sur vey results. Given this amount of work, researchers are reluctant to change an item in a validated sur vey without repeating this series of studies.
Psychometric analysis used in this studyIn this paper a number of statistical tests were applied to the sur vey data to ensure that the variables behaved properly in psychometric terms. The psychometric tests applied to the data are briefly discussed below.
Factor analysis
Factor analysis is a statistical method that is used to reduce a large number of sur vey items about a particular attitude or behaviour into a few underlying new variables or factors. The way it does this is to look for covariance across the responses; that is, by identifying questions for which the answer patterning is the same. An important research factor for farmers managing climate change is that they actively plan to manage their on-farm risks. This idea or factor could be made up of a larger number of different attitudes or behaviours such as succession planning, use of an operational management plan and development of a business management plan. Factor analysis brings common variables such as these together in the dataset and reduces them to a single new variable (or factor) while losing as
Appendix 11
161 It’s about people: Changing Perspectives on Dryness
little of the response detail as possible. This new variable can then be used to more easily examine the question since one can focus on just one item (e.g. actively plan to manage their on-farm risks) rather than needing to think about a lot of variables all at the same time. In social sciences a factor score of 30 per cent—40 per cent of variance explained is acceptable, but ideally one would like to see factor scores closer to 70 per cent. The higher score indicates that less information has been lost in bringing the items together and that together, these items explain much of what is going on with the behaviours of interest.
Factor analysis of the PWI explained 40 per cent of variance
Reliability analysis
Reliability analysis tests whether or not the sur vey items work together to make a coherent scale. If they do, an analyst may calculate a summar y scale variable and use this instead of the larger number of sur vey items used in the original study. Once again, this makes reporting the data simpler and more coherent.
While there are some similarities between reliability analysis and factor analysis, reliability analysis can produce much more finely focused on assessing one central theme from a set of items, whereas than factor analysis can deal with multiple themes at the one time. Reliability analysis is concerned to ensure that respondents respond to sur vey questions in a similar way such that a set of items could be said to make up a consistent scale. Reliability analysis tests these items to see if they go well together as a scale and if they do, an analyst can compute a summar y variable for the scale that is made up of these variables (by using the average for each item, for example). When the new scale variable is produced it retains the sur vey ’s original scale (for example scores of 1 to 5 where 1 means strongly disagree and 5 means strongly agree). A common statistic produced by this routine is called the Cronbach’s Alpha. Like factor analysis, one looks for a score of around 70 per (or 0.7) to be satisfied that the items are working well together.
The Cronbach’s Alpha for the PWI was a reliable 0.75 .
Readers interested in further information on the psychometric properties of the scale are referred to the sur vey manual. The manual reports that:
• the survey produces consistent results over time
• it consistently measures the same construct
• respondents respond to the questions in quite similar ways
• it can detect differences between groups with differing levels of wellbeing.
Appendix 11
It’s about people: Changing Perspectives on Dryness 162
Regression analysis
Regression analysis is a statistical tool that is used to measure the extent to which a set of variables predict a certain outcome. Standard regression analysis works well when the outcome variable is a continuous variable. However, when the outcome variable is an either/or variable a slightly different form of regression analysis is used. This is called logistic regression. Through the use of some complicated mathematics, logistic regression replicates the kind of data variability one can get with continuous variables so that the analysis can be conducted. Moreover, within this technique, it is possible to use an advanced statistical routine (called backward conditional regression) which eliminates from the analysis, any variable not directly contributing the prediction of the outcomes.
Specifically, the application of the logistic regression routine to the data in this study enabled:
• analysis of the question of interest (e.g. to analyse the differences in wellbeing between those in drought-affected areas and Australians generally)
• bringing all the variables of interest into the analysis
• taking into account the extent to which the variables influence each other
• producing a result that highlights variables that are influencing the outcome, if they exist.
Gender was excluded from the analysis in this study because the two samples were not comparable by gender. The model for this analysis (controlling for age and income) (see Section 3) was statistically significant (c2=145 .230 (10); p<0.001). The explanator y power of the model on the overall differences between drought-affected and the Australian population was between eight per cent and 11 per cent. This is a useful result given that only ‘one’ concept (wellbeing) was examined for differences between the groups. Overall, only one variable was eliminated in the analysis (satisfaction with achievement in life). Notably, the PWI manual identifies this variable as being problematic, possibly because it is a multi-dimensional item, meaning different things to different people.
Appendix 11