The social contact hypothesis under the assumption of ...
10
Epidemics 11 (2015) 14–23 Contents lists available at ScienceDirect Epidemics j our na l ho me pa g e: www.elsevier.com/locate/epidemics The social contact hypothesis under the assumption of endemic equilibrium: Elucidating the transmission potential of VZV in Europe E. Santermans a,∗ , N. Goeyvaerts a,b , A. Melegaro c , W.J. Edmunds d , C. Faes a , M. Aerts a , P. Beutels b,e , N. Hens a,b a Interuniversity Institute for Biostatistics and Statistical Bioinformatics, Hasselt University, Diepenbeek, Belgium b Centre for Health Economic Research and Modelling Infectious Diseases, Vaccine & Infectious Disease Institute, University of Antwerp, Antwerp, Belgium c Department of Policy Analysis and Public Management and Dondena Centre for Research on Social Dynamics, Universit Commerciale L. Bocconi, Milan, Italy d London School of Hygiene & Tropical Medicine, London, United Kingdom e School of Public Health and Community Medicine, The University of New South Wales, Sydney, Australia a r t i c l e i n f o Article history: Received 14 June 2014 Received in revised form 23 December 2014 Accepted 30 December 2014 Available online 10 January 2015 Keywords: Mathematical model Mixing Contact data Varicella Risk factors a b s t r a c t The basic reproduction number R 0 and the effective reproduction number R are pivotal parameters in infectious disease epidemiology, quantifying the transmission potential of an infection in a population. We estimate both parameters from 13 pre-vaccination serological data sets on varicella zoster virus (VZV) in 12 European countries and from population-based social contact surveys under the commonly made assumptions of endemic and demographic equilibrium. The fit to the serology is evaluated using the inferred effective reproduction number R as a model eligibility criterion combined with AIC as a model selection criterion. For only 2 out of 12 countries, the common choice of a constant proportionality fac- tor is sufficient to provide a good fit to the seroprevalence data. For the other countries, an age-specific proportionality factor provides a better fit, assuming physical contacts lasting longer than 15 min are a good proxy for potential varicella transmission events. In all countries, primary infection with VZV most often occurs in early childhood, but there is substantial variation in transmission potential with R 0 ranging from 2.8 in England and Wales to 7.6 in The Netherlands. Two non-parametric methods, the maximal information coefficient (MIC) and a random forest approach, are used to explain these differ- ences in R 0 in terms of relevant country-specific characteristics. Our results suggest an association with three general factors: inequality in wealth, infant vaccination coverage and child care attendance. This illustrates the need to consider fundamental differences between European countries when formulating and parameterizing infectious disease models. © 2015 The Authors. Published by Elsevier B.V. This is an open access article under the CC BY-NC-ND license (http://creativecommons.org/licenses/by-nc-nd/4.0/). Introduction One of the key measures of infectious disease transmission is the basic reproduction number R 0 : the expected number of secondary cases per primary case in a “virgin” population (Diekmann et al., 1990). If R 0 is larger than 1 the infection may become endemic and the larger R 0 , the more effort is required to eliminate the infection from the population. Although R 0 is a useful theoretical measure, it is rarely observed in practice. The effective reproduction ∗ Corresponding author. Tel.: +32 474927849. E-mail address: [email protected] (E. Santermans). number R takes pre-existing immunity into account and thus reflects the average number of secondary cases that can be observed in a partially immune population. There are several methods to estimate R 0 and R (Vynnycky and White, 2010). In this article, we focus on deriving R 0 from transmission rates that can be estimated from serological data under the assumption of endemic equilib- rium (Anderson and May, 1991). A disease in endemic equilibrium, or steady state, may undergo cyclical epidemics, but fluctuates around a stationary average over time. Whitaker and Farrington (Whitaker and Farrington, 2004a) have shown that the impact of regular epidemic cycles, displayed by many childhood infections, can be ignored when estimating R 0 . In this equilibrium setting, each infectious individual infects one other individual on average, hence http://dx.doi.org/10.1016/j.epidem.2014.12.005 1755-4365/© 2015 The Authors. Published by Elsevier B.V. This is an open access article under the CC BY-NC-ND license (http://creativecommons.org/licenses/by-nc-nd/4.0/).
Transcript of The social contact hypothesis under the assumption of ...

Te
EPa
b
c
Id
e
a
ARR2AA
KMMCVR
I
bc1aim
h1
Epidemics 11 (2015) 14–23
Contents lists available at ScienceDirect
Epidemics
j our na l ho me pa g e: www.elsev ier .com/ locate /ep idemics
he social contact hypothesis under the assumption of endemicquilibrium: Elucidating the transmission potential of VZV in Europe
. Santermansa,∗, N. Goeyvaertsa,b, A. Melegaroc, W.J. Edmundsd, C. Faesa, M. Aertsa,
. Beutelsb,e, N. Hensa,b
Interuniversity Institute for Biostatistics and Statistical Bioinformatics, Hasselt University, Diepenbeek, BelgiumCentre for Health Economic Research and Modelling Infectious Diseases, Vaccine & Infectious Disease Institute, University of Antwerp, Antwerp, BelgiumDepartment of Policy Analysis and Public Management and Dondena Centre for Research on Social Dynamics, Universit Commerciale L. Bocconi, Milan,
talyLondon School of Hygiene & Tropical Medicine, London, United KingdomSchool of Public Health and Community Medicine, The University of New South Wales, Sydney, Australia
r t i c l e i n f o
rticle history:eceived 14 June 2014eceived in revised form3 December 2014ccepted 30 December 2014vailable online 10 January 2015
eywords:athematical modelixing
ontact dataaricellaisk factors
a b s t r a c t
The basic reproduction number R0 and the effective reproduction number R are pivotal parameters ininfectious disease epidemiology, quantifying the transmission potential of an infection in a population.We estimate both parameters from 13 pre-vaccination serological data sets on varicella zoster virus (VZV)in 12 European countries and from population-based social contact surveys under the commonly madeassumptions of endemic and demographic equilibrium. The fit to the serology is evaluated using theinferred effective reproduction number R as a model eligibility criterion combined with AIC as a modelselection criterion. For only 2 out of 12 countries, the common choice of a constant proportionality fac-tor is sufficient to provide a good fit to the seroprevalence data. For the other countries, an age-specificproportionality factor provides a better fit, assuming physical contacts lasting longer than 15 min area good proxy for potential varicella transmission events. In all countries, primary infection with VZVmost often occurs in early childhood, but there is substantial variation in transmission potential withR0 ranging from 2.8 in England and Wales to 7.6 in The Netherlands. Two non-parametric methods, the
maximal information coefficient (MIC) and a random forest approach, are used to explain these differ-ences in R0 in terms of relevant country-specific characteristics. Our results suggest an association withthree general factors: inequality in wealth, infant vaccination coverage and child care attendance. Thisillustrates the need to consider fundamental differences between European countries when formulatingand parameterizing infectious disease models.© 2015 The Authors. Published by Elsevier B.V. This is an open access article under the CC BY-NC-NDlicense (http://creativecommons.org/licenses/by-nc-nd/4.0/).
ntroduction
One of the key measures of infectious disease transmission is theasic reproduction number R0: the expected number of secondaryases per primary case in a “virgin” population (Diekmann et al.,990). If R0 is larger than 1 the infection may become endemic
nd the larger R0, the more effort is required to eliminate thenfection from the population. Although R0 is a useful theoreticaleasure, it is rarely observed in practice. The effective reproduction
∗ Corresponding author. Tel.: +32 474927849.E-mail address: [email protected] (E. Santermans).
ttp://dx.doi.org/10.1016/j.epidem.2014.12.005755-4365/© 2015 The Authors. Published by Elsevier B.V. This is an open access article un
number R takes pre-existing immunity into account and thusreflects the average number of secondary cases that can be observedin a partially immune population. There are several methods toestimate R0 and R (Vynnycky and White, 2010). In this article, wefocus on deriving R0 from transmission rates that can be estimatedfrom serological data under the assumption of endemic equilib-rium (Anderson and May, 1991). A disease in endemic equilibrium,or steady state, may undergo cyclical epidemics, but fluctuatesaround a stationary average over time. Whitaker and Farrington
(Whitaker and Farrington, 2004a) have shown that the impact ofregular epidemic cycles, displayed by many childhood infections,can be ignored when estimating R0. In this equilibrium setting, eachinfectious individual infects one other individual on average, henceder the CC BY-NC-ND license (http://creativecommons.org/licenses/by-nc-nd/4.0/).

Epidem
RtR
zehebpVcirtmatgwz
VpavpbnRa(trmictb‘e2
ettitptReFsbmf
atdu“msd
E. Santermans et al. /
is expected to be equal to 1 (Diekmann et al., 1990). Again, if R > 1he infection will continue to spread in the population whereas if
< 1 the infection will die out.We consider pre-vaccination serological data for the varicella
oster virus (VZV) from 12 different European countries (Nardonet al., 2007). VZV is one of the eight known herpes viruses that affectumans. Primary infection with VZV results in varicella (chick-npox) and mainly occurs in childhood. In general, the disease isenign, however, symptoms may be more severe in adults and com-lications may occur when varicella is acquired during pregnancy.ZV is highly contagious and transmitted through direct closeontact with lesions or indirectly through air droplets contain-ng virus particles. The incubation period following VZV infectionanges from 13 to 18 days and each infected person transmitshe virus for about 7 days. The antibody response following pri-
ary infection with VZV is believed to induce lifelong protectiongainst chickenpox. However, the virus remains dormant withinhe body and may reactivate and give rise to herpes zoster (or shin-les) after years to decades (Miller et al., 1993). In this article, weill focus on primary infection and ignore reactivation leading to
oster.Estimating transmission rates for an airborne infection such as
ZV requires assumptions on the underlying age-specific mixingatterns and R0 has been shown to be highly sensitive to thesessumptions (Greenhalgh and Dietz, 1994). Indeed, serological sur-eys do not provide complete information about these mixingatterns, since they reflect the rate at which susceptible individualsecome infected, but not who is infecting whom. This indetermi-acy prevents assessment of the validity of the mixing pattern.ecently, attempts have been made to deal with this unidentifi-bility by exploiting knowledge about the route of transmissionFarrington et al., 2001; Unkel et al., 2014). However, this relies onhe strong assumption that infections are transmitted via the sameoute. The extent to which different routes of transmission competeay only be verified by additional data collection. In this article, we
nform the mixing pattern with data from population-based socialontact surveys and assume that transmission rates are propor-ional to contact rates. Social contact data have already proven toe a valuable additional source of information when estimating the
Who Acquires Infection From Whom’ (WAIFW) matrix and R0 (see.g. Wallinga et al., 2006; Ogunjimi et al., 2009; Goeyvaerts et al.,010).
We use the inferred effective reproduction number as a modelligibility criterion combined with AIC as a model selection cri-erion. To our knowledge, Wallinga et al. (2001) were the firsto use the effective reproduction number to asses the plausibil-ty of different mixing patterns. However, this is the first timehat R is explicitly used as a determinant in the model selectionrocedure. We evaluate how constant and age-specific propor-ionality factors affect the fit to the serology and the estimated0 values. Moreover, we assess the effect of age-specific het-rogeneity related to infectiousness on model eligibility and fit.urther, from a selected set of demographic, socio-economic andpatio-temporal factors, we explore which factors best explain theetween-country heterogeneity in R0 using two non-parametricethods: the maximal information coefficient (MIC) and random
orest.The article is organized as follows. In Section “Materials
nd methods”, a description of the serological and social con-act surveys is provided, after which we elaborate on theynamic model structure, estimation procedure and methodssed to determine potential risk factors for varicella. In Section
Results”, we present the estimates of R0 and R under variousodel assumptions, and the results of the risk factor analy-is. Finally in Section “Discussion”, the models and results areiscussed.
ics 11 (2015) 14–23 15
Materials and methods
Data
Serological data. In this article, we reanalyze the ESEN2 (Euro-pean Sero-Epidemiology Network) data on VZV published byNardone et al. (2007) together with newly available serologyfor Poland and Italy, totaling 13 serosurveys from 12 differentcountries including two samples from Italy (see Table 1). At the timeof sera collection, which varied between 1995 and 2004, none ofthe participating countries had introduced a universal VZV vaccina-tion program. Blood samples were tested using an enzyme-linkedimmunosorbent assay (ELISA), thereby classifying the samples asseropositive or seronegative (equivocal results were included asseropositive). Classification is based on the observed antibody levelas compared to the cut-off level specified by the manufacturerof the test. Sample sizes range from 1268 for Poland to 4398 forGermany, with substantial variability between the surveyed ageranges.
Social contact survey. The spread of airborne or close-contactinfections in a population is driven by social contacts between indi-viduals. Recently, several studies were conducted to measure socialmixing behavior, and Read et al. (2012) present a review of the dif-ferent methodologies employed. The cross-sectional diary-basedsurveys that were conducted between May 2005 and September2006 as part of the POLYMOD project, constituted the first large-scale prospective study to investigate social contact behavior ineight European countries (Mossong et al., 2008). Participants wererecruited through random-digit dialing, face-to-face interviewsor population registers, and completed a diary about their socialcontacts during one randomly assigned day. Participants wereasked to record the age and gender of each contacted person,plus location, duration and frequency of the contact. Further, adistinction between two types of contact was made: non-close con-tacts, defined as two-way conversations of at least three words ineach others proximity, and close contacts that involve any sort ofphysical skin-to-skin touching. For an extensive description of thesurvey, we refer to Mossong et al. (2008).
Estimating the basic and effective reproduction number
Force of infection and mass action principle. To describeVZV transmission dynamics, a compartmental MSIR (Maternalprotection-Susceptible-Infected-Recovered) model for a closedpopulation of size N with fixed duration of maternal protectionA is considered, following Goeyvaerts et al. (2010) and Ogunjimiet al. (2009). Doing so, we explicitly take into account the fact thatnewborns are protected by maternal antibodies and do not takepart in the transmission process. We assume that mortality due toinfection can be ignored, which is plausible for VZV in developedcountries, and that infected individuals maintain lifelong immu-nity to varicella after recovery. Further, demographic and endemicequilibria are assumed, which means that the age-specific popula-tion sizes remain constant over time and that the disease is in anendemic steady state at the population level. Under these assump-tions the age-specific prevalence �(a) is given by:
�(a) = 1 − e−∫ a
A�(u) du
,
where �(a) is the age-specific force of infection, i.e. the rate at whicha susceptible person of age a acquires infection. There is a widerange of methods available to estimate �(a) from seroprevalence
data, see Hens et al. (2010) for an historical overview.Since we aim to estimate the basic and effective reproductionnumber for VZV, we disentangle the force of infection further tothe level of age-specific transmission rates. Let ˇ(a, a′) denote the

16 E. Santermans et al. / Epidemics 11 (2015) 14–23
Table 1Overview of the serological data and demographic parameters.
Country Data collection Age range (years) Sample size Life expectancy (years) Population size
Belgium (BE) 2001–2003 0–71.5 3251 77.6 10,309,722Germany (DE) 1995/1998 0–79 4398 77.1 82,050,377Spain (ES) 1996 2–39 3590 77.5 39,427,919England and Wales (EW) 1996 1–20.9 2032 76.0 51,125,400Finland (FI) 1997–1998 1–79.8 2471 76.7 5,146,965Ireland (IE) 2003 1–60 2430 77.6 3,963,814Israel (IL) 2000–2001 0–79 1543 76.2 6,223,842Italy (IT’97) 1996–1997 0.1–50 3110 78.2 56,872,349Italy (IT’04) 2003–2004 1–79 2446 80.3 5,788,0478Luxembourg (LU) 2000–2001 4–82 2640 77.2 438,723
amtccr
�
wssa
(d
G
po
aasafidictow(ta
ˇ
waaa
tcM
The Netherlands (NL) 1995–1996 0–79
Poland (PL) 1995–2004 1–19
Slovakia (SK) 2002 0–70
verage per capita rate at which an infectious individual of age a′
akes effective contact with a susceptible person of age a, per unitime. The key principle behind the estimation of ˇ(a, a′) is the so-alled mass action principle. If the mean infectious period D is shortompared to the timescale on which transmission and mortalityates vary, the force of infection can be approximated by:
(a) ≈ ND
L
∫ ∞
A
ˇ(a, a′)�(a′)s(a′)m(a′) da′, (1)
here N denotes the total population size, L the life expectancy,(a) the proportion of people in the population of age a that areusceptible, and m(a) = exp{−
∫ a
0�(t) dt} the survivor function at
ge a with age-specific mortality �(a).Given the transmission rates ˇ(a, a′), following Diekmann et al.
1990), the basic reproduction number R0 can be calculated as theominant eigenvalue of the next generation operator given by
(a, a′) = ND
Lm(a)ˇ(a, a′).
The effective reproduction number R takes into account the pro-ortion of susceptible individuals and is the dominant eigenvaluef G(a, a′) × s(a).
Mixing assumptions. Since �(a) is a one-dimensional function ofge and ˇ(a, a′) makes up a two-dimensional function, additionalssumptions are necessary to estimate the transmission rates fromeroprevalence data using the mass action principle. The traditionalpproach of Anderson and May (Anderson and May, 1991) strati-es the population into a small number of age classes and imposesifferent mixing patterns upon ˇ(a, a′). This is the approach taken
n the exploratory analysis of Nardone et al. (2007). However, thehoice of the structure imposed on the WAIFW matrix as well ashe choice of the age classes are ad hoc and impact the estimationf R0 (Greenhalgh and Dietz, 1994; Van Effelterre et al., 2009). Weill consider a more recent approach as proposed by Wallinga et al.
2006), by informing ˇ(a, a′) with data on social contacts. This is alsohe approach taken by Goeyvaerts et al. (2010) who express ˇ(a, a′)s
(a, a′) = q(a, a′) · c(a, a′),
here c(a, a′) is the per capita rate at which an individual of age′ makes contact with a person of age a, per unit of time, and q(a,′) a proportionality factor that may capture, among other effects,ge-specific susceptibility and infectivity.
In this article, we contrast the constant proportionality assump-ion, commonly used in the literature and referred to as “the socialontact hypothesis” (Wallinga et al., 2006; Ogunjimi et al., 2009;elegaro et al., 2011), against a log-linear function of the age of the
1967 77.0 15,493,8891268 73.2 38,637,1843515 73.2 5,378,702
susceptible individual, which entailed an improvement of model fitfor VZV in Belgium (Goeyvaerts et al., 2010), that is respectively:
log{q(a, a′)} = �0 and log{q(a, a′)} = �0 + �1a. (2)
The contact rates c(a, a′) are estimated from the POLYMODcontact survey using a bivariate smoothing approach, consideringthose contacts with skin-to-skin touching lasting at least 15 minsince these contacts have been shown to be most predictive for VZV(Goeyvaerts et al., 2010; Melegaro et al., 2011). For the countrieswho participated in the POLYMOD project, the corresponding con-tact rates were used, whereas for the other countries contact data ofa neighboring country or a country with similar school enrollmentages were used (cf. Table 3 in Supplementary Material). We presenta sensitivity analysis in the Supplementary Material to comparethese ad-hoc choices with a more objective selection of contactdata by means of AIC. In this analysis, we repeat the estimationprocedure for each country seven times, each time for a differentcontact matrix, and select, per country, from these seven analyses,the one that results in the best fit to the serological data. We observethat the effect on R0 remains within reasonable bounds, which indi-cates that the choice of contact data has limited influence on ourestimates.
Estimation procedure. In this article we will estimate the force ofinfection using maximum likelihood estimation with the Bernouillilog-likelihood given by:
�(�; y, a) =n∑
i=1
yi log(1 − e−∫ ai
A�(u) du
) + (1 − yi)(−∫ ai
A
�(u) du).
(3)
Here, n denotes the size of the serological data set and yi denotesa binary variable indicating whether subject i had experiencedinfection before age ai. The transmission rates cannot be estimatedanalytically since the integral Eq. (1) has no closed form solution.However, it is possible to solve this numerically by turning to a dis-crete age framework, assuming a constant force of infection in each1-year age interval. Now, estimation proceeds as follows: startingvalues for the parameters are provided after which the discretizedmass action principle is iterated until convergence and finally, theresulting estimate of the force of infection is contrasted to theserology using the log-likelihood (3). To calculate 95% confidenceintervals, non-parametric bootstraps are performed on both thecontact data and the serological data to account for all sources ofvariability (Goeyvaerts et al., 2010). The number of bootstrap sam-ples per country is fixed at 2000 with convergence rates varying
between 62% and 100%.Since some countries lack serological data on VZV in the olderage groups, the original serology is augmented with simulated datato avoid excess variability of the bootstrap estimates (Goeyvaerts
Epidemics 11 (2015) 14–23 17
ebcstsaclcstu2
tynhA(
rafehpnnh
l
waispca
q
waicvvvtd
E
acwapb
cv
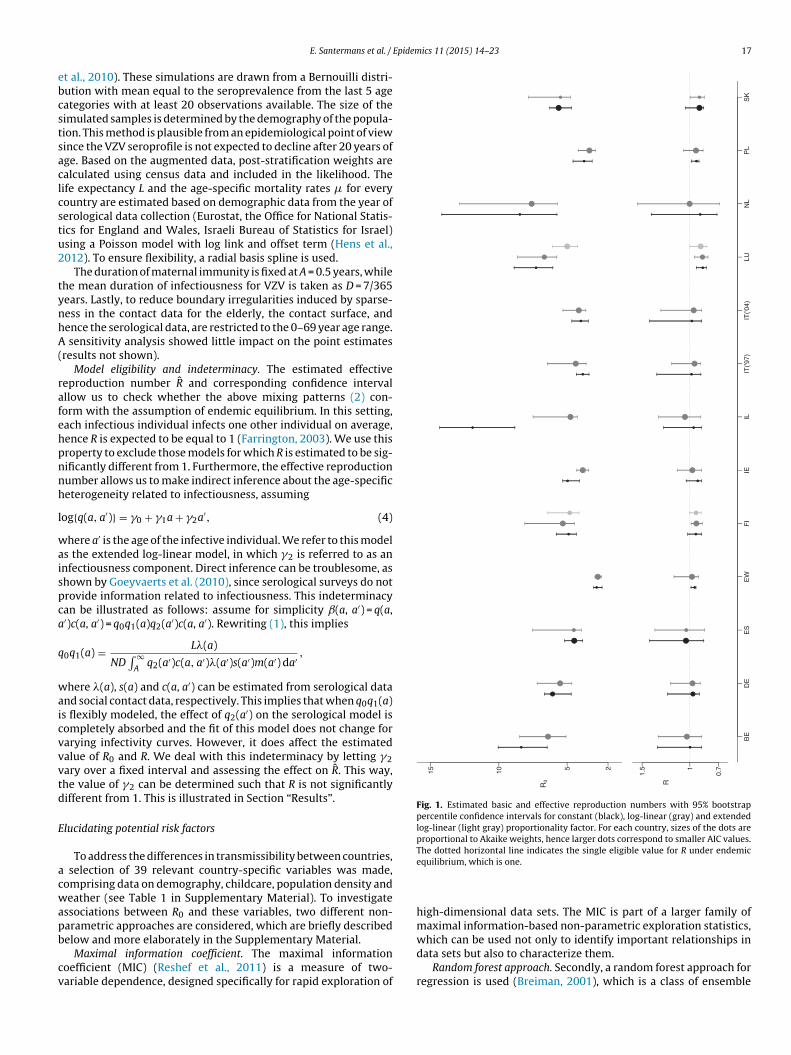
Fig. 1. Estimated basic and effective reproduction numbers with 95% bootstrappercentile confidence intervals for constant (black), log-linear (gray) and extendedlog-linear (light gray) proportionality factor. For each country, sizes of the dots areproportional to Akaike weights, hence larger dots correspond to smaller AIC values.The dotted horizontal line indicates the single eligible value for R under endemic
E. Santermans et al. /
t al., 2010). These simulations are drawn from a Bernouilli distri-ution with mean equal to the seroprevalence from the last 5 ageategories with at least 20 observations available. The size of theimulated samples is determined by the demography of the popula-ion. This method is plausible from an epidemiological point of viewince the VZV seroprofile is not expected to decline after 20 years ofge. Based on the augmented data, post-stratification weights arealculated using census data and included in the likelihood. Theife expectancy L and the age-specific mortality rates � for everyountry are estimated based on demographic data from the year oferological data collection (Eurostat, the Office for National Statis-ics for England and Wales, Israeli Bureau of Statistics for Israel)sing a Poisson model with log link and offset term (Hens et al.,012). To ensure flexibility, a radial basis spline is used.
The duration of maternal immunity is fixed at A = 0.5 years, whilehe mean duration of infectiousness for VZV is taken as D = 7/365ears. Lastly, to reduce boundary irregularities induced by sparse-ess in the contact data for the elderly, the contact surface, andence the serological data, are restricted to the 0–69 year age range.
sensitivity analysis showed little impact on the point estimatesresults not shown).
Model eligibility and indeterminacy. The estimated effectiveeproduction number R̂ and corresponding confidence intervalllow us to check whether the above mixing patterns (2) con-orm with the assumption of endemic equilibrium. In this setting,ach infectious individual infects one other individual on average,ence R is expected to be equal to 1 (Farrington, 2003). We use thisroperty to exclude those models for which R is estimated to be sig-ificantly different from 1. Furthermore, the effective reproductionumber allows us to make indirect inference about the age-specificeterogeneity related to infectiousness, assuming
og{q(a, a′)} = �0 + �1a + �2a′, (4)
here a′ is the age of the infective individual. We refer to this models the extended log-linear model, in which �2 is referred to as annfectiousness component. Direct inference can be troublesome, ashown by Goeyvaerts et al. (2010), since serological surveys do notrovide information related to infectiousness. This indeterminacyan be illustrated as follows: assume for simplicity ˇ(a, a′) = q(a,′)c(a, a′) = q0q1(a)q2(a′)c(a, a′). Rewriting (1), this implies
0q1(a) = L�(a)
ND∫ ∞
Aq2(a′)c(a, a′)�(a′)s(a′)m(a′) da′ ,
here �(a), s(a) and c(a, a′) can be estimated from serological datand social contact data, respectively. This implies that when q0q1(a)s flexibly modeled, the effect of q2(a′) on the serological model isompletely absorbed and the fit of this model does not change forarying infectivity curves. However, it does affect the estimatedalue of R0 and R. We deal with this indeterminacy by letting �2ary over a fixed interval and assessing the effect on R̂. This way,he value of �2 can be determined such that R is not significantlyifferent from 1. This is illustrated in Section “Results”.
lucidating potential risk factors
To address the differences in transmissibility between countries, selection of 39 relevant country-specific variables was made,omprising data on demography, childcare, population density andeather (see Table 1 in Supplementary Material). To investigate
ssociations between R0 and these variables, two different non-arametric approaches are considered, which are briefly described
elow and more elaborately in the Supplementary Material.Maximal information coefficient. The maximal informationoefficient (MIC) (Reshef et al., 2011) is a measure of two-ariable dependence, designed specifically for rapid exploration of
equilibrium, which is one.
high-dimensional data sets. The MIC is part of a larger family ofmaximal information-based non-parametric exploration statistics,
which can be used not only to identify important relationships indata sets but also to characterize them.Random forest approach. Secondly, a random forest approach forregression is used (Breiman, 2001), which is a class of ensemble

1 Epidemics 11 (2015) 14–23
mttopco–ttrTcmi
yoaccc
R
cpan9Stdmt
ieAaBNplebo
feit1dsaetc
eatm
Table 2Ten factors with the largest MIC value of association with R0, estimated from thefinal model selected for each country, and corresponding Spearman correlationcoefficients �S .
MIC �S
1. Inequality of income distribution 1.0 −0.642. Poverty rate 1.0 −0.733. % infants vaccinated against mumps 0.65 0.644. average square meter living area pp 0.59 0.425. % breast feeding at 3 months 0.47 −0.216. % employed women 25–49 (min. 1 child 0–5) 0.46 0.387. % infants vaccinated against pertussis 0.38 0.468. % infants vaccinated against rubella 0.36 0.51
8 E. Santermans et al. /
ethods – methods that generate many classifiers and aggregateheir results – specifically designed for classification and regressionrees. Each tree is constructed using a different bootstrap samplef the data and each node is split using the best among a subset ofredictors randomly chosen at each node. Compared to many otherlassifiers, this turns out to perform very well and is robust againstverfitting (Breiman, 2001). In addition, it has only two parameters
the number of variables in the random subset at each node andhe number of trees in the forest – and is usually not very sensi-ive to their values. We use the random forest algorithm from theandomForest package in R with the default number of trees (500).he number of split variables is selected such that the highest per-entage explained variance is obtained. The package produces twoeasures of importance of the predictor variables: “mean decrease
n accuracy” and “mean decrease in node purity”.Sensitivity analysis. To test the sensitivity of this risk factor anal-
sis, we applied the MIC and random forest approach to estimatesf R0 when using the best fitting contact matrix. This sensitivitynalysis is included in the Supplementary Material. We can con-lude that the risk factor analysis is quite robust to changes in theontact matrix, as the most important influential factors do nothange.
esults
Basic and effective reproduction number. We apply the socialontact data approach with a constant and age-specific log-linearroportionality factor, as in (2), to the 13 serological data setsvailable for VZV. The estimated basic and effective reproductionumbers for both models are presented in Fig. 1 together with5% bootstrap percentile confidence intervals (also in Table 3 inupplementary Material). The size of the dots are proportionalo the Akaike weights (see Supplementary Material), hence largerots correspond to smaller AIC values. These estimates are supple-ented with estimates of the mean age at infection in Table 3 in
he Supplementary Material.Models are classified as eligible based on the 95% confidence
nterval for the effective reproduction number, and eligible mod-ls are compared by means of AIC. When the model with lowestIC value is eligible, this model is selected. This results in thege-specific log-linear proportionality factor being preferred forelgium, Denmark, England and Wales, Ireland, Israel, Italy, Theetherlands and Poland. For Spain and Slovakia, the constant pro-ortionality factor is sufficient to provide a good fit. For Finland, the
og-linear model is preferred in terms of AIC, but this model is notligible, whereas for Luxembourg, both models are not eligible. Inoth cases, the constant and basic log-linear model are not capablef providing a good fit to the data.
Therefore, we consider the extended log-linear model in (4)or Finland and Luxembourg. Fig. 2 presents the profile likelihoodstimates of R0 and R as a function of �2. We observe that byncluding an infectiousness component in the proportionality fac-or, the effective reproduction number R can be estimated closer to. Note that the estimate of R0 decreases quite substantially withecreasing �2, in contrast to an increase in R. This reverse relationeems counter-intuitive, but is caused by an interplay between q(a,′) and s(a). Now, by performing a non-parametric bootstrap forvery value of �2 on a specific grid, it is possible to determinehe maximal value of �2 such that 1 is within the 95% bootstraponfidence interval of R. This is illustrated in Fig. 3.
The parameter estimates and confidence intervals for the
xtended log-linear model based on these maximal values of �2re also displayed in Fig. 1. We observe the following: for Finland,he extended model has an improved fit compared to the constantodel and is conform with the endemic equilibrium assumption.
9. % population aged 0–14 0.32 −0.2210. Total health expenditure 0.32 0.51
For Luxembourg, only the extended model is eligible, and in addi-tion, it has the lowest AIC value. Note that the estimate of R0 forLuxembourg decreases considerably.
The estimated seroprevalence curves based on the selectedmodel for each country are presented in Figs. 4 and 5. The fittedseroprofiles show a similar pattern across countries, with mostinfections occurring during early childhood and the estimatedprevalence approaching one as age increases. However, the preva-lence does not reach one in all countries and, for example, Italy hasa more particular profile. Looking at the FOI curves, the largest esti-mate is observed in the Netherlands (0.57 year−1) at the age of 5,followed by Luxembourg (0.49 year−1). The largest estimate of R0is obtained for The Netherlands (7.60) and the lowest for Englandand Wales (2.75). 11 out of 13 countries have R0 estimated below6.
Risk factors. There is considerable variation in estimated basicreproduction numbers, and hence in transmissibility, among thecountries under consideration. Therefore, we aim to explain thesedifferences by applying the MIC and random forest approach on aselected set of 39 relevant country-specific factors (Tables 1 and 2in Supplementary Material). Table 2 in the Supplementary Mate-rial contains the pairs of potential risk factors with the strongestcorrelation given by the Spearman correlation coefficient. Thesecorrelations can be used to interpret the relation between R0 andcertain factors.
The ten factors with the largest MIC of association with R0, arepresented in Table 2 together with the corresponding Spearmancorrelation coefficients. This implies, for example, that the higherthe inequality of income, the lower R0. Results of the random for-est analysis of R0 are summarized in Table 3 where the ten highestscoring factors for both importance measures are given. Comparingthe results of both analyses, we observe that factors related to thedistribution of wealth (inequality of income and poverty rate), vac-cination coverage in infants (e.g. mumps vaccination coverage) andchild care attendance (e.g. the percentage of infants that receive noformal care) seem to be associated with the transmissibility of VZV.
Discussion
In this article, we investigated the transmissibility of VZV in 12European countries using serological survey data and social contactdata. We contrasted the social contact hypothesis, which is cur-rently the most used approach in the literature, against an approachreflecting differences in characteristics related to susceptibilityand infectivity. Furthermore, we introduced the effective repro-duction number as a model eligibility criterion and we identifiedwhich country-specific socio-demographic factors are important
in explaining differences in transmission potential between Euro-pean countries using two non-parametric approaches: the maximalinformation coefficient and random forest.
E. Santermans et al. / Epidemics 11 (2015) 14–23 19
Fig. 2. Profile likelihood estimates of R0 (left axis) and R (right axis) as a function of �2, the parameter related to infectiousness, for Finland and Luxembourg.
Fig. 3. Profile likelihood estimates of R (dots) with interpolated 95% bootstrap percentile confidence intervals (dashed lines) as a function of �2, the parameter related toinfectiousness, for Finland and Luxembourg. The vertical dotted line indicates the value of �2 for which the upper confidence limit of R equals 1 (horizontal dotted line).
Table 3Ten best scoring factors obtained by a random forest analysis of R0, estimated from the final selected model for each country, and corresponding Spearman correlationcoefficients �S .
% increase in MSE �S Increase in node purity �S
1. Inequality of income distribution −0.64 Inequality of income distribution −0.642. Poverty rate −0.73 Poverty rate −0.733. Total health expenditure 0.51 Average population density 0.334. % 0–2 that receive no formal care −0.29 % 0–2 that receive no formal care −0.295. % infants vaccinated against mumps 0.64 Unmet medical needs −0.316. % population aged 0–14 −0.22 Total health expenditure 0.517. % employed women (min. 1 child 0–5) 0.38 Enrollment rates children 0–2 0.158. Average square meter living area pp 0.42 Average square meter living area pp 0.429. Average population density 0.33 % 65+ vaccinated against influenza −0.1910 Enrollment rates children 0–2 0.15 % infants vaccinated against mumps 0.64

20 E. Santermans et al. / Epidemics 11 (2015) 14–23
Figs. 4 and 5. Observed age-specific VZV seroprevalence (dots) and the profile estimated from the final model selected for each country (solid line). The corresponding forceof infection estimates are displayed by the lower solid line.

E. Santermans et al. / Epidemics 11 (2015) 14–23 21
Figs. 4 and 5. (Continued).
2 Epidem
VcaeTamuHsidde
EdsmamouRfeihS
otvpibactfivehe
wmFtsoeimsciiwtpMnbo
2 E. Santermans et al. /
The social contact hypothesis provided a good fit to theZV seroprevalence for only 2 out of 12 countries. The otherountries benefited from an extended approach by assuming ange-dependent proportionality factor, which supports and extendsarlier findings of Goeyvaerts et al. (2010) for VZV in Belgium.his may reflect the additional importance of age-specific char-cteristics related to susceptibility and infectiousness, such as theean infectious period. Furthermore, the social contact data are
sed as proxies for events by which an infection is transmitted.ence, the proportionality factor can also be considered as an age-
pecific adjustment factor relating the true contact rates underlyingnfection to the social contact proxies. Alternatively, social data areifficult to collect from young children, with parents filling out theiary on their behalf. It may well be that they consistently under-stimate the true number of contacts that young children make.
Our analysis directly improves upon the original analysis of theSEN2 data on VZV by Nardone et al. (2007) who used the tra-itional Anderson and May approach by imposing a 3-parametertructure on the WAIFW matrix (Anderson and May, 1991). Ourethod of using R as a model eligibility criterion extends the
pproach of Goeyvaerts et al. (2010) by addressing the indeter-inacy of the infectivity parameter. Our results complement those
f Melegaro et al. (2011) who analyzed part of the VZV serologysing the social contact hypothesis only. Comparing the estimated0 values, we notice that our results in general somewhat differrom the estimates obtained by Nardone et al. (2007) and Melegarot al. (2011). This is not unexpected, since there are differencesn methodology and it is known that transmission assumptionsave a large impact on the estimation of R0. See Table 4 in theupplementary Material for a comparative overview of the results.
The results in Fig. 1 indicate that there are substantial epidemi-logical differences between European countries. This is importanto consider when parametrizing mathematical models. Childhoodaccination coverage (for different vaccines), child care attendance,opulation density and average living area per person were pos-
tively associated with R0, whereas income inequality, poverty,reast feeding, and the proportion of children under 14 years ofge showed negative associations. While it seems intuitively logi-al that greater child care attendance and population density leado more rapid spread of varicella, other associations are more dif-cult to interpret. Less poverty and income inequality, and higheraccination coverages may be associated with more affluent soci-ties in which women are more likely to be employed and childrenave more universal access to childcare and kindergarten from anarly age on, facilitating the spread of VZV.
In our analyses, we relied on a few assumptions. First of all,e assumed that the serological status of an individual is a directeasure of his/her current immunity against VZV (Plotkin, 2010).
urther, we considered physical contacts lasting longer than 15 mino be a good proxy for potential varicella transmission events ashown by Goeyvaerts et al. (2010) for Belgium. Finally, our usef R as a model eligibility criterion relied on the assumption ofndemic equilibrium. This assumption is supported by the similar-ty in the results obtained for the two samples of Italy. In addition
ost surveys span two seasons, which partly captures any sea-onal fluctuation. However, there are many factors that can causehanges in the age distribution of VZV cases over time, e.g. changesn demography, medical practice, socio-cultural factors etc. Look-ng at this more rigorously requires an additional in-depth analysis
hich is the topic of future research. However, to get a sense ofhe way R̂ changes when demographic or endemic equilibrium areerturbed, we present a sensitivity analysis in the Supplementary
aterial. We observe that R̂ increases when a percentage of theewborns would have been vaccinated and when the number ofirths would be increasing. It decreases when the annual numberf births would decrease.
ics 11 (2015) 14–23
Since direct inference for the infectivity parameter is hinderedby the lack of information regarding infectiousness in the serolog-ical data, we estimated this parameter via indirect inference usingthe effective reproduction number. This indeterminacy illustratesthat the use of social contact data does not completely resolvethe identifiability issues encountered when estimating mixing pat-terns from serological data. Hence, further research is necessary toobtain additional knowledge about the age-specific susceptibilityand infectivity profiles in order to inform the proportionality factorin this social contact approach.
Acknowledgments
ES acknowledges support from a Methusalem research grantfrom the Flemish Government. NG is beneficiary of a postdoctoralgrant from the AXA Research Fund. NH acknowledges support fromthe Antwerp University scientific chair in Evidence-Based Vacci-nology, financed in 2009–2014 by an unrestricted gift from Pfizer.AM is currently receiving funding from the European ResearchCouncil under the European Union’s Seventh Framework Program(FP7/2007-2013)/ERC Starting Grant [Agreement No. 283955]. Sup-port from the IAP Research Network P7/06 of the Belgian State(Belgian Science Policy) is gratefully acknowledged. The computa-tional resources and services used in this work were provided by theHercules Foundation and the Flemish Government – departmentEWI.
This study was initiated as part of POLYMOD, a European Com-mission project funded within the Sixth Framework Programme,Contract number: SSP22-CT-2004-502084.
Appendix A. Supplementary data
Supplementary data associated with this article can befound, in the online version, at http://dx.doi.org/10.1016/j.epidem.2014.12.005.
References
Diekmann, O., Heesterbeek, J.A.P., Metz, J.A.J., 1990. On the definition and the com-putation of the basic reproduction ratio R0 in models for infectious diseases inheterogeneous populations. J. Math. Biol. 28, 365–382.
Vynnycky, E., White, R.G., 2010. An Introduction to Infectious Disease Modelling.Oxford University Press.
Anderson, R.M., May, R.M., 1991. Infectious Diseases of Humans: Dynamics andControl. Oxford University Press, Oxford.
Whitaker, H.J., Farrington, C.P., 2004a. Estimation of infectious disease parametersfrom serological survey data: the impact of regular epidemics. Stat. Med. 23,2429–2443.
Nardone, A., de Ory, F., Carton, M., Cohen, D., van Damme, P., Davidkin, I., Rota, M.C.,et al., 2007. The comparative sero-epidemiology of varicella zoster virus in 11countries in the European region. Vaccine 25, 7866–7872.
Miller, E., Marshall, R., Vurdien, J., 1993. Epidemiology, outcome and control ofvaricella-zoster infection. Rev. Med. Microbiol. 4, 222–230.
Greenhalgh, D., Dietz, K., 1994. Some bounds on estimates for reproductive ratiosderived from the age-specific force of infection. Math. Biosci. 124, 9–57.
Farrington, C.P., Kanaan, M.N., Gay, N.J., 2001. Estimation of the basic reproductionnumber for infectious diseases from age-stratified serological survey data. Appl.Stat. 50, 251–292.
Unkel, S., Farrington, C., Whitaker, H., Pebody, R., 2014. Time varying frailty modelsand the estimation of heterogeneities in transmission of infectious diseases.Appl. Stat. 63, 141–158.
Wallinga, J., Teunis, P., Kretzschmar, M., 2006. Using data on social contacts toestimate age-specific transmission parameters for respiratory-spread infectiousagents. Am. J. Epidemiol. 164, 936–944.
Ogunjimi, B., Hens, N., Goeyvaerts, N., Aerts, M., Van Damme, P., Beutels, P., 2009.Using empirical social contact data to model person to person infectious diseasetransmission: an illustration for varicella. Math. Biosci. 218, 80–87.
Goeyvaerts, N., Hens, N., Ogunjimi, B., Aerts, M., Shkedy, Z., Van Damme, P., Beutels,
P., 2010. Estimating infectious disease parameters from data on social contactsand serological status. Appl. Stat. 59, 255–277.Wallinga, J., Lévy-Bruhl, D., Gay, N., Wachmann, C., 2001. Estimation of measlesreproduction ration and prospects for elimination of measles by vaccination insome Western European countries. Epidemiol. Infect. 127, 281–295.

Epidem
R
M
H
V
E. Santermans et al. /
ead, J., Edmunds, W., Riley, S., Essler, J., Cumming, D., 2012. Close encounters of theinfectious kind: methods to measure social mixing behaviour. Epidemiol. Infect.140, 2117–2130.
ossong, J., Hens, N., Jit, M., Beutels, P., Auranen, K., et al., 2008. Social contacts andmixing patterns relevant to the spread of infectious diseases. PLoS Med. 5 (3),381–391, doi:10.1371/journal.pmed.0050074.
ens, N., Aerts, M., Faes, C., Shkedy, Z., Lejeune, O., Van Damme, P., Beutels, P., 2010.Seventy-five years of estimating the force of infection from current status data.
Epidemiol. Infect. 138, 802–812.an Effelterre, T., Shkedy, Z., Aerts, M., Molenberghs, G., Van Damme, P.,Beutels, P., 2009. Contact patterns and their implied basic reproductivenumbers: an illustration for varicella-zoster virus. Epidemiol. Infect. 137,48–57.
ics 11 (2015) 14–23 23
Melegaro, A., Jit, M., Gay, N., Zagheni, E., Edmunds, W.J., 2011. What types of contactsare important for the spread of infections? Using contact survey data to exploreEuropean mixing patterns. Epidemics 3, 143–151.
Hens, N., Shkedy, Z., Aerts, M., Faes, C., Van Damme, P., Beutels, P., 2012. ModelingInfectious Disease Parameters Based on Serological and Social Contact Data: AModern Statistical Perspective. Springer-Verlag New York Inc.
Farrington, C.P., 2003. Modelling Epidemics. The Open University.Reshef, D.N., Reshef, Y.A., Finucane, H.K., Grossman, S.R., McVean, G., Turnbaugh, P.J.,
Lander, E.S., Mitzenmacher, M., Sabeti, P.C., 2011. Detecting novel associationsin large data sets. Science 334, 1518–1524.
Breiman, L., 2001. Random forests. Mach. Learn. 45, 5–32.Plotkin, S., 2010. Complex correlates of protection after vaccination. Clin. Infect. Dis.
56, 1458–1465.

![ELATIONS CANVAS TM ED OUTCOME HYPOTHESIS … · hypothesis iest assumption iment iment canvas] 2015 measure measure measure tm. ed outcome assumptions hypothesis iest assumption iment](https://static.fdocuments.in/doc/165x107/5f0d30cf7e708231d4391e1e/elations-canvas-tm-ed-outcome-hypothesis-hypothesis-iest-assumption-iment-iment.jpg)