The Smart Social Report V5 - Industry Research on Entertainment, Facebook Reactions, Twitter Bios,...
47
1 The Smart Social Report: Volume Five Report: Volume Five The
-
Upload
spredfast -
Category
Social Media
-
view
150 -
download
0
Transcript of The Smart Social Report V5 - Industry Research on Entertainment, Facebook Reactions, Twitter Bios,...

1The Smart Social Report: Volume Five
Report: Volume Five
The

2The Smart Social Report: Volume Five
Every time we publish the latest edition of the Smart Social Report, we take a step back and wonder, “Wow! Has it really only been a quarter?” This industry doesn’t wait for anyone to catch up: as soon as you’ve got a handle on the last feature release, either a new network launches or an existing one rips its old paradigms to shreds. This isn’t to say that it’s impossible to keep up or achieve excellence, but doing so does require 100% commitment day in, day out.
In our fifth Smart Social Report, we’ve tracked first-quarter performance for 50 major brands who make up our State of Social study. We’ve reviewed the initial data around Facebook Reactions and offer recommendations about how to leverage them; overseas we took a look at how Europeans self-identify in their Twitter bios; we also wanted to know the best ways to repurpose content, so we looked at online publishers to see how they do it so well; and finally, we went to the movies to see how studios communicate with their audiences—and what we can learn from them.
At Spredfast, we connect every company with the people they care about most. Our smart social software takes you to the intersection of decision-making and data. This report is another part of that roadmap–we hope you will stake out new territory with the findings.
Smarter social, every day.
| Jim Rudden | CMO, Spredfast

3The Smart Social Report: Volume Five
The State of Social A survey of 50 brands across 10 verticals
Content & Community Facebook Reactions: Understanding your Audience Beyond the Like
Brands & Consumers Twitter Profiles in Europe: How we Talk about Who We Are
Fan Activation Blockbusters: What Marketers Can Learn from Studio Pros
Building Relevance The Second-Chance Cycle: When and How to Repost Content
04 |
14 |
25 |
33 |
40 |
Table of Contents

4The Smart Social Report: Volume Five
The State of SocialA survey of 50 brands across 10 verticals

5The Smart Social Report: Volume Five
IntroductionThe State of Social is our quarterly check-in with 50 of the top brands in the world and their sophistication across the major social properties. We dive into posting patterns, audience size, response to the brand’s messaging, and complexity of content to find industry-leading brands that all marketers can learn from.
Last quarter, Media, Sports, and Retail were the leading industries in our study. Did they maintain their status this quarter? Let’s dive into the data.

6The Smart Social Report: Volume Five
Audience size: followers, likes, etc.
Consistency of response: time to respond to inbound communication
Post frequency
Use of rich media: images, GIFs, video
Audience engagement: comments, likes, shares, favorites on posted comments
MethodologyWe looked at 50 leading brands in 10 different industries to gauge their maturity across eight of the leading social networks. Brands were measured at the end of December 2015, and will continue to be measured on a quarterly basis to chart growth and sophistication over time.
To evaluate social sophistication, we used a combination of the following metrics, depending on which metrics are available publicly for individual networks:
50Leading Brands
10Different Verticals
8Social
Networks
Sports Takes the Lead Thanks in part to strong growth on Twitter for both the NFL and the Premier League, the Sports industry has overtaken media as the top industry in our study this quarter.
Pinterest and LinkedIn See Momentum Both LinkedIn, helped by strong showings from Financial Services and B2B, and Pinterest, buoyed by solid scores from Retail and Media, showed impressive growth.
Key TakeawaysEven with some shuffling the best brands in social are staying at the top.

7The Smart Social Report: Volume Five
Premier LeagueDuring Q1, the Premier League embraced Snapchat by participating in the network’s Live Stories feature, following in the footsteps of all the other major sports leagues we track. These Live Stories are curated by Snapchat, and include photos and videos from supporters of two teams in a featured match.
VolkswagenBetween Q4 of 2015 and Q1 of 2016 the automaker adjusted their strategy on both Instagram and YouTube. The increased posting volume on both networks also generated positive engagement for the brand. On YouTube, they increased the amount of content posted by 82% and their views per day by 182%.
Across all 50 of the brands we researched, a few stood out for growth in different areas of social.
Top Moving Social Brands
7The Smart Social Report: Volume Five
8The Smart Social Report: Volume Five
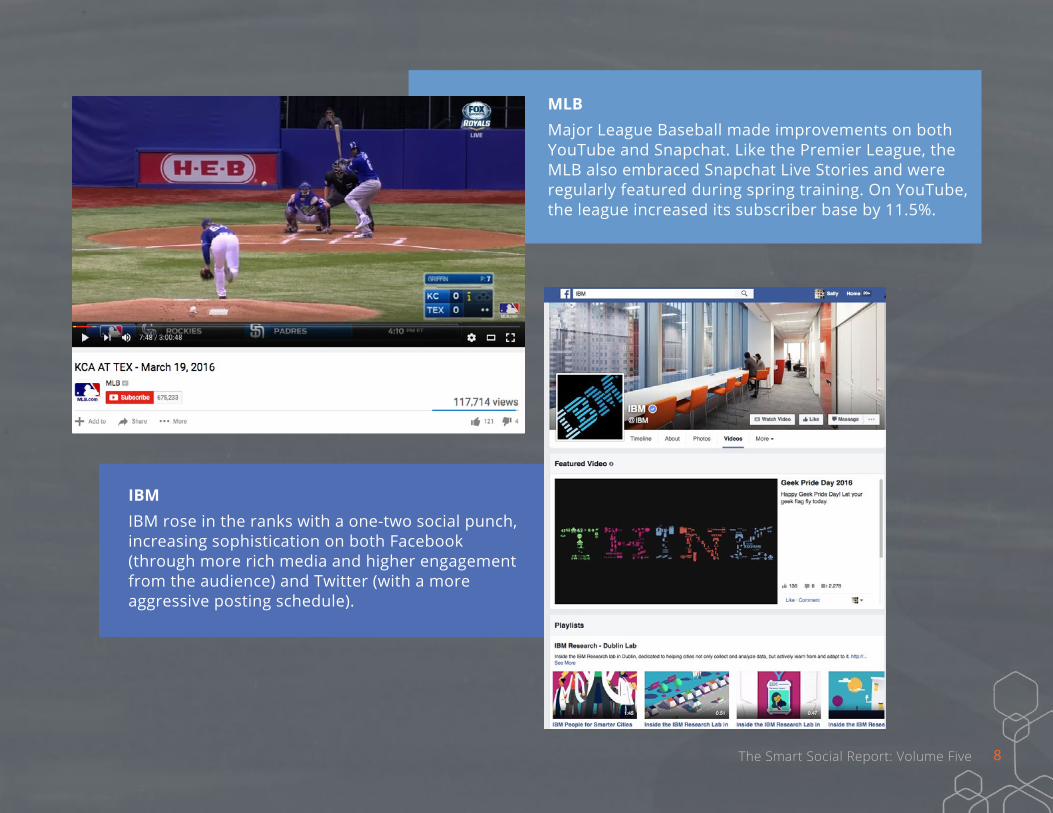
IBMIBM rose in the ranks with a one-two social punch, increasing sophistication on both Facebook (through more rich media and higher engagement from the audience) and Twitter (with a more aggressive posting schedule).
MLBMajor League Baseball made improvements on both YouTube and Snapchat. Like the Premier League, the MLB also embraced Snapchat Live Stories and were regularly featured during spring training. On YouTube, the league increased its subscriber base by 11.5%.
8The Smart Social Report: Volume Five

9The Smart Social Report: Volume Five
• Every league we studied showcased a Snapchat Live Story. These partnerships between the leagues and the social network provided fans with a unique lens on the field and from the stands.
• During the quarter, Sports posted the second-best scores of any industry on Twitter. This was driven primarily by the NFL and the Premier League.
• Sports also led all industries on Instagram. This was enabled by the NHL continuing to outperform its peers on the network.
Back in Q1 of 2015, Sports was the leading industry of the ten that we tracked. This quarter, they find themselves leading again. All of the brands in this industry were either entering playoffs or starting their next season. This frenzy of activity helped drive engagement and performance across their social channels.
Media, Sports, and Retail maintained their positions as leaders in terms of social sophistication across channels. During Q1 of 2016 Sports overtook Media as the most sophisticated industry. Let’s look at some of the top brands within these industries and see what we can learn from their success.
Q4
Top Verticals for Social Maturity
1. Sports

10The Smart Social Report: Volume Five
With super-aggressive content posting patterns and a large, engaged audience, the Media industry fell to the second spot in our study but each of its brands on our list still created great content.
• Media was one of the fastest-rising industries on LinkedIn, with four out of five Media brands seeing a bump in sophistication on the network.
• Netflix earned honors as one of the top individual brands in the entire State of Social study this quarter, with high marks in almost every social channel.
• MTV was one of the top three Tumblr brands in the study, with the most engagement per post on its content of any brand tracked.
Top Verticals for Social Maturity
2. Media
Q4

11The Smart Social Report: Volume Five
• Gap continues to be one of the strongest brands on Tumblr, repeating its top performance from last quarter.
• A combination of Target’s top-two rank in Pinterest follower count and top-three rank in pin volume landed the retailer a spot as a top brand on the channel this quarter.
• Coach was one of the fastest risers on LinkedIn, with the highest engagement rate (comments and likes) for any of the retailers we tracked.
Our collection of Retail brands stayed steady in third place this quarter, still outpacing the Auto industry for overall social sophistication. A few superstar performances helped keep these brands connected with their audiences and top-of-mind in the buying cycle.
Q4
Top Verticals for Social Maturity
3. Retail

12The Smart Social Report: Volume Five
5
6
7
8
9
10
1
3
2
4
Vertical Q4
Social Maturity by Vertical
* FULL BRAND LIST: BofA, Progressive, Citibank, State Farm, Barclays, Pepsi, Crest, Nescafé, Dove, Cadbury, Target, Coach, Victoria's Secret, Gap, Tesco, Hyundai, Mercedes-Benz, Ford, VW, Audi, Hilton, Hyatt, American Airlines, Delta Airlines, British Airways, MTV, ESPN, ABC, Netflix, BBC, NFL, MLB, NBA, Premier League, Apple, Microsoft, Samsung, Sony, EA, IBM, GE, VMWare, Siemens, Accenture, Verizon, AT&T, BT, Orange, T-Mobile

13The Smart Social Report: Volume Five
Sony scored top engagement marks on Facebook videos this quarter, bumping the past champion, Mercedes-Benz, to the number two spot.
BT saw the best Twitter engagement from its audience of any brand in the study with a series of contests, product spotlights, and upcoming television shows that resonated with its audience.
On LinkedIn, Citibank was the top financial services institution in our study, helped by a 52% increase in engagement on the network.
State of Social TakeawaysHow the best can make you better
IBM and General Electric both saw strong performance gains on Tumblr, showing that B2B is finding its groove on the network. The brands improved their performance by 170% and 24% respectively over last quarter.
AT&T saw its performance on YouTube increase relative to its telecom peers. This improvement was based on a 100% increase in views per day and the addition of over 10 million total views to its channel throughout the quarter.
Hilton saw its engagement rates on Instagram rise by 21% during the quarter and this compelling content helped increase its follower base by 30%.
Victoria’s Secret was the fastest-rising brand on Pinterest, thanks to a combination of a growing audience and rising engagement (pinning, liking, and commenting on content).
The most improved automotive brand on LinkedIn was Ford. Its content received 25% more engagement than the brand saw in the previous quarter.

14The Smart Social Report: Volume Five
Facebook ReactionsUnderstanding your Audience Beyond the Like

15The Smart Social Report: Volume Five
Freedom of ChoiceEver felt like ‘liking’ a social post, but worried that expression could be taken the wrong way? In February of 2016, Facebook expanded the potential for users to interact with content across the channel. Reactions have added new dimensions to how individuals and brands alike can receive feedback—both positive and negative—on their published content. This also means marketers can measure success across Facebook in an entirely new way.

16The Smart Social Report: Volume Five
What are ReactionsReactions are made up of six emoji-like expressions that let users add more detail when responding to content beyond the traditional “Like,” which was sometimes an awkward answer to sad news, or a muted response to amazing news. The new Reactions are designed to let people give more detail within a social response, offering up a range of emotions along with any comments.
16

17The Smart Social Report: Volume Five
Here’s a quick breakdown of the Reactions now available in Facebook:
Like A show of support for content or topic. The traditional Reaction and still the default, marketers should continue to expect to see a good number of Likes in their future.
SadCould signal two main expressions from the audience: 1) commiseration along with your brand if the news is of an unfortunate nature or 2) disappointment with your brand or message.
LoveExtreme enthusiasm around a piece of content or topic.
HahaYour audience, laughing along with you.
WowIf the news, video, or other content you are posting includes jaw-dropping action or surprises, this could be seen as a great thing. It’s surprise meets emotion.
AngryJust mad. If an individual is expressing something that angers them it could be seen as joining that movement, but for a brand it’s hardly ever a good thing to see.
We were interested in diving into some early data on how users are interacting with Reactions from a diverse set of content creators. While we assume it will take awhile for awareness and usage of the new functionality to take hold, there can be interesting findings even in the early days of rollout.

18The Smart Social Report: Volume Five
The DataTo check usage of Reactions, we looked at a collection of brands, teams and personalities on Facebook—and their posts since Reactions rolled out. We looked for patterns around Reaction usage across the following content creators:
Sports Drinks: GatoradePowerade Red Bull
Comedians: Conan O’Brien
Ellen DeGeneresSarah Silverman
Celebrities: Kim KardashianDwayne Johnson
Shakira
Sports Teams: The Cleveland Cavaliers
The Dallas CowboysThe Seattle Mariners
How did the new Facebook Reactions measure up? We found some things we expected, but also a few surprises:

19The Smart Social Report: Volume Five
Likes Still Dominate
This is primarily for two reasons:
1. It’s how users have been trained to use the platform for a while now, and changing behaviors, no matter how small, always takes time.
2. Based on the user interface, this is also the first and easiest choice to show support for a piece of content. Selecting the other reactions simply takes more time and effort for the user.
However, just because Likes are the dominant reaction doesn’t mean that users aren’t selecting the other Reactions in many cases.
The overall usage of Reactions across all data points and content types shows a natural inclination for users to select expressions closer to the left-hand side vs. traveling all the way over to the right. Angry and Sad are the least-used Reactions, probably due to a mixture of both their meaning as well as their place in the user interface.
Not surprisingly, the Like is still the preferred method for users to interact with content on Facebook.

20The Smart Social Report: Volume Five
Different Creators See Different PatternsEven given the overall patterns we found, there are some notable standouts to mention.
Sports teams saw the lowest percentage of Reactions, with just over 3% total non-Likes in their response data. But sports fans still responded accordingly to some content.
20The Smart Social Report: Volume Five
When the Cavs posted the results of a lost game, their fans reacted with the highest percentage of the Sad and Angry Reactions we saw in the study. While this can be seen as negative, the positive side of the functionality is that it gave fans an outlet to address their frustration where previously they would have had to Like the content or just move on without any clicks.

21The Smart Social Report: Volume Five
Love Doesn’t Rule All, but it Does Come in SecondIt seems that users have been waiting for a way to express “more than like,” and we saw the Love Reaction register as the second-most used expression in our study. Shakira saw the highest percentage of Love Reactions from any of the celebrities we looked at, with more than double the average Loves vs. Kim Kardashian.
The Seattle Mariners saw impressive numbers for Love reactions across the board, but especially with posts like this one about new food items available at Safeco Field.
But there is one group of content creators bucking the Reaction trends seen with other content groups: comedians.
The Wow Reaction was in fourth place for usage, but saw especially high adoption by those reacting to Red Bull’s content. Wows represented up to 5% of all Reactions on some Red Bull posts.

22The Smart Social Report: Volume Five
Comedy Shows the Potential of ReactionsContent posted by comedians showed the highest percentage of non-Like Reactions by a wide margin.
Facebook: Non-Like Reactions
0%
Sports Teams Sports Drinks Celebrities Comedians
2%
4%
6%
8%
10%
12%

23The Smart Social Report: Volume Five
Facebook Reactions by Page Type
Not surprisingly, the HaHa Reaction was the biggest one being used to respond to comedic content, but that wasn’t the only expression used more than the other groups we looked at. Comedians also saw the highest averages for Love and Sad (mostly used for tributes to colleagues who had passed away) compared to any other group.
0%
Love HaHa Wow Sad Angry
2%
4%
6%
8%
10%
12%
Sports Teams
Sports Drinks
Celebrities
Comedians

24The Smart Social Report: Volume Five
While it’s still early for Reactions, the data we found hints at a future beyond the one-size-fits-all expression on social media. It’s no surprise that content with personality—whether it’s exciting content from Red Bull or funny content from Conan O’Brien—brings along emotion from the crowd, and now fans have a way to show it. Here are three ways marketers can start taking advantage of Facebook Reactions: Know that Reactions Are Used In Some Situations, But Not In Others:Don’t always expect a wide, diverse set of reactions to all your content. Test the Reactions you receive from different types of content (funny, somber, emotional) to see how your tribe responds.
Leverage the New Content Opportunities that Map to Reactions:This new functionality gives your audience a lot more freedom to respond in different ways, which opens the doors to new types of content. Experiment with new creative ways to elicit the emotions you’re hoping to get from your marketing strategy and see how the audience responds; you may be able to use Reactions to create a post-Like world for your brand.
Weigh Reactions in Different Ways:Begin setting up a more sophisticated analysis plan to include Reactions, and make sure you weigh them differently than the everyday Like. All Reactions are not alike, so craft a smart measurement plan to pull an accurate reading of sentiment, as well as engagement, from your audience.
Reacting to Reactions

25The Smart Social Report: Volume Five
Twitter Profiles in Europe How we Talk about Who We Are

26The Smart Social Report: Volume Five
The Geography of BiographySocial media posts don’t just tell us what people are doing, they show us how people want to be seen. Most aspects of social data are “self-reported,” meaning they rely on the user to frame any given situation through their own eyes. We choose which moments to share, just as we choose the most photogenic camera angle, and just as we exclude pieces of our lives that we’d rather the world not see.
But there’s another aspect to social media that is ripe for insight beyond what people say, and those are the bios that people around the world use to describe themselves. On Twitter, this information is called “profile data,” and includes a 160-character open field (for information like “loves dogs” or “digital marketer”) and free-form location field (resulting in text like “Paris”, “Berlin”, or “the 512”.) This data gives other Twitter users context around who they’re following, points of origin for different opinions, and insight into potential connections. When mined, in aggregate, it can also tell us things about people that we might not be able to otherwise see.

27The Smart Social Report: Volume Five
The Data
Top Profile Terms
We mined the profiles of over 4 million European Twitter accounts to find patterns within language, location, and how different countries represent themselves in their Twitter profile information. We used both indirect search (“just tell us the most frequent terms”) and directed search (“tell me about sports”) to find insights from across Europe.
By looking at the top terms appearing in all profiles, we can start to see patterns for how people in a few countries across Europe self-identify on Twitter. We removed all common words like “and”, “the”, “or”, etc. (called “stop words” in the natural language processing world) that won’t tell us much about the profile data. We then translated terms from each language back into English for an apples-to-apples comparison.
ItalyRank
Love/Lover
Italy/Italian
Music
Life
Web
Student
Rome
Journalist
World
1
2
3
4
5
6
7
8
9
10
Love
Music
Berlin
Germany/German
Life
Impressum
Student
Fan
World
Life
Madrid
Student
Love
World
Music
Reporter
Barcelona
Marketing
Snap/Snapchat
Paris
France/French
Years
Fan
Instagram/Insta
Life
Love
Music
Web
Love/Lover
Life
Music
UK
London
Fan
Views are my own
Student
World
Germany Spain France UK

28The Smart Social Report: Volume Five
LoveAn often-mentioned term, both for the romantic aspect of life as well as passion around certain topics.
Location / National PrideIn every country in the study, people self-identified using geographic terms at both city and country levels. Spain was the only country where cities were listed were in the top ten but country was not.
Life / LifetimePeople mentioning aspects of their worlds (like “information about political life”) or just happy to be here (“love my life,” “life is full — life is awesome!”).
MusicTwitter users associate themselves with being a fan of music, or even declaring allegiance with specific bands or musical acts, across every European country that we looked at.
Student StatusStudents self-identify as such with high frequency in four out of the five countries in our study.
Other Social ChannelsThe country-by-country view of high-frequency profile terms also highlights another phenomenon: pointers to additional social networks. Instagram is mentioned in every country (as is the abbreviated “Insta” in France), and in France Snapchat is the top-mentioned profile term.
We found a lot of similarities—and a lot of differences—between countries when we grouped terms by category.

29The Smart Social Report: Volume Five
Top Profile TermsIn addition to just looking at top terms across all profiles, we examined different themes that are frequently mentioned in Twitter bios. We wanted to see if any patterns existed based on geography and how people describe themselves.
Which country’s user base is more likely to mention their love of sports vs. their family? What country wears their profession on their sleeve, and which one is mostly likely to share their religion with their followers? Let’s find out.
Some of the biggest numbers came from our list of professions in each language (including forty different job roles, titles, and industries). By mining profiles to see how many people mentioned their jobs as part of their bio, we learned that it’s a leading practice in the UK (top terms: “writer,” “work,” “manager,” and “journalist”) where profession mentions are twice as high as Spain, the next-closest country.
Professions in Profiles
0%France Italy Germany Spain UK
2%
4%
6%
8%
10%
14%
12%

30The Smart Social Report: Volume Five
While mentions of sports are a popular topic of conversation for Twitter users across the globe, users in Spain (top terms: “futbol,” “Real Madrid,” and “deporte”) and the UK (top terms: “cycling,” “rugby,” “hockey,” and “football”) lead the pack for percent of users mentioning their favorite sport or team.
Europeans are famous for their love of travel and August holidays, but which country celebrates their love of travel the most in their social profiles? Germany dominates this category, with mentions of “blogger,” “photography,” and “world” occurring the most with the term “travel” (or the German term “reise”).
Sports in Profiles
Travel in Profiles
0%
0%
France
France
Italy
Italy
Germany
Germany
Spain
Spain
UK
UK
1%
1%
2%
2%
3%
3%
4%
4%
5%

31The Smart Social Report: Volume Five
How often do people self-identify with religion? Not as much as other topic areas, for sure. Religion was the lowest percentage category for every European country we looked at, with Spain leading the number of Twitter users including references in their profiles. That’s not the case in the United States, where more people mention their religion in their Twitter profile (2.6%) than sports (1.6%) or travel (1%).
Family can play a big part in our lives, but how much do we use the labels of family (calling ourselves a mom or dad, or mentioning children) in our social profiles? As it turns out: a good amount. In all countries, self-described labels around family beat out sports, with the UK taking the lead (top terms: “family,” “father,” “dad,” and “mother”).
Religion in Profiles
Family in Profiles
0.0%
0%
France
France
Italy
Italy
Germany
Germany
Spain
Spain
UK
UK
0.2%
1%
0.4%
2%
0.6%
3%
0.8%
4%
1.0%
5%

32The Smart Social Report: Volume Five
Slicing social profile data can give us insight into how different cultures and groups act from many new angles: how they speak, the traditions they hold, and their passions. What can a smart look at profile data do for marketers around the globe? Search Beyond the ConversationSearching through the ebb and flow of social chatter can yield valuable, real-time insights for marketers. But when it comes to social data, don’t just stop at what people are talking about. There are plenty of additional data dimensions (profiles, geolocation, time of day, influence, sentiment, and more) that can be mined to get a deeper understanding of the conversation.
Data is Great One-on-One and in AggregateProfile data can be valuable at an individual level to identify influencers and build an audience. But profile data can also be used in aggregate to find patterns for groups that you’re interested in. Go small and big with your data strategy.
Groups within GroupsDon’t treat your audience like one, big, monolithic group. Think of logical buckets to analyze (in this case: language and borders) to look for patterns that allow your targeting and marketing strategies to be smarter and more tailored to the local audience.
Finding Insights Across Borders

33The Smart Social Report: Volume Five
BlockbustersWhat Marketers Can Learn from Studio Pros

34The Smart Social Report: Volume Five
Lights, Camera, PromotionWhat do Star Trek Beyond and Apple’s iPhone 7 have in common? First, they’ll both be out sometime this quarter—July 15 for the next Star Trek film and “early fall” for the iPhone 7. But more specifically, from a marketing lens, they’re both vying for and subject to the same constraints: consumer attention spans.
Every marketer deals with product launches, although few are as well publicized as movie releases. What can social marketers learn from the movie biz pros? And just how brief are their windows of opportunity? What is the shelf-life of a new idea, product, or movie? How can we extend it, or at least make better use of the time we have? We studied conversations around films to determine just how long these interest windows are—and to measure the impact of building on an existing brand versus an original idea.

35The Smart Social Report: Volume Five
Big Budgets & Big AudiencesFor a collection of movies released in the second half of 2015, we tracked conversation around each film on Twitter for the ten weeks before and after the week of release. We also recorded the engagement rates for the official film accounts over the same time frame. Let’s start by getting an idea of how much conversation these films created.
All of these films had audiences engaged, but none were as enthused as fans of Star Wars: The Force Awakens. We adjusted the totals for Star Wars to account for the average conversation level around the franchise, which exists year round, and even with the adjustment there was 389% more conversation than the next most talked about movie–Minions.
Yes, Star Wars: The Force Awakens is currently the third highest grossing film of all time, but even that measure doesn’t entirely cover the sheer volume of Tweets around the franchise. The fourth highest grossing film of all-time, Jurassic World, was also in this data set and had 85% less conversation associated. While there were big differences in overall conversation volume, our next step was to see how that volume trickled or rushed in.
Star Wars*
Minions
Jurassic World
Spectre
Straight Outta Compton
Carol
Hunger Games
Creed
Spotlight
Ant-Man
Inside Out
The Revenant
Steve Jobs
The Martian
Terminator Genisys
MI: Rogue Nation
[...] *
Anomolisa
0 7.5 15 22.5 30
Tweet Volume (Millions)
* [...] The Hateful Eight, Crimson Peak, The Big Short, Sicario, The Good Dinosaur, Tangerine, Son of Saul, Bridge of Spies

36The Smart Social Report: Volume Five
0%
Week -10
Week +2
Week +4
Week +6
Week +8
Week +10
Week -8
Week -6
Week -4
Week -2
Release
25%
50%
75%
100%
Twitter Conversation by Week (Cumulative)
Interest WindowsThe interest window, or the period of time when the majority of conversation takes place, is very short. In the below chart we’ve plotted the cumulative total of conversation by week. We begin ten weeks before the movie's release and continue through ten weeks after.
% of Audience Conversation
% of Studio Content
% of Studio Engagement
• The majority of studio content happens in the two weeks preceding a movie's release. • Studios see the most engagement with their content during the release week. • Half of all audience conversation about a movie takes place during the three weeks after its release.

37The Smart Social Report: Volume Five
New Films vs. Franchises
There is a dramatic difference in overall conversation between new films and franchise properties. Franchises are typically properties that have already demonstrated audience resonance and financial success. For every Tweet about a new film there were 5.4 about a franchise film. This difference remains even when Star Wars is excluded from the dataset, with 2.5 Tweets per franchise film for every new film.
0
Week -10
Week-8
Week-6
Week-4
Week-2
Release Week+2
Week+4
Week+6
Week+8
Week+10
300,000
600,000
900,000
1,200,000Franchise
New Films
Audience Conversation Volume by Week

38The Smart Social Report: Volume Five
While audience conversation followed roughly the same curve, no matter the volume, for both new films and franchises, there was a difference between how many official messages studios published depending on the film type.
Franchise films publish the most content on average during the pre-release phase. Meanwhile, original films publish the most content after their release phase. Audience familiarity gives them more topics to cover more frequently.
0
Pre-Release Release Post-Release
100
200
300
Studio Tweets by Phase and Release Type (Averaged)
Franchise
New Film

39The Smart Social Report: Volume Five
For many of these releases success on social corresponded with success at the box office. However, there is room for improvement.
Here’s how we can all learn from the marketing of these films: Be ProactiveWith a bank of pre-planned responses fans can be persuaded to share more and generate another positive touchpoint. For example, by asking fans what their favorite character is or how many times they’ve seen the film, a studio can open up a conversation and deepen the connection with its audience.
Be PreparedHave enough content ready to run the marathon of a product launch. The marketing machines behind these movies are doing more than just reposting the exact same item. They issue countdowns, teaser clips, quotes from major characters, and links to positive press coverage. Get creative in extending the life of your product release.
Know Your ProductWhen working toward a product launch, keep in mind whether you are creating a new market or expanding on an existing one. If you’re switching from simply updating an existing product to launching an entirely new one, it may require a major shift in mindset to appropriately set engagement and audience benchmarks. Remember, you’re starting from scratch.
Roll the Credits

40The Smart Social Report: Volume Five
The Second-Chance Cycle: When and How to Repost Content

41The Smart Social Report: Volume Five
Timing Really is EverythingMarketers constantly risk getting lost in the shuffle. The timing of a message can be just as important as its content. Individual teams and departments have developed best practices based on their own intuition or what they’ve seen competitors do, but are there other guidelines available?
For example, when planning on republishing an existing message, does it need completely new copy or will the old suffice? With the weekend coming around does the content team need to have new blog posts waiting to go live or is reusing existing assets their best strategy? With all the competing voices is it even possible to determine a signal from the noise?

42The Smart Social Report: Volume Five
MethodologyWe thought some of the answers to these questions might be found within the URLs used every day to drive traffic by large online publishers. They post thousands of links every month and through this repetition and practice are able to benefit from the volume of data provided in response to their efforts. Their behaviors offer a shortcut to understanding best practices around when to both engage and re-engage audiences.
To this end, we gathered 12 months of Tweets from Buzzfeed, The New York Times, Huffington Post, and Hollywood Life on Twitter. Then we opened all the links—more than 170,000 of them—to see when the same web page had been pointed to more than once.
High-Level FindingsLooking at the data as a whole there were a few things that jumped out to us immediately:
• Links Are Essential: 94% of all Tweets contained a link
• Reposting Is Expected: 33% of all links were posted more than once
• The Best Content Gets Reposted: A link that was eventually reposted had 33% higher performance on average on its first run than links which were only posted once

43The Smart Social Report: Volume Five
0
12am 5am 10am 3pm 8pm
600
1200
1800
2400
Publisher posting patterns allow us to infer the best practices for both debuting content and sharing it again. We grouped all of the content that was eventually reposted at least once in our database by hour and if it was the first or second time the link had been shared.
First-run content is predominantly posted in the morning and then peaks around noon. Also at noon, publishers were least likely to be sharing content a second time. Instead, for reposting, there was an initial jump beginning at 3 p.m. and then a steady increase in reposting throughout the evening and into the night.
When Should This Content Be Shared Again?
Let’s look at the patterns for repeat posting of content.
Tweet Volume by Time of Day
Original Post
Repeat Post

44The Smart Social Report: Volume Five
Tweet Volume by Day of Week
0
Sunday Monday Tuesday Wednesday Thursday Friday Saturday
1500
3000
4500
6000
When grouped by day of week, we can see that first-run content is posted most often during work days, reaching its peak on Thursday before falling off. However, when that content is shared again, the pattern is consistent no matter the day of the week—and on the weekend, reposts see twice the volume of original content.
Don’t concentrate important messaging on the weekend. Instead, rely on content that has already performed well and give people who may have been busy the first time around a second chance.
Original Post
Repeat Post

45The Smart Social Report: Volume Five
What About Outliers?
We found that the average link was reposted 2.4 times. But the publishers we studied sometimes posted the same piece of content dozens of times. We looked at the top-performing items—those posted at least ten times within the last year—to see what publishers returned to the most, and why.
Cross-Platform PromotionThe New York Times regularly provided links to their Instagram accounts. These posts performed 11% better than their average content. Always scheduled during workday afternoons, the posts typically highlighted photos from earlier features. Home PagesHuffington Post linked directly to their home page 172 times over the course of our study. This content performed in-line with their average and typically highlighted the main story on their homepage. Breaking News This isn’t a surprise, but live updates for major news events are the most common type of repeatedly shared content.
JobsBuzzfeed routinely retweets their own employees' Tweets about job openings. These perform 81% worse than their typical content, but generally are shared 1-2 times per month—hinting at another business benefit behind the strategy.
Two percent of the links in this dataset pointed to web pages that no longer existed. Work with your web analytics team to determine where these dead links are in your social streams and adjust your site to either redirect to where the content has moved or to new but related content.

46The Smart Social Report: Volume Five
While the content lifespan of online publishers is shorter than, say, retailers or luxury goods producers, it sheds light on larger audience behaviors. Sometimes intuition can lead to the same conclusions, but it’s always best to see if the data bears this out.
Here’s how the content reposting lifecycle can help inform other marketing efforts: Craft Multiple MessagesIt was very uncommon for reposted content to have the same copy as the original messages. These publishers have shown that to maintain interest it’s worth re-messaging content, even if it was already successful. Content that was re-messaged performed 15% better than content that used only one set of copy.
Time AppropriatelyKnowing that content will be reused will help your team to produce multiple images and target specific times of day when audiences are available to view content. At the very least, plan on posting announcements in the morning and afternoon and place older content in the queue during evenings and on the weekends, when people are catching up with their feeds.
Check Back InAnalyze the performance of your content over time and set benchmarks noting when to take it out of the lineup. If you find a previous all-star content item not meeting your average engagement standards, consider waiting longer before reposting the content again, refreshing it entirely, or letting it go and starting a new campaign.
Keeping Content Alive

47The Smart Social Report: Volume Five
Spredfast’s smart social software enables companies to build lasting relationships with today’s digitally connected consumer. Part of that is using social data to make smarter marketing decisions when you plan, execute, and analyze your social efforts.
Spredfast Intelligence provides a searchable lens to historical and real-time insights to better understand your audience, relevant conversations, and your brand’s social performance.
Spredfast is transforming the way companies connect with consumers.
See the brands we work with:


![Software Reference GuideBIOS image 1. BIOS BIOS image xxxxxxxx. rom 2. ASUS Utility] WINFLASH] WINFLASH V2.08] WINFLASH V2. 08 BIOS. 14 1-5 BIOS ( WINFLASH) 7. Exit BIOS 8.](https://static.fdocuments.in/doc/165x107/5f7bf64501fae364dd7d788d/software-reference-guide-bios-image-1-bios-bios-image-xxxxxxxx-rom-2-asus-utility.jpg)