The Smart Grid – Global Vision of T&D GridsPredicts 2016: Unexpected Implications Arising From t...
15
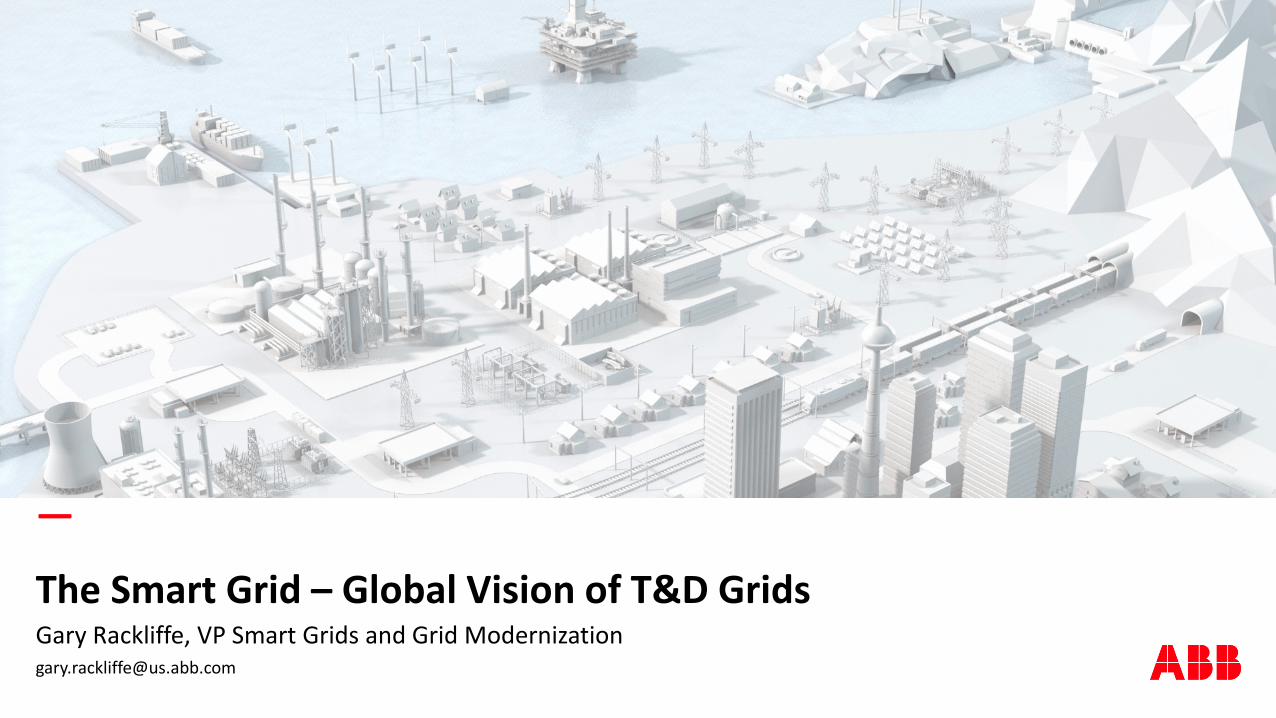
— The Smart Grid – Global Vision of T&D Grids Gary Rackliffe, VP Smart Grids and Grid Modernization [email protected]
Transcript of The Smart Grid – Global Vision of T&D GridsPredicts 2016: Unexpected Implications Arising From t...
—
The Smart Grid – Global Vision of T&D GridsGary Rackliffe, VP Smart Grids and Grid [email protected]
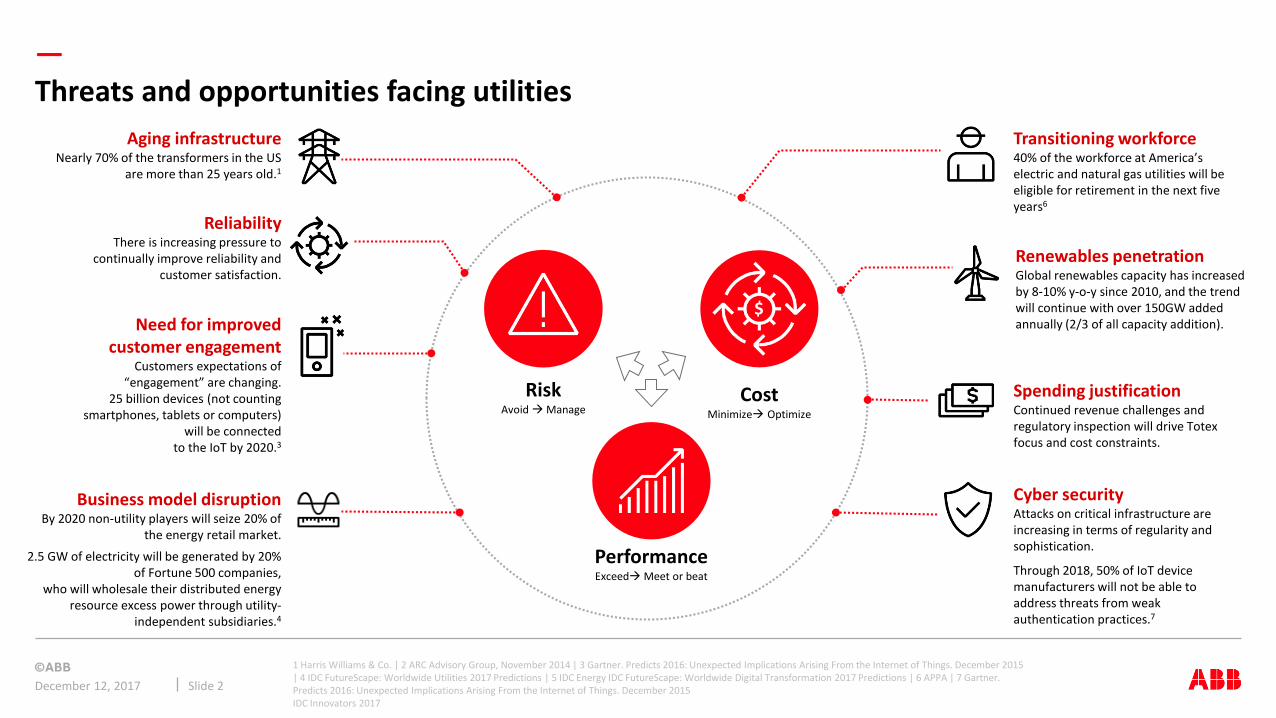
—Threats and opportunities facing utilities
December 12, 2017 Slide 2
Aging infrastructureNearly 70% of the transformers in the US
are more than 25 years old.1
Transitioning workforce40% of the workforce at America’s electric and natural gas utilities will be eligible for retirement in the next five years6
ReliabilityThere is increasing pressure to
continually improve reliability and customer satisfaction.
Spending justificationContinued revenue challenges and regulatory inspection will drive Totexfocus and cost constraints.
Cyber securityAttacks on critical infrastructure are increasing in terms of regularity and sophistication.
Through 2018, 50% of IoT device manufacturers will not be able to address threats from weak authentication practices.7
Need for improved customer engagement
Customers expectations of “engagement” are changing.
25 billion devices (not counting smartphones, tablets or computers)
will be connected to the IoT by 2020.3
1 Harris Williams & Co. | 2 ARC Advisory Group, November 2014 | 3 Gartner. Predicts 2016: Unexpected Implications Arising From the Internet of Things. December 2015 | 4 IDC FutureScape: Worldwide Utilities 2017 Predictions | 5 IDC Energy IDC FutureScape: Worldwide Digital Transformation 2017 Predictions | 6 APPA | 7 Gartner. Predicts 2016: Unexpected Implications Arising From the Internet of Things. December 2015IDC Innovators 2017
Business model disruptionBy 2020 non-utility players will seize 20% of
the energy retail market.
2.5 GW of electricity will be generated by 20% of Fortune 500 companies,
who will wholesale their distributed energy resource excess power through utility-
independent subsidiaries.4
Renewables penetration Global renewables capacity has increased by 8-10% y-o-y since 2010, and the trend will continue with over 150GW added annually (2/3 of all capacity addition).
CostMinimize Optimize
PerformanceExceedMeet or beat
RiskAvoid Manage
$
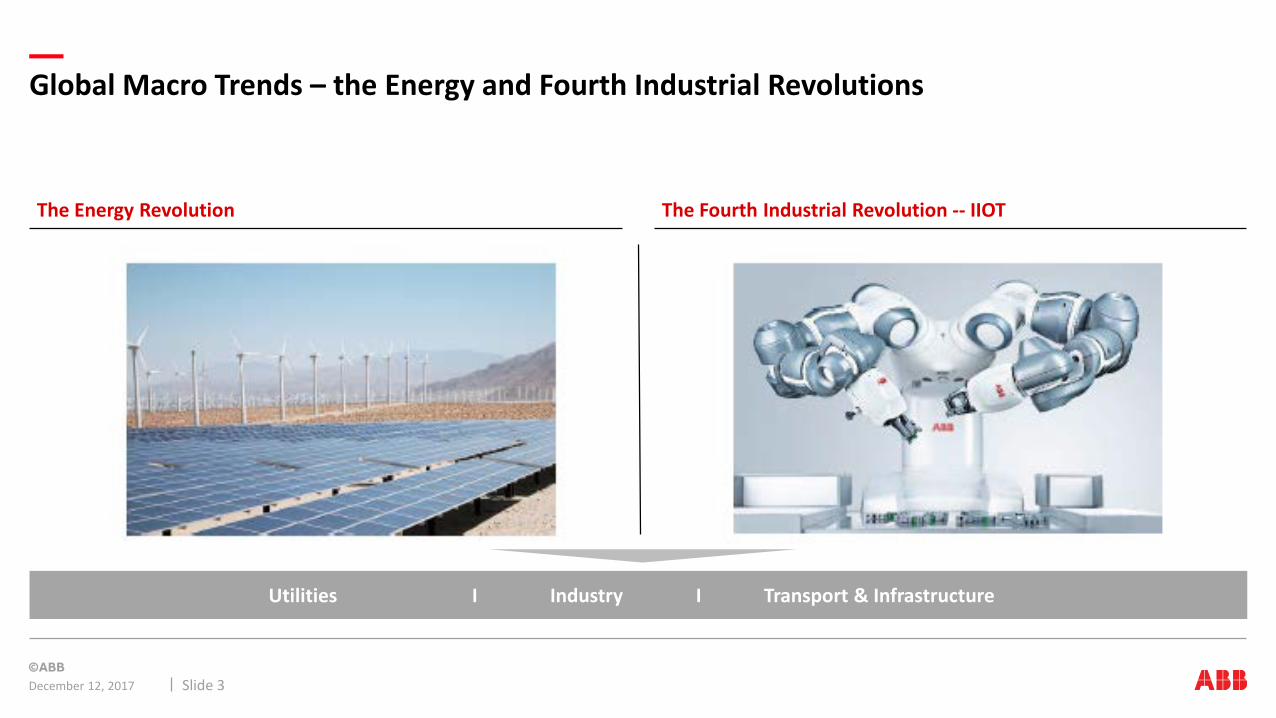
Global Macro Trends – the Energy and Fourth Industrial Revolutions
December 12, 2017 Slide 3
Utilities I Industry I Transport & Infrastructure
The Energy Revolution The Fourth Industrial Revolution -- IIOT
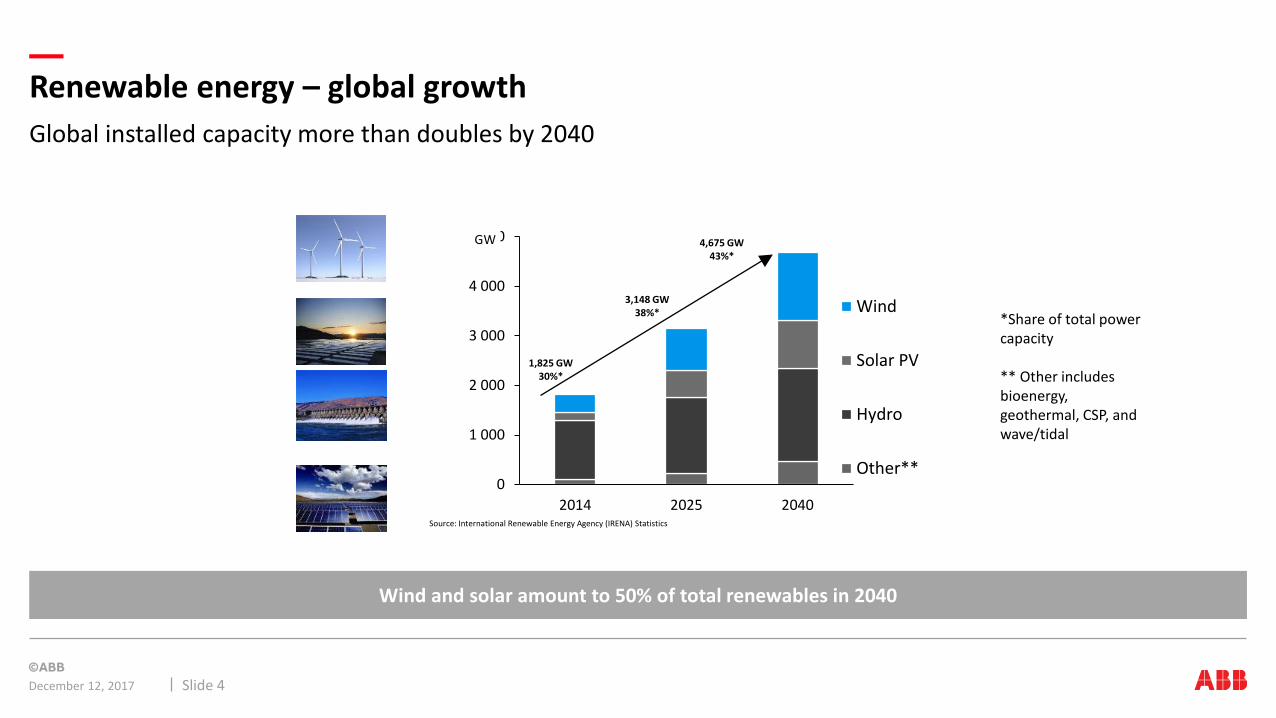
Global installed capacity more than doubles by 2040
Renewable energy – global growth
December 12, 2017 Slide 4
Wind and solar amount to 50% of total renewables in 2040
0
1 000
2 000
3 000
4 000
5 000
2014 2025 2040
Wind
Solar PV
Hydro
Other**
1,825 GW 30%*
3,148 GW38%*
4,675 GW43%*
GW
*Share of total power capacity
** Other includes bioenergy, geothermal, CSP, and wave/tidal
Source: International Renewable Energy Agency (IRENA) Statistics
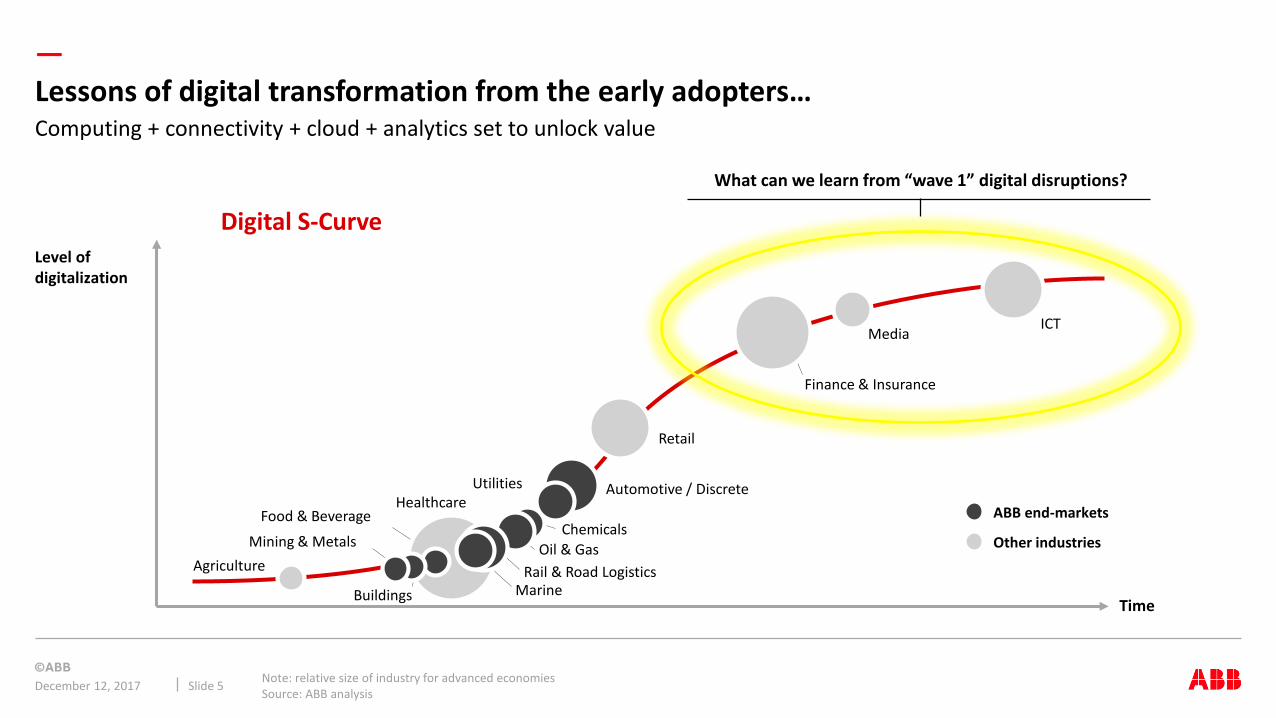
—Lessons of digital transformation from the early adopters…
December 12, 2017 Note: relative size of industry for advanced economiesSource: ABB analysisSlide 5
Computing + connectivity + cloud + analytics set to unlock value
Digital S-Curve
Time
Level of digitalization
Mining & Metals
Buildings
Agriculture
Healthcare
Chemicals
Utilities
Retail
Automotive / Discrete
Finance & Insurance
MediaICT
Rail & Road LogisticsMarine
Food & Beverage
Oil & Gas
ABB end-markets
Other industries
What can we learn from “wave 1” digital disruptions?

Grid modernization
Airbnb
Airbnb
Renewables will take the major share in electrical power generation:
– Disruptive elements
• Renewable generation
• Storage and microgrids
• Digitalization – the digital grid
– Distributed generation with changing consumer and producer patterns
– Distribution grid role changing
– Transmission backbone essential
– New business & operational models
• Enernoc, Stem, Enbala
Changing LandscapeModernization Technologies
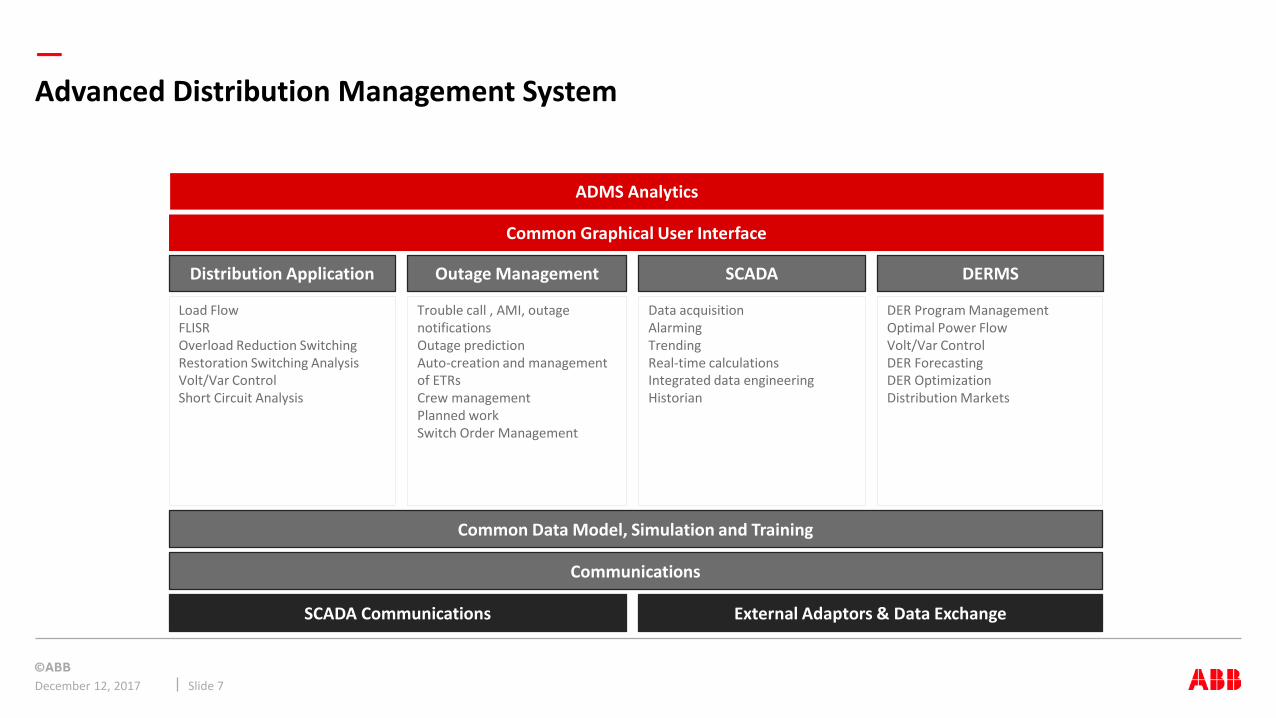
—Advanced Distribution Management System
December 12, 2017 Slide 7
Trouble call , AMI, outage notificationsOutage predictionAuto-creation and management of ETRsCrew managementPlanned workSwitch Order Management
Common Graphical User Interface
Distribution Application Outage Management
External Adaptors & Data Exchange
SCADA
Common Data Model, Simulation and Training
Communications
SCADA Communications
Data acquisitionAlarmingTrendingReal-time calculationsIntegrated data engineeringHistorian
DERMS
DER Program ManagementOptimal Power FlowVolt/Var ControlDER ForecastingDER OptimizationDistribution Markets
ADMS Analytics
Load FlowFLISROverload Reduction SwitchingRestoration Switching AnalysisVolt/Var ControlShort Circuit Analysis

—Enabling digital distribution networks of the future
December 12, 2017 Slide 8
Digital technologies combine to form a platform for active distribution networks
Slide 4
Inter-cloud connection and ABB software tools enable both utility and aggregators to participate with cross- domain programs
Market and Operations software interface and interact to facilitate trading and consumer engagement while enhancing economy and reliability for utilities
Self registration of intelligent devices like Solar Inverters & EV charging stations simplifies customer acquisition
Cyber Security technology protects both the privacy of consumers and security of the network
Feeder automationConventional
generation
EV charging
Containerized Microgrid
Non-utility networks
Mission critical and wireless and wired communications with Edge Computing capability securely connect assets to the control center
DERMS & ADMS software enable Utilities to control distributed assets and integrate them into the distribution control models
Intelligent distribution transformers & other smart distribution assets provide system level insights allowing for:
Distribution level renewables
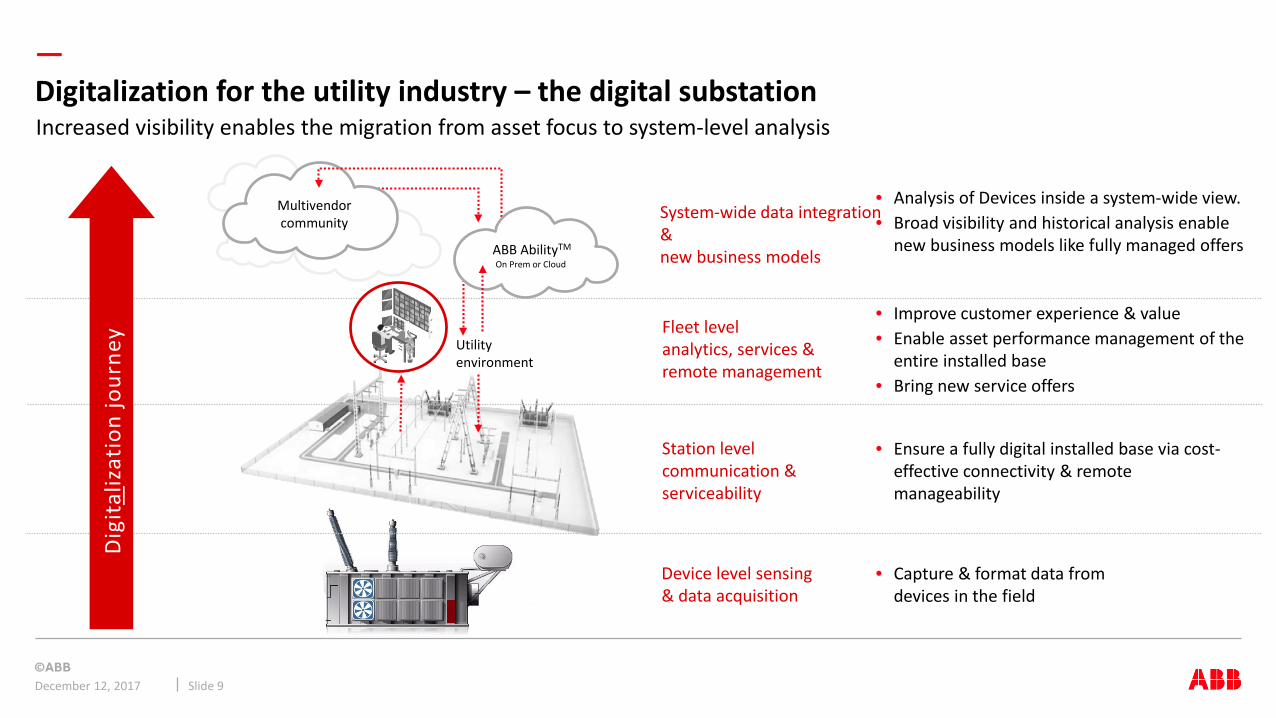
—Digitalization for the utility industry – the digital substation Increased visibility enables the migration from asset focus to system-level analysis
Device level sensing & data acquisition
Station level communication & serviceability
Fleet level analytics, services & remote management
System-wide data integration & new business models
Multivendorcommunity
Utility environment
Dig
italiz
atio
n jo
urne
y
• Capture & format data from devices in the field
• Ensure a fully digital installed base via cost-effective connectivity & remote manageability
• Improve customer experience & value • Enable asset performance management of the
entire installed base• Bring new service offers
• Analysis of Devices inside a system-wide view.• Broad visibility and historical analysis enable
new business models like fully managed offersABB AbilityTM
On Prem or Cloud
December 12, 2017 Slide 9
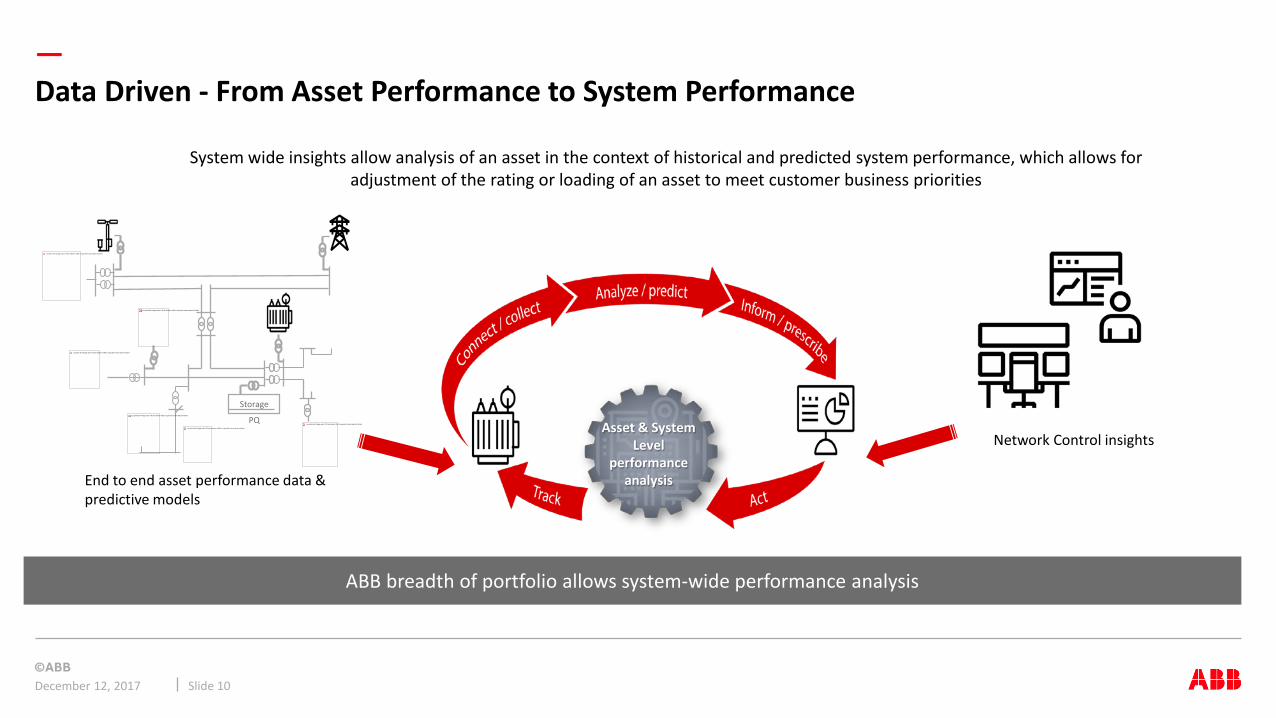
—Data Driven - From Asset Performance to System Performance
December 12, 2017 Slide 10
PQ
Storage
La partie de l'image avec l'ID de relation rId4 n'a pas été trouvé dans le fichier.
La partie de l'image avec l'ID de relation rId58 n'a pas été trouvé dans le fichier.
La partie de l'image avec l'ID de relation rId59 n'a pas été trouvé dans le fichier.
La partie de l'image avec l'ID de relation rId60 n'a pas été trouvé dans le fichier.
La partie de l'image avec l'ID de relation rId62 n'a pas été trouvé dans le fichier.
La partie de l'image avec l'ID de relation rId120 n'a pas été trouvé dans le fichier.
End to end asset performance data & predictive models
Network Control insightsAsset & System
Level performance
analysis
ABB breadth of portfolio allows system-wide performance analysis
System wide insights allow analysis of an asset in the context of historical and predicted system performance, which allows for adjustment of the rating or loading of an asset to meet customer business priorities
December 12, 2017 Slide 12
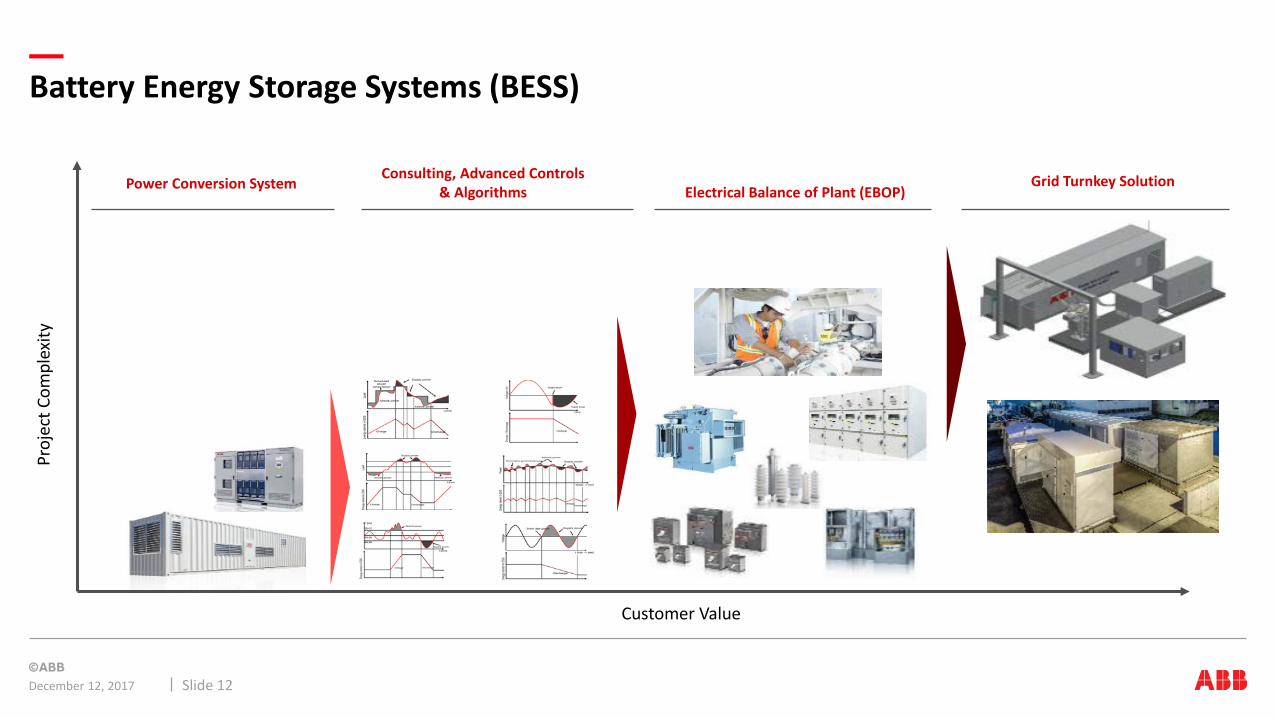
Battery Energy Storage Systems (BESS)
Customer Value
Proj
ect C
ompl
exity
Power Conversion SystemConsulting, Advanced Controls
& Algorithms Electrical Balance of Plant (EBOP)Grid Turnkey Solution
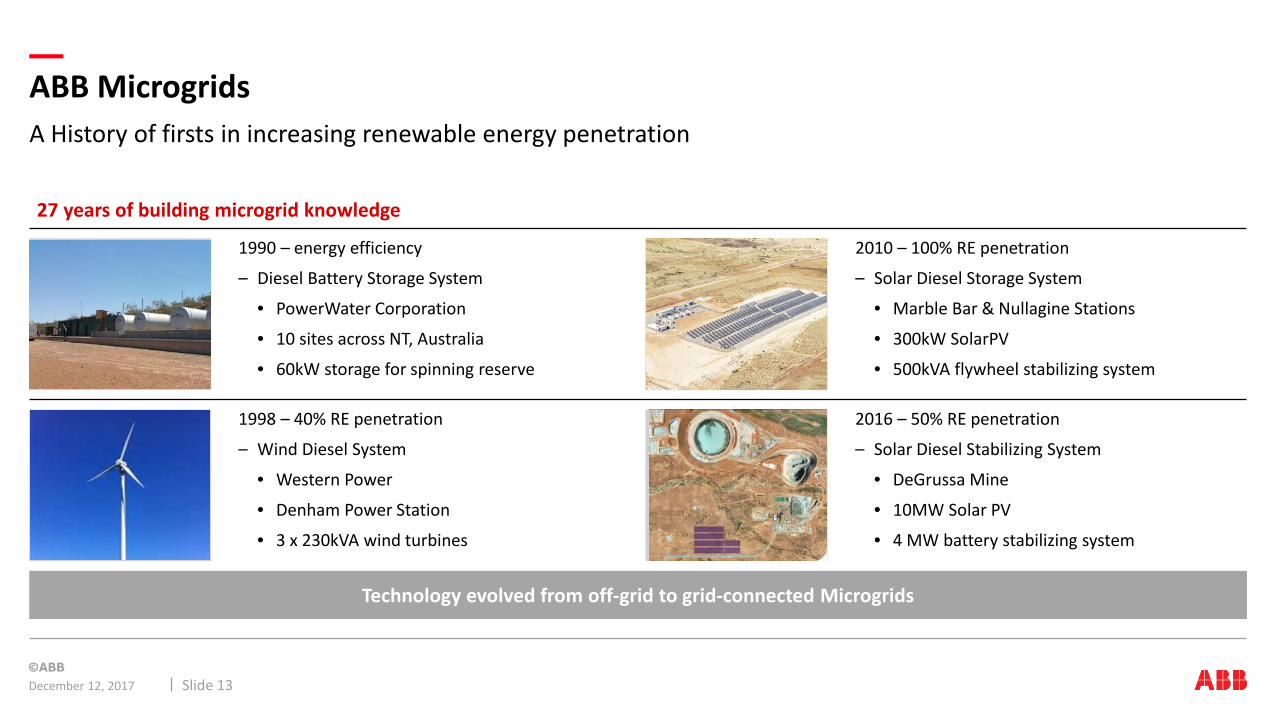
A History of firsts in increasing renewable energy penetration
ABB Microgrids
December 12, 2017 Slide 13
1998 – 40% RE penetration
– Wind Diesel System
• Western Power
• Denham Power Station
• 3 x 230kVA wind turbines
2016 – 50% RE penetration
– Solar Diesel Stabilizing System
• DeGrussa Mine
• 10MW Solar PV
• 4 MW battery stabilizing system
1990 – energy efficiency
– Diesel Battery Storage System
• PowerWater Corporation
• 10 sites across NT, Australia
• 60kW storage for spinning reserve
2010 – 100% RE penetration
– Solar Diesel Storage System
• Marble Bar & Nullagine Stations
• 300kW SolarPV
• 500kVA flywheel stabilizing system
Technology evolved from off-grid to grid-connected Microgrids
27 years of building microgrid knowledge
—
December 12, 2017 Slide 14
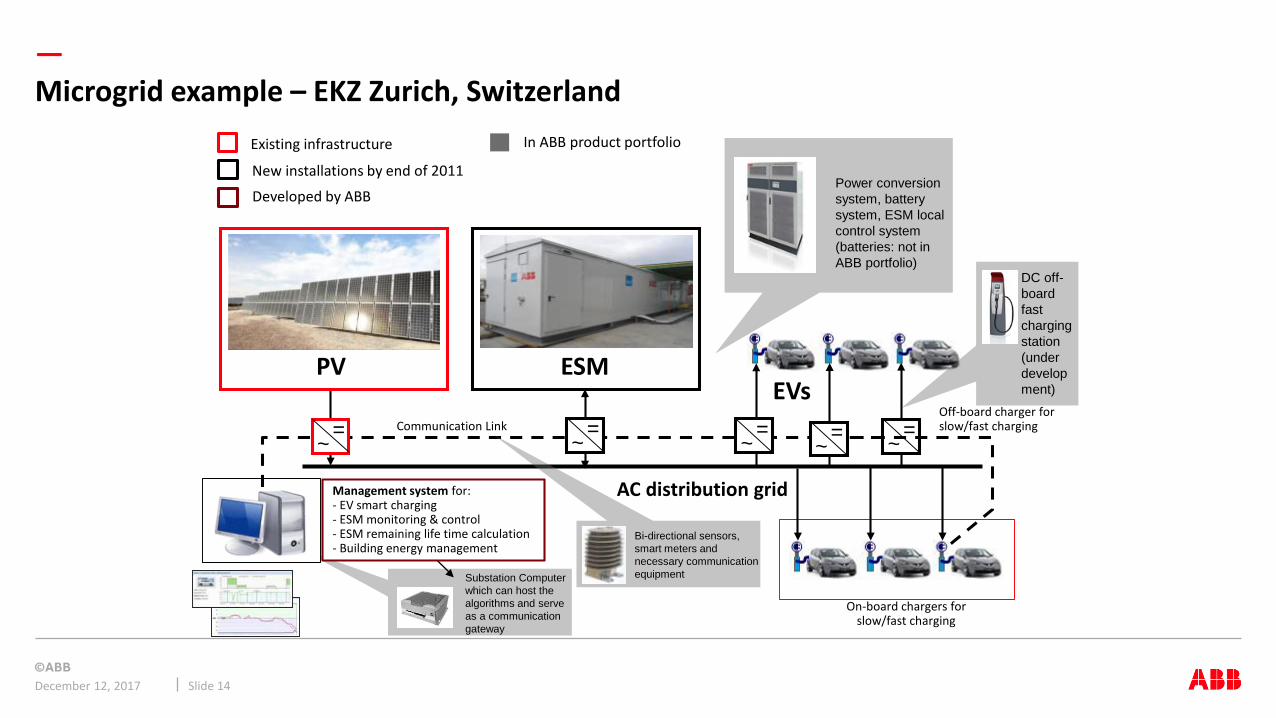
Microgrid example – EKZ Zurich, Switzerland
Power conversion system, battery system, ESM local control system(batteries: not in ABB portfolio)
ESMPVEVs
DC off-board fast charging station (under development)
Off-board charger for slow/fast charging
~ =~ =~ =~ =
~ =
On-board chargers for slow/fast charging
Management system for:- EV smart charging- ESM monitoring & control- ESM remaining life time calculation- Building energy management
Substation Computer which can host the algorithms and serve as a communication gateway
Bi-directional sensors,smart meters andnecessary communicationequipment
AC distribution grid
Communication Link
Existing infrastructure
New installations by end of 2011
Developed by ABB
In ABB product portfolio
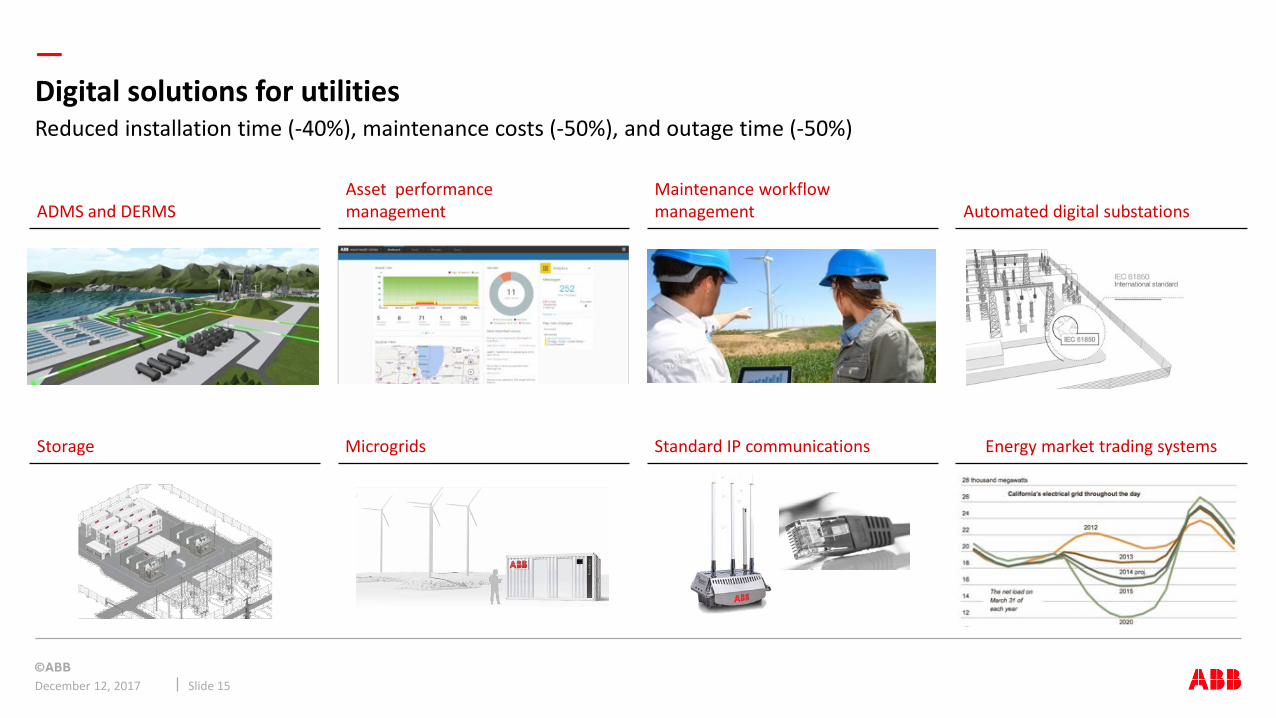
—Digital solutions for utilities
December 12, 2017 Slide 15
Reduced installation time (-40%), maintenance costs (-50%), and outage time (-50%)
ADMS and DERMSAsset performance management
Maintenance workflow management Automated digital substations
Storage Microgrids Energy market trading systemsStandard IP communications