The Slumgullion Landslide, Hinsdale County,...
21
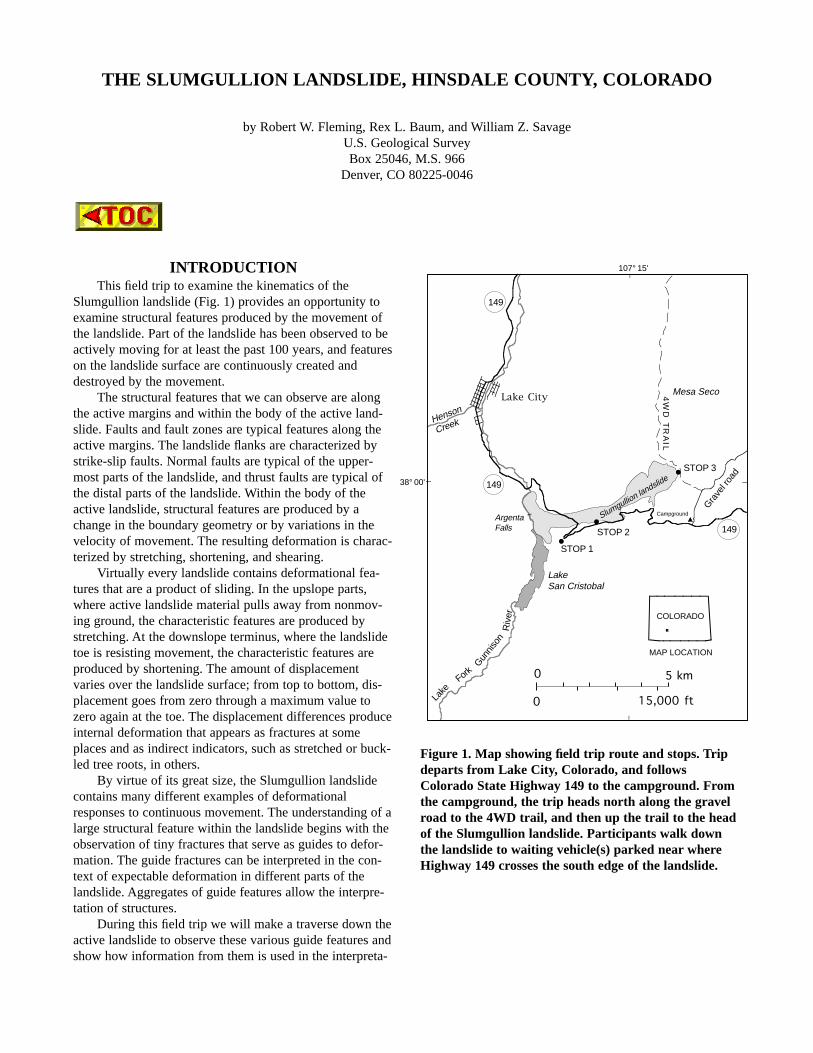
INTRODUCTION This field trip to examine the kinematics of the Slumgullion landslide (Fig. 1) provides an opportunity to examine structural features produced by the movement of the landslide. Part of the landslide has been observed to be actively moving for at least the past 100 years, and features on the landslide surface are continuously created and destroyed by the movement. The structural features that we can observe are along the active margins and within the body of the active land- slide. Faults and fault zones are typical features along the active margins. The landslide flanks are characterized by strike-slip faults. Normal faults are typical of the upper- most parts of the landslide, and thrust faults are typical of the distal parts of the landslide. Within the body of the active landslide, structural features are produced by a change in the boundary geometry or by variations in the velocity of movement. The resulting deformation is charac- terized by stretching, shortening, and shearing. Virtually every landslide contains deformational fea- tures that are a product of sliding. In the upslope parts, where active landslide material pulls away from nonmov- ing ground, the characteristic features are produced by stretching. At the downslope terminus, where the landslide toe is resisting movement, the characteristic features are produced by shortening. The amount of displacement varies over the landslide surface; from top to bottom, dis- placement goes from zero through a maximum value to zero again at the toe. The displacement differences produce internal deformation that appears as fractures at some places and as indirect indicators, such as stretched or buck- led tree roots, in others. By virtue of its great size, the Slumgullion landslide contains many different examples of deformational responses to continuous movement. The understanding of a large structural feature within the landslide begins with the observation of tiny fractures that serve as guides to defor- mation. The guide fractures can be interpreted in the con- text of expectable deformation in different parts of the landslide. Aggregates of guide features allow the interpre- tation of structures. During this field trip we will make a traverse down the active landslide to observe these various guide features and show how information from them is used in the interpreta- THE SLUMGULLION LANDSLIDE, HINSDALE COUNTY, COLORADO by Robert W. Fleming, Rex L. Baum, and William Z. Savage U.S. Geological Survey Box 25046, M.S. 966 Denver, CO 80225-0046 Lake City Lake San Cristobal Slumgullion landslide STOP 1 STOP 2 STOP 3 Campground 149 Mesa Seco 4WD TRAIL Gravel road Lake Henson Creek Gunnison 149 149 0 5 km 0 15,000 ft 38° 00' 107° 15' Argenta Falls COLORADO MAP LOCATION River Fork Figure 1. Map showing field trip route and stops. Trip departs from Lake City, Colorado, and follows Colorado State Highway 149 to the campground. From the campground, the trip heads north along the gravel road to the 4WD trail, and then up the trail to the head of the Slumgullion landslide. Participants walk down the landslide to waiting vehicle(s) parked near where Highway 149 crosses the south edge of the landslide.
Transcript of The Slumgullion Landslide, Hinsdale County,...
THE SLUMGULLION LANDSLIDE, HINSDALE COUNTY, COLORADO
by Robert W. Fleming, Rex L. Baum, and William Z. SavageU.S. Geological SurveyBox 25046, M.S. 966
Denver, CO 80225-0046
Lake City
LakeSan Cristobal
Slumgullion landslide
STOP 1
STOP 2
STOP 3
Campground
149
Mesa Seco4W
D T
RA
IL
Gra
vel r
oad
Lake
Henson
Creek
Gun
niso
n
149
149
0 5 km
0 15,000 ft
8° 00'
107° 15'
ArgentaFalls
COLORADO
MAP LOCATION
Riv
er
Fork
Figure 1. Map showing field trip route and stops. Tripdeparts from Lake City, Colorado, and followsColorado State Highway 149 to the campground. Fromthe campground, the trip heads north along the gravelroad to the 4WD trail, and then up the trail to the headof the Slumgullion landslide. Participants walk downthe landslide to waiting vehicle(s) parked near whereHighway 149 crosses the south edge of the landslide.
INTRODUCTIONThis field trip to examine the kinematics of the
Slumgullion landslide (Fig. 1) provides an opportunity toexamine structural features produced by the movement ofthe landslide. Part of the landslide has been observed to beactively moving for at least the past 100 years, and featureson the landslide surface are continuously created anddestroyed by the movement.
The structural features that we can observe are alongthe active margins and within the body of the active land-slide. Faults and fault zones are typical features along theactive margins. The landslide flanks are characterized bystrike-slip faults. Normal faults are typical of the upper-most parts of the landslide, and thrust faults are typical ofthe distal parts of the landslide. Within the body of theactive landslide, structural features are produced by achange in the boundary geometry or by variations in thevelocity of movement. The resulting deformation is charac-terized by stretching, shortening, and shearing.
Virtually every landslide contains deformational fea-tures that are a product of sliding. In the upslope parts,where active landslide material pulls away from nonmov-ing ground, the characteristic features are produced bystretching. At the downslope terminus, where the landslidetoe is resisting movement, the characteristic features areproduced by shortening. The amount of displacementvaries over the landslide surface; from top to bottom, dis-placement goes from zero through a maximum value tozero again at the toe. The displacement differences produceinternal deformation that appears as fractures at someplaces and as indirect indicators, such as stretched or buck-led tree roots, in others.
By virtue of its great size, the Slumgullion landslidecontains many different examples of deformationalresponses to continuous movement. The understanding of alarge structural feature within the landslide begins with theobservation of tiny fractures that serve as guides to defor-mation. The guide fractures can be interpreted in the con-text of expectable deformation in different parts of thelandslide. Aggregates of guide features allow the interpre-tation of structures.
During this field trip we will make a traverse down theactive landslide to observe these various guide features andshow how information from them is used in the interpreta-
3

Activeflankridge
Abandonedflankridge
Rightflank
Figure 2. View of flank ridge at downslope end of pull-apart basin on right flank, looking southwest.
Active flankridge
Abandonedflank ridge
Right flank
Figure 3. Views of an active flank ridge. A. Uphill end,looking southwest along right flank. Trees to left ofridge have deformed trunks. B. Downhill end lookingeast (Baum and Fleming, 1996). Exposed shear surfaceand clay dike inside right flank. A scarp at the outboardside of ridge (light area at center) exposes an emergentpart of the lateral shear surface. This shear surface isbetween the crest and the trace of the right-lateralshear zone (shown by a dashed line). The scarp tapersfrom a height of about 2 m in foreground to 0 m in thebackground (about 20 m upslope, beyond left edge ofphotograph). The taper is consistent with screw-likemovement along this part of the flank; the ridge growthis about 0.1 meter per meter of downslope of displace-ment. Annual movement here is about 3.5 m. The scarpis convex and is covered with sheared, highly plastic,blue-gray clay (liquid limit = 105, plasticity index = 77)that differs in color and texture from the stony, light-brown landslide material in the ridge. Movement at theshear zone has brought a tabular dike of blue-gray clayto the surface and injected the clay into the landslidematerials.
Exposedshearsurface
Rightflank
Ironstaining
Claydike
Active flank ridge
A
B
tion of structures. We will also see some structures, notablyclay intrusions and extrusions and flank ridges, that are stillpoorly understood. In this traverse, we will see placeswhere clay has been intruded along shear zones and placeswithin the body of the landslide where it has extruded ontothe ground surface. Perhaps the most striking features ofthe Slumgullion landslide are its flank ridges (Figs. 2 and3). These are long ridges that form on both flanks and adja-cent to strike-slip faults within the landslide. We have dataon formation of the ridges (Fleming and Johnson, 1989;Baum and others, 1993), but lack coherent explanations ofthe processes of formation.
BACKGROUNDThis field trip begins at Lake City, Colorado, and fol-
lows southbound Colorado Highway 149 (Fig. 1). Briefstops at two points provide an overview of most of theSlumgullion landslide. The trip continues along Highway149 to Slumgullion Campground and then follows U.S.Forest Service roads to the head of the landslide.Participants hike down the slide from the head, makingseveral stops to view landslide features, and return to wait-ing vehicles parked between the active toe and Highway149.
The Slumgullion landslide (Figs. 4A and 4B) has beendescribed by numerous investigators (Endlich, 1876;Howe, 1909; Atwood and Mather, 1932; Burbank, 1947;Crandell and Varnes, 1960, 1961; Keefer and Johnson,1983; Varnes and Savage, 1996). The name Slumgullion,already ascribed to the landslide by miners at the time ofEndlich’s (1876) description, is an old term referring to ameat stew containing many different ingredients of variouscolors and having a variegated appearance. The earliestpublished photographs of the landslide were by WhitmanCross (pl. XXB in Howe, 1909). Crandell and Varnes(1961) first investigated the rates and history of movement.

Figure 4. A. Outline map of inactive and active parts ofthe Slumgullion landslide. The inactive part of the land-slide is comprised of materials emplaced during at leasttwo episodes of movement. The oldest known deposit(older unit) blocked Slumgullion Creek and spilled overa topographic divide farther upslope. The second oldestdeposit (middle unit) blocked the Lake Fork of theGunnison River, creating Lake San Cristobal. A col-lapse of the north side of the main scarp that provideda surcharge load to the upper part of the older land-slide deposits may have triggered the currently activeepisode (younger unit). B. Aerial view of Slumgullionlandslide, looking east (photograph by David J. Varnes,U.S. Geological Survey).
B
A
38°00'
In 1990, the U.S. Geological Survey (USGS), with theassistance of scientists provided by a cooperative agree-ment between the USGS and the Istituto di Ricerca per laProtezione Idrogeologica (IRPI) of the Italian NationalResearch Council, began a new study of the Slumgullionearth flow (Varnes and Savage, 1996).
Geologic SettingThe Slumgullion landslide is located in the San Juan
Mountains, a large early-Tertiary volcanic center in south-west Colorado (Fig. 1). The landslide formed as a result ofcollapse of hydrothermally altered volcanic materials in therim of the Lake City Caldera (Lipman, 1976) on the southend of Mesa Seco (Fig. 4). The collapsed materials slidand flowed more than 6 km downhill to block the LakeFork of the Gunnison River, creating Lake San Cristobal.

Most of the landslide is inactive, but a significant partwithin the boundaries of the older slide is active. Bedrocksurrounding the landslide consists of volcanic rocks rang-ing in composition from rhyolite to basalt and these are themain constituents found in surficial deposits of till and allu-vium adjacent to the landslide, and of course, in the slideitself. A few glacial erratics of granite and related crys-talline rocks occur in glacial deposits south of the landslide(Stops 1 and 2).
Description of the LandslideThe Slumgullion landslide is 6.8 km long, covers an
area of 4.64 km2, and has an estimated volume of 170x106
m3 (Parise and Guzzi, 1992). It consists of a younger,active, upper part that moves on and over an older, muchlarger, inactive part (Fig. 4). Recently, Williams and Pratt(1996) conducted seismic reflection and refraction surveysacross the inactive part directly above Colorado Highway149. They concluded that it occupies a broadly U-shapedvalley cut into dense volcanic bedrock (5.4 km/s seismicvelocity), and has a maximum thickness of 95 m. Theactive part of the landslide is 3.9 km long, covers an areaof 1.46 km2, and has an estimated volume of 20x106 m3
(Parise and Guzzi, 1992). Total elevation difference fromthe toe of the inactive part at the Lake Fork of theGunnison River to the top of the 250-m-high scarp is about1000 m (3400 ft). The length from the top of the scarp tothe inactive toe at the level of the Lake Fork is about 6 km(3.6 mi). Part of the inactive toe is concealed under thewater of Lake San Cristobal, which has a maximum depthof 28.5 m at the upstream terminus of the landslide toe(Crandell and Varnes, 1961; more recent measurementsindicate a maximum depth of 27 m, Schuster, 1996).
A variety of land forms exist at the surface of the land-slide or resulted from its movement; these include scarps,lobes, hummocks, closed depressions, flank ridges, bench-es, and risers. The largest feature, besides the landslideitself, is the main scarp and bowl-shaped depression at thehead of the slide (Fig. 4B). Within the active landslide,gently sloping benches hundreds of meters across arejoined by intervening steep sections (risers) tens of metershigh. Swarms of scarps, related to normal faulting, com-monly occur on upper parts of the risers; individual scarpsare 0.1-10 m high. Long ridges, tens to hundreds of meterslong and 1-5 m high, occur at both flanks and within thelandslide. Most ridges are associated with strike-slip faults,however a few within the landslide appear to have resultedfrom stream erosion. Lobate hummocks are common inareas of shortening where they are associated with thrustfaults and buckle folds. A few irregular hummocks ofunknown origin occur at various places on the surface ofthe landslide.
Deposits exposed on the surface of the landslide ordirectly attributable to landsliding include trains of vol-canic boulders, gray, white, yellow, light brown, and
maroon diamictons (landslide debris), tan alluvium andpond deposits, clay dikes, and extrusions; all largelyderived from the volcanic rocks. The diamictons are largelyderived from hydrothermally altered rocks and are rich inclay and silt.
Limited geotechnical test data on samples collectedfrom the surface of the Slumgullion landslide indicates thatthe landslide matrix has high clay content, and can beexpected to have low strength and low permeability.Chleborad and others (1996) tested samples collected at thelandslide surface of commonly occurring yellow, and red-dish-brown, fine-grained materials that appear to formmuch of the matrix of the landslide debris. X-ray diffrac-tion analysis detected only smectite in the yellow sampleand both smectite and kaolinite in the reddish-brown sam-ple. The yellow sample was also rich in gypsum. Particle-size analysis revealed that both samples were clay-rich(<0.002 micron), the yellow material had 58 percent clay,and the red material had 36 percent clay; the remainderconsisted mainly of volcanic rock fragments. Both sampleshad high plasticity, the yellow material had a liquid limit of95 and plasticity index of 50, whereas the reddish brownhad a liquid limit of 65 and a plasticity index of 39. Bothhad high swelling potential and low in situ undrained shearstrength (vane shear method).
We found tabular dikes of highly plastic clay (liquidlimit = 110, plasticity index = 75) intruded into the land-slide debris at several locations in the active landslide,notably along the strike-slip faults at the flanks (Fig. 3B)(Baum and Fleming, 1996). Similar intruded dikes werereported in the Twin Lake landslide in Utah by Flemingand Johnson (1989). Evidently the clay intrudes the faultsduring landslide movement. This clay is apparently muchweaker than the rocky landslide debris on either side of thefault and intrusions of clay dikes along fault zones couldfacilitate continued movement by creating a weak, slippery(low angle of internal friction) layer between the activelandslide and underlying materials. Creation of such aweak layer could permit the landslide to move in responseto smaller loads or pore pressures than existed at the timeof its initiation or reactivation.
Because of its size and inaccessibility, no quantitativehydrologic data exist for the Slumgullion landslide. Thefew available data indicate that the landslide is largelywater saturated. Many ephemeral streams flow down thelandslide and perennial streams flow down each flank.Perennial springs exist at several points on the surface ofthe landslide. Discharge from some of these springsappears to be several liters per second. Water from some ofthese springs flows hundreds of meters across the landslidebefore it either soaks into the ground or joins a stream. Therelationships between surface and subsurface water, andthe topography, structure, and stratigraphy of the landslideare complex, however, we infer from the abundance of sur-face water that a significant part of the active landslide iswater saturated. Williams and Pratt (1996) concluded,
based on seismic reflection and refraction surveys, thateven the inactive landslide debris is water-saturated severalmeters below the ground surface.
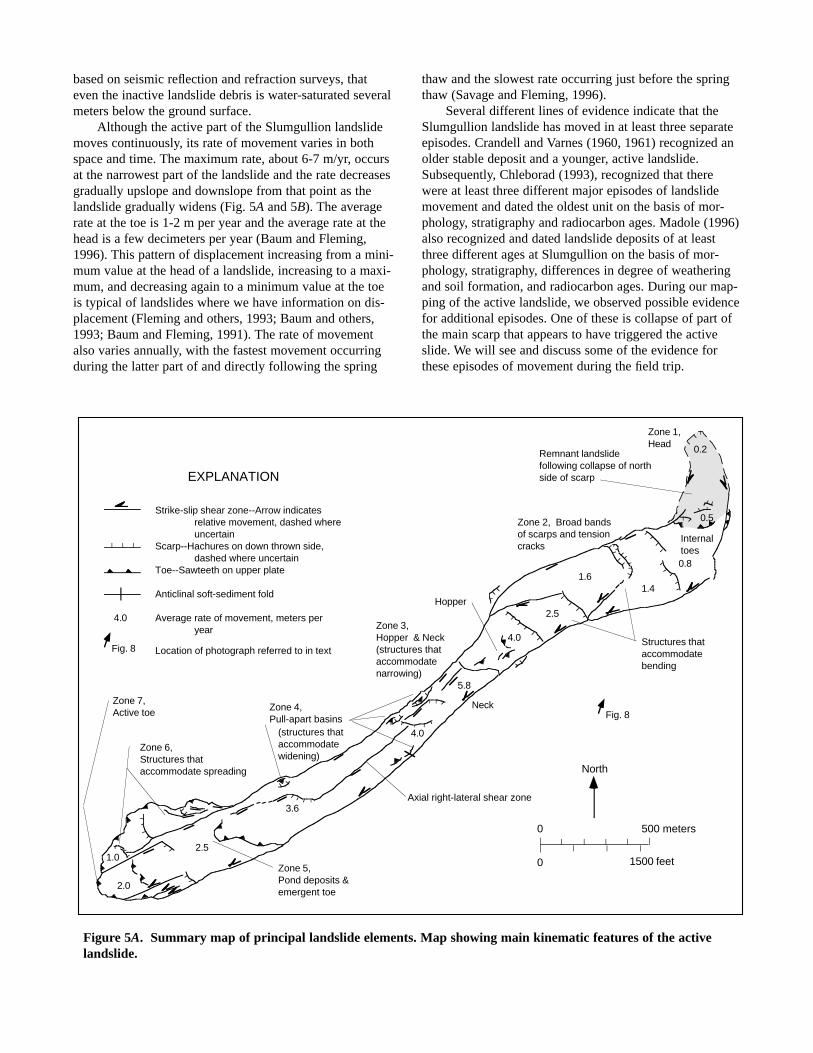
Although the active part of the Slumgullion landslidemoves continuously, its rate of movement varies in bothspace and time. The maximum rate, about 6-7 m/yr, occursat the narrowest part of the landslide and the rate decreasesgradually upslope and downslope from that point as thelandslide gradually widens (Fig. 5A and 5B). The averagerate at the toe is 1-2 m per year and the average rate at thehead is a few decimeters per year (Baum and Fleming,1996). This pattern of displacement increasing from a mini-mum value at the head of a landslide, increasing to a maxi-mum, and decreasing again to a minimum value at the toeis typical of landslides where we have information on dis-placement (Fleming and others, 1993; Baum and others,1993; Baum and Fleming, 1991). The rate of movementalso varies annually, with the fastest movement occurringduring the latter part of and directly following the spring
Strike-slip shear zone--Arrow indicates relative movement, dashed where uncertainScarp--Hachures on down thrown side, dashed where uncertainToe--Sawteeth on upper plate
Anticlinal soft-sediment fold
Average rate of movement, meters per year Zone 3,
Hopper (structuraccommnarrowin
A
Zone 4,Pull-apart basins
(structures thataccommodatewidening)
Zone 5,Pond deposits &emergent toe
Zone 6,Structures thataccommodate spreading
Zone 7,Active toe
4
3.6
2.51.0
2.0
4.0
Fig. 8 Location of photograph referred to in text
EXPLANATION
Figure 5A. Summary map of principal landslide elementslandslide.
thaw and the slowest rate occurring just before the springthaw (Savage and Fleming, 1996).
Several different lines of evidence indicate that theSlumgullion landslide has moved in at least three separateepisodes. Crandell and Varnes (1960, 1961) recognized anolder stable deposit and a younger, active landslide.Subsequently, Chleborad (1993), recognized that therewere at least three different major episodes of landslidemovement and dated the oldest unit on the basis of mor-phology, stratigraphy and radiocarbon ages. Madole (1996)also recognized and dated landslide deposits of at leastthree different ages at Slumgullion on the basis of mor-phology, stratigraphy, differences in degree of weatheringand soil formation, and radiocarbon ages. During our map-ping of the active landslide, we observed possible evidencefor additional episodes. One of these is collapse of part ofthe main scarp that appears to have triggered the activeslide. We will see and discuss some of the evidence forthese episodes of movement during the field trip.
Remnant landslidefollowing collapse of northside of scarp
Zone 1,Head
Zone 2, Broad bandsof scarps and tensioncracks
& Neckes thatodateg)
Structures thataccommodatebending
Neck
Hopper
xial right-lateral shear zone
Internaltoes
0.2
0.5
0.8
1.41.6
2.5
4.0
5.8
.0
Fig. 8
North
0
0
500 meters
1500 feet
. Map showing main kinematic features of the active

Figure 5B. Contours of annual displacement in meters, displacement data from Smith (1993). Contour interval0.5 m, maximum rate 5 m/yr. Insufficient data to draw contours in neck where displacement locally exceeds 7 m/yr.
11
1.5
1.5
2
2.5
3
3.5
4
3.53
4
4
4.5
5
54
5
4
2.5
2.5
34
3.5
2
21.5
1.5
1
1
0.5Strike-slip shear zone--Arrow indicates relative movement, dashed where uncertainScarp--Hachures on down thrown side, dashed where uncertainToe--Sawteeth on upper plate
Anticlinal soft-sediment fold
Average rate of movement, contour interval 0.5 meters per year
2.5
Approximate position of maximumrate of displacement, 7.4 m/yr
North
0
0
500 meters
1500 feet
EXPLANATION
The oldest known unit (1.1-1.6 ka or perhaps older,Madole, 1996; Chleborad, 1996), recognized only in theupper part of the slide area, forms lobes and flank ridgesthat are as much as 30 m higher than younger flank ridgesthat lie inboard of the older features (Fig 4A). The soildeveloped on the oldest landslide unit is thicker than soilon the younger units and generally has a B horizon, where-as the soils developed in the younger two units lack B hori-zons or have incipient B horizons (Madole, 1996). Themiddle unit (probably 0.8-0.9 ka, Madole, 1996) crosscutsthe oldest unit (Chleborad, 1993) and apparently extendedfarther downslope than the oldest unit, reaching the LakeFork of the Gunnison River and damming it to form LakeSan Cristobal. Soil of the middle unit has been partiallyeroded and consists of an A horizon developed on slightlyoxidized parent material. The presently active part of theSlumgullion landslide is the youngest unit (0.3 ka, Crandelland Varnes, 1960, 1961). The only recognizable soil on theactive slide is relict soil developed on blocks of older land-slide deposits that have been incorporated into it.
FIELD-TRIP ROAD LOGMileage
cum. inc.0.0 0.0 Trip starts in Lake City at intersection of
Second Street (Henson Creek/EngineerPass Road) and Colorado State Highway149. Drive south on State Highway 149.
0.1 0.1 Cross Henson Creek2.5 2.4 Cross Lake Fork of the Gunnison River.
Yellow deposits to right are downstreamlimit of Slumgullion landslide deposits(middle unit of Madole (1996), 0.8-0.9 ka).
4.1 1.6 Cross north flank of Slumgullion land-slide deposits (middle unit of Madole(1996), 0.8-0.9 ka). Highway 149 travers-es inactive part of slide for next 0.4 mi.
4.5 0.4 Parking area to left is where field vehicleswill meet us at end of trip.

Main scarp
Active toe
Figure 6. Active part of the Slumgullion landslide, viewto northwest from Stop 1 (photograph by Jack Odum,U.S. Geological Survey).
Mileagecum. inc.4.5 0.0 Cross south flank of Slumgullion land-
slide deposits, enter area underlain byglacial deposits and volcanic bedrock.
5.0 0.5 STOP 1. HIGHWAY 149 SCENICOVERLOOK OF LAKE SANCRISTOBAL AND THE SLUMGUL-LION LANDSLIDE. Parking area atswitch back in Highway 149. View LakeSan Cristobal to southwest, toe and inac-tive deposits of Slumgullion landslide towest and northwest. View up axis ofactive part of Slumgullion landslide tonortheast. Return to Highway 149 andcontinue uphill (east).
6.0 1.0 STOP 2. SLUMGULLION LAND-SLIDE SCENIC OVERLOOK. Turnleft into parking area on north side ofhighway 149. View part of the activeSlumgullion landslide to north.Slumgullion Creek is in valley betweenparking area and landslide deposits.Return to Highway 149 and continueuphill (east).
6.8 0.8 For next 0.4 mi., Highway 149 makesbroad loop around remnant toe of theSlumgullion landslide that blockedSlumgullion Creek (oldest unit of Madole(1996)).
7.6 0.8 Yellow and white deposit to left is part ofan ancient spill-over of the Slumgullionlandslide (oldest unit of Madole (1996)).Radiocarbon age of wood found in thesedeposits in 1992) ranged from 1.1-1.6 ka(Chleborad, 1993, 1996).
8.1 0.5 Windy Point Overlook9.3 1.2 Turn left, go north past campground on
gravel road.10.2* 0.9* Turn left onto 4WD trail (must have spe-
cial permission from U.S. Forest Serviceand good weather/road conditions todrive up trail beyond this point). Follow4WD trail to edge of east scarp at top ofSlumgullion landslide.
10.8* 0.6* STOP 3. MAIN SCARP OF THESLUMGULLION LANDSLIDE. Lookwest and behold the breathtaking (maybeits just the altitude!) view of theSlumgullion landslide. Hike down scarponto landslide, and then hike down slideto active toe. Driver(s) will take fieldvehicles to parking area below active toeand await our return.
* Mileage estimated from USGS topographic map
STOP 1. HIGHWAY 149 SCENIC OVERLOOK (SWITCH BACK)
At this stop we will view Lake San Cristobal (Fig.4B), and most of the Slumgullion landslide (Fig. 6). LakeSan Cristobal, Colorado’s second largest natural lake,formed about 800-900 years ago when the Slumgullionlandslide dammed the Lake Fork of the Gunnison River.Originally the lake was 4.3 km long, and had a surface areaof 1.8 km2, but sediment deposited in deltas of SlumgullionCreek and the Lake Fork have reduced the lake’s length to3.3 km and its area to 1.34 km2. The lake is 27 m deep andhas a volume of approximately 14 million m3 (Schuster,1996). The landslide buried the original channel of theLake Fork and the river eventually cut a new channelaround the perimeter of the landslide toe 200 m west ofand 28 m higher than the old channel. The new channel,which originally formed because the low point in the land-slide-dam crest was against the west wall of the valley, hascut down about 10 m into resistant bedrock forming a sta-ble, erosion-resistant channel. Headward erosion of thedownstream channel has created 25-m-high Argenta Fallsat a resistant bedrock ledge (Schuster, 1996).
Much of the toe of the inactive landslide is visiblefrom this point (Fig. 4B). The toe spread laterally both up-and downstream when it reached the Lake Fork of theGunnison River. The total width from the upstream end(submerged) to the downstream end is 2.8 km. The lowerpart of the landslide rises from the toe to the crossing ofHighway 149 through a series of steps (Parise and Guzzi,1992). It is not known whether these resulted from steps inthe original bedrock channel of Slumgullion Creek or ifthey are depositional structures in the landslide debrisitself.
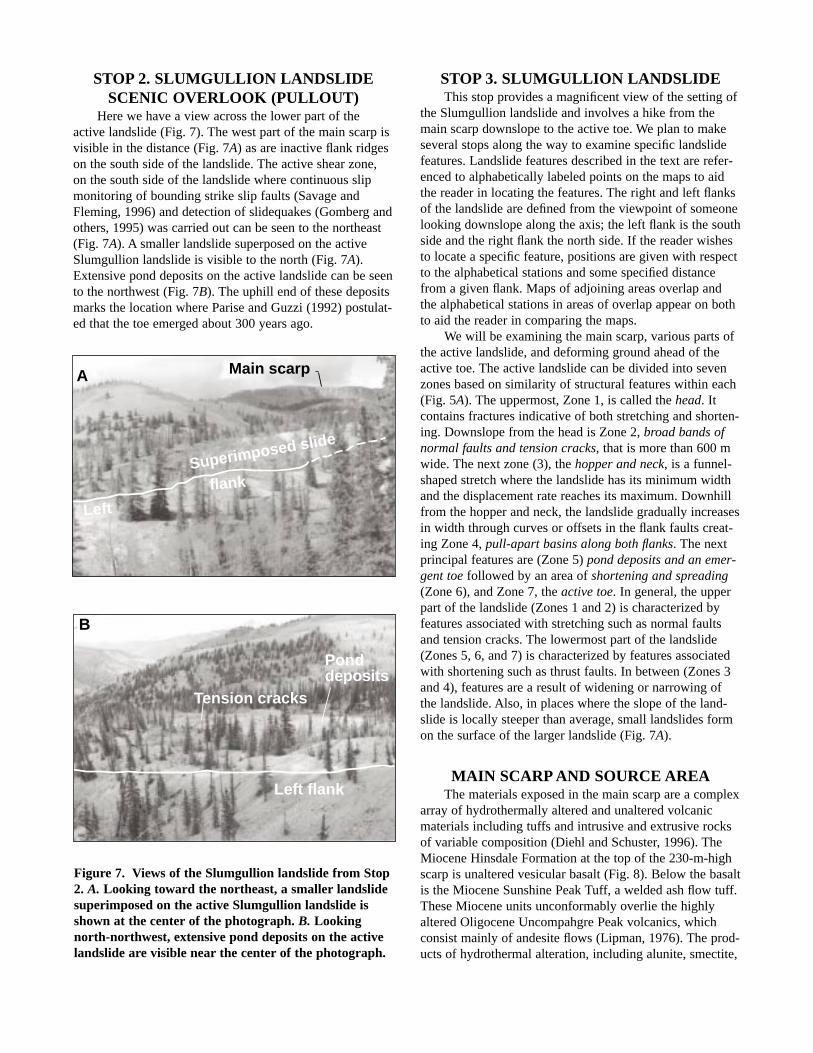
STOP 2. SLUMGULLION LANDSLIDESCENIC OVERLOOK (PULLOUT)
Here we have a view across the lower part of theactive landslide (Fig. 7). The west part of the main scarp isvisible in the distance (Fig. 7A) as are inactive flank ridgeson the south side of the landslide. The active shear zone,on the south side of the landslide where continuous slipmonitoring of bounding strike slip faults (Savage andFleming, 1996) and detection of slidequakes (Gomberg andothers, 1995) was carried out can be seen to the northeast(Fig. 7A). A smaller landslide superposed on the activeSlumgullion landslide is visible to the north (Fig. 7A).Extensive pond deposits on the active landslide can be seento the northwest (Fig. 7B). The uphill end of these depositsmarks the location where Parise and Guzzi (1992) postulat-ed that the toe emerged about 300 years ago.
Superimposed slide
Left
flank
Main scarp
Left flank
Ponddeposits
Tension cracks
Figure 7. Views of the Slumgullion landslide from Stop2. A. Looking toward the northeast, a smaller landslidesuperimposed on the active Slumgullion landslide isshown at the center of the photograph. B. Lookingnorth-northwest, extensive pond deposits on the activelandslide are visible near the center of the photograph.
A
B
STOP 3. SLUMGULLION LANDSLIDEThis stop provides a magnificent view of the setting of
the Slumgullion landslide and involves a hike from themain scarp downslope to the active toe. We plan to makeseveral stops along the way to examine specific landslidefeatures. Landslide features described in the text are refer-enced to alphabetically labeled points on the maps to aidthe reader in locating the features. The right and left flanksof the landslide are defined from the viewpoint of someonelooking downslope along the axis; the left flank is the southside and the right flank the north side. If the reader wishesto locate a specific feature, positions are given with respectto the alphabetical stations and some specified distancefrom a given flank. Maps of adjoining areas overlap andthe alphabetical stations in areas of overlap appear on bothto aid the reader in comparing the maps.
We will be examining the main scarp, various parts ofthe active landslide, and deforming ground ahead of theactive toe. The active landslide can be divided into sevenzones based on similarity of structural features within each(Fig. 5A). The uppermost, Zone 1, is called the head. Itcontains fractures indicative of both stretching and shorten-ing. Downslope from the head is Zone 2, broad bands ofnormal faults and tension cracks, that is more than 600 mwide. The next zone (3), the hopper and neck, is a funnel-shaped stretch where the landslide has its minimum widthand the displacement rate reaches its maximum. Downhillfrom the hopper and neck, the landslide gradually increasesin width through curves or offsets in the flank faults creat-ing Zone 4, pull-apart basins along both flanks. The nextprincipal features are (Zone 5) pond deposits and an emer-gent toe followed by an area of shortening and spreading(Zone 6), and Zone 7, the active toe. In general, the upperpart of the landslide (Zones 1 and 2) is characterized byfeatures associated with stretching such as normal faultsand tension cracks. The lowermost part of the landslide(Zones 5, 6, and 7) is characterized by features associatedwith shortening such as thrust faults. In between (Zones 3and 4), features are a result of widening or narrowing ofthe landslide. Also, in places where the slope of the land-slide is locally steeper than average, small landslides formon the surface of the larger landslide (Fig. 7A).
MAIN SCARP AND SOURCE AREAThe materials exposed in the main scarp are a complex
array of hydrothermally altered and unaltered volcanicmaterials including tuffs and intrusive and extrusive rocksof variable composition (Diehl and Schuster, 1996). TheMiocene Hinsdale Formation at the top of the 230-m-highscarp is unaltered vesicular basalt (Fig. 8). Below the basaltis the Miocene Sunshine Peak Tuff, a welded ash flow tuff.These Miocene units unconformably overlie the highlyaltered Oligocene Uncompahgre Peak volcanics, whichconsist mainly of andesite flows (Lipman, 1976). The prod-ucts of hydrothermal alteration, including alunite, smectite,

and opal, have been found in the altered rocks of the mainscarp as well as the debris forming the slide (Larsen, 1913;Diehl and Schuster, 1996). Faults, breccia pipes, jointing,and alteration contribute to the instability of the mainscarp, and rock avalanche chutes coincide with many of thefaults (Diehl and Schuster, 1996).
There is a general variation in composition of the mainscarp that has been useful in correlating landslide depositswith their sources. Rocks exposed on the south side of themain scarp are almost entirely altered to clays and range incolor from nearly white through yellow, brown, and red.There is a conspicuous lack of resistant, unaltered intrusiveor extrusive rocks to contribute to the landslide deposits.The form of the scarp also is different on the south side.Here, the top of the scarp is a north-trending topographicdivide, and the ground slopes away from the scarp in bothdirections indicating that the uppermost part of the land-slide broke through the crest of a hill. We will cross thesouth part of the scarp to get onto the landslide. On thenorth part, the scarp is not a topographic divide but ratherthe ground slopes down from Mesa Seco to an abrupt breakin slope at the top of the scarp. Rock in the northerly partof the scarp is capable of contributing large quantities ofresistant, slightly altered to unaltered rocks to the landslidedeposits.
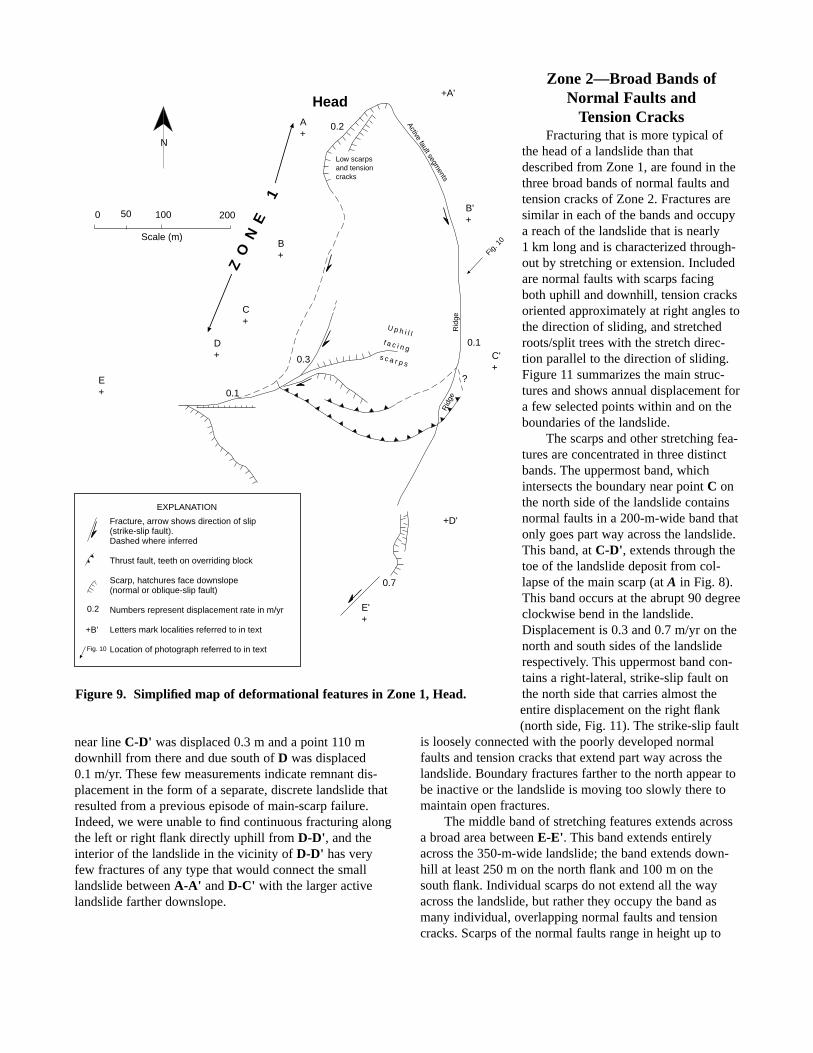
Zone 1—HeadThe uppermost fractures that we mapped in the head of
the landslide form a narrow zone on a topographic benchbelow a large pile of coarse talus (Area below B in Fig. 8and near A-A', Fig. 9). The fractures are poorly expressedtension cracks and normal faults; both indicative of stretch-
Figure 8. West part of main scarp, looking north.Collapse that triggered present episode of movementevidently came from area labeled A. Head of activeslide directly below point B. Main body of active slidein strip of tilted evergreens in middle of photograph.Axis of active slide curves abruptly from south (rough-ly toward viewer) at head to west (toward viewers left)near center of photograph.
ing. The landslide material in the area of the fractures is apowdery clayey silt that does not preserve fractures well.The scarps of the normal faults are low and some faceuphill; others face downhill. Several features that have theappearance of sinkholes and long, linear furrows are inter-preted to be depressions above tension cracks that openedat depth and propagated to the surface as collapse features.The band of most active features, near A-A', is about100 m across the landslide and about 20 m wide in thedirection of sliding. The stretching rate as measured acrossthe zone of fractures is about 0.2 m/yr. The flanks of thelandslide downhill from the stretch fractures are obscure,but several segments of an active strike-slip fault are pre-served along the left flank about 70 m downhill. Other thanthese few faults, the flanks were located (Fig. 9) by achange in slope or small furrow. Movement rates are appar-ently insufficient to maintain a conspicuous set of fractures.
The direction of sliding at the head is toward the southand is in the same direction as the inferred collapse of theMesa Seco (Fig. 4A and 5A). The load produced by the col-lapse apparently was the trigger for the currently activelandslide (Fig. 5A). Remnants of the toe of this collapse arepreserved as linear ridges outside the left flank in the vicin-ity of C' and within the active landslide along a discontinu-ous zone of toes about 70-90 m downhill from the line C-C' (Figs. 9 and 10). Uphill from the toes, in the area of C-C', is another zone of stretch features much like the upper-most zone mapped at A-A' and consisting mostly of uphillfacing scarps as much as 1.5-m high (Fig. 10). The mixtureof stretch features produced by normal faults and tensioncracks in the active landslide contrast sharply with thecompressional features produced by collapse of part of themain scarp (Fig. 9) in the same general area.
The presence of compressional and extensional fea-tures at the same places is confusing and alternative expla-nations for their coexistence are plausible. The uppermoststretch features are at A-A' (Fig. 9). Principal shorteningfeatures are along a line between D and C'. Here, a zone ofdiscontinuous internal toes and trees that have been pushedover and partly overridden by landslide material are diag-nostic of shortening. Overlapping the shortening features isa band of stretching features, principally scarps of normaland oblique-slip faults, that loosely connect with the north(right) flank. The stretch faults are probably a continuationof the zone of normal faults that intersect the right flankbetween D and E. The toe of the small landslide betweenA-A' and D-C' is being pulled apart by more rapid move-ment along the right flank farther downhill.
Displacement rates in the head of the landslide aresmall and the southward movement in the head of the land-slide is nearly independent of the westward movement far-ther downslope. The value of 0.2 m/yr at the uppermostfractures is a minimum because measurement points didnot extend across all the fractures. Farther downslope, at apoint on the left flank about 25 m uphill from line C-C'movement was only 0.1 m/yr. On the right flank, a point
isflabm
aahsam
N
0.1
0.3
D+
0.7
0 50 100 200
C+
A+
0.2
B+
Scale (m)
E+
E'+
Fracture, arrow shows direction of slip(strike-slip fault).Dashed where inferred
Thrust fault, teeth on overriding block
Scarp, hatchures face downslope(normal or oblique-slip fault)
Numbers represent displacement rate in m/yr
Letters mark localities referred to in text
Location of photograph referred to in text
0.2
+B'
U p h i l lf a c i n g
s c a r p s
Low scarpsand tensioncracks
Active faul
Head
ZO
NE
1
EXPLANATION
Fig. 10
Figure 9. Simplified map of deformational features in Zone 1
near line C-D' was displaced 0.3 m and a point 110 mdownhill from there and due south of D was displaced0.1 m/yr. These few measurements indicate remnant dis-placement in the form of a separate, discrete landslide thatresulted from a previous episode of main-scarp failure.Indeed, we were unable to find continuous fracturing alongthe left or right flank directly uphill from D-D', and theinterior of the landslide in the vicinity of D-D' has veryfew fractures of any type that would connect the smalllandslide between A-A' and D-C' with the larger activelandslide farther downslope.
c
Zone 2—Broad Bands ofNormal Faults and
Tension CracksFracturing that is more typical of
the head of a landslide than thatdescribed from Zone 1, are found in thethree broad bands of normal faults andtension cracks of Zone 2. Fractures aresimilar in each of the bands and occupya reach of the landslide that is nearly1 km long and is characterized through-out by stretching or extension. Includedare normal faults with scarps facingboth uphill and downhill, tension cracksoriented approximately at right angles tothe direction of sliding, and stretchedroots/split trees with the stretch direc-tion parallel to the direction of sliding.Figure 11 summarizes the main struc-tures and shows annual displacement fora few selected points within and on theboundaries of the landslide.
The scarps and other stretching fea-tures are concentrated in three distinctbands. The uppermost band, whichintersects the boundary near point C onthe north side of the landslide containsnormal faults in a 200-m-wide band thatonly goes part way across the landslide.This band, at C-D', extends through thetoe of the landslide deposit from col-lapse of the main scarp (at A in Fig. 8).This band occurs at the abrupt 90 degreeclockwise bend in the landslide.Displacement is 0.3 and 0.7 m/yr on thenorth and south sides of the landsliderespectively. This uppermost band con-tains a right-lateral, strike-slip fault onthe north side that carries almost theentire displacement on the right flank(north side, Fig. 11). The strike-slip fault
loosely connected with the poorly developed normalaults and tension cracks that extend part way across thendslide. Boundary fractures farther to the north appear toe inactive or the landslide is moving too slowly there toaintain open fractures.
The middle band of stretching features extends across broad area between E-E'. This band extends entirelycross the 350-m-wide landslide; the band extends down-ill at least 250 m on the north flank and 100 m on theouth flank. Individual scarps do not extend all the waycross the landslide, but rather they occupy the band asany individual, overlapping normal faults and tension
racks. Scarps of the normal faults range in height up to
+D'
0.1C'+
+A'
B'+
?
Rid
ge
Rid
ge
t segments
Fig. 1
0
, Head.

Uphill-facingscarps
Ridge
Pond
Right flank
Figure 10. View to south-southwest of flank ridge anduphill facing scarps near 90°-bend in landslide (down-hill end of Zone 1).
D'+
C+
D+
0.1
0.3
0.7
E'+
0.81.2
1.4
F+
1.4
1.7 F'+
2.9
G'+
2.8
G + 2.0
1.7
H +
4.1
H'+
0 50 100
SCALE (m
Frdirfa
Scscno
Nudis
Lere
1.7
+G
E+
Many overlapping scarps and cracks
Scarps
Many scarps
1.2
ZO
NE
2
Bro
ad Z
on
e o
f N
orm
al F
ault
s an
d T
ensi
on
Cra
cks
Figure 11. Simplified map of deformational features in ZoneBroad Bands of Normal Faults and Tension Cracks.
about 2 m. Displacement at a point 95 m uphill from E' onthe left flank is 0.7 m/yr and increases to 0.8 m/yr at apoint 110 m downhill from E'. On the north flank, 40 mdownhill from E, displacement is 1.2 m/yr.
The difference in displacement of about 0.4 m/yr onthe north flank compared to the south flank of the landslidehas kinematic significance, because it must be accommo-dated either by internal distortion or by movement on oneor more fault zones. The normal faults and tension cracksterminate in a well defined, left-lateral strike-slip fault zone(near F', Fig. 11) that carries about 0.3 m of the displace-ment difference between the landslide flanks. The left-later-al fault and adjoining band of normal faults define a blockthat can move through the 20° bend near F' with relativelylittle internal distortion, because the block is free to movenearly parallel to the flanks downhill from the bend.
The third band of normal faults extends between F'-H.Here, scarps and fractures are in a band more than 50 m
wide that transforms into a right-lateral,strike-slip fault where the band narrowsmidway across the slide near G. Thestrike-slip fault approaches the northflank near H (Fig. 11). Displacementrate along the north flank is 2.8 m/yrnear G and declines to 1.7 m/yr near H.Meanwhile, displacement increasesalong the south flank from 2.9 m/yrnear G' to 4.1 m/yr near H'. Appar-ently, there is more than 2 m/yr of dis-placement across the internal strike-slipfault. The position of this band alsocorresponds to a sharp bend in the land-slide; it turns counterclockwise 30°directly upslope from H.
The three internal strike-slip faultsevidently accommodate movementthrough curves in the flanks. Each ofthe broad bands of normal faults has anassociated strike-slip fault that joins theband to the flank where it curves.Overall, displacement progressivelyincreases downslope from less than 0.1m/yr to nearly 3 m/yr over the length ofthe zone.
Zone 3—The Hopper and NeckThe hopper is a 150-m-long fun-
nel-shaped area in the 500-m-long zonetermed Hopper and Neck that accom-modates narrowing of the landslide.The width of the landslide decreasesfrom 230 m at H-H' to 180 m at I-I',over the 150 m horizontal distance.
The hopper begins downhill fromthe third band of normal faults and ten-sion cracks described above (Fig. 11)
200
)
EXPLANATION
acture, arrow showsection of slip (strike-slipult)
arp, hatchures face inarp direction (inferredrmal or oblique-slip fault)
mbers representplacement rate in m/yr
tters mark localitiesferred to in text
N
2,

and extends 500 m downslope to the narrowest part of thelandslide, the “neck”. The materials entering this narrowingpart of the landslide are constrained laterally and materialshave the appearance of entering a hopper. We will cross anabrupt change in slope as we enter the hopper. Fig. 12 is asimplified map of fractures and other features in the hop-per.
On the north side of the landslide, 30 to 50 m downhillfrom H, the landslide surface has been tilted toward thecenter (indicated by “tilt” with arrows on Fig. 12). This tilt-ed area is matched for symmetry by a tilted surface on thesouth side that extends a little farther downslope than onthe north side. The slope of the tilted surface on the northside is as much as 50 percent ((∆v/∆h)×100%) whereas tiltamount on the south side is smaller, as much as 20 percent.The tilted surface on the north side is terminated on itsdownslope end by a discontinuous line of scarps thatextends from the north flank near H obliquely toward I'.Small en echelon tension cracks in the line of scarps revealthat the sense of slip is oblique, a left-lateral, normal (dipslip) fault zone.
4.2
TILT
TILT
TILT
TILT
3.0
1.7
3.0
6.0
T-9+J
7.4
6.3
4.0
+I'
+H'
+G'
+I
+H
0 10050
Scale (m)
T-10
+
Break in slope(at scarp)
Small landslidQ
Q
Q
Tension cracksandnormal fault scarps
Thrustfaultsandbucklefolds
Depression
Hopper
No
tree
s
Norm
al fa
ults
and
tens
ion
crac
ksD
istr
ibut
ed s
hear
ing
Neck
ZO
NE
3
5-10% slope
35% slope
Figure 12. Simplified map of deformational features in Zon
Trees on the tilted surface on the north side are uni-formly inclined toward the middle of the landslide and areapproximately normal to the ground surface; trees are gen-erally absent on the south side. The tilted surfaces areinclined toward each other, and the inclined surfaces pro-gressively point toward the middle of the landslide in adownslope direction. Along both flanks of the landslide,from H-I and H'-I' (Fig. 12), the landslide debris is void oftrees and soft, powdery white-to-yellow clay-rich materialis exposed. The remaining trees on the surface of the land-slide between H-I are along the bottom of the swale downthe middle of the landslide. Motion on each flank of thehopper appears to be screw-like (in transverse cross sec-tion) with material being extruded near the landslide flanksand being folded together along the midline of the land-slide. Landslide materials are extensively remolded in theshort stretch between H-H' and I-I'. The hopper-like struc-ture ends approximately at I-I' where two thrust faults ori-ented parallel to the direction of sliding mark the intersec-tion of the tilted surfaces.
N
EXPLANATION
Fracture, arrow shows direction ofslip (strike-slip fault)
Thrust fault, teeth on overriding block
Scarp, hatchures face in direction ofscarp (normal or oblique-slip fault)
Tilted ground surface, arrow pointsdownslope
Survey control point
Numbers represent displacementrate in m/yr
Letters mark localities referred toin text
5.9
+J
J'
TILT
e within main slide
T-10
e 3, Hopper and Neck.

The downslope end of the hopper-like structure isabruptly broken by a sharp zone of normal faults and ten-sion cracks. The zone begins at I', trends obliquely down-hill across the landslide toward J, turns north and intersectsthe north boundary of the landslide halfway between I andJ. Small en echelon tension cracks in the well-formed zoneabout 50 m inside the south boundary at I' indicate that slipis oblique, right-lateral and normal (down). Most of thenarrowing of the landslide has been accommodated fartherupslope, and this structure has probably formed to accom-modate a continuation of increasing displacement rate withdistance from the head of the landslide.
There is a line of fractures and scarps that trendsdownslope from the place where the zone of normal faultsand tension cracks changes direction (halfway between Iand J, 50 m from the north boundary). This line continuesroughly parallel to the landslide boundaries. The featuresalong the line are not well preserved; locally, there are enechelon cracks suggestive that the zone is a right-lateralstrike-slip fault. Definitive evidence from split trees orstretched roots is lacking. The zone may be a relict struc-ture that was produced in the hopper and has been trans-ported downhill. As such, it would have no kinematic sig-nificance to current movements.
The landslide continues to narrow to near the line of J-J', where it is about 160 m wide. Maximum displacementrate was recognized by Crandell and Varnes (1961) to benear here, and they established a survey line and took time-lapse photographs of the movement. Note that there is apoorly developed right-lateral fault about 30 m from thesouth boundary at J'. This fault is apparently the right sideof a small landslide element along the south flank that issuperimposed on the larger Slumgullion landslide.Displacement rate should be a maximum here where theshallow movement is superimposed on the maximum rateof displacement of the Slumgullion landslide. The pointbelieved to be near the point of maximum rate is marked“7.4” at the bottom of Figure 12.
Zone 4—Pull-Apart Basins Along Both FlanksPull-apart basins are structural and topographic basins
that form next to the flanks where they step laterally towiden the landslide (Fig. 13). The landslide widens down-hill from the neck at steps or offsets in both flanks (Zone4); over a distance of nearly 1 km, the slide widens from160 m to 260 m. Long, narrow basins have formed directlydownhill from three right-stepping offsets in the right flankand at one slight left-stepping offset in the left flank (Fig.14). Within a few meters of a step, the landslide materialnext to the basin begins slumping to fill it; the process offilling the basin is accomplished over a distance of severalhundred meters. We will examine one of these pull-apartbasins to learn about their typical topographic and structur-al features and the process of basin filling.
The best expressed basin is on the north side, betweenJ and K in Figure 13; less well expressed basins on thenorth side are between L and M and between M and N.The well-developed basin between J and K contains all thefeatures seen at the other basins and is depicted in Figures15, 16A, and 16B. The zone of strike-slip faulting on thenorth (right) flank bifurcates where it changes orientation atJ; one part follows the north flank as a narrow zone ofstrike-slip faulting on the landslide boundary (Fig. 15). Theother part forms a crescent-shaped group of scarps andfractures that gradually turns parallel to the north flank(Fig. 16A). A 5-m deep basin occupies the area betweenthis crescent-shaped group and the north flank. Within thebasin and parallel to the landslide boundary, there are sev-eral shortening features such as small thrust faults andbuckle folds. Rotated blocks bounded by the crescent-shaped group of scarps and the shortening features in thebasin are smaller landslides within the overall larger land-slide in which material is being transported into the basin(Fig. 15). The crescent-shaped group of scarps are the sur-face manifestation of oblique-slip (right-lateral- and dip-slip) listric faults. The structure appears analogous to pull-apart basins in larger tectonic settings where movement onlistric faults transports material from the flanks of the basinto its center.
About 200 m downhill from J, the crescent-shapedgroup of scarps turns toward the basin and terminates inthe basin in folds and thrust faults (Fig. 15). The bucklingand thrusting is evident mostly in the tilting of small treesand bushes in the basin (Fig. 16B). There is a small pond atthe deepest part of the basin that accumulates water-transported sediment and helps fill the basin (Fig. 16A).Pond sediments extend downslope from the existing pondas the landslide translates the materials, but not the pull-apart structure, downslope.
Downhill 50 m from K (Fig. 15), the basin has beencompletely filled. Further downhill from the basin, thereare numerous inactive scarps and hummocky topographythat are not shown on the sketches. These inactive featuresapparently formed in the pull-apart basin and were deacti-vated as they were transported beyond the basin.
Other basins along the active flanks of the Slumgullionlandslide (Fig. 13) do not contain all the features shown onFigure 15. However, they do generally have slump blocksthat are moving from the inboard side of the basin towardthe flanks. The toes of these slumps form folds and/orthrust faults in the deepest parts of the basins. Likewise,oblique lines of scarps at the downhill ends of the largerbasins mark the heads of these slumps that fill the basins.
Zone 5—Pond Deposits and Emergent ToeAs we traverse downhill from Zone 4 into Zone 5, we
enter an area of thrust faults and extensive pond deposits.The area of thrust faults uphill from the pond deposits iscentered approximately on O-O' and is the first major indi-

+N
+M3.3
3.5 L+
3.9
K+
4.1 5.8
J+
7.4
J'+
5.2
+K'4.8
+L'4.44.2
+M'
4.0
+N'
3.9
N
EXPLANATION
Fracture, arrow shows direction of slip (strike-slip fault)
Thrust fault, teeth on overriding plate
Scarp, hatchures face downslope(normal or oblique-slip fault)
Anticline
Numbers represent displacement rate in m/yr
Letters mark localities referred to in text
Location of photograph referred to in text
3.5
+L
Scale (m)
0 50 100
Abrupt breakin slope
Pull-apart basin
Poorly developedpull-apart basin
Bench
Zone of normal faultsand tension cracksSteep
Discontinuous line of scarps
Hummockytopography
Pull-apartbasin
Poorly developedpull-apart basin
Oblique lineof faults
Z O N E 4
Pull-Apart Basins
Fig. 3BFig. 3A
Fig. 2
Fig. 16B Fig. 16A
Truncated
flank ridge
Fig. 14
Fig. 14
Figure 13. Simplified map of deformational features in Zone 4, Pull-Apart Basins Along both Flanks. Note steps oroffsets in flanks directly upslope from the basins.
Pull-apartbasin
Thrusting
Main scarp
Left
flank
Figure 14. View of poorly developed pull-apart basinalong left flank (photograph by Jack Odum, U.S.Geological Survey).

TILT
Basinfilled
North flank of active landslide
Deepest partof basin
Basin created
Strike-slip faultbifurcates
South flank of active landslide
NScale (m)
0 50 100
Rotated slumpblocks into basin
+K
+J
Faults transfer material to fill basin
Change in orientation of landslide boundary—
Faults oblique to
landslide flanks
Pull-apart basin
Blocks sliding
into basin
Fig. 16B
Fig. 16A
Northwestern basin of ZONE 4
EXPLANATION
Fracture, arrow shows direction of slip (strike-slip fault)
Thrust fault, teeth on overriding plate
Scarp, hatchures face downslope(normal or oblique-slip fault)
Anticline
Letters mark localities referred to in text
Location of photograph referred to in text
+K
Fig. 16B
Figure 15. Idealized features in pull-apart basin based on the basin on the north flank between J and K. The basinforms where the landslide becomes wider through a bend or step in the bounding strike-slip fault. The features cre-ated within the moving landslide all serve to translate material into the basin. In the upper part, material is movedinto the basin by a series of rotational slumps. Farther downslope, material is translated into the basin along curv-ing strike-slip faults that terminate in the basin in buckle folds and thrust faults. At the downslope end of the basin,there is a zone of oblique slip faults that translate material across the landslide and complete filling of the basin.
Abandonedflank ridge
Basin
Pond
Right flank
Slumpblocks
Right flank
Thrustsheet
Slump blocksfilling basin
Figure 16. A. View looking southwest into large pull-apart basin on right flank. B. View to northeast frombottom of same pull-apart basin, pond sediments inforeground. Note tilted trees on thrust sheet.
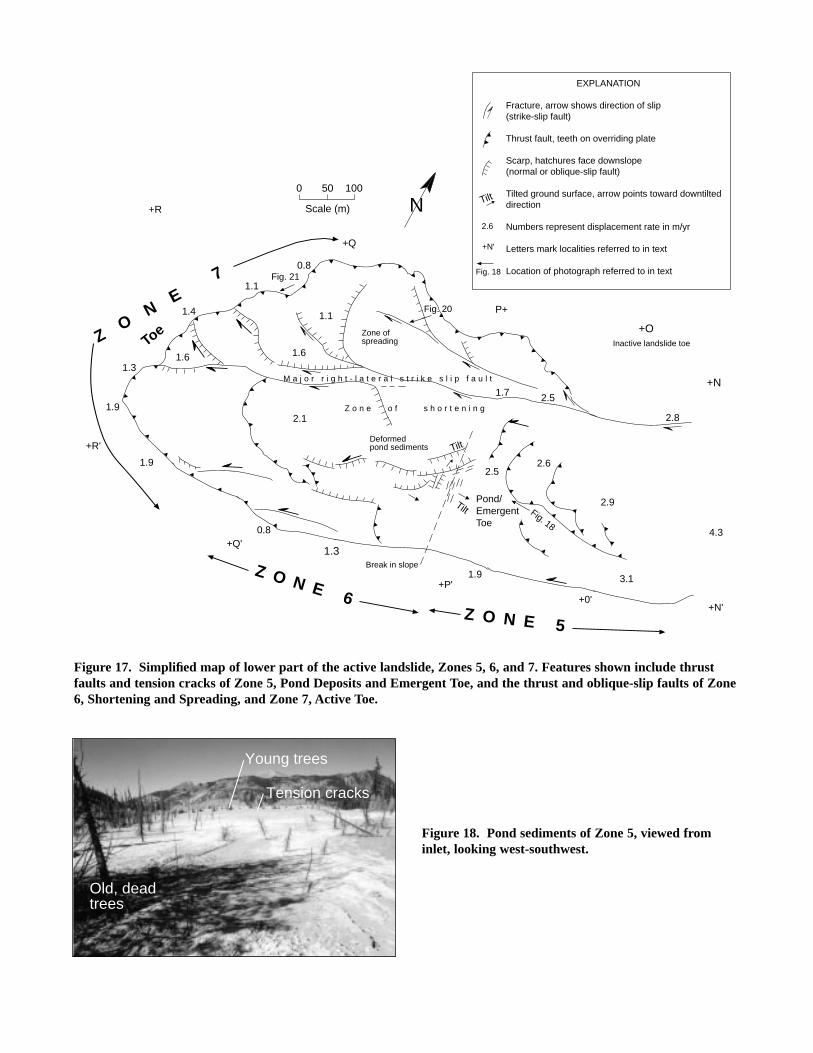
cation of deep-seated shortening features on the landslide(Fig. 17). Other thrust faults uphill from this area are relat-ed to pull-apart basins or represent internal toes of smalllandslides superimposed on the larger landslide. Across thezone of thrust faults at O-O', the displacement rate dimin-ishes from about 4 m/yr to about 2.5 m/yr. The position ofthis zone of shortening coincides with a large, inactive seg-ment of landslide toe to the north of the active landslideflank at O. This inactive part of the toe is labeled but itsoutline is not shown on the sketch. Even though the toesegment to the north is inactive, it rests on deposits fromthe old, inactive part of the Slumgullion landslide (Fig. 4Aand 4B). It is therefore believed to be part of the currentepisode of movement (Fig. 4). As we pass through thiszone, we will stop to examine some of the lobate thrustfaults shown in Figure 17.
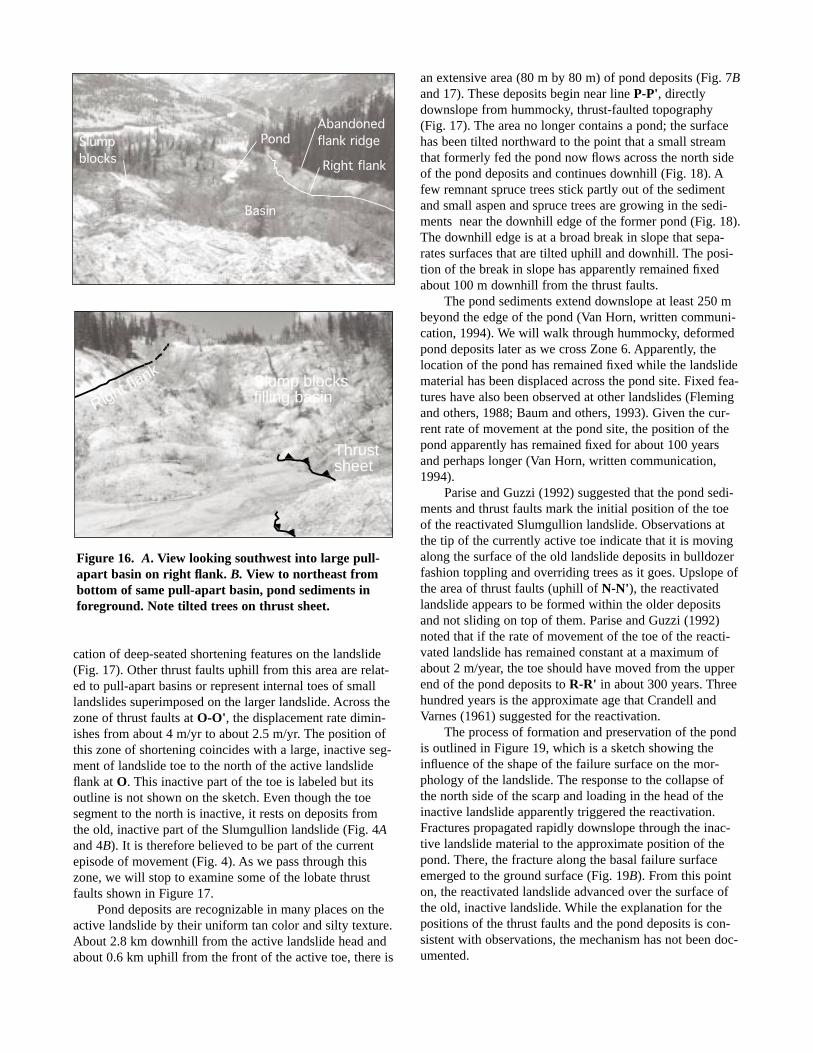
Pond deposits are recognizable in many places on theactive landslide by their uniform tan color and silty texture.About 2.8 km downhill from the active landslide head andabout 0.6 km uphill from the front of the active toe, there is
an extensive area (80 m by 80 m) of pond deposits (Fig. 7Band 17). These deposits begin near line P-P', directlydownslope from hummocky, thrust-faulted topography(Fig. 17). The area no longer contains a pond; the surfacehas been tilted northward to the point that a small streamthat formerly fed the pond now flows across the north sideof the pond deposits and continues downhill (Fig. 18). Afew remnant spruce trees stick partly out of the sedimentand small aspen and spruce trees are growing in the sedi-ments near the downhill edge of the former pond (Fig. 18).The downhill edge is at a broad break in slope that sepa-rates surfaces that are tilted uphill and downhill. The posi-tion of the break in slope has apparently remained fixedabout 100 m downhill from the thrust faults.
The pond sediments extend downslope at least 250 mbeyond the edge of the pond (Van Horn, written communi-cation, 1994). We will walk through hummocky, deformedpond deposits later as we cross Zone 6. Apparently, thelocation of the pond has remained fixed while the landslidematerial has been displaced across the pond site. Fixed fea-tures have also been observed at other landslides (Flemingand others, 1988; Baum and others, 1993). Given the cur-rent rate of movement at the pond site, the position of thepond apparently has remained fixed for about 100 yearsand perhaps longer (Van Horn, written communication,1994).
Parise and Guzzi (1992) suggested that the pond sedi-ments and thrust faults mark the initial position of the toeof the reactivated Slumgullion landslide. Observations atthe tip of the currently active toe indicate that it is movingalong the surface of the old landslide deposits in bulldozerfashion toppling and overriding trees as it goes. Upslope ofthe area of thrust faults (uphill of N-N'), the reactivatedlandslide appears to be formed within the older depositsand not sliding on top of them. Parise and Guzzi (1992)noted that if the rate of movement of the toe of the reacti-vated landslide has remained constant at a maximum ofabout 2 m/year, the toe should have moved from the upperend of the pond deposits to R-R' in about 300 years. Threehundred years is the approximate age that Crandell andVarnes (1961) suggested for the reactivation.
The process of formation and preservation of the pondis outlined in Figure 19, which is a sketch showing theinfluence of the shape of the failure surface on the mor-phology of the landslide. The response to the collapse ofthe north side of the scarp and loading in the head of theinactive landslide apparently triggered the reactivation.Fractures propagated rapidly downslope through the inac-tive landslide material to the approximate position of thepond. There, the fracture along the basal failure surfaceemerged to the ground surface (Fig. 19B). From this pointon, the reactivated landslide advanced over the surface ofthe old, inactive landslide. While the explanation for thepositions of the thrust faults and the pond deposits is con-sistent with observations, the mechanism has not been doc-umented.
N
1.7 2.5
P+
0.8
1.1
1.4
1.3
1.9
1.9
+R'
0.8+Q'
1.9+P'
3.1
+0'+N'
4.3
2.9
2.62.5
TiltPond/EmergentToe
Tilt
2.82.1
1.6
1.1
0 50 100
Scale (m)
EXPLANATION
Fracture, arrow shows direction of slip(strike-slip fault)
Thrust fault, teeth on overriding plate
Scarp, hatchures face downslope(normal or oblique-slip fault)
Tilted ground surface, arrow points toward downtilteddirection
Numbers represent displacement rate in m/yr
Letters mark localities referred to in text
Location of photograph referred to in text
+O
+N
Tilt
2.6
+N'
1.3
1.6Inactive landslide toe
Zone ofspreading
M a j o r r i g h t - l a t e r a l s t r i k e s l i p f a u l t
Z o n e o f s h o r t e n i n g
Deformedpond sediments
+Q
+R
Break in slope
ZO
NE
7
Z O N E 5
Z O N E 6
Fig. 18
Toe
Fig. 21
Fig. 20
Fig. 18
Figure 17. Simplified map of lower part of the active landslide, Zones 5, 6, and 7. Features shown include thrustfaults and tension cracks of Zone 5, Pond Deposits and Emergent Toe, and the thrust and oblique-slip faults of Zone6, Shortening and Spreading, and Zone 7, Active Toe.
Young trees
Old, deadtrees
Tension cracks
Figure 18. Pond sediments of Zone 5, viewed frominlet, looking west-southwest.

Zone 6—Region of Shortening and SpreadingThe active landslide at N-N' (Fig. 17) is about 260 m
wide. Five hundred meters downslope, the landslide is430 m wide. This increase in width is a result of spreadingalong the north flank. The zone of spreading on the northside contrasts with a zone of shortening on the south side.The different kinematic expressions of the two parts of thelandslide are separated by a major, right-lateral strike-slipfault that bounds the north flank of the landslide at N andcontinues internally through the landslide beginning at O(Fig. 17). This major dividing fault intersects the downs-lope end of the active landslide about 150 m northwest ofR'. North of this fault, the landslide is advancing andspreading. South of this fault, the landslide is advancingbut at progressively reduced rates because of internal short-ening within the landslide.
Propagating fracture
from reactivation
Base of old landslide deposits
Active landslide
Emergent toe
Pond
Base of old landslide deposits
Deformedtrees
Newtrees
Pondsediments
Pond
Dead trees
A
BBase of old landslide deposits
C
Overruntrees
Figure 19. Sketch of concept of pond formation in con-junction with emergent toe of reactivated movement.
The deformation structures on the north side of thelandslide consist of strike-slip and oblique-slip (right-lateral slip and opening or spreading) faults. Pure strike-slip faults are difficult to identify in this part of the land-slide because the crumbly landslide debris does not pre-serve fractures well. In a few places along the trend of astrike-slip fault, a scarp is produced, and the fault positioncan be accurately located. Where a pure strike-slip faultchanges orientation, a scarp is produced and stretched rootsor split trees (Fig. 20) reveal that the fault accommodatesoblique slip indicative of spreading of the toe.
The spreading is accommodated by these oblique-slipfractures. The major strike-slip fault bounding the northflank at N divides at O into two parts. One part curvesnorthwesterly (obliquely) down to the active toe. The mainfault continues southwesterly to between P and Q where itdivides again, here into three parts. In each instance, thecurving fault trends toward the landslide boundary andapparently accommodates oblique slip.
The entire north side of the landslide toe is composedof oblique-slip structures. Deformation across these struc-tures consist of right-lateral slip and opening/spreading.This is well illustrated at a spruce tree that was caught inone of these oblique-slip zones (Fig. 20). The fault zoneoccupies a small furrow that crosses under the tree. Thereare no open cracks or fractures; the position of the fault isgiven only by the furrow and the split tree. The right-handside of the tree is about 1 m farther downslope than theleft-hand side, and the opening normal to the strike-slipdirection is about 0.8 m. The split tree is definitive evi-dence of right-lateral slip together with spreading. Thereare numerous troughs and furrows in this part of the land-slide, and only in a few places, like shown in Figure 20,can they be shown to be locations of active movement.
Interpretation of displacement rate of the north part iscomplex. The displacement progressively diminishes alongthe major, strike-slip dividing fault from 2.8 m/yr near N to2.5 m/yr just downhill from the first division of the fault.Annual displacement rate decreases to 1.7 m/yr about 50 mfurther downhill. This change in displacement rate, howev-er, reflects movement of the south side of the major strike-slip fault relative to the north side. Movement rate of mate-rial on the north side of the fault near P relative to theboundary is unknown. Farther downhill, where the majorfault divides into three parts, more displacement is trans-ferred to the oblique-slip faults on the north side such thattwo fault-bounded blocks along the line Q-Q' and north ofthe major fault are displaced 1.1 and 1.6 m/yr.
The part of the landslide that is south of the majorinternal strike-slip fault contains two bands of internal toesthat represent shortening of landslide material (Fig. 17).One band of toes is the thrust fault described above as partof Zone 5, the pond sediments and emergent toe. The band,about 80 m wide, begins near N' and extends obliquelyacross the landslide. Within the band, the thrust faults con-sist of individual, overlapping fault segments. Based on the
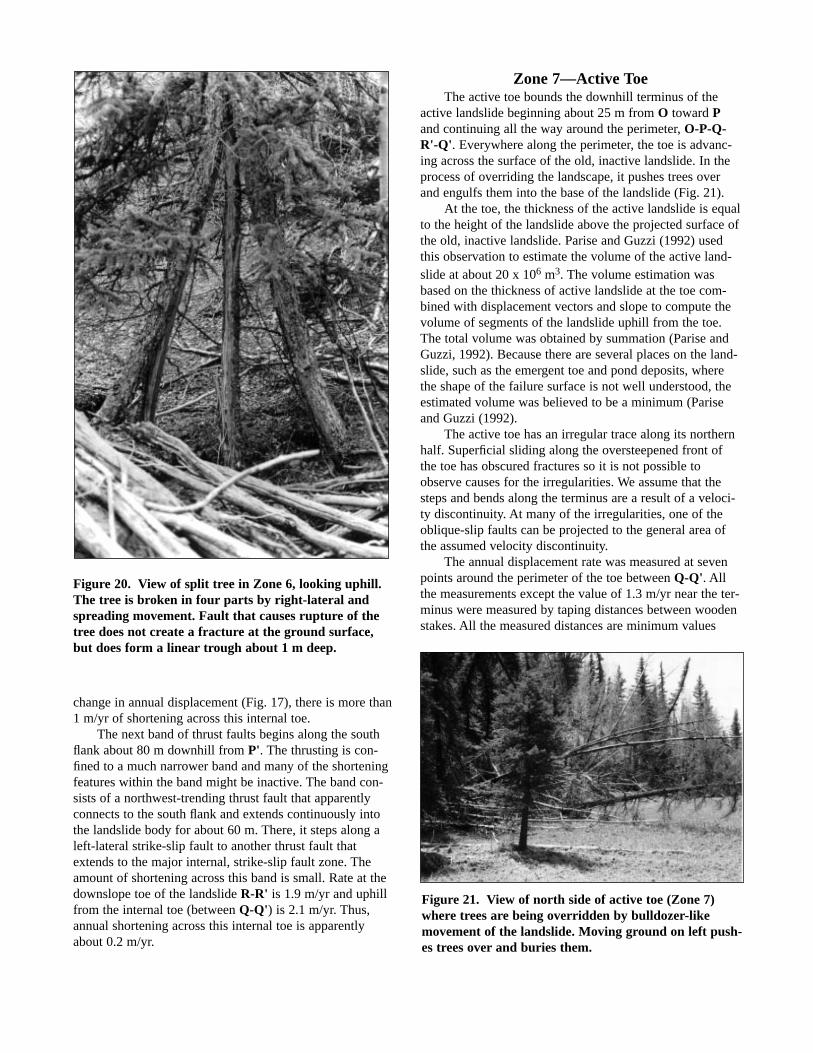
Figure 20. View of split tree in Zone 6, looking uphill.The tree is broken in four parts by right-lateral andspreading movement. Fault that causes rupture of thetree does not create a fracture at the ground surface,but does form a linear trough about 1 m deep.
Figure 21. View of north side of active toe (Zone 7)where trees are being overridden by bulldozer-likemovement of the landslide. Moving ground on left push-es trees over and buries them.
change in annual displacement (Fig. 17), there is more than1 m/yr of shortening across this internal toe.
The next band of thrust faults begins along the southflank about 80 m downhill from P'. The thrusting is con-fined to a much narrower band and many of the shorteningfeatures within the band might be inactive. The band con-sists of a northwest-trending thrust fault that apparentlyconnects to the south flank and extends continuously intothe landslide body for about 60 m. There, it steps along aleft-lateral strike-slip fault to another thrust fault thatextends to the major internal, strike-slip fault zone. Theamount of shortening across this band is small. Rate at thedownslope toe of the landslide R-R' is 1.9 m/yr and uphillfrom the internal toe (between Q-Q') is 2.1 m/yr. Thus,annual shortening across this internal toe is apparentlyabout 0.2 m/yr.
Zone 7—Active ToeThe active toe bounds the downhill terminus of the
active landslide beginning about 25 m from O toward Pand continuing all the way around the perimeter, O-P-Q-R'-Q'. Everywhere along the perimeter, the toe is advanc-ing across the surface of the old, inactive landslide. In theprocess of overriding the landscape, it pushes trees overand engulfs them into the base of the landslide (Fig. 21).
At the toe, the thickness of the active landslide is equalto the height of the landslide above the projected surface ofthe old, inactive landslide. Parise and Guzzi (1992) usedthis observation to estimate the volume of the active land-slide at about 20 x 106 m3. The volume estimation wasbased on the thickness of active landslide at the toe com-bined with displacement vectors and slope to compute thevolume of segments of the landslide uphill from the toe.The total volume was obtained by summation (Parise andGuzzi, 1992). Because there are several places on the land-slide, such as the emergent toe and pond deposits, wherethe shape of the failure surface is not well understood, theestimated volume was believed to be a minimum (Pariseand Guzzi (1992).
The active toe has an irregular trace along its northernhalf. Superficial sliding along the oversteepened front ofthe toe has obscured fractures so it is not possible toobserve causes for the irregularities. We assume that thesteps and bends along the terminus are a result of a veloci-ty discontinuity. At many of the irregularities, one of theoblique-slip faults can be projected to the general area ofthe assumed velocity discontinuity.
The annual displacement rate was measured at sevenpoints around the perimeter of the toe between Q-Q'. Allthe measurements except the value of 1.3 m/yr near the ter-minus were measured by taping distances between woodenstakes. All the measured distances are minimum values
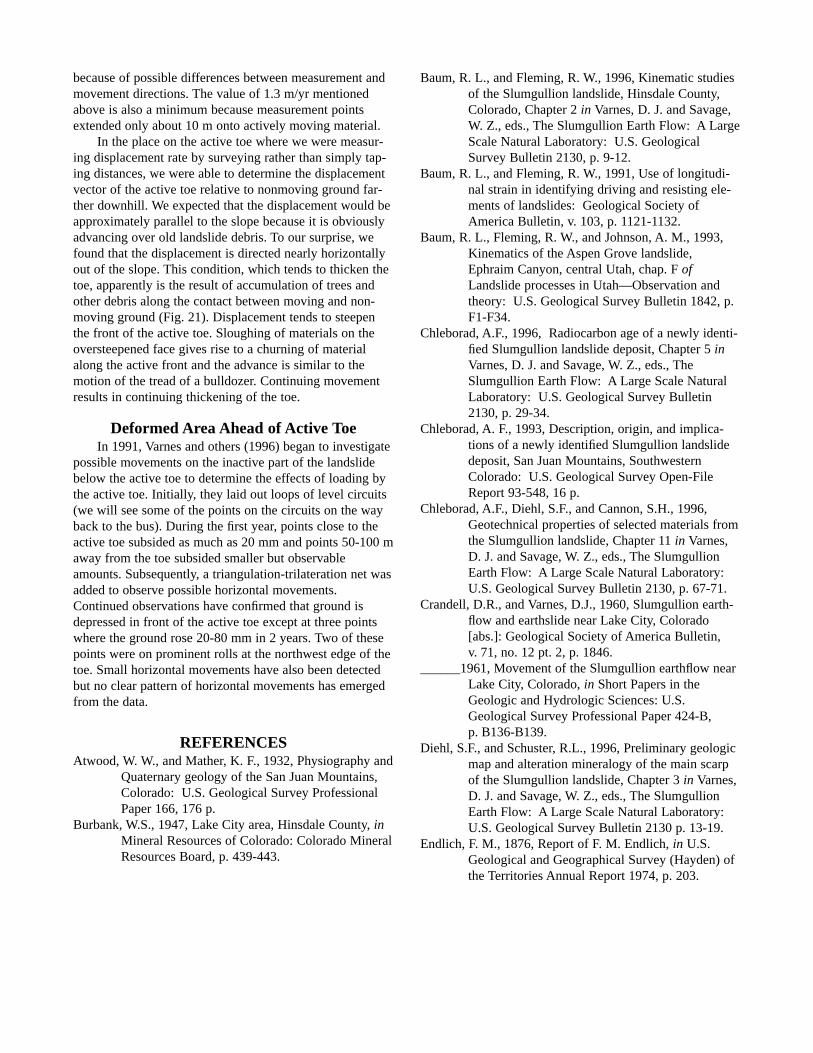
because of possible differences between measurement andmovement directions. The value of 1.3 m/yr mentionedabove is also a minimum because measurement pointsextended only about 10 m onto actively moving material.
In the place on the active toe where we were measur-ing displacement rate by surveying rather than simply tap-ing distances, we were able to determine the displacementvector of the active toe relative to nonmoving ground far-ther downhill. We expected that the displacement would beapproximately parallel to the slope because it is obviouslyadvancing over old landslide debris. To our surprise, wefound that the displacement is directed nearly horizontallyout of the slope. This condition, which tends to thicken thetoe, apparently is the result of accumulation of trees andother debris along the contact between moving and non-moving ground (Fig. 21). Displacement tends to steepenthe front of the active toe. Sloughing of materials on theoversteepened face gives rise to a churning of materialalong the active front and the advance is similar to themotion of the tread of a bulldozer. Continuing movementresults in continuing thickening of the toe.
Deformed Area Ahead of Active ToeIn 1991, Varnes and others (1996) began to investigate
possible movements on the inactive part of the landslidebelow the active toe to determine the effects of loading bythe active toe. Initially, they laid out loops of level circuits(we will see some of the points on the circuits on the wayback to the bus). During the first year, points close to theactive toe subsided as much as 20 mm and points 50-100 maway from the toe subsided smaller but observableamounts. Subsequently, a triangulation-trilateration net wasadded to observe possible horizontal movements.Continued observations have confirmed that ground isdepressed in front of the active toe except at three pointswhere the ground rose 20-80 mm in 2 years. Two of thesepoints were on prominent rolls at the northwest edge of thetoe. Small horizontal movements have also been detectedbut no clear pattern of horizontal movements has emergedfrom the data.
REFERENCESAtwood, W. W., and Mather, K. F., 1932, Physiography and
Quaternary geology of the San Juan Mountains,Colorado: U.S. Geological Survey ProfessionalPaper 166, 176 p.
Burbank, W.S., 1947, Lake City area, Hinsdale County, inMineral Resources of Colorado: Colorado MineralResources Board, p. 439-443.
Baum, R. L., and Fleming, R. W., 1996, Kinematic studiesof the Slumgullion landslide, Hinsdale County,Colorado, Chapter 2 in Varnes, D. J. and Savage,W. Z., eds., The Slumgullion Earth Flow: A LargeScale Natural Laboratory: U.S. GeologicalSurvey Bulletin 2130, p. 9-12.
Baum, R. L., and Fleming, R. W., 1991, Use of longitudi-nal strain in identifying driving and resisting ele-ments of landslides: Geological Society ofAmerica Bulletin, v. 103, p. 1121-1132.
Baum, R. L., Fleming, R. W., and Johnson, A. M., 1993,Kinematics of the Aspen Grove landslide,Ephraim Canyon, central Utah, chap. F ofLandslide processes in Utah—Observation andtheory: U.S. Geological Survey Bulletin 1842, p.F1-F34.
Chleborad, A.F., 1996, Radiocarbon age of a newly identi-fied Slumgullion landslide deposit, Chapter 5 inVarnes, D. J. and Savage, W. Z., eds., TheSlumgullion Earth Flow: A Large Scale NaturalLaboratory: U.S. Geological Survey Bulletin2130, p. 29-34.
Chleborad, A. F., 1993, Description, origin, and implica-tions of a newly identified Slumgullion landslidedeposit, San Juan Mountains, SouthwesternColorado: U.S. Geological Survey Open-FileReport 93-548, 16 p.
Chleborad, A.F., Diehl, S.F., and Cannon, S.H., 1996,Geotechnical properties of selected materials fromthe Slumgullion landslide, Chapter 11 in Varnes,D. J. and Savage, W. Z., eds., The SlumgullionEarth Flow: A Large Scale Natural Laboratory:U.S. Geological Survey Bulletin 2130, p. 67-71.
Crandell, D.R., and Varnes, D.J., 1960, Slumgullion earth-flow and earthslide near Lake City, Colorado[abs.]: Geological Society of America Bulletin,v. 71, no. 12 pt. 2, p. 1846.
______1961, Movement of the Slumgullion earthflow nearLake City, Colorado, in Short Papers in theGeologic and Hydrologic Sciences: U.S.Geological Survey Professional Paper 424-B,p. B136-B139.
Diehl, S.F., and Schuster, R.L., 1996, Preliminary geologicmap and alteration mineralogy of the main scarpof the Slumgullion landslide, Chapter 3 in Varnes,D. J. and Savage, W. Z., eds., The SlumgullionEarth Flow: A Large Scale Natural Laboratory:U.S. Geological Survey Bulletin 2130 p. 13-19.
Endlich, F. M., 1876, Report of F. M. Endlich, in U.S.Geological and Geographical Survey (Hayden) ofthe Territories Annual Report 1974, p. 203.

,
Fleming, R. W., Baum. R. L., and Johnson, A. M., 1993,Deformation of landslide surfaces as indicators ofmovement processes, in Proceedings of the 2ndSeminar on Landslide Hazards, Cosenza, Italy,March 5-6, 1990: Geographica Fisica e DinamicaQuaternaria, v. 16, no. 1, p. 9-11.
Fleming, R. W., and Johnson, A.M., 1989, Structures asso-ciated with strike-slip faults that bound landslideelements: Engineering Geology, v. 27, p. 39-114.
Fleming, R. W., Johnson, R. B., and Schuster, R. L., 1988,The reactivation of the Manti landslide, Chap. Aof The Manti landslide, Utah: U.S. GeologicalSurvey Professional Paper 1311, p. 1-22, 1 Pl.
Gomberg, J.S., Bodin, P.W., Savage, W. Z., and Jackson,M. E., 1995, Landslide faults and tectonic faults,analogs?: The Slumgullion earthflow, Colorado:Geology, v. 23, no. 1, p. 41-44.
Guzzi, R., and Parise, M., 1992, Surface features and kine-matics of the Slumgullion landslide near LakeCity, Colorado: U.S. Geological Survey Open-File Report 92-252, 45 p.
Howe, E., 1909, Landslides in the San Juan Mountains,Colorado: U.S. Geological Survey ProfessionalPaper 67, 45 p.
Keefer, D.K., and Johnson, A.M., 1983, Earth flows: mor-phology, mobilization, and movement: U.S.Geological Survey Professional Paper 1264, 56 p.
Larsen, E.E., 1913, Alunite in the San Cristobal quadran-gle, Colorado: U.S. Geological Survey Bulletin530-F, p. 179-183.
Lipman, P. W., 1976, Geologic map of the Lake Citycaldera area, western San Juan Mountains, south-western Colorado: U.S. Geological SurveyMiscellaneous Investigations Series Map I-962,scale 1:48,000.
Madole, R.F., 1996, Preliminary chronology of theSlumgullion landslide, Hinsdale County,Colorado, Chapter 1 in Varnes, D. J. and Savage,W. Z., eds., The Slumgullion Earth Flow: A LargeScale Natural Laboratory: U.S. GeologicalSurvey Bulletin 2130, p. 5-7.
Parise, M., and Guzzi, R., 1992, Volume and shape of theactive and inactive parts of the Slumgullion land-slide, Hinsdale County, Colorado: U.S.Geological Survey Open-File report 92-216, 29 p.
Savage, W. Z., and Fleming, R. W., 1996, Slumgullionlandslide fault creep studies, Chapter 12 in VarnesD. J. and Savage, W. Z., eds., The SlumgullionEarth Flow: A Large Scale Natural Laboratory:U.S. Geological Survey Bulletin 2130, p. 73-76.
Schuster, R.L., 1996, Slumgullion landslide dam and itseffects on the Lake Fork, Chapter 6 in Varnes,D. J. and Savage, W. Z., eds., The SlumgullionEarth Flow: A Large Scale Natural Laboratory:U.S. Geological Survey Bulletin 2130, p. 35-41.
Smith, W. K., 1993, Photogrammetric determination ofmovement on the Slumgullion slide, HinsdaleCounty, Colorado, 1985-1990: U.S. GeologicalSurvey Open-File Report 93-597, 17 p., 2 Pl.
Varnes, D. J., and Savage, W. Z., eds., 1996, TheSlumgullion Earth Flow: A Large Scale NaturalLaboratory: U.S. Geological Survey Bulletin2130, 95 p.
Varnes, D.J., Smith, W.K., Savage, W.Z., and Powers, P.S.,1996, Deformation and control surveys,Slumgullion landslide, Chapter 7 in Varnes, D. J.and Savage, W. Z., eds., The Slumgullion EarthFlow: A Large Scale Natural Laboratory: U.S.Geological Survey Bulletin 2130, p. 43-49.
Williams, R.A., and Pratt, T.L., 1996, Detection of the baseof Slumgullion landslide, Colorado, by seismicreflection and refraction methods, Chapter 13 inVarnes, D. J. and Savage, W. Z., eds., TheSlumgullion Earth Flow: A Large Scale NaturalLaboratory: U.S. Geological Survey Bulletin2130, p. 77-83.