The Slow Assimilation of British Immigrants in … mackinnon...Early in the 20th century, Canadians...
24
The Slow Assimilation of British Immigrants in Canada: Evidence from Montreal and Toronto, 1901 1 Alan Green Department of Economics, Queen’s University, Kingston, Ontario, Canada and Mary MacKinnon Department of Economics, McGill University, Montreal, Quebec, Canada E-mail: [email protected] Published online May 8, 2001 Using a new sample of individual-level data compiled from the manuscript returns of the 1901 Census of Canada, this article examines the assimilation of male wage-earning immi- grants (mainly from the UK) in Montreal and Toronto. Unlike studies of post-World War II immigrants to Canada, and some recent studies of 19th century immigration to the United States, we find slow assimilation to the earnings levels of native-born English mother-tongue Canadians. While immigrants from the UK were about as likely as the Canadian-born to be in craft jobs, they were much less likely to work in the clerical sector. Within the blue-collar sector, English and Scottish immigrants were at little disadvantage. © 2001 Academic Press Key Words: British immigrants; assimilation; census data; occupational choice. INTRODUCTION British immigrants dominated the flow of arrivals to Canada throughout the 19th century. This was not an accident. Up to 1900, virtually all the efforts of the Canadian government were directed toward securing workers from Britain. Our focus in this paper is on how well British immigrants adapted to their new home. The expectation is that assimilation would have been swift and complete, since the background of the new arrivals closely matched that of the resident popula- tion. The evidence, however, suggests that this was not the case. 1 We thank Andrew Ashenhurst, Dan Casey, Sameer Farooq, Ann Green, Janice Griffiths, Sam Lapalme-Remis, and Sean Rogers for their research assistance. Comments from the referees and from participants at seminars at the University of Toronto and Queen’s University and at the Microeconomic Analysis of the Household and the Labour Market, Canadian Economic History, and Canadian Economics Association conferences were very helpful. This research project is supported by the SSHRC. Explorations in Economic History 38, 315–338 (2001) doi:10.1006/exeh.2000.0769, available online at http://www.idealibrary.com on 315 0014-4983/01 $35.00 Copyright © 2001 by Academic Press All rights of reproduction in any form reserved.
Transcript of The Slow Assimilation of British Immigrants in … mackinnon...Early in the 20th century, Canadians...

The Slow Assimilation of British Immigrants in Canada:Evidence from Montreal and Toronto, 19011
Alan Green
Department of Economics, Queen’s University, Kingston, Ontario, Canada
and
Mary MacKinnon
Department of Economics, McGill University, Montreal, Quebec, CanadaE-mail: [email protected]
Published online May 8, 2001
Using a new sample of individual-level data compiled from the manuscript returns of the1901 Census of Canada, this article examines the assimilation of male wage-earning immi-grants (mainly from the UK) in Montreal and Toronto. Unlike studies of post-World War IIimmigrants to Canada, and some recent studies of 19th century immigration to the UnitedStates, we find slow assimilation to the earnings levels of native-born English mother-tongueCanadians. While immigrants from the UK were about as likely as the Canadian-born to be incraft jobs, they were much less likely to work in the clerical sector. Within the blue-collarsector, English and Scottish immigrants were at little disadvantage.© 2001 Academic Press
Key Words: British immigrants; assimilation; census data; occupational choice.
INTRODUCTION
British immigrants dominated the flow of arrivals to Canada throughout the19th century. This was not an accident. Up to 1900, virtually all the efforts of theCanadian government were directed toward securing workers from Britain. Ourfocus in this paper is on how well British immigrants adapted to their new home.The expectation is that assimilation would have been swift and complete, sincethe background of the new arrivals closely matched that of the resident popula-tion. The evidence, however, suggests that this was not the case.
1 We thank Andrew Ashenhurst, Dan Casey, Sameer Farooq, Ann Green, Janice Griffiths, SamLapalme-Remis, and Sean Rogers for their research assistance. Comments from the referees and fromparticipants at seminars at the University of Toronto and Queen’s University and at the MicroeconomicAnalysis of the Household and the Labour Market, Canadian Economic History, and Canadian EconomicsAssociation conferences were very helpful. This research project is supported by the SSHRC.
Explorations in Economic History38, 315–338 (2001)doi:10.1006/exeh.2000.0769, available online at http://www.idealibrary.com on
315
0014-4983/01 $35.00Copyright © 2001 by Academic Press
All rights of reproduction in any form reserved.
Early in the 20th century, Canadians held contradictory attitudes towardBritish immigrants. On the positive side, British immigrants were seen asculturally similar to Canadians, and there was widespread support in English-speaking Canada for strengthening Imperial bonds. While the British werepraised for their many virtues, Canadians disapproved of effete Englishmen whowere unwilling to participate in the hard work of opening a new country andadapt to colonial customs, and Canadians feared that immigrants from Britishslums and orphanages might well become a drain on the public purse.
This article uses detailed evidence on the annual earnings of Canadian-bornand immigrant employees as recorded in the 1901 manuscript census to examinehow well British immigrants fitted into the Canadian labor market and how theyfared relative to immigrants from continental Europe and the United States. Theresults reported here are for Toronto and Montreal, Canada’s two largest cities.Toronto was then inhabited overwhelmingly by British immigrants or theirdescendants. Most Montrealers, by contrast, were descendants of settlers fromFrance, but there was a substantial and economically powerful group of Britishimmigrants and native-born Canadians of British origin in Montreal.
WHY 1901?
At the turn of the century Canada had a population of slightly over 5 million,most of whom lived in rural areas. Almost half of the area that is now “settled”had few or no European inhabitants at that time. Canada shared the continentwith a much larger (and wealthier) neighbor, the United States. North Americawas the destination of most European immigrants for the century after the end ofthe Napoleonic Wars. Canada, however, attracted only about 8% of this move-ment, the rest going to the United States. For the last 3 decades of the 19thcentury Canada experienced net emigration. Both the native-born and immigrantsleft, with the majority of those leaving moving to urban areas in the United Statesor to farms on that country’s expanding western frontier.
These conditions changed dramatically around the turn of the century. Theperiod 1900 to 1914 was a golden age of Canadian development. Net emigrationchanged to net immigration with the rate of immigration rising above .5% of thepopulation—the highest rate of immigration in this country’s history. Rapidsettlement of the Canadian west was the central dynamic of the period up to1914. By the start of the war the west had been largely settled. Manufacturingexpanded sharply and became concentrated in Ontario and Quebec. This periodis often called the “Wheat Boom” or more accurately the “Investment Boom”since the country added extensively to its infrastructure, including the construc-tion of two transcontinental railways. Cities like Toronto and Montreal grewrapidly. The year 1901, therefore, sits at the cusp of these two very differentperiods. It is at the end of what have been called the years of “disappointment”(1870 to 1900) and at the beginning of one of the most dramatic periods ofexpansion in Canadian history.
316 GREEN AND MACKINNON

Part of the reason for undertaking this study now is the recent release of the1901 manuscript census, which allows us to examine household-level data. ForCanada this is the only large data source at this level of disaggregation. Unlikefor the United States, we do not have state-level labor force surveys; nor do wehave comprehensive social surveys. The 1901 census is superior to the earlierCanadian census in terms of the questions asked and the care taken in enumer-ation. It provides data on earnings, months worked, and year of arrival in Canada.The availability of detailed earnings data from 1901 onward makes the earlyCanadian census superior in some ways to those collected in the United States,since it was not until 1940 that information on earnings was collected for thatcountry. Studies on assimilation of immigrants in the United States, therefore,have often relied on state labor force surveys of a subset of workers or oninferences about income levels drawn from occupational data.
We know that Canadians on average earned substantially less than Americans,and we know that initially foreign-born workers in the United States earned lessthan the native-born in that country. We have no idea how different the Canadianexperience of immigrant assimilation was from that observed at the same time inthe United States. Unlike the United States, Canada was not attracting andretaining large numbers of immigrants from a wide variety of ethnic groups. Atthe turn of the century the vast majority of immigrants in Canada were of Britishorigin, and over the following decade the proportion of European immigrants,while increasing, remained low relative to that of the United States.
IMMIGRATION AND THE BRITISH IN CANADA
In 1901, about three-quarters of immigrants in Canada had been born in theUnited Kingdom. Federal government policy favored British immigrants, espe-cially those bound for agriculture. Reinforcing the British nature of Canada wasseen as a way to maintain independence from the United States (Offer, 1989).British immigrants in Canada might have difficulty adjusting to the climate andto the greater degree of equality in society, but they arrived knowing not only thedominant language, but also most political institutions and the legal system.Much more than would probably have been the case in the United States, theBritish in Canada were “invisible immigrants” (Erickson, 1972). The Canadiancensus considered anyone born in the UK as being of Canadian nationality. Theterm “foreign-born” was reserved for those of truly “foreign” birth, such asAmericans and continental Europeans.
Early writers on the assimilation of immigrants made a clear distinctionbetween British and European immigrants. Arthur Lower thought that all immi-grants tended to displace the native-born: “virtually all immigrants are ‘cheap’men for on arriving in this country they are not in a position to bargain for thesale of their labour. They must get a livelihood on what terms they can. In thisrespect, people from the Mother Country differ from other immigrants only indegree” (1930, pp. 571–572). However, in his influential textColony to Nation,
317BRITISH IMMIGRANTS IN CANADA

he drew a clearer distinction between types of immigrants. Those British immi-grants who stayed in Canada were like (English) Canadians and assimilatedrapidly. Most of the Europeans, especially the non-Protestants and Eastern andSouthern Europeans, “quickly discovered that Canada was no United States,where all were equal, and all engaged in building the republic. . . . Thenewcom-ers were shoved off by themselves and settled in colonies or flocked into the slumareas of the cities” (1946, p. 425). Lower suggested that it took two generationsfor the foreigners’ offspring to reach the level of anglophone Canadians (p. 489).
There is evidence that the locational pattern of settlement of British immi-grants differs from that of the non-British immigrants (Green and Green, 1993,pp. 53–57). The former tended to spread out across the country, while the latterlocated close to members of their own ethnic group. The “friends and relatives”variable, important in explaining location decisions for immigrants to the UnitedStates, plays a role in Canada only for non-British immigrants. For example, a10% increase in the stock of British-born residents in Toronto has no effect onthe probability of British immigrants choosing this city.
Writing about Montreal, Reynolds emphasized the importance of British mechan-ics for the development of the city’s main industries and the tendency of Britishforemen to hire later immigrants (Reynolds, 1935, p. 94). For unskilled work, bycontrast, the British workman was at a disadvantage relative to French Canadians andEastern Europeans. However, British laborers often “endeavoured to capitalize ontheir slight acquaintance with the skilled trades by securing work as “mechanic’shelpers” and thus elevating themselves on the occupational ladder. The shortage ofgenuinely skilled workmen, together with the good reputation of the British artisan,enabled a large number to succeed in this venture” (p. 96).
Both Lower and Reynolds suggest that most British immigrants were readilyable to fit into the Canadian labor market on terms similar to those of native-bornEnglish-speaking Canadians. Other commentators emphasize the shortcomingsof a subset of British immigrants. According to Woodsworth:
Generally speaking, the Scotch, Irish and Welsh have all done well. The greater number offailures have been among the English. This is due partly to a national characteristic which is atonce a strength and a weakness—lack of adaptability. Someone has said that “the English arethe least readily assimilated of the English-speaking nationalities.” But the trouble has largelybeen with theclassof immigrants who have come. Canada has needed farmers and laborers, andthese should be resourceful and enterprising. England has sent us largely the failures of thecities. The demand for artisans in our cities is limited. In any case many of the immigrants areculls from English factories and shops. These cannot compete with other English-speakingpeople and often not with non-English, despite the latter’s disadvantage in not knowing thelanguage. On many western farms, certain Englishmen have proved so useless that when helpis needed “no Englishman need apply.” (1909, 1972 ed., pp. 47–48)
Whatever the rhetoric about attracting sturdy yeomen farmers to the “last, best,West,” as Woodsworth’s quotation points out, by 1900 most British immigrantscame from cities, and moved to cities, either immediately or after a brief and unhappy
318 GREEN AND MACKINNON

encounter with the realities of Canadian farming (Percy, 1977). Large firms recruitedsome skilled workers (both white-collar and blue-collar) from Britain.
While immigration agents could exclude criminals and those deemed likely tobecome public charges, not many arriving immigrants were turned away in the late19th century (Timlin, 1960). Two types of undesirables were sent out to Canada insubstantial numbers. “Remittance men” received a stipend from their wealthy fam-ilies to stay away. “Useless at home, they are worse than useless here. The saloongains most largely by their presence” (Woodsworth, p. 49). There is no way ofestimating how many remittance men settled in Canada. Charitable societies paid orsubsidized the passage of the unemployed, and orphanages (such as Barnardo’s) sentout many of their charges—usually children old enough to work.2 A life of hardwork in a clean environment was seen as a way to save children from spiritual andphysical degradation.ChristAlwaysNearAlthoughDear onesAbsent was a sloganused by Barnardo’s. The immigration of poor children was seen as less threateningthan the immigration of indigent adults, and the children were initially sent to workon farms. “Home Children,” who typically had little formal schooling or job trainingexcept for a knowledge of farm chores, often drifted into the cities once they wereadults (Parr, 1980, p. 131).
Thus in one view, most British immigrants arrived with, or rapidly developed,skills that allowed them to fit into the better paid end of the Canadian labor market.To the extent that the Canadian-born were the children or grandchildren of earliergenerations of British immigrants, it is no surprise that their literal or figurativecousins arriving in the later 19th and early 20th century assimilated easily. In theother view, immigrants were often the black sheep of the British side of the family.They may have done better in Canada than they would have in Britain, but theircharacter and background meant they were ill-suited for the Canadian labor market.
The existing record on how immigrants fared in Canada in the early 20thcentury is mainly anecdotal. Some authors (e.g., Avery, 1979) suggest thatimmigrants not from England or Scotland fared poorly. Both the inability tospeak English and being Roman Catholic meant that these immigrants wereunlikely to get good jobs. Avery claims that European immigrants were crowdedinto low-wage, unpleasant, and at times dangerous jobs. Baskerville and Sager(1998, pp. 73–74) find that European and Asian immigrants in 1901 workedfewer months than Canadian- or British-born employees and interpret this as asign of discrimination. Other researchers have pointed out that European immi-grants took on a wide variety of occupations. Tulchinsky (1992, Ch. 8) notes thevariety of occupations and levels of economic achievement of members ofMontreal’s Jewish community at the end of the 19th century.
There has been research on occupational hierarchies and ethnicity for anearlier period. Using a sample drawn from the 1871 census, Darroch and
2 Between 1868 and 1928, almost 90,000 children were sent to Canada by various societies (someof these were paupers) (Wagner, 1982, pp. 259). In the 1880s and 1890s, about 2000 children per yeararrived (Parr, 1980, p. 40).
319BRITISH IMMIGRANTS IN CANADA
Ornstein (1980) report that urban Irish Catholic males were less concentrated inlaboring jobs than images of poverty-stricken Irish immigrants would lead one tobelieve. About 30% of the Irish Catholic (defined in terms of ethnic origin, notimmigrant status) urban males in their sample were laborers, roughly twice theproportion for the urban sample as a whole. Irish Catholics were almost as likelyto be merchants or manufacturers as the average, somewhat less likely to beartisans, and substantially less likely to be professional or white-collar workers.Irish Protestants had an occupational distribution much closer to the average andquite similar to that of the English. Scots were somewhat more likely to bemerchants, professionals, or white-collar workers than either the English or theIrish Protestants (p. 324). Akenson (1988, p. 101) builds on the census evidenceand asserts that the Irish in Canada were too large a group to face discriminationon the scale encountered in the United States. He argues that lower economicstatus for Irish Catholics than Protestants can partly be explained by the laterarrival of most Catholics, as well as the absence of information and creditnetworks provided to Protestants by the Orange Order (pp. 98–99).
THE ASSIMILATION EXPERIENCE COMPARED
Most of our knowledge of immigrant assimilation is derived from the experienceof post-World War II immigrants. There is a large literature on the United States areand also several Canadian studies (for a survey see Borjas, 1994). There is generalagreement that immigrants usually initially earn lower wages than comparablenative-born workers, with the differential greatest for the most recent cohorts ofimmigrants. The rate of immigrant assimilation is much less firmly established, withsome scholars claiming that immigrants catch up to native-born workers very quicklyand others that little assimilation takes place. Canadian studies tend to find that untilabout 1970 immigrants were at less of an initial disadvantage than immigrants to theUnited States, or more recent immigrants to Canada, but that they also experiencedrelatively low rates of assimilation (Baker and Benjamin, 1994; Bloom, Grenier, andGunderson, 1995). Using data for 1971, Bloom, Grenier, and Gunderson (p. 994)estimate that it took about 15 years for immigrants to reach wage equality with theCanadian-born. These immigrants were mainly from Britain and northwestern Eu-rope. Abbott and Beach (1993, p. 509), using survey data from 1973, estimate thatit took 13 years to reach earnings equality.
There have been several studies of late-19th-century immigration to the UnitedStates. A number suggest that immigrants experienced lower earnings growth,relative to the native-born, than has been true since 1945 (e.g., Hanes, 1996).Hatton (1997), using the same data as Hanes, finds that when immigrants aredivided into cohorts based on age at arrival, young immigrants look much like thenative-born throughout their working lives. Older immigrants start at a substan-tial disadvantage, but do show considerable assimilation with years in the UnitedStates. For the Michigan data, Hatton finds British immigrants earned more thannative-born Americans.
320 GREEN AND MACKINNON

It is not clear that one should expect to find a similar pattern of immigrantassimilation in Canada to that observed in the United States, despite the close tiesbetween the two countries and the virtually unregulated cross-border flows ofpopulation. As already noted, British immigrants to Canada formed a much largerproportion of the total stream of immigrants to Canada than to the United States.There is very little information on the types of British immigrants moving to Canadarather than the U.S. It is possible that Canada attracted English and Scottish immi-grants with less human capital/ability than did the United States, while Irish immi-grants to Canada were the cream of the immigrant crop. There is fragmentaryevidence on differences in the quality of the Irish immigrant stream in the last thirdof the 19th century—fewer immigrant males entering Canada were classed aslaborers (Fitzpatrick, 1980, p. 131). Pope and Withers (1994, p. 257) find a somewhathigher share of laborers in the total inflow of UK immigrants to Canada than to theUnited States from 1877 to 1913. British charitable societies wanted to build up theBritish Empire, not add to the population of the United States, so their efforts weredirected to Australia and Canada.
IMMIGRANTS AND THE NATIVE-BORN INMONTREAL AND TORONTO
In Toronto in 1901 there were few immigrants from Europe, either fromnorthern and western, or from southern and eastern, countries. The city ofToronto in 1901 had an almost entirely Anglo-Saxon and Celtic population.About 75% of the total population were Canadian-born (almost all of these inOntario). About 80% of immigrants came from the UK (see data appendix).More Montrealers were native-born (about 85%), but the immigrants were drawnfrom a wider range of source countries, including a variety of eastern andsouthern European nations. Most Montrealers were francophones, but the dom-inant language of business in Montreal at this time was English. The FrenchCanadian population shared a language disadvantage with European immigrants,since at least for office work, a knowledge of English was essential.
The information used in our sample is taken from two schedules in themanuscript census. Schedule 1 sets out the names, ages, marital status, place ofbirth, year of migration (to Canada), occupation, school attendance, literacy,religion, total earnings (for employees), and months of employment for eachindividual enumerated in 1901. Individuals are grouped by family or by groupsliving in an institution at the same address or as roomers and boarders living ata particular address. Schedule 2 sets out the addresses and types of dwelling.
Our sampling procedure differs from those used to obtain the Public UseSamples from the U.S. census manuscripts. The U.S. approach (and also of theproject at the University of Victoria, which has drawn a national sample from the1901 Census) is to sample the households of randomly drawn individuals—usually taking a fixed number of records per reel of microfilm or per censusdistrict (Ruggles, 1995). Rather than taking, say, one household per page from
321BRITISH IMMIGRANTS IN CANADA

the entire census schedules for Montreal and Toronto, we chose to sample largerclusters. We sampled the first page of the dwellings schedule for every fifthpolling subdistrict (normally 50 dwellings per chosen subdistrict).3 The infor-mation on this page is then matched to the counterpart data on the populationschedule (on average about 240 people). We have taken 64 clusters for the cityof Toronto and built-up areas around the city and 119 for Montreal.
This method of collecting data presents some problems as well as advantages.Our approach is cost-effective because it allows an easier comparison of the dataon the two schedules (the census takers’ cross-referencing is not always consis-tent). We can exploit some economies of scale since we are entering a numberof records made by each enumerator. Finally, we can study neighborhood effectswithin the city (although the present article does not attempt this). On thedownside, our method of sampling reduces the estimated standard errors. If oneapplies standard formulae assuming random sampling, but attributes are highlycorrelated within clusters, one will conclude that the sample is more precise thanit really is (Ruggles, 1995). At the level of the subdistrict, there may be “LeafySuburb” or “Slum” effects that mean we capture extremely homogenous groupsof people in particular clusters. We use an estimation technique that increases thesize of the standard error to take account of neighborhood effects.4
The Appendix shows comparisons between the Toronto and Montreal samples,and the published data for these cities. Our samples look very much like thepopulations from which they are drawn. Our method of clustering does notappear to have dramatically over- or undercounted any birthplace. Immigrantsare slightly overrepresented in the Montreal sample; given our interest in immi-grants and the small total number of European immigrants in Montreal in 1901,this is a fortunate accident.
Especially in Toronto, immigrant men were generally older than the native-born(Table 1). Table 1 also shows the mean and median years (the latter shown in squarebrackets) since arrival for male immigrants. With British immigrants the lion’s shareof adult male immigrants in Toronto, and the average British immigrant havingarrived about 20 years earlier, it is little wonder that there were about three times asmany men over 50 among the immigrant population as among the native-bornpopulation. More of Montreal’s immigrants were from the United States or Europe,and these men had typically arrived in Canada after British immigrants. EvenMontreal’s British immigrant adult males may have, on average, arrived a bit morerecently than immigrants settled in Toronto. Both these factors muted the differencein age distributions between the Canadian born and the immigrants in Montreal.
We have no evidence on years of work experience or years of formal school-ing. We do have responses to questions about ability to read, write, speak
3 Where the fifth subdistrict’s records were illegible, we took the fourth or sixth subdistrict instead.The presence of schools, churches, shops, and factories as well as vacant houses sometimes reducesthe number of inhabited dwellings to well below 50.
4 We used the svyreg procedure in STATA.
322 GREEN AND MACKINNON

English, speak French, and mother tongue. English mother tongue Canadians andimmigrants were almost always literate. Literacy rates for European immigrantswere much lower and in Montreal below those for francophones. The vastmajority of the European immigrants in Toronto claimed they could speakEnglish. Eighty percent of adult male European immigrants in Montreal said they
TABLE 1Characteristics of Men (Ages 17–64), Montreal and Toronto
Montreal Toronto
ImmigrantCanadian-
born ImmigrantCanadian-
born
% Ages 17–29 33.7 44.0 24.4 51.9% Ages 30–49 46.9 42.4 48.9 39.3% Ages 50–64 19.5 13.6 26.7 8.7% Born in England 26.5 52.3% Born in Scotland 9.7 11.3% Born in Ireland 13.0 18.7% Born in Europe 25.5 7.0% Born in U.S. 14.6a 7.3% Born in NFLD 4.0 1.0% Born in province of residence 93.3 94.4% of those born in province of residence
born in a rural areab 44.2 37.8Mean years in Canada, born in UK
[median] 20 [17] 23 [20]Mean years in Canada, born in U.S.
[median] 15 [12] 18 [18]Mean years in Canada, born in Europe
[median] 10 [8] 12 [8]Mean years in Canada, born in NFLD
[median] 14 [13] 10 [10]% Bilingual (of immigrants born in UK
or Canadian English mother tongue) 26.1 53.2c N/A N/A% Speaking English (of immigrants born
in Europe or Canadian French mothertongue) 74.3 77.6d 88.5 N/A
% Can write (of immigrants born inEurope or Canadian French andEnglish mother tongue) 76.7
86.3d
98.1c 65.5 98.4e
% Protestant 46.7 15.5 82.9 85.0% Roman Catholic 36.3 84.0 12.9 13.9% Jewish 12.5 0.2 2.9 0.2N 1797 6354 1622 2834
a Fifty-seven percent of these men were of English mother tongue and 39% of French mothertongue.
b Calculated for those stating birthplace as urban or rural.c English mother tongue.d French mother tongue.e All Canadian-born.
323BRITISH IMMIGRANTS IN CANADA
could speak at least one of French or English, with more reporting English thanFrench.5 Most European immigrants thus appear to have had at least a basicability to communicate in the dominant languages of the city they lived in. InMontreal, as is shown, anglophones who spoke French generally earned morethan unilingual anglophones. British immigrants in Montreal were much lesslikely to speak French than their Canadian-born counterparts—presumably mostbilingual Canadian anglophones learned French as children, and British immi-grants who came as adults missed this opportunity (MacKinnon, 2000).
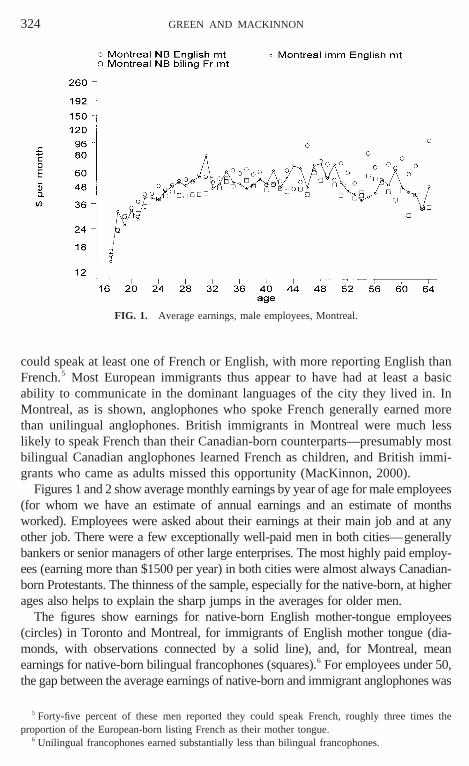
Figures 1 and 2 show average monthly earnings by year of age for male employees(for whom we have an estimate of annual earnings and an estimate of monthsworked). Employees were asked about their earnings at their main job and at anyother job. There were a few exceptionally well-paid men in both cities—generallybankers or senior managers of other large enterprises. The most highly paid employ-ees (earning more than $1500 per year) in both cities were almost always Canadian-born Protestants. The thinness of the sample, especially for the native-born, at higherages also helps to explain the sharp jumps in the averages for older men.
The figures show earnings for native-born English mother-tongue employees(circles) in Toronto and Montreal, for immigrants of English mother tongue (dia-monds, with observations connected by a solid line), and, for Montreal, meanearnings for native-born bilingual francophones (squares).6 For employees under 50,the gap between the average earnings of native-born and immigrant anglophones was
5 Forty-five percent of these men reported they could speak French, roughly three times theproportion of the European-born listing French as their mother tongue.
6 Unilingual francophones earned substantially less than bilingual francophones.
FIG. 1. Average earnings, male employees, Montreal.
324 GREEN AND MACKINNON

modest in both cities. The average British immigrant had been in Canada for over 20years, so considerable assimilation should have already occurred.
The general shape of the age–earnings profile is similar to that reported by Hatton(1997) for manufacturing workers in Michigan and California in the early 1890s.Average wages rise steeply until the mid-20s and are then quite flat. Hatton stressesthat imposing a quadratic functional form (age and age squared) in a regressionmodel of earnings will lead to substantial misspecification in this case.
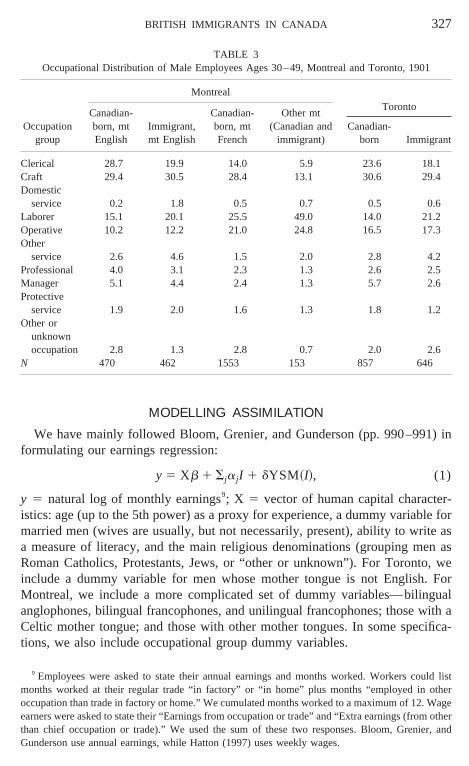
While average earnings suggest modest differences between the anglophoneCanadian-born and their anglophone immigrant peers, the distribution of maleemployees by occupational group suggests there were some systematic differences(see Tables 2 and 3.)7 Especially among young men (under 30), native-born (inMontreal, native-born anglophone) workers were much more likely to be in theclerical sector. Poor English language skills would explain the absence of young menwhose mother tongue was not English, but even mother-tongue English immigrantswere much less likely to be in these types of jobs than were the Canadian born.
We see three possible explanations for this pattern. Immigrants from the UKmay have had less formal education than Canadians. While we do not havecomparisons of British and Canadian school enrollment rates for the 19thcentury, it is well known that relative to most European countries in the 19thcentury, British enrollment rates were low. Just after the First World War,Canadian boys at age 14 were about twice as likely as boys in the UK to be atschool (Crafts, 1985, pp. 57–59; MacKinnon, 1989, p. 63). Recent immigrantsprobably lacked the connections necessary to obtain the better kinds of clerical
7 Occupations have been classified into groups using the 1940 U.S. Census classification (Edwards,1940). mt stands for mother tongue.
FIG. 2. Average earnings, male employees, Toronto.
325BRITISH IMMIGRANTS IN CANADA

jobs (in banks, for example).8 Finally, it is possible that British immigrants wereless likely than the Canadian born to understand that, on average, clerical jobsprovided a secure and fairly high income.
While clerical jobs were something of a preserve of the native-born, craft jobswere open to anglophones (and francophones in Montreal), whatever theirbirthplace. For most men, clerical or craft jobs were the best to which they couldaspire. The native-born did not strongly dominate the immigrant anglophones inthe rather small professional and managerial categories. Evidence from occupa-tional categories thus suggests that a substantial group of British immigrantswere doing well in 1901.
Tables 2 and 3 do, however, give some support to Woodsworth’s criticalassessment of the English immigrant. Anglophone immigrants were more likelyto be laborers, domestic servants, or in “other service” occupations (such aswaiters or shoeshine boys) than were native-born anglophones. These weregenerally the jobs at the bottom of the occupational ladder. The anglophoneimmigrants in Montreal were not doing as badly as the non-English or -Frenchmother-tongue men, who were usually employed as laborers or operatives(mainly factory workers), but a contemporary observer would have seen manyBritish immigrants working in dead-end jobs.
8 McDowall (1993) notes that some key Royal Bank employees came from Scotland. Small townsin the Maritimes were an important source of junior workers.
TABLE 2Occupational Distribution of Male Employees Ages 17–29, Montreal and Toronto, 1901
Occupationgroup
MontrealToronto
Canadian-born, mtEnglish
Immigrant,mt English
Canadian-born, mtFrench
Other mt(Canadian and
immigrant)Canadian-
born Immigrant
Apprentice 2.1 2.3 1.7 0 2.9 2.7Clerical 39.5 22.6 21.8 12.2 28.5 15.7Craft 24.2 26.3 22.0 9.5 23.7 24.6Domestic
service 0.3 3.8 1.1 2.7 0.4 3.0Laborer 11.0 18.4 19.1 36.5 10.9 15.4Operative 12.0 12.0 25.7 33.1 24.1 25.8Other
service 2.9 4.9 2.2 1.4 2.5 7.7Professional 3.3 4.5 1.9 2.0 3.1 1.2Manager 0.9 1.5 0.6 1.4 1.5 0.9Protective
service 0.8 0.4 0.6 0 0.5 0.3Other or
unknownoccupation 3.2 3.4 3.3 1.4 1.7 2.7
N 666 266 1558 148 1239 337
326 GREEN AND MACKINNON
MODELLING ASSIMILATION
We have mainly followed Bloom, Grenier, and Gunderson (pp. 990–991) informulating our earnings regression:
y 5 Xb 1 Sja j I 1 dYSM~I!, (1)
y 5 natural log of monthly earnings9; X 5 vector of human capital character-istics: age (up to the 5th power) as a proxy for experience, a dummy variable formarried men (wives are usually, but not necessarily, present), ability to write asa measure of literacy, and the main religious denominations (grouping men asRoman Catholics, Protestants, Jews, or “other or unknown”). For Toronto, weinclude a dummy variable for men whose mother tongue is not English. ForMontreal, we include a more complicated set of dummy variables—bilingualanglophones, bilingual francophones, and unilingual francophones; those with aCeltic mother tongue; and those with other mother tongues. In some specifica-tions, we also include occupational group dummy variables.
9 Employees were asked to state their annual earnings and months worked. Workers could listmonths worked at their regular trade “in factory” or “in home” plus months “employed in otheroccupation than trade in factory or home.” We cumulated months worked to a maximum of 12. Wageearners were asked to state their “Earnings from occupation or trade” and “Extra earnings (from otherthan chief occupation or trade).” We used the sum of these two responses. Bloom, Grenier, andGunderson use annual earnings, while Hatton (1997) uses weekly wages.
TABLE 3Occupational Distribution of Male Employees Ages 30–49, Montreal and Toronto, 1901
Occupationgroup
MontrealToronto
Canadian-born, mtEnglish
Immigrant,mt English
Canadian-born, mtFrench
Other mt(Canadian and
immigrant)Canadian-
born Immigrant
Clerical 28.7 19.9 14.0 5.9 23.6 18.1Craft 29.4 30.5 28.4 13.1 30.6 29.4Domestic
service 0.2 1.8 0.5 0.7 0.5 0.6Laborer 15.1 20.1 25.5 49.0 14.0 21.2Operative 10.2 12.2 21.0 24.8 16.5 17.3Other
service 2.6 4.6 1.5 2.0 2.8 4.2Professional 4.0 3.1 2.3 1.3 2.6 2.5Manager 5.1 4.4 2.4 1.3 5.7 2.6Protective
service 1.9 2.0 1.6 1.3 1.8 1.2Other or
unknownoccupation 2.8 1.3 2.8 0.7 2.0 2.6
N 470 462 1553 153 857 646
327BRITISH IMMIGRANTS IN CANADA

I 5 dummy variable set to 1 for immigrants;aj is the entry effect for immigrantsfrom birthplacej (Canada but outside the province of residence, England, Scotland,Ireland, Europe, Newfoundland, the United States, and other birthplaces). YSM5years since immigration (0 for those born in Canada);d is the assimilation effect (sono assimilation effect estimated for Canadians born in other provinces).10 Years toearnings equality for any immigrant group are estimated as2aj/d.
In Table 4, English mother-tongue Roman Catholics born in Ontario (for Toronto)or Quebec (for Montreal) are the base category. We excluded the small number ofnon-White wage earners (who usually were immigrants with very low earnings),those with unknown birthplace or years since migration, employees living with theiremployers (who were usually paid a substantial portion of their earnings in the formof room and board), boys under 17, and men 65 or over. By age 17, the vast majorityof young men were at work. We hesitate to include younger boys, although many ofthem were at work, in case there were systematic differences in the age of labor forceentry depending on immigrant status. While some men were employed into their late60s and even 70s, the size of the sample at these ages is very small, and we suspectthat some older men were reporting all income sources as wage earnings. We alsoexcluded men earning less than $5 or more than $300 per month.11
RESULTS
Table 4 shows five sets of regression results for Montreal and Toronto. Thefirst set uses all available demographic variables; the second set adds occupa-tional group dummies. We included the occupational group dummies to see howmuch demographic characteristics matter after controlling for systematic differ-ences in earnings by occupation group.
The pattern of entry effects is similar across the cities. American immigrants wereabout on a par with the native-born; immigrants from the UK were at a disadvantage(probably a somewhat greater disadvantage if from Ireland than from England orScotland). In Toronto, a European birthplace or a mother tongue other than Englishis not clearly associated with a severe handicap, but the number of workers in thesecategories was very small. In Montreal, while the coefficient on European birthplaceis about zero, almost all of the workers in the “other” mother-tongue group had aEuropean birthplace (and virtually none of the native-, U.S.-, or UK-born had an
10 We have also tried specifications using years since migration squared and the square root of yearssince migration. Using both YSM and YSM2 almost always yields small and imprecisely determinedcoefficients for both variables. Implied years to equality of earnings are similar using either YSM or thesquare root of YSM. We have tried allowing YSM to vary by country of origin. Again, this tends to resultin extremely imprecise coefficients, but point estimates are in the range of what is reported in Table 4.
11 There are only 17 men excluded because of high or low income in Montreal and 13 in Toronto.Some of these extreme observations may be data errors. Adding these men raises the entry effectsomewhat (recall that the highest wage occupations were almost always held by the native-born) andin Toronto raises the estimated wage gain associated with being Protestant.
328 GREEN AND MACKINNON

TA
BLE
4E
xpla
inin
gM
onth
lyE
arni
ngs
ofM
ale
Em
ploy
ees
Var
iabl
e
Mon
trea
lT
oron
to
(1)
(2)
(3)
(4)
(5)
(6)
(7)
(8)
(9)
(10)
Age
1.72
1(0
.225
)1.
590
(0.2
06)
2.38
3(0
.363
)2.
704
(0.4
80)
0.91
6(0
.152
)1.
653
(0.2
74)
1.66
7(0
.281
)1.
657
(0.2
82)
1.86
3(0
.331
)0.
522
(0.0
82)
Age
2 /100
28.
255
(1.2
74)
27.
629
(1.1
63)
211
.702
(2.0
54)
213
.408
(2.6
85)
21.
887
(0.3
48)
27.
974
(1.6
16)
28.
142
(1.6
34)
28.
020
(1.6
63)
29.
179
(1.9
20)
21.
004
(0.1
94)
Age
3 /1,0
001.
933
(0.3
47)
1.78
8(0
.317
)2.
807
(0.5
58)
3.22
8(0
.723
)1.
907
(0.4
56)
1.96
7(0
.456
)1.
924
(0.4
68)
2.21
8(0
.535
)
Age
4 /10,
000
20.
221
(0.0
46)
20.
204
(0.0
42)
20.
328
(0.0
73)
20.
378
(0.0
94)
20.
225
(0.0
62)
20.
234
(0.0
61)
20.
228
(0.0
63)
20.
263
(0.0
72)
Age
5 /100
,000
0.01
0(0
.002
)0.
009
(0.0
02)
0.01
5(0
.004
)0.
017
(0.0
05)
0.01
1(0
.003
)0.
011
(0.0
03)
0.01
1(0
.003
)0.
012
(0.0
04)
(Age
225
)/10
0.38
6(0
.245
)2
0.04
4(0
.179
)
(Age
225
)2 /10
1.85
6(0
.346
)0.
959
(0.1
91)
Pro
test
ant
0.15
5(0
.026
)0.
081
(0.0
22)
0.14
7(0
.029
)0.
072
(0.0
34)
0.15
8(0
.030
)0.
052
(0.0
30)
0.02
4(0
.027
)0.
041
(0.0
29)
0.00
6(0
.027
)0.
034
(0.0
29)
Jew
ish
0.33
5(0
.072
)0.
195
(0.0
78)
0.32
1(0
.088
)0.
259
(0.0
84)
0.34
2(0
.081
)2
0.00
4(0
.131
)2
0.07
7(0
.128
)2
0.29
2(0
.231
)2
0.32
9(0
.279
)2
0.28
9(0
.275
)
Oth
er/U
nkno
wn
relig
ion
0.28
2(0
.106
)0.
185
(0.0
96)
0.20
1(0
.123
)0.
017
(0.1
01)
0.17
8(0
.139
)0.
251
(0.1
08)
0.19
8(0
.084
)0.
245
(0.1
03)
0.15
2(0
.095
)0.
229
(0.1
08)
Can
writ
e0.
182
(0.0
24)
0.08
8(0
.022
)0.
225
(0.0
54)
0.20
6(0
.046
)0.
189
(0.0
55)
0.15
8(0
.056
)0.
068
(0.0
50)
0.07
6(0
.064
)0.
101
(0.0
58)
0.06
8(0
.068
)
Non
-Eng
lish
mot
her
tong
ue2
0.05
9(0
.061
)2
0.07
9(0
.051
)
Eng
lish
mot
her
tong
ue,
bilin
gual
0.07
6(0
.028
)0.
042
(0.0
24)
0.08
2(0
.028
)0.
049
(0.0
32)
0.08
4(0
.032
)
Fre
nch
mot
her
tong
ue,
bilin
gual
20.
020
(0.0
35)
20.
057
(0.0
30)
Fre
nch
mot
her
tong
ue,
unili
ngua
l2
0.13
2(0
.038
)2
0.11
7(0
.036
)
Cel
ticm
othe
rto
ngue
20.
025
(0.0
73)
20.
038
(0.0
69)
Oth
erm
othe
rto
ngue
20.
260
(0.0
78)
20.
203
(0.0
73)
Mar
ried
0.08
2(0
.018
)0.
085
(0.0
16)
0.08
7(0
.036
)0.
042
(0.0
34)
0.10
5(0
.040
)0.
105
(0.0
23)
0.10
9(0
.021
)0.
102
(0.0
23)
0.08
4(0
.021
)0.
102
(0.0
25)
Res
tof
Can
ada
0.09
4(0
.035
)0.
063
(0.0
34)
0.14
4(0
.038
)0.
119
(0.0
59)
0.14
7(0
.039
)0.
045
(0.0
38)
0.00
4(0
.032
)0.
056
(0.0
41)
0.00
3(0
.040
)0.
057
(0.0
42)
Eng
land
20.
120
(0.0
44)
20.
081
(0.0
40)
20.
119
(0.0
50)
20.
075
(0.0
57)
20.
129
(0.0
52)
20.
185
(0.0
36)
20.
129
(0.0
31)
20.
188
(0.0
37)
20.
119
(0.0
45)
20.
171
(0.0
38)
Sco
tland
20.
106
(0.0
62)
20.
055
(0.0
57)
20.
102
(0.0
68)
20.
014
(0.0
79)
20.
107
(0.0
78)
20.
118
(0.0
44)
20.
090
(0.0
40)
20.
119
(0.0
45)
20.
075
(0.0
45)
20.
086
(0.0
49)
329BRITISH IMMIGRANTS IN CANADA

TA
BLE
4—
Co
ntin
ue
d
Var
iabl
e
Mon
trea
lT
oron
to
(1)
(2)
(3)
(4)
(5)
(6)
(7)
(8)
(9)
(10)
Irel
and
20.
196
(0.0
59)
20.
128
(0.0
52)
2.1
96(0
.065
)2
0.09
3(0
.065
)2
0.17
1(0
.068
)2
0.21
1(0
.034
)2
0.14
1(0
.029
)2
0.20
8(0
.033
)2
0.14
9(0
.040
)2
0.22
0(0
.038
)
Eur
ope
20.
021
(0.0
78)
0.00
6(0
.071
)2
0.16
9(0
.101
)2
0.10
9(0
.092
)
NF
LD2
0.24
0(0
.047
)2
0.14
8(0
.043
)2
0.24
1(0
.052
)2
0.19
1(0
.055
)2
0.27
3(0
.048
)2
0.14
4(0
.043
)2
0.10
0(0
.039
)2
0.14
7(0
.041
)2
0.06
4(0
.032
)2
0.15
9(0
.034
)
US
20.
026
(0.0
43)
20.
016
(0.0
42)
0.04
8(0
.065
)0.
036
(0.0
70)
0.00
7(0
.066
)0.
022
(0.0
60)
0.04
0(0
.051
)0.
032
(0.0
61)
0.06
6(0
.067
)0.
142
(0.0
83)
Oth
erbi
rthp
lace
20.
160
(0.1
33)
20.
176
(0.1
16)
20.
009
(0.1
17)
2.1
02(0
.120
)2
0.07
4(0
.139
)2
0.02
7(0
.122
)0.
018
(0.0
77)
20.
140
(0.0
93)
20.
033
(0.0
87)
20.
070
(0.1
18)
YS
M(y
ears
sinc
eim
mig
ratio
nto
Can
ada)
0.00
4(0
.002
)0.
003
(0.0
02)
0.00
5(0
.002
)0.
004
(0.0
02)
0.00
5(0
.002
)0.
004
(0.0
01)
0.00
3(0
.001
)0.
004
(0.0
01)
0.00
3(0
.001
)0.
002
(0.0
02)
App
rent
ice
20.
321
(0.0
10)
20.
160
(0.0
68)
Cle
rical
0.32
7(0
.030
)0.
302
(0.0
37)
Cra
ft0.
274
(0.0
16)
0.21
8(0
.029
)
Dom
estic
serv
ice
20.
211
(0.0
91)
0.01
7(0
.091
)
Ope
rativ
e0.
181
(0.0
18)
0.18
4(0
.031
)
Oth
erse
rvic
e0.
119
(0.0
41)
0.01
1(0
.040
)
Pro
fess
iona
l0.
438
(0.1
09)
0.57
2(0
.091
)
Man
ager
/offi
cial
0.78
8(0
.062
)0.
634
(0.0
70)
Pro
tect
ive
serv
ice
0.19
5(0
.040
)0.
227
(0.0
62)
Oth
eror
unkn
own
occu
patio
n0.
240
(0.0
40)
0.21
5(0
.049
)
Con
stan
t2
10.5
25(1
.530
)2
9.55
3(1
.405
)2
15.5
04(2
.456
)2
17.6
68(3
.309
)2
7.68
2(1
.638
)2
10.0
28(1
.765
)2
10.0
80(1
.848
)2
9.93
8(1
.821
)2
11.2
40(2
.186
)2
3.20
9(0
.860
)
N5,
173
5,17
31,
591
964
1,39
43,
097
3,09
72,
995
1,93
02,
631
R2
0.29
90.
393
0.33
70.
270
0.32
90.
347
0.42
70.
340
0.30
90.
328
No
te.D
epen
dent
varia
ble:
Nat
ural
log
ofav
erag
em
onth
lyea
rnin
gs.
Sta
ndar
der
rors
inpa
rent
hese
s.F
orM
ontr
eal,
base
case
isun
iling
uala
nglo
phon
e,R
oman
Cat
holic
,bor
nin
Que
bec,
inla
borin
gjo
b,ill
itera
te,s
ingl
e.F
orT
oron
to,b
ase
case
isan
glop
hone
,Rom
anC
atho
lic,b
orn
inT
oron
to,i
nla
borin
gjo
b,i
llite
rate
,sin
gle.
Sam
ple
used
(all
colu
mns
):m
ale
ages
17–
64,w
hite
,not
livin
gw
ithem
ploy
er,l
iste
das
empl
oyee
,ear
ning
atle
ast$
5an
dno
tmor
eth
an$3
00pe
rm
onth
.Co
lum
ns3–
5an
d8
–10
are
rest
ricte
dto
thos
ew
ithE
nglis
hm
othe
rto
ngue
.Col
umns
4an
d9
are
rest
ricte
dto
wor
kers
with
jobs
iden
tified
as“la
bore
r,”
“ope
rativ
e,”
or“c
raft.
”C
olum
ns5
and
10ex
clud
em
enw
hose
age
whe
nth
eyim
mig
rate
dto
Can
ada
was
less
than
15.I
nC
olum
ns3–
5an
d8
–10
“oth
erbi
rthp
lace
”in
clud
esE
urop
e(t
here
are
very
few
Eur
opea
n-bo
rnm
enw
ithE
nglis
hm
othe
rto
ngue
).V
ery
few
men
with
Eng
lish
mot
her
tong
uew
ere
Jew
ish.
330 GREEN AND MACKINNON

“other” mother tongue) so the effect of having been born in Europe should be thoughtof as the effect of having an “other” mother tongue.12
Our formulation of the entry and assimilation effect allows the entry effect tovary by place of birth, but imposes a constant assimilation effect (coefficient onyears since migration).13 Implied years to equality of earnings with a native-bornworker (entry effect divided by assimilation effect) are fairly substantial. Usingthe estimated coefficients in column (1) suggests 28 years to equality for anEnglish-born worker in Montreal, 49 for an Englishman in Toronto.14 Given theproblems of inferring rates of assimilation from a single cross section, we do notwant to push the interpretation of these coefficients too far. However, except forAmerican immigrants, there was a persistent earnings gap. Only “other” mother-tongue immigrants seem to have been worse off in Montreal than in Toronto.
Our estimated years to equality are much greater than those found in Canadianstudies using cross-sectional data from the early 1970s, when most immigrantswere from Britain, Ireland, or northwestern Europe, or those found by Hatton forMichigan or California in the 1890s, where the largest number of immigrantswere German but there were also many British and Irish immigrants. Accordingto the 1901 census data, only Americans living in Canada seem to have done aswell as Canadians from the time they arrived. The slower rate of immigrantassimilation seen in Canada since the 1970s is often attributed to a change in thecomposition of the immigrant inflow away from British and Western Europeanimmigrants. We are finding slow assimilation for a group that most commenta-tors assumed fitted right into Canadian society.
In the results shown in columns (1) and (6) (no occupational controls), literacyis important in both Montreal and Toronto. Language skills are very important inMontreal and apparently not important in Toronto—although, as noted above,with the very small number of Toronto men whose mother tongue was notEnglish (3% of the sample used in estimation, of whom 90% said they couldspeak English), we are cautious about making this interpretation for Toronto.15 InMontreal, bilingual anglophones earned more than unilingual anglophones. Bi-lingual francophones and unilingual anglophones earned about the same amountper month, unilingual francophones earned substantially less, and those withother mother tongues were severely handicapped.16
12 There were French mother-tongue immigrants from France, Belgium, and Switzerland.13 Hatton also adopts this formulation.14 For Montreal, this is time to reach the earnings level of a unilingual anglophone, not the
generally higher earnings of a bilingual anglophone.15 In Toronto, men whose mother tongue was not English were less likely to be employees. Some
were presumably “un,” or under-employed, because they lacked sufficient language skills.16 We tried including separate variables for those with “other” mother tongues who said they could
and could not speak English. We cannot reject restricting the coefficient on “other” mother tongue(speak English) and “other” mother tongue (do not speak English) to be equal. Presumably virtuallyall those with a Celtic mother tongue were fluent in English, which would explain why their earningswere about the same as those of unilingual anglophones.
331BRITISH IMMIGRANTS IN CANADA
There is a substantial difference between Toronto and Montreal in the relationshipof religion and earnings. In Toronto, only the small and heterogeneous group of“other and unknown religion” earn substantially more than Roman Catholics. Wefind no difference between the earnings of Roman Catholics and Protestants, whichis surprising in a city as full of Orange Lodges as Toronto was in 1901.17 McGowan(1999) stresses that, by the early 1920s, Roman Catholics in Toronto had largelyblended into the community in terms of both attitudes and economic activity. The1901 census suggests that most of the economic integration had occurred by thebeginning of the century. In Montreal, by contrast, Roman Catholics were definitelyat the bottom of the heap. We find this contrast puzzling. Two possible explanationscome to mind. While Roman Catholic children were generally educated in separateschools in both Toronto and Montreal, Roman Catholic schools in Toronto may haveoffered a quality of education closer to that afforded to Protestant children than wasthe case in Montreal.18 In Toronto, Roman Catholics were a small fraction of thepopulation and perhaps were less isolated from the Protestant community (and theemployment opportunities controlled by Protestants) than were Roman Catholics inMontreal. The large positive coefficient for Jews in Montreal needs to be consideredas offsetting the effects of having an “other” mother tongue.
Columns (2) and (7) of Table 4 show coefficients from earnings regressions,including controls for occupational groupings. The patterns of earnings differ-ences by occupational groups are fairly similar in the two cities, especially for thenumerically more important categories. Clerical workers on average earned over30% more than laborers, with the average craft worker not quite as well paid asa clerical worker. As expected, professional and managerial workers in bothcities had much the highest earnings.19
As we saw in Tables 2 and 3, ethnic origin and birthplace are often correlatedwith occupational group. Adding the occupational group dummies substantiallyreduces the impact of literacy on earnings, as we would expect, since illiterateswere concentrated in laboring and service occupations. Their addition alsoreduces the effect of religion on earnings in Montreal. Roman Catholics wereclustered in the worse occupational groups, although not to a sufficiently greatextent to explain their lower earnings completely. They also tended to be in lowerpaying jobs within each occupational group. Differences in earnings by languagegroup, however, remain fairly stable between columns (1) and (2) and (6) and (7).
17 Including the most highly paid men in the sample yields a small, but significantly positive, coefficientfor Protestants. Kealey (1980) (pp. 98–123) points out that between 1867 and 1892 there were 22 riotsinvolving Orangemen and Irish Catholics in Toronto, but none were about excluding Roman Catholicsfrom jobs, nor did any riots occur at work. This is rather weak evidence consistent with the idea that labormarket discrimination against Roman Catholics was relatively unimportant by 1900.
18 McGowan (1999) notes that while throughout the late 19th and early 20th centuries expenditureper pupil was much lower in Toronto’s separate schools, and class sizes greater than in public schools,the Roman Catholic population put great emphasis on improving the quality of their schools.
19 We are not surprised that the “other and unknown” occupation workers did fairly well. Legibility problemswere most severe for workers with lengthy and fairly unusual occupational titles. Such men were rarely laborers.
332 GREEN AND MACKINNON

Although Tables 2 and 3 show marked differences in occupational compositionby language group in Montreal, controlling for occupational group has a modestimpact on the estimated effect of language on earnings.
The effect on the birthplace coefficients of adding the occupational variablesis closer to that seen for the religion variables—estimated values generally fallsubstantially. Immigrants tended to end up in the lower paying types of jobs. Aswe saw in Tables 2 and 3, even British immigrants were unlikely to work in theclerical sector. However, as the estimated coefficient on years since migrationalso falls, implied years to equality with the native-born does not change much.20
Imposing a common effect for years since migration for immigrants from alllocations may be inappropriate. Columns (3) and (8) of Table 4 show results ofestimating Eq. (1) only for English mother-tongue immigrant and native-bornemployees. The estimated years to equality of British immigrants are virtually thesame in this specification as they are when all immigrants are included.
Our sample has many more white-collar workers than do the U.S. labor bureaustudies Hatton uses. Tables 2 and 3 show that clerical jobs were largely thepreserve of the native-born in Montreal and Toronto, but that British immigrantshad no difficulty obtaining craft jobs. When we use only the blue-collar workersin our sample (those classed as laborers, operatives, or craft workers) to estimatethe model in Eq. (1) (columns (4) and (9) of Table 4), there is a more modestentry effect for English and Scottish immigrants. The estimated number of yearsfor an English immigrant to reach the level of earnings of a comparable Canadianfalls to about 19 in Montreal and 36 in Toronto. These results make theimmigrant assimilation process in Canadian cities look a bit more like what isfound using the American state labor bureau studies. There is some evidence thatwhere researchers on American immigration include more of that country’s mosthighly paid wage earners, they find slower rates of assimilation. Minns (2000),by assigning income levels based on reported occupation, uses the U.S. censusesof 1900 and 1910 to examine assimilation of white- and blue-collar workers. For1900, he reports that blue-, but not white-, collar adult immigrants eventuallyassimilated to the imputed earnings levels of the native-born.
Columns (5) and (10) modify the sample by excluding workers who immigratedto Canada before age 15. If immigrants who arrived as children had characteristicssimilar to those of the native-born English-speaking population because they hadgrown up in Canada, then pooling child and adult immigrants could be misleading.In fact, looking only at English mother-tongue immigrants who had come asteenagers and adults and English mother-tongue Canadian-born workers makes littledifference. The estimated entry effects and years to assimilation are similar to thoseseen in columns (3) and (8). Columns (5) and (10) present results using a differentfunctional form for workers’ ages. Instead of using age to the 5th power, we triedHatton’s specification of a quadratic spline function with a break at age 25. Coeffi-
20 For example, to 24 years for an Englishman in Montreal and 43 years for an Englishman inToronto.
333BRITISH IMMIGRANTS IN CANADA

cient estimates for other variables are hardly affected by the use of the quadraticspline rather than the higher powers of age.21
All of the results shown in Table 4 are for men who were listed in the census asemployees and who listed their annual earnings and months worked. Only employeeswere asked for information on earnings and employment, but this information wasrecorded for some self-employed workers and employers. Reestimating the modelsshown in Table 4, including all available observations, leaves results virtuallyunaffected. However, a substantial fraction of men who were at work, particularlyolder men, were not listed as employees in 1901 and did not report earnings andmonths worked.22 Table 5 shows the proportion of men ages 40–64 and 17–39 whoreported some type of work activity, but were not listed as employees in 1901.Especially for older men in Montreal, the native-born were much less likely to beemployees than were the English mother-tongue immigrants.
The majority of nonemployees were professionals or proprietors, with almost allthe rest clerical or craft workers. These men would typically have been fairly highincome earners. Table 4 suggests that immigrant employees assimilated only slowlytoward the earnings levels of the native-born. Table 5 suggests that the differentialmovement away from employee status probablyraisesthe observed rate of immi-grant assimilation seen in Table 4 relative to the actual pattern of assimilation. OlderEnglish mother-tongue Canadian-born men were less likely to be employees thanwere immigrants, so even if immigrant employees caught up to the earnings ofnative-born employees after 25 or 30 years in Canada, they were not moving as
21 This also holds for the results shown in columns (1) to (4) and (6) to (9).22 We defined men as being at work if an occupation, an occupational status, annual earnings, or
months worked were listed. Occasionally the census taker failed to record occupational status, but didlist at least one other of these pieces of information. We classified such men as at work, but notemployees. This will lead to some underestimate of the proportion of men who were employees.
TABLE 5Occupational Status of English Mother-Tongue Men
Ages 40–64 Ages 17–39
Native-born Immigrant Native-born Immigrant
MontrealAt work but not listed
as an employee (%) 31 18 15 10Employee (%) 69 82 85 90Sample size 364 481 1130 585
TorontoAt work but not listed
as an employee (%) 24 21 10 11Employee (%) 76 79 90 89Sample size 654 704 1934 698
Note.Men without occupation excluded.
334 GREEN AND MACKINNON

quickly into self-employment. A less slow estimated rate of assimilation in Montrealthan in Toronto may be linked to the smaller gap in employment status betweenimmigrants and the native-born in Toronto.
Our results about relatively slow assimilation are robust to changes in functionalform and to the exclusion of non-English mother-tongue men. Limited access toclerical positions, and to self-employment and employer status, are probably impor-tant. Fuller explanation for the slow rates of assimilation, relative to post-World WarII Canadian, and 1880s and 1890s evidence for the United States, and also for theoften fairly modest differences between the earnings of English, Irish, and Europeanimmigrants, must remain more speculative at this stage. Measuring the skill com-position of 19th century immigrants to Canada and the United States is probablyimpossible. Whatever the relative skill composition of the immigrant stream toCanada, the last 3 decades of the 19th century saw mass emigration from Canada tothe United States (McInnis, 1994). We do not know whether immigrants, and if so,which immigrants, were more likely to leave for the United States than were theCanadian-born. If the most able immigrants were more likely to move on than wereCanadians with high earnings potential, then slow assimilation would be the out-come. We see no reason for this to have been the case. Research on the occupationsof the Canadian- and British-born in the United States is a future project whichshould shed some light on the question.
CONCLUSIONS
British immigrants’ slow assimilation into the Canadian economy runs counter toresults reported in some studies of the United States in the years before World WarI and the findings for both Canada and the United States in the years after World WarII. The relatively long period to wage equality that we see in the 1901 CanadianCensus seems to correspond more closely to the pessimistic view of Woodsworthrather than the more optimistic view of Lower and Reynolds. Reynolds, however,was mainly thinking about blue-collar immigrants. For blue-collar workers alone,British immigrants (especially the English and Scottish) do look more like native-born anglophones. It is in the white collar sector, and also in the move away fromwage earning into self-employment or employer status, where British immigrantsseem to have been at a substantial and sustained handicap. We cannot yet explainwhy the British were underrepresented in these high-income occupations. As everwhen interpreting evidence drawn from a single cross section to infer rates ofassimilation, changes in the characteristics of the immigrant inflow and emigrantoutflow may be important in explaining our results. A more thorough examination ofthese possibilities must await further research.
The picture we see in 1901 is an accurate portrayal of the Canadian labor marketat that time, even if our inferences about rates of assimilation must remain open toquestion. British immigrants were invisible immigrants in Canada and were prizedfor their capacity to strengthen ties to the mother country. In economic terms,however, they were clearly not living up to the expectations Canada’s immigrationpolicy had for them.
335BRITISH IMMIGRANTS IN CANADA
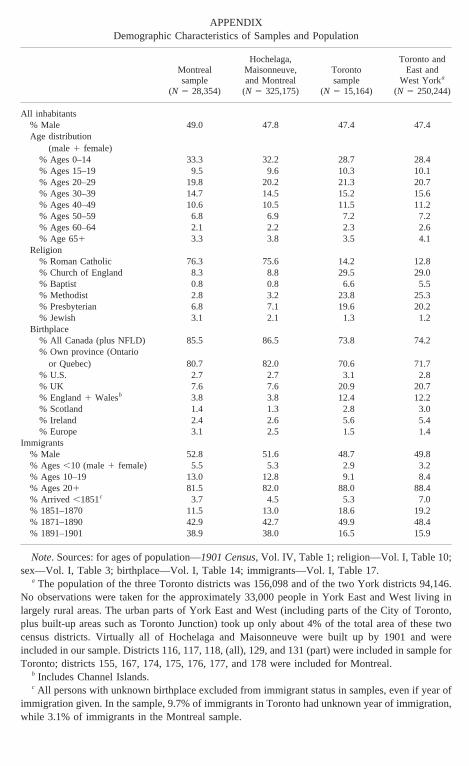
APPENDIXDemographic Characteristics of Samples and Population
Montrealsample
(N 5 28,354)
Hochelaga,Maisonneuve,and Montreal
(N 5 325,175)
Torontosample
(N 5 15,164)
Toronto andEast and
West Yorka
(N 5 250,244)
All inhabitants% Male 49.0 47.8 47.4 47.4Age distribution
(male1 female)% Ages 0–14 33.3 32.2 28.7 28.4% Ages 15–19 9.5 9.6 10.3 10.1% Ages 20–29 19.8 20.2 21.3 20.7% Ages 30–39 14.7 14.5 15.2 15.6% Ages 40–49 10.6 10.5 11.5 11.2% Ages 50–59 6.8 6.9 7.2 7.2% Ages 60–64 2.1 2.2 2.3 2.6% Age 651 3.3 3.8 3.5 4.1
Religion% Roman Catholic 76.3 75.6 14.2 12.8% Church of England 8.3 8.8 29.5 29.0% Baptist 0.8 0.8 6.6 5.5% Methodist 2.8 3.2 23.8 25.3% Presbyterian 6.8 7.1 19.6 20.2% Jewish 3.1 2.1 1.3 1.2
Birthplace% All Canada (plus NFLD) 85.5 86.5 73.8 74.2% Own province (Ontario
or Quebec) 80.7 82.0 70.6 71.7% U.S. 2.7 2.7 3.1 2.8% UK 7.6 7.6 20.9 20.7% England1 Walesb 3.8 3.8 12.4 12.2% Scotland 1.4 1.3 2.8 3.0% Ireland 2.4 2.6 5.6 5.4% Europe 3.1 2.5 1.5 1.4
Immigrants% Male 52.8 51.6 48.7 49.8% Ages,10 (male1 female) 5.5 5.3 2.9 3.2% Ages 10–19 13.0 12.8 9.1 8.4% Ages 201 81.5 82.0 88.0 88.4% Arrived ,1851c 3.7 4.5 5.3 7.0% 1851–1870 11.5 13.0 18.6 19.2% 1871–1890 42.9 42.7 49.9 48.4% 1891–1901 38.9 38.0 16.5 15.9
Note. Sources: for ages of population—1901 Census, Vol. IV, Table 1; religion—Vol. I, Table 10;sex—Vol. I, Table 3; birthplace—Vol. I, Table 14; immigrants—Vol. I, Table 17.
a The population of the three Toronto districts was 156,098 and of the two York districts 94,146.No observations were taken for the approximately 33,000 people in York East and West living inlargely rural areas. The urban parts of York East and West (including parts of the City of Toronto,plus built-up areas such as Toronto Junction) took up only about 4% of the total area of these twocensus districts. Virtually all of Hochelaga and Maisonneuve were built up by 1901 and wereincluded in our sample. Districts 116, 117, 118, (all), 129, and 131 (part) were included in sample forToronto; districts 155, 167, 174, 175, 176, 177, and 178 were included for Montreal.
b Includes Channel Islands.c All persons with unknown birthplace excluded from immigrant status in samples, even if year of
immigration given. In the sample, 9.7% of immigrants in Toronto had unknown year of immigration,while 3.1% of immigrants in the Montreal sample.

REFERENCES
Abbott, M. G., and Beach C. M. (1993), “Immigrant Earnings Differentials and Birth-year Effects forMen in Canada: Post-war—1972.”Canadian Journal of Economics36, 505–524.
Akenson, D. H. (1988),Small Differences: Irish Catholics and Irish Protestants 1815–1922.Kingston/Montreal: McGill/Queen’s University Press.
Avery, D. (1979)“Dangerous Foreigners:” European Immigrant Workers and Labour Radicalismin Canada, 1896–1932.Toronto: McClelland & Stewart.
Baker, M., and Benjamin, D. (1994), “The Performance of Immigrants in the Canadian LaborMarket.” Journal of Labor Economics12, 369–405.
Baskerville, P., and Sager, E. W. (1998),Unwilling Idlers: The Urban Unemployed and TheirFamilies in Late Victorian Canada.Toronto: Univ. of Toronto Press.
Bloom, D. E., Grenier, G., and Gunderson, M. (1995), “The Changing Labour Market Position ofCanadian Immigrants.”Canadian Journal of Economics38, 987–1005.
Borjas, G. J. (1994), “The Economics of Immigration.”Journal of Economic Literature32, 1667–1717.
Crafts, N. F. R. (1985),British Economic Growth during the Industrial Revolution.Oxford, UK:Clarendon Press.
Darroch, A. G., and Ornstein, M. D. (1980), “Ethnicity and Occupational Structure in Canada in1871: The Vertical Mosaic in Historical Perspective.”Canadian Historical Review61,305–333.
Edwards, A. M. (1940).Alphabetical Index of Occupations and Industries: Occupation and IndustryClassifications Based on the Respective Standard Classifications(16th Census of the UnitedStates). Washington, DC: U.S. Department of Commerce, Bureau of the Census.
Erickson, C. (1972),Invisible Immigrants: The Adaptation of English and Scottish Immigrants inNineteenth-Century America.Coral Gables, FL: Univ. of Miami Press.
Fitzpatrick, D. (1980), “Irish Emigration in the Later Nineteenth Century.”Irish Historical Studies22, 126–143.
Green, A. G., and Green, D. A. (1993), “Balanced Growth and the Geographical Distribution ofEuropean Immigrant Arrivals to Canada, 1900–1912.”Explorations in Economic History30,31–59.
Hanes, C. (1996), “Immigrants’ Relative Rate of Wage Growth in the Late Nineteenth Century.”Explorations in Economic History33, 35–64.
Hatton, T. J. (1997), “The Immigrant Assimilation Puzzle in Late Nineteenth-Century America.”Journal of Economic History57, 34–62.
Kealey, G. S. (1980),Toronto Workers Respond to Industrial Capitalism 1867–1892.Toronto: Univ.of Toronto Press.
Lower, R. M. (1930), “The Case Against Immigration.”Queen’s Quarterly37, 557–574.Lower, A. R. M. (1946),Colony to Nation: A History of Canada.Toronto: Longmans, Green.MacKinnon, M. (1989), “Years of Schooling: The Australian Experience in Comparative Perspec-
tive.” Australian Economic History Review29, 58–78.MacKinnon, M. (2000), “Unilingues ou bilingues? Les Montre´alais sur le marche´ du travail en 1901.”
L’Actualite Economique76, 136–158.McDowall, D. (1993),Quick to the Frontier: Canada’s Royal Bank.Toronto: McClelland & Stewart.McGowan, M. G. (1999),The Waning of the Green: Catholics, the Irish, and Identity in Toronto,
1887–1922.Montreal: McGill/Queen’s Univ. Press.McInnis, M. (1994), “Immigration and Emigration: Canada in the Late Nineteenth Century.” In T. J.
Hatton and J. G. Williamson (Eds.),Migration and the International Labor Market 1850–1939.London: Routledge, 1994. Pp. 139–155.
Minns, C. (2000), “Income, Cohort Effects, and Occupational Mobility: A New Look at Immigrationto the United States at the Turn of the Twentieth Century.”Explorations in Economic History37, 326–350.
Offer, A. (1989),The First World War: An Agrarian Interpretation.Oxford, UK: Oxford Univ. Press.
337BRITISH IMMIGRANTS IN CANADA

Parr, J. (1980),Labouring Children.London/Montreal: Croom Helm and McGill/Queen’s Univ.Press.
Percy, M. (1977),Migration Flows During the Decade of the Wheat Boom in Canada, 1900–1910:A Neo-Classical Analysis.PhD Dissertation, Queen’s University.
Pope, D., and Withers, G. (1994), “Wage Effects of Immigration in Late-Nineteenth-CenturyAustralia.” In T. J. Hatton and J. G. Williamson (Eds.),Migration and the International LaborMarket 1850–1939.London: Routledge. Pp. 240–262.
Reynolds, L. G. (1935),The British Immigrant: His Social and Economic Adjustment in Canada.Toronto: Oxford Univ. Press.
Ruggles, S. (1995), “Sample Designs and Sampling Errors.”Historical Methods28, 40–46.Timlin, M. (1960), “Canada’s Immigration Policy, 1896–1910.”The Canadian Journal of Economics
and Political Science26, 517–532.Tulchinsky, G. (1992),Taking Root: The Origins of the Canadian Jewish Community.Toronto:
Lester.Wagner, G. (1982),Children of the Empire.London: Weidenfeld and Nicolson.Woodsworth, J. S. (1909, 1972 ed.),Strangers within our Gates.Toronto: Univ. of Toronto Press.
338 GREEN AND MACKINNON