The Skorina Letter · The Skorina Letter News, Interviews, Research for Institutional and Family...
22
The Skorina Letter News, Interviews, Research for Institutional and Family Office Investors ● Retained Executive Search ● We recruit chief investment officers and senior asset managers for endowments, foundations, family offices and institutional investment firms -------------------------------------------------- Website: http://www.charlesskorina.com/ Email: [email protected] Office: 415-391-3431 In this issue • Part I: Top 100+ Chief Investment Officers • Part II: Allocations, Skill, and Destiny • Part III: Outsourced CIOs hold their own • Charts (9): Performance, Portfolios, Rankings & Returns Download letter in PDF from www.charlesskorina.com -------------------------------------------------- Top endowment chief investment officers and the road ahead This letter looks at the most recent five-year performance of over one hundred of the world’s best university endowment chief investment officers. We rank their returns, review their performance, and reveal their strategies for the decade ahead. Endowment chief investment officers (and other non-profit CIOs) have an infinite investment horizon, a global playing field, and can invest in anything anywhere - within the broad policy limits set by their institution. They are the top guns of the institutional investment world. We recruit these investment heads for endowments, foundations, family offices and institutional investment firms. And, we (and many others) regard the CIOs at major American universities and foundations as the best of the best. A CIO candidate may have a sterling character, a stunning intellect, and a winning smile. Those things do count. But will he or she make money for our
Transcript of The Skorina Letter · The Skorina Letter News, Interviews, Research for Institutional and Family...

The Skorina Letter News, Interviews, Research for Institutional and Family Office Investors
● Retained Executive Search ● We recruit chief investment officers and senior asset managers for
endowments, foundations, family offices and institutional investment firms
-------------------------------------------------- Website: http://www.charlesskorina.com/ Email: [email protected]
Office: 415-391-3431
In this issue
• Part I: Top 100+ Chief Investment Officers • Part II: Allocations, Skill, and Destiny • Part III: Outsourced CIOs hold their own • Charts (9): Performance, Portfolios, Rankings & Returns
Download letter in PDF from www.charlesskorina.com --------------------------------------------------
Top endowment chief investment officers and the road ahead
This letter looks at the most recent five-year performance of over one hundred of the world’s best university endowment chief investment officers. We rank their returns, review their performance, and reveal their strategies for the decade ahead. Endowment chief investment officers (and other non-profit CIOs) have an infinite investment horizon, a global playing field, and can invest in anything anywhere - within the broad policy limits set by their institution. They are the top guns of the institutional investment world. We recruit these investment heads for endowments, foundations, family offices and institutional investment firms. And, we (and many others) regard the CIOs at major American universities and foundations as the best of the best. A CIO candidate may have a sterling character, a stunning intellect, and a winning smile. Those things do count. But will he or she make money for our

clients? Recruiting a high-profile investment executive is a complex process, but it starts with objective measurements. We compile the information presented in this report for internal use to help us as recruiters, and we think it will be useful to boards, trustees, CEOs and all our readers. Chief investment officers “make things happen.” Security selection, manager selection, timing, and fees play an important role in investment performance - allocations don’t explain everything! We also uncover the emergence of a new consensus around a 60/40 – alternatives/public markets – portfolio, even as we report on the embarrassing success of the old 60/40 stocks/bonds This is our SEER report: Skorina's Enhanced Endowment Report. The enhancements are the names and returns of individual CIOs (or OCIOs), data which are not readily available elsewhere. If you need further information, or help with hiring decisions, please call on us anytime. Now, on with the show:
Top 100+ Chief Investment Officers: Ranked by 5-year Performance BLUE: Skorina's calculations for institutions that do not disclose performance data GREEN: Non-standard fiscal year end - NOT 30 June PURPLE: Endowments managed by separate foundations or investment management companies
R a n k
5yr Rtn
Chief
Investment Officer
- (OCIO firm)
IMC or
FDN Institution
AUM FY16 $bn
- - - - -
1 10.4 Swensen, David Yale U $ 25.4
2 10.3 Alexander, Seth IMC MIT $ 13.2
3 9.9 Volent, Paula Bowdoin College $ 1.3
4 9.4 Golden, Andrew IMC Princeton U $ 22.2
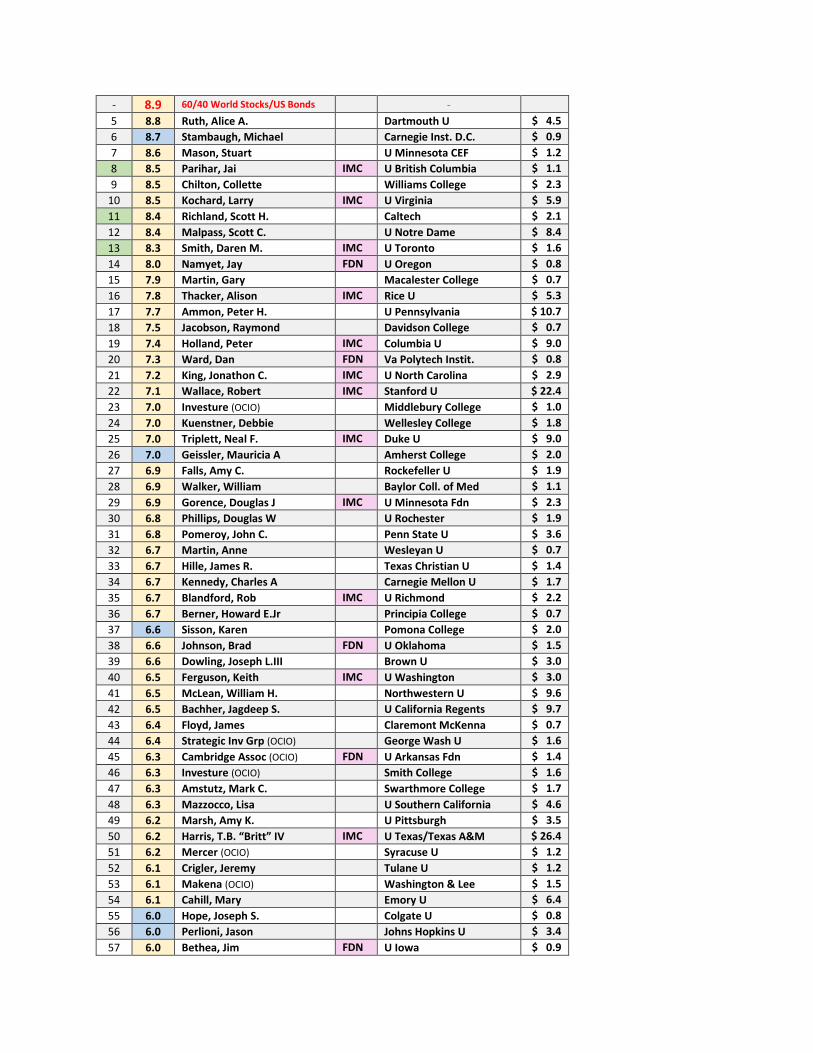
- 8.9 60/40 World Stocks/US Bonds -
5 8.8 Ruth, Alice A. Dartmouth U $ 4.5
6 8.7 Stambaugh, Michael Carnegie Inst. D.C. $ 0.9
7 8.6 Mason, Stuart U Minnesota CEF $ 1.2
8 8.5 Parihar, Jai IMC U British Columbia $ 1.1
9 8.5 Chilton, Collette Williams College $ 2.3
10 8.5 Kochard, Larry IMC U Virginia $ 5.9
11 8.4 Richland, Scott H. Caltech $ 2.1
12 8.4 Malpass, Scott C. U Notre Dame $ 8.4
13 8.3 Smith, Daren M. IMC U Toronto $ 1.6
14 8.0 Namyet, Jay FDN U Oregon $ 0.8
15 7.9 Martin, Gary Macalester College $ 0.7
16 7.8 Thacker, Alison IMC Rice U $ 5.3
17 7.7 Ammon, Peter H. U Pennsylvania $ 10.7
18 7.5 Jacobson, Raymond Davidson College $ 0.7
19 7.4 Holland, Peter IMC Columbia U $ 9.0
20 7.3 Ward, Dan FDN Va Polytech Instit. $ 0.8
21 7.2 King, Jonathon C. IMC U North Carolina $ 2.9
22 7.1 Wallace, Robert IMC Stanford U $ 22.4
23 7.0 Investure (OCIO) Middlebury College $ 1.0
24 7.0 Kuenstner, Debbie Wellesley College $ 1.8
25 7.0 Triplett, Neal F. IMC Duke U $ 9.0
26 7.0 Geissler, Mauricia A Amherst College $ 2.0
27 6.9 Falls, Amy C. Rockefeller U $ 1.9
28 6.9 Walker, William Baylor Coll. of Med $ 1.1
29 6.9 Gorence, Douglas J IMC U Minnesota Fdn $ 2.3
30 6.8 Phillips, Douglas W U Rochester $ 1.9
31 6.8 Pomeroy, John C. Penn State U $ 3.6
32 6.7 Martin, Anne Wesleyan U $ 0.7
33 6.7 Hille, James R. Texas Christian U $ 1.4
34 6.7 Kennedy, Charles A Carnegie Mellon U $ 1.7
35 6.7 Blandford, Rob IMC U Richmond $ 2.2
36 6.7 Berner, Howard E.Jr Principia College $ 0.7
37 6.6 Sisson, Karen Pomona College $ 2.0
38 6.6 Johnson, Brad FDN U Oklahoma $ 1.5
39 6.6 Dowling, Joseph L.III Brown U $ 3.0
40 6.5 Ferguson, Keith IMC U Washington $ 3.0
41 6.5 McLean, William H. Northwestern U $ 9.6
42 6.5 Bachher, Jagdeep S. U California Regents $ 9.7
43 6.4 Floyd, James Claremont McKenna $ 0.7
44 6.4 Strategic Inv Grp (OCIO) George Wash U $ 1.6
45 6.3 Cambridge Assoc (OCIO) FDN U Arkansas Fdn $ 1.4
46 6.3 Investure (OCIO) Smith College $ 1.6
47 6.3 Amstutz, Mark C. Swarthmore College $ 1.7
48 6.3 Mazzocco, Lisa U Southern California $ 4.6
49 6.2 Marsh, Amy K. U Pittsburgh $ 3.5
50 6.2 Harris, T.B. “Britt” IV IMC U Texas/Texas A&M $ 26.4
51 6.2 Mercer (OCIO) Syracuse U $ 1.2
52 6.1 Crigler, Jeremy Tulane U $ 1.2
53 6.1 Makena (OCIO) Washington & Lee $ 1.5
54 6.1 Cahill, Mary Emory U $ 6.4
55 6.0 Hope, Joseph S. Colgate U $ 0.8
56 6.0 Perlioni, Jason Johns Hopkins U $ 3.4
57 6.0 Bethea, Jim FDN U Iowa $ 0.9

58 6.0 Lundberg, Erik L. U Michigan $ 10.5
6.0 SEER Median
59 5.9 (ex) Matz, Jason Carleton College $ 0.7
60 5.9 Browne, Kathleen Denison U $ 0.7
61 5.9 PWP/Agility (OCIO) U Colorado Fdn $ 1.1
62 5.9 O'Donnell, Hugh J. Colby College $ 0.7
63 5.9 Narvekar, Narv IMC Harvard U $ 34.5
64 5.8 Whitworth, Gary Saint Louis U $ 1.1
65 5.8 Richards, Thomas U Missouri Sys $ 1.5
66 5.8 Pulavarti, “Srini” B. IMC UCLA Fdn $ 1.8
67 5.7 Cornerstone Pr (OCIO) DePauw U $ 0.6
68 5.7 Bohrer, Joseph S. Lafayette College $ 0.7
69 5.7 Jones, Eric Cl. Loyola U of Chicago $ 0.5
70 5.7 Hunnewell, Clarissa Boston U $ 1.7
71 5.7 Lonergan, Andrew Reed College $ 0.5
72 5.7 Schmid, Mark U Chicago $ 7.1
73 5.6 (ex) Walker, Kimberly IMC Washington U (St.L) $ 8.4
74 5.5 Thayer, Jainen Oberlin College $ 0.7
75 5.5 Scheer, Karl U Cincinnati $ 1.2
76 5.4 Wilson, Scott L. Grinnell College $ 1.6
77 5.3 Kerrigan, John Santa Clara U $ 0.8
78 5.3 Barry, Michael Georgetown U $ 1.5
79 5.3 Dungan, Sally M. Tufts U $ 1.6
80 5.3 (ex) Saviano, John-A IMC UC Berkeley Fdn $ 1.6
81 5.3 Stratton, Gary Indiana U $ 1.9
82 5.3 Miranda, Ken Cornell U $ 5.8
83 5.3 Zona, John J. Boston College $ 2.1
84 5.2 Herring, Ahron Yeshiva U $ 0.6
85 5.1 (ex) Condon, Michael Southern Methodist $ 1.4
86 5.0 Taylor, James B. Georgia Inst. of Tech. $ 1.3
87 5.0 Lane, John C. Ohio State U $ 3.6
88 4.9 McAndrew, Shane Villanova U $ 0.6
89 4.9 Cooper, David FDN Purdue U $ 2.3
90 4.9 Mecherle, Rip U Tennessee $ 1.1
91 4.9 Ulozas, Catherine Drexel U $ 0.7
92 4.8 Ellison, Ellen J. FDN U Illinois $ 1.5
93 4.7 Reeser, William S. IMC U Florida Fdn $ 1.5
94 4.7 (ex) Handley, Janet A FDN Texas A&M U Sys $ 1.4
95 4.6 Jarry, Timothy College of Holy Cross $ 0.7
96 4.6 Hirtle Callaghan (OCIO) Berea College $ 1.1
97 4.6 Verger Capital (OCIO) Wake Forest U $ 1.1
98 4.5 Hall, Anders W. Vanderbilt U $ 3.8
99 4.4 Webb, R. Brian Baylor U $ 1.1
100 4.4 (ex) Staley, Sally Case Western Rsrve $ 1.7
101 4.4 Harkins, David IMC UCSF Fdn $ 1.1
102 4.4 Tydwell, Ryan FDN Oklahoma State U $ 0.5
103 4.2 Barker, Craig FDN U Arizona $ 0.7
104 4.0 Blackrock (OCIO) Arizona State U Fdn $ 0.6
105 4.0 Commonfund (OCIO) Bucknell U $ 0.8
106 3.9 Agatone, Kristin Lehigh U $ 1.2
107 3.7 Wood, Eric Fordham U $ 0.6
Clarifications and caveats:

... Where's my school? If your school isn't on the list, it's probably because it uses a committee-and-consultant model and has no CIO. Or, it's too small. (Our lower-bound cutoff is ~$500 million AUM) Or, we could get neither an official number nor a reasonable estimate for the 5-year return. We believe we've identified the great majority (over 90 percent) of endowments which meet our criteria, but we've undoubtedly missed a few. We may unearth more of them in future editions of SEER. ... All the returns are trailing 5-years annualized as of June 30, 2016; with five exceptions. Those five have returns for non-standard fiscal years and are tagged with light green shading on the rank number. Since the periods are slightly different, the rankings aren't strictly comparable to June 30 numbers. These are significant endowments (including our Canadian friends) and we wanted to include them, anyway. ... In eighteen cases we used our own estimates of returns when official numbers were not available. They are tagged with blue shading on the return number. In most cases, our error is probably within plus-or-minus 20 basis points. While these are good enough for our purposes, they are not necessarily good enough for your purposes. And, they should not be interpreted or reported as sanctioned, official numbers. We say more about our estimates in appendix #2 at the bottom of this report. We will promptly and semi-cheerfully publish corrections if errors are brought to our attention. ... The reported CIO (or OCIO) is as of late June, 2017 Since CIOs come and go, this individual is not necessarily responsible for performance over the entire trailing 5-year period. In appendix #1 down below, we have a chart noting turnovers over the past three years, which helps to clarify those situations.

... A pink bar in the middle of the Top 100 chart indicates who the CIO really works for. It may be a parallel foundation, or a semi-autonomous investment management company (IMC). Otherwise, the CIO is presumably employed directly by the college or university.
The Goldilocks number For us as headhunters, the 5-year return is the Goldilocks number, and it's the key statistic in our SEER list. The SEER list is CIO-centric, and CIOs typically don't hang around for a decade. Their average tour of duty is close to 6 years according to our latest research. So, more often than not, the 5-year return can be attributed to one individual, which is exactly what we want to do. It's also more readily available for more institutions than 10-year returns. That lets us maximize the number of CIOs we can report.
Rankings: love 'em or hate 'em Some people think peer-rankings like ours are misleading and a bit vulgar. They are welcome to avert their gaze and dodge our calls. We think peer-rankings are respectable and useful. But, we readily concede that an institution's own internal benchmarks, if they are wisely constructed, are the best way to judge investment performance. We say "wisely," because when anyone sets his own benchmarks there is always a temptation to game the system. After all, bonuses, promotions and prestige are on the line. If nobody ever cheated when counting their own calories or pushups, we'd be a much thinner country. Our friend Nikki Kraus at Strategic Investment Group got it right in a recent article: both peer-rankings and internal goals are useful:
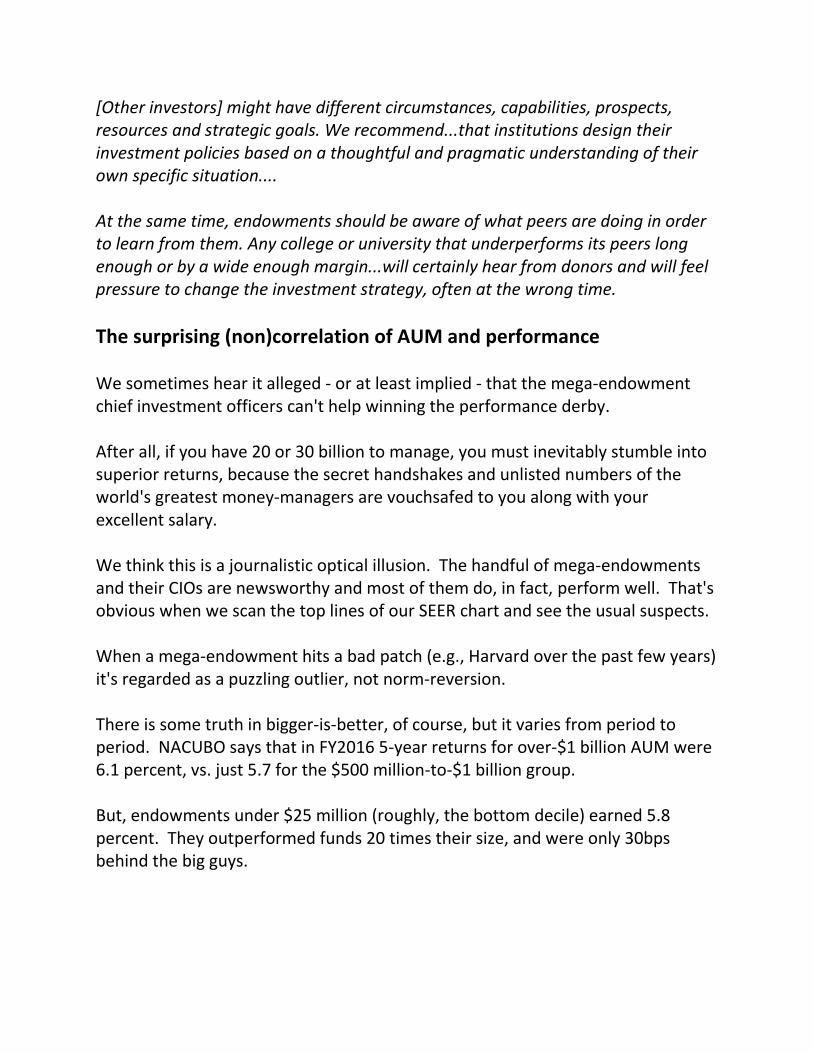
[Other investors] might have different circumstances, capabilities, prospects, resources and strategic goals. We recommend...that institutions design their investment policies based on a thoughtful and pragmatic understanding of their own specific situation.... At the same time, endowments should be aware of what peers are doing in order to learn from them. Any college or university that underperforms its peers long enough or by a wide enough margin...will certainly hear from donors and will feel pressure to change the investment strategy, often at the wrong time.
The surprising (non)correlation of AUM and performance We sometimes hear it alleged - or at least implied - that the mega-endowment chief investment officers can't help winning the performance derby. After all, if you have 20 or 30 billion to manage, you must inevitably stumble into superior returns, because the secret handshakes and unlisted numbers of the world's greatest money-managers are vouchsafed to you along with your excellent salary. We think this is a journalistic optical illusion. The handful of mega-endowments and their CIOs are newsworthy and most of them do, in fact, perform well. That's obvious when we scan the top lines of our SEER chart and see the usual suspects. When a mega-endowment hits a bad patch (e.g., Harvard over the past few years) it's regarded as a puzzling outlier, not norm-reversion. There is some truth in bigger-is-better, of course, but it varies from period to period. NACUBO says that in FY2016 5-year returns for over-$1 billion AUM were 6.1 percent, vs. just 5.7 for the $500 million-to-$1 billion group. But, endowments under $25 million (roughly, the bottom decile) earned 5.8 percent. They outperformed funds 20 times their size, and were only 30bps behind the big guys.
And, in FY2015, the trailing 5-year return for those mini-endowments actually beat the big guys: 10.6 percent vs 10.4 percent. And remember, that was a 5-year number, not a 1-year blip. This tells us that a lot of those smaller funds must be doing well, and doing it pretty consistently. They have some smart, capable investors managing that money. AUM really isn't destiny in investment management. Sticking to our over-$500 million SEER cohort, we think the AUM/return correlation is very weak, and we can show it empirically. A simple regression analysis on our SEER list (using 5-year returns as the dependent variable and AUM as the independent variable) yields a pathetic R-squared statistic: just 0.096. If you've gratefully forgotten that class, the tiny R-squared means that having more or less AUM (at least in this range) is a very poor predictor of having higher or lower returns. If you prefer anecdotes to math, consider the case of Southern Virginia University. It's a tiny Mormon school which had the second-highest return among all the NCSE funds in FY2015. CIO Jesse Seegmiller manages $1.1 million, with an "m." He earned 10.5 percent in FY2015, and had a trailing 10-year return of 11.2 percent annualized. He owns no alternatives and has a significant allocation to low-cost index funds. See: https://www.nytimes.com/2016/02/26/business/in-college-endowment-returns-davids-beat-the-goliaths.htmlpartner=rss&emc=rss
Allocations explain everything! Or, maybe not? If bigger pots of money don't guarantee better returns, then how should we think about the dispersion of performance we see in our SEER chart? What explains it? Many of our readers spend their professional lives grappling with this question, both theoretically and practically.

The old, one-word answer used to be just: allocations. Some academics back in the 80s were interpreted (or maybe misinterpreted) as saying that 90 percent of variance in returns could be explained by differences in asset allocation. Some industry people liked the sound of that and ran with it for marketing purposes. More recent work, especially by Roger Ibbotson and colleagues (in 2000 and 2010), seems to imply that allocation policy, while very important, is less decisive than that. And that may explain why institutions with similar-looking policy-portfolios can still generate quite dissimilar returns in a given period; and vice-versa. It all depends on the wording of the question. Gary Brinson (former head of UBS Global Asset Management) and his co-authors in 1986 asked: how much do changes in allocation policy over time explain the variation of a fund's actual return over time? It requires a "longitudinal" analysis. The answer he got was: a lot -- 90 percent or more. In 2000, Prof. Ibbotson (of Yale) and his co-author agreed. But, Ibbotson went on to ask another question, one probably more pertinent to investors: How much does allocation policy explain differences in total return among different funds in a given period? That's a "cross-sectional" analysis. He said it was a lot less than 90 percent: about 40 percent for mutual funds, and about 35 percent for pension managers. Looking at dispersion of 5-year returns in our SEER list, that second, "cross-sectional" question is exactly the one we want to ask. Allocation (i.e., the policy portfolio) is an important part of the answer, but it's not preponderant.

We interpret Ibbotson to be saying that most of the differences in 5-year return are due to other factors: e.g., security selection, manager selection, timing, and fees. The controversy is all very...academic. In any case, we will leave that ongoing debate to our readers. This 2006 article (by Joseph Davis, the chief economist at Vanguard) gives a rigorous, but understandable recap of the debate, including a bibliography: The Asset Allocation Debate: Provocative Questions, Enduring Realities, http://www.vanguard.com/pdf/icradd.pdf For mere head-hunters, however, this Ibbotsonian picture is congenial. It has implications for asset-owners that vindicate the role of chief investment officers; and, therefore, the people who recruit them. After all, if allocation is everything, and those decisions are made primarily up at the board or investment-committee level, then what's left for the poor CIO to do, and for what is she being compensated? If all you need is a great head coach calling in the brilliant plays, then the quarterback only has to know the playbook, and any QB will do. That would make quarterbacks cheap and interchangeable. But that's not football, and it's also not investment management. A CIO's ability to interpret the overall strategy, fine-tune it tactically, and find and monitor top money-manager talent is critical to achieving good returns. That's our story and we're sticking to it. Not to mention that a board or committee with an excellent CIO should listen respectfully to his opinions about overall strategy as well, even if he isn't a voting trustee. See: "What makes a great chief investment officer? http://www.charlesskorina.com/?p=4695

And if you don't have an excellent CIO, why don't you? (We can help you with that!)
Part II
The embarrassing new success of the Old 60/40 For the reasons we adduced, we prefer 5-year periods for measuring the performance of investment heads. Longer periods can be thought of as rolling 5-year periods to fit our narrative. And a rolling multi-year statistic smooths out year-to-year noise to help us see trends more clearly. Some CIOs tell us they try to evaluate external managers this way, to avoid over-reacting to short-term hits or misses. And, we note that one of the world's most successful asset-owners, Warren Buffett, uses rolling 5-year return on the S&P 500 as Berkshire Hathaway's key benchmark, signaling his long-term perspective. Here's a set of rolling 5-year returns spanning the last 11 years. It straddles the financial crisis of 2008/2009 and gives a quick look in the rearview mirror. Returns for our SEER list are very similar to those in NACUBO's over-$1 billion cohort, so we can use their historical statistics as a proxy.
Rolling 5-year endowment returns vs. old-school 60/40 Green Bars: US 60/40 returns Gold Bar: Endowments over $1 billion
FY 30 June per NCSE
FY16 5-yr %
FY15 5-yr %
FY14 5-yr %
FY13 5-yr
%
FY12 5-yr
%
FY11 5-yr
%
FY10 5-yr
%
FY09 5-yr
%
FY08 5-yr %
FY07 5-yr %
FY06 5-yr
%
- - - - - - - - - - - -
US 60/40 8.8 11.7 13.2 6.3 2.8 - - - - - -
Endowments
> $1bn 6.1 10.4 12.1 3.8 1.7 5.4 4.7 5.1 13.3 13.9 8.8
US 60/40 - - - - - 4.3 1.7 0.7 6.1 8.2 3.5
- - - - - - - - - - - -
SP 500 12.1 17.3 18.8 7.0 0.2 2.9 -0.8 -2.2 7.6 10.7 2.5

Barclay's Agg 3.8 3.4 4.9 5.2 6.8 6.5 5.5 5.0 3.9 4.5 5.0
When we insert the U.S. 60/40, we see something striking: The wheezy old U.S. stock/bond 60/40 portfolio has recently been thumping the big endowments. Financial sophisticates have been dissing the poor, old U.S. 60/40 for many years. It's low-cost and easy-to-manage but (or maybe, therefore) only suitable for the rubes. In a sense, of course, it is irrelevant. It hasn't been the target portfolio for big institutions for almost forty years, and we can't criticize an investor for not hitting a target she isn't aiming at. As we see in the chart above, endowments trounced the U.S. 60/40 before the financial crisis. Then the old 60/40 got a new spring in its step. Since 2012 it's beaten the endowments on a rolling 5-year basis, even after the crunch year of FY2009 was flushed out of the 5-year averages. This anomaly may not last. But, meanwhile, what's going on here? At least two things: First, the endowments were diversifying away from public equities into alternatives. And, to the extent they still held direct investments in publicly-traded assets; they were diversifying away from the U.S. Unfortunately, this meant they couldn't capture all the outperformance of U.S. equities after the financial crisis. Why U.S. stocks surged so far ahead of the ex- U.S. developed world after the crisis is probably complicated and above our pay-grade. Clearly, the central banks have been inflating the value of risk assets since 2009. Also: Brexit, Grexit and other troubles. It may be just that the Fed has done it more aggressively than their colleagues at the ECB or BOJ. We have out-QE'd the rest of the world (yay, us) and U.S. stock investors have benefited. Endowments, not so much. We can see this clearly in another mini-chart: performance of the S&P 500 vs. the MSCI EAFE index (basically, the developed-world stock markets outside the U.S. and Canada):

Comparative performance of S&P 500 vs. MSCI EAFE index Green Bar: SP500 beats MSCI/EAFE
Gold Bar: MSCI/EAFE beats SP500
Calendar Year-end
CY16 5-yr
%
CY15 5-yr
%
CY14 5-yr %
CY13 5-yr
%
CY12 5-yr
%
CY11 5-yr
%
CY10 5-yr
%
CY09 5-yr
%
CY08 5-yr
%
CY07 5-yr
%
CY06 5-yr %
- - - - - - - - - - - -
SP500 14.7 12.6 15.5 17.9 1.7 -0.3 2.3 0.4 -2.2 12.8 6.2
MSCI EAFE 6.5 3.6 6.3 13.4 -2.8 -3.9 3.4 3.5 1.66 21.6 15.0
Spread 8.1 9.0 9.2 4.5 4.5 3.6 -1.1 -3.1 -3.9 -8.8 -8.8
The emergence of the New 60/40 The Old 60/40 was pensioned off by institutions decades ago, and is now brought out only on ceremonial occasions so that we can all marvel at how much things have changed. It's been eclipsed by a New 60/40 portfolio with $6 of alternatives for every $4 of public-market assets. OK, it's just the Yale Model in drag, but it does tell us something interesting. The conventional description of an alts-heavy allocation is qualitative and doesn't prescribe any specific breakdown for alts vs. pubs. But when we looked at policy portfolios we were struck by how they seem to converge on that ratio. And we recall something Margaret Chen, the head of Cambridge Associates's OCIO business, commented on in our last newsletter: I sometimes compare nonprofit boards to middle-school students. Of course, they all want to be different and think of themselves as different. But, somehow, they all end up looking different in exactly the same way! See: Cambridge Associates: Leading the charge into OCIO battlespace http://www.charlesskorina.com/?p=4761 We looked at a representative sample of current policy portfolios over a range of sizes on our SEER list, and it fell out pretty clearly.

Here's a summary of our data:
Endowment Policy Portfolios: Alternatives/Publics Ratio Selected SEER endowments
- Institution
Alts/ Public ratio:
(Fraction)
Alts/ Public ratio:
(Decimal)
Alts %
Publics %
AUM $bn
30Jun 2016
- - - - - - -
1 Harvard U 59/41 1.4 58.5 41.5 34.5
2 Yale U 74/26 2.8 73.5 26.5 25.4
3 Stanford U 66/34 1.9 66.0 34.0 22.4
4 Princeton U 69/31 2.2 69.0 31.0 22.2
5 U of Michigan 55/45 1.2 55.0 45.0 9.7
6 Northwestern U 55/45 1.2 55.0 45.0 9.7
7 U of Notre Dame 55/45 1.2 55.0 45.0 8.4
8 UC Regents 44/66 0.8 43.8 56.2 8.3
9 U of Chicago 68/32 2.1 67.5 32.5 7.0
10 U of Virginia 64/30 1.8 63.9 36.1 5.9
11 U of No Carolina 63/37 1.7 63.0 37.0 2.9
12 Rockefeller U 66/34 1.9 65.0 35.0 1.9
13 U of Illinois Fdn 55/45 1.2 54.0 46.0 1.5
14 Ariz State U Fdn 50/50 1.0 50.0 50.0 0.5
- - - - - - -
- Mean: 60/40 1.6 60 40 7
- Median 61/39 1.6 61 39 8
- SD - 1 8 8 4
There are a couple of outliers, including Yale. But half - 7 out of 14 - have ratios between 55/45 and 65/35. When investors with similar needs feed similar data into similar mean-variance models, it's not surprising that the outputs tend to converge on similar portfolio mixes. Empirically, 60/40 seems to be a sweet spot, at least in the current period, with currently-anticipated returns for the various pieces. It's more complex than the Old 60/40 (of course), and more expensive to run (ditto), but it has excellent credentials from the best schools.

It's challenging to map these various policy portfolios onto a standard format. The institutions are very creative in describing their targets, using categories that don't necessarily jibe with their peers. So, some judgement calls were required. And we probably blew some of them. We understand that the framework of policy portfolios is constantly evolving, and for good reasons. A recent paper looks at this in some depth: https://www.imca.org/sites/default/files/current-issues/JIC/JIC172_LessonsFromUniversityEndowments.pdf One evolutionary trend is from "traditional" to "functional" or "strategic" categories in the policy portfolio. Here, we're using the traditional asset categories, but some funds (or their consultants) are gradually shifting to what is sometimes called a "functional" or "strategic" categorization. Here's a "Rosetta Stone" chart to show how traditional categories are mapped into strategic/functional categories. We're using the numbers derived from our review of current policy portfolios.
Policy Allocation Traditional
Policy Allocation Strategic/Functional
Equities 29% Growth 49% U.S Equities 10% U.S. Equities 10% Intl Equities 19% Intl Equities 19% Private Equity 20%
Fixed Income 11%
U.S. Fixed Income 9% --> Risk Reduction 35%
Global Fixed Income 2% Hedge Funds 24%
U.S. Fixed Income 9%
Alternatives 60% Global Fixed Income 2%
Hedge Funds 24%
Private Equity 20%
Inflation Protection 16%
Real Assets 16% Real Assets 16% ------------- -------------
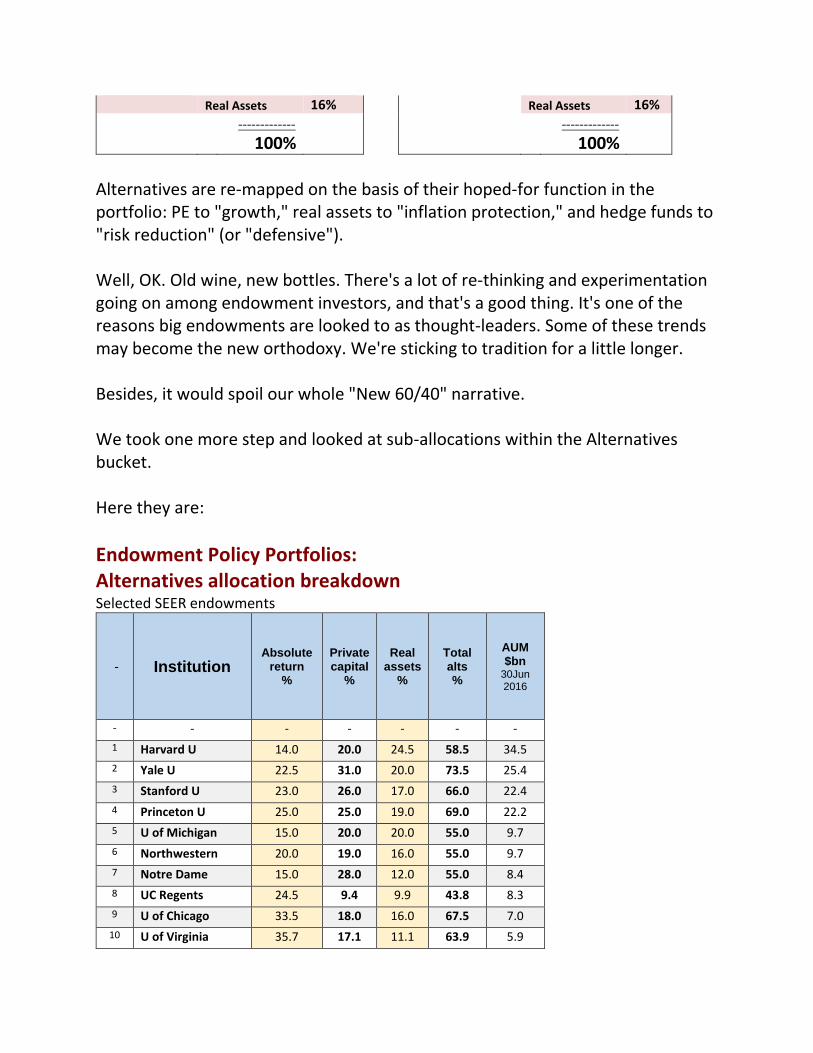
100% 100% Alternatives are re-mapped on the basis of their hoped-for function in the portfolio: PE to "growth," real assets to "inflation protection," and hedge funds to "risk reduction" (or "defensive"). Well, OK. Old wine, new bottles. There's a lot of re-thinking and experimentation going on among endowment investors, and that's a good thing. It's one of the reasons big endowments are looked to as thought-leaders. Some of these trends may become the new orthodoxy. We're sticking to tradition for a little longer. Besides, it would spoil our whole "New 60/40" narrative. We took one more step and looked at sub-allocations within the Alternatives bucket. Here they are:
Endowment Policy Portfolios: Alternatives allocation breakdown Selected SEER endowments
- Institution Absolute
return %
Private capital
%
Real assets
%
Total alts %
AUM $bn
30Jun 2016
- - - - - - -
1 Harvard U 14.0 20.0 24.5 58.5 34.5
2 Yale U 22.5 31.0 20.0 73.5 25.4
3 Stanford U 23.0 26.0 17.0 66.0 22.4
4 Princeton U 25.0 25.0 19.0 69.0 22.2
5 U of Michigan 15.0 20.0 20.0 55.0 9.7
6 Northwestern 20.0 19.0 16.0 55.0 9.7
7 Notre Dame 15.0 28.0 12.0 55.0 8.4
8 UC Regents 24.5 9.4 9.9 43.8 8.3
9 U of Chicago 33.5 18.0 16.0 67.5 7.0
10 U of Virginia 35.7 17.1 11.1 63.9 5.9

11 U of No Carolina 30.0 18.0 15.0 63.0 2.9
12 Rockefeller U 32.0 20.0 13.0 65.0 1.9
13 U of Illinois Fdn 32.0 10.0 12.0 54.0 1.5
14 Az State U Fdn 15.0 20.0 15.0 50.0 0.5
- - - - - - -
- Mean: 24 20 16 60 11
- Median 24 20 16 61 8
- SD 8 6 4 8 10
The typical ratio of Hedge Funds/Private Equity/Real Assets in policy portfolios is about 24/20/16. And, a glance at the standard deviations shows that the clustering is fairly tight. Using these numbers, we can conjure a generic New 60/40 to stand against the Old 60/40:
Historical 5-year returns for notional New 60/40 versus Old 60/40 (as of 30 June 2016)
New 60/40 Old 60/40
Asset Alts Totals 5yr Rtn
FY16 Asset
Pub Mrkts
5yr Rtn
FY16
- - - - - - - Absolute Rtn 24% - - - - -
Private Capital
20% - - - - -
Real Assets 16% - - - - -
Alts Total - 60% 6.7% Stocks 60% 12.1%
Publics - 40% 5.1% Bonds 40% 3.8%
Total - 100% 6.0% Total 100% 8.8%
We know that publics (typically, an 80/20 mix of world stocks and U.S. core bonds) earned about 5.1 percent in 2012-2016. And, the median return for all the SEER funds was 6.0 percent. So, we can back out a 6.7 percent return for the alternatives as a whole to make the books balance. (We're not going any further down the alts rabbit-hole today, and won't delve into iffy index returns for the sub-allocations or sub-sub-allocations. We just observe that a typical mix of alts has been earning about 6.7 annualized, overall.)

As we said, it's just a thought experiment to help us see what's going on. And what's going on is that the Old 60/40 still looks pretty vigorous today, a full year after we closed the books on fiscal 2016. (Although it's been a guilty pleasure for many investors, the Trump rally hasn't hurt.) It can be argued that the unexpected ascendancy of the Old 60/40 is just a historical curiosity, an artefact of a long U.S. bull market. The New 60/40, with its many cleverly-synchronized moving parts will surely serve institutions better over time. And, who knows? Some blend of bad luck, bad fiscal and monetary policy, or just tired bulls might finally crash the U.S. stock market one day soon and make the New 60/40 come out ahead in future 5-year matchups. Now, there's something to look forward to!
Part III
The OCIOs hold their own We identified 12 outsourced CIOs among the big endowments. It's too small a sample to let us make broad generalizations about OCIO performance, but we think it's still worth a look. Here's a breakout of how they did relative to each other and to the SEER list overall.
OCIO Performance Summary from SEER list
Rank 5yr Rtn OCIO Institution
AUM FY16 (000)
- - - - -
1 7.0 Investure Middlebury College $1,000,598
2 6.4 Strategic Inv Grp George Washington U $1,570,278
3 6.3 Cambridge Assocs U Arkansas Fdn $1,370,000
4 6.3 Investure Smith College $1,627,469
5 6.2 Mercer Syracuse U $1,156,828

6 6.1 Makena Washington & Lee U $1,472,485
7 5.9 PWP/Agility U of Colorado Fdn $1,062,664
8 5.7 Cornerstone Ptnrs DePauw U $614,568
9 4.6 Verger Capital Wake Forest U $1,141,211
10 4.6 Hirtle Callaghan Berea College $1,050,680
11 4.0 Commonfund Bucknell U $772,425
12 4.0 BlackRock Arizona State U Fdn $613,000
On a 5-year basis, Investure led by generating a very good 7 percent for my semi-alma mater, Middlebury College. Overall, the median OCIO returns were slightly lower than the SEER list generally: 5.8 versus 6.0 percent. Strategic Investment Group got the mandate at George Washington University at the very end of 2014. They were only on the job for 1.5 years out of the 5-year rating period, following some problems at the GWU investment office. We should also note that Berea College is an unusual (but admirable) institution which charges no tuition (although all students are assigned to on-campus jobs). Their heavy reliance on endowment payout has required that Hirtle Callaghan pursue a more conservative strategy, and, therefore accept more muted returns than they might otherwise have had. Our remarks above about peer-ranking vs. internal benchmarks also apply to OCIOs. Bucknell University chose not to hire another CIO to replace Christopher Brown, who left in late 2015. Instead they gave the mandate to Commonfund last year. And, here's some even later news: This month, Arizona State University Foundation replaced Agility/PWP with a less-traditional OCIO: BlackRock. It's been reported that Agility chose not to re-bid for the contract. That's another indicator that competition is tightening in the space. We report the new managers at Bucknell and ASU for the record, but in both cases the trailing 5-year returns must be attributed to the previous managers: the Bucknell investment office, and Agility, respectively.
--------------------------------------------------

Appendix 1: CIO Turnovers Our convention in the SEER return chart is to list the current chief investment officers (as of June, 2017). Turnover in these positions means that the incumbent may not have had much, or anything, to do with the trailing 5-year return. Anyone who's interested can check this chart to see whether the current CIO has just arrived, or been in the saddle for years.
SEER Top100 CIO chart: CIO Turnovers since 2014 - Institution 2014 2017
Open Position
- - - - -
1 Arizona State U Fdn (ex) Agility/PWP (OCIO)
BlackRock (OCIO) -
2 Bucknell U (ex) Brown, Christopher
Commonfund (OCIO)
Sep15-pres
3 Carleton College (ex) Matz, Jason (Open position) Nov16-
pres
4 Case Western Reserve U
(ex) Staley, Sally (Open position) Feb17-
pres
5 Columbia IMC (ex) Narvekar, Narv Holland, Peter -
6 Cornell U (ex) Edwards, A. J. Miranda, Ken -
7 Dartmouth U (Ex) Peedin, Pamela L.
Ruth, Alice A. -
8 Denison U (ex) Gorrilla, Adele Browne, Kathleen -
9 Geo Washington U (ex) Lindsey, Don Strat Inv Grp (OCIO) -
10 Harvard Management Co
(ex) Mendillo, Jane Narvekar, Narv -
11 Johns Hopkins U (ex) Crecelius, Kathryn J.
Perlioni, Jason -
12 Lehigh U (ex) Gilbert, Peter Agatone, Kristin -
13 Macalester College (ex) Tosh, Adam Martin, Gary -
14 Purdue Research Fdn (ex) Seidle, Scott Cooper, David -
15 Southern Methodist (ex) Condon, Michael
Dahiya, Rakesh -
16 Texas A&M Fdn (ex) Handley, Janet A.
(Open position) Jan17-pres
17 Trinity U (Tx) (ex) Logan, Gary L. Hitchell, Dan -
18 U of Oklahoma Fdn (ex) Stewart, Ben Johnson, Brad -
19 U of Toronto AM (ex) Moriarty, William
Smith, Daren M. -

20 U of Washington INCO
(Ex) Walker, Kimberly
(Open position) Dec16-
pres
21 UTIMCO (ex) Zimmerman, Bruce
Harris, T.B. "Britt" IV
-
Appendix 2: Estimated returns In about 18 cases, we have estimated the 5-year trailing returns on our SEER chart, rather than using official returns as stated by the respective institutions. Estimates are clearly marked as such and should not be interpreted or reported as officially-sanctioned numbers. We're not disclosing our methodology in detail at this time. It is not the Dietz method, although it's a distant cousin in that it uses standard accounting numbers to generate an estimate of a CFA-style "time-weighted" return. We've back-tested this method with funds for which we do have official numbers and are satisfied that it's reliable enough for our purposes. Variances from actual 5-year returns seem to behave like ordinary, normally-distributed random variables. We've standardized our method so that the mean variance is close to zero, and we get a standard deviation of about 0.2 percent (20 bps). If our math is right, then about two-thirds of estimates should lie within 20 bps - plus or minus - of the true values. And, about 95 percent should lie within plus or minus 40 bps. Outliers with larger variances are possible. We apologize in advance for any egregious errors and promise to quickly and semi-cheerfully correct any that are brought to our attention.
--------------------------------------------------
The Skorina Letter Each issue explores how the world's most accomplished asset managers think and invest. Original content includes profiles and interviews with industry veterans and research on compensation and investment performance.

Our insights and commentary come from our clients - board members, CEOs, chief investment officers - and the global investment community within which we work as executive search professionals. Institutional investors operate at the crossroads of capital, talent, and ideas, shepherding over seventy trillion dollars in global assets. It's a constantly evolving spectacle and The Skorina Letter gives readers a ringside seat. Prior issues can be found in "archives" on our website, http://www.charlesskorina.com/