The SKF Group Nine-month result, 2005 Tom Johnstone, President and CEO.
24
-
Upload
basil-mcdowell -
Category
Documents
-
view
221 -
download
0
Transcript of The SKF Group Nine-month result, 2005 Tom Johnstone, President and CEO.

The SKF GroupNine-month result, 2005
Tom Johnstone, President and CEO

3
MSEK 2005 2004
Net sales 12 027 11 184
Operating profit 1 454 1 189
Operating margin 12.1% 10.6%
Profit before taxes 1 409 1 110
Net profit 974 729
Earnings per share, SEK 2.09 1.43
Cash flow after investments before
financing 1 495 516
Third quarter 2005

4
MSEK 2005 2004
Net sales 36 637 33 290
Operating profit 4 025 3 251
Operating margin 11.0% 9.8%
Profit before taxes 3 852 2 974
Net profit 2 658 2 131
Earnings per share, SEK 5.69 4.23
Cash flow after investments before
financing
1 901* 1 610
Nine-month result 2005
* MSEK 2 366 before the acquisitions and the purchase of minority shareholding in previously acquired companies.

5 Areas in focus 2005 Performance Q3 2005
• Operating margin level
Maintain a positive price/mix
Recovery of raw material cost increase
• Continued sales growth
Maintain organic growth pace
Structure (mainly Ovako)
• Strengthen the platform/segment offer
• Cash flow before financingand acquisitions
2.1%
Ongoing
7.2%
-2.9%
Ongoing
MSEK 1 495
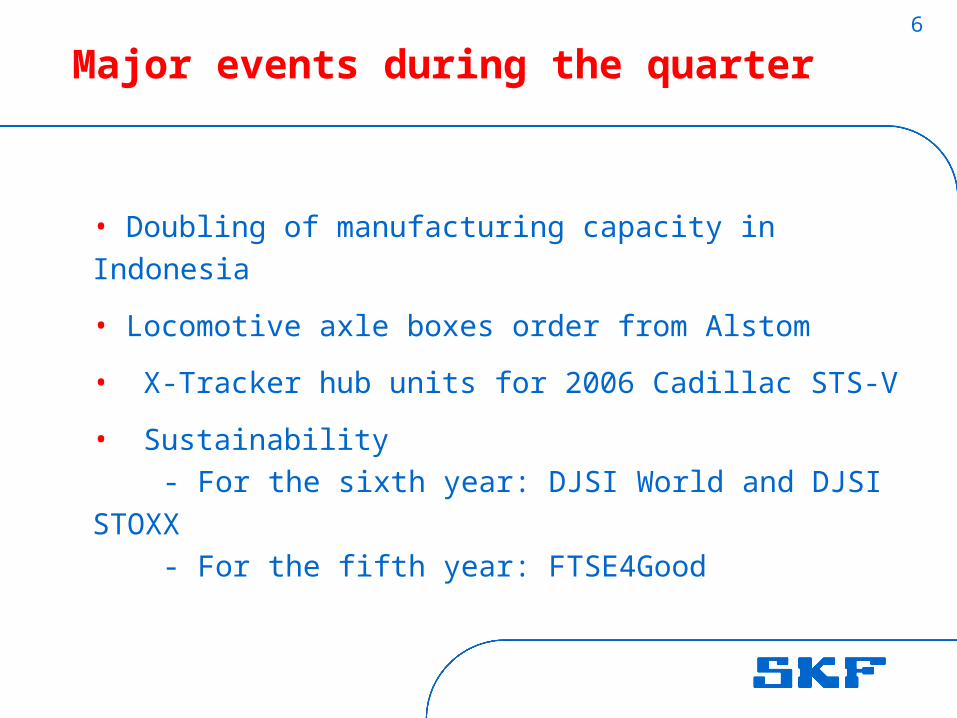
6
Major events during the quarter
• Doubling of manufacturing capacity in Indonesia
• Locomotive axle boxes order from Alstom
• X-Tracker hub units for 2006 Cadillac STS-V
• Sustainability - For the sixth year: DJSI World and DJSI STOXX - For the fifth year: FTSE4Good
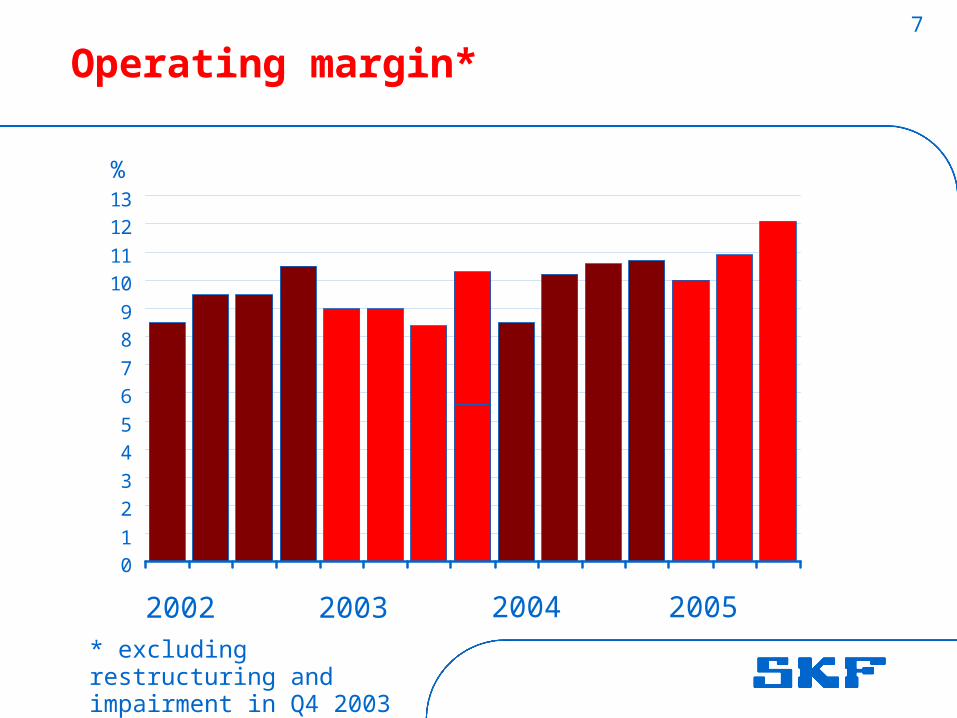
7
Operating margin*
%
2002 2003 2004
0
1
2
3
4
5
6
7
8
9
10
11
12
13
* excluding restructuring and impairment in Q4 2003
2005
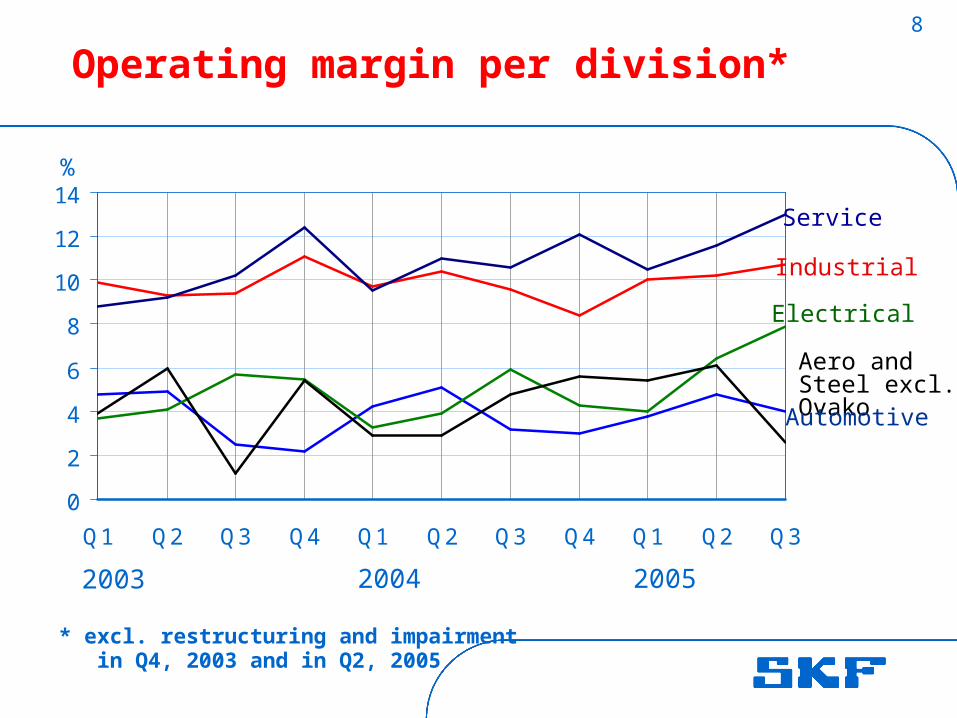
8
0
2
4
6
8
10
12
14
Q1 Q2 Q3 Q4 Q1 Q2 Q3 Q4 Q1 Q2 Q3
Operating margin per division*
Industrial
Service
Aero and Steel excl. Ovako
Electrical
Automotive
%
2003 2004
* excl. restructuring and impairment in Q4, 2003 and in Q2, 2005
2005
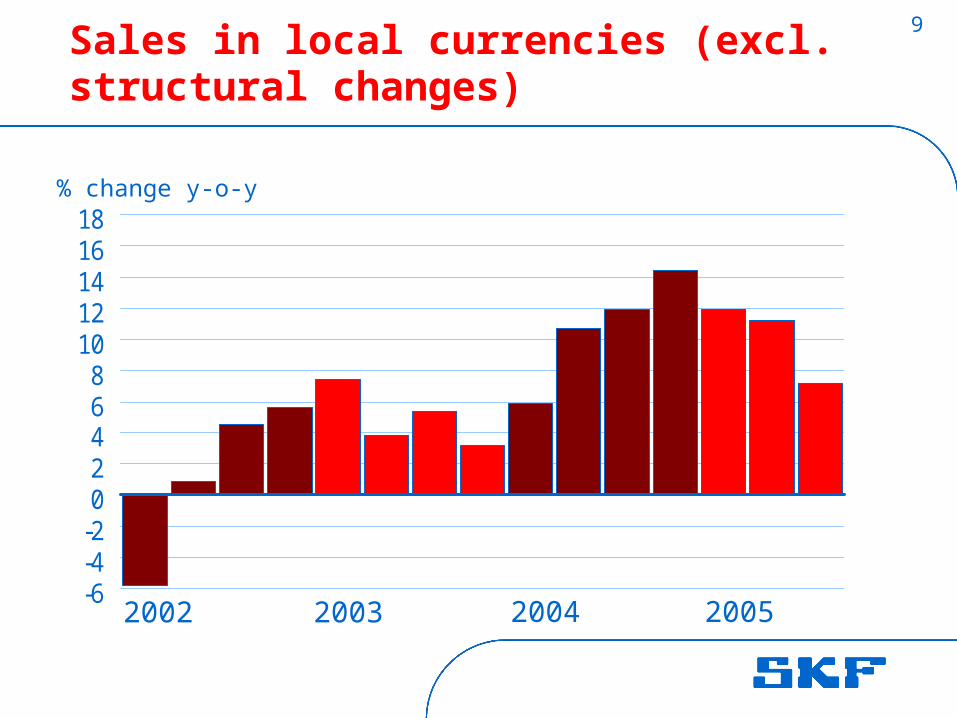
9Sales in local currencies (excl. structural changes)
-6-4-202468
1012141618
% change y-o-y
2002 2003 2004 2005
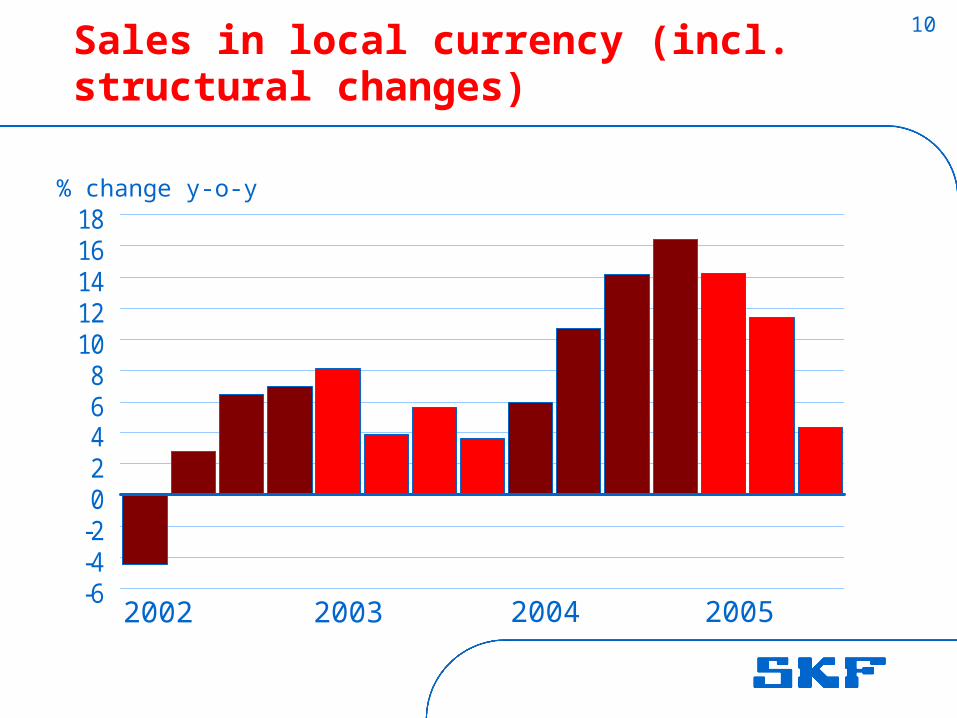
10Sales in local currency (incl. structural changes)
-6-4-202468
1012141618
% change y-o-y
2002 2003 2004 2005
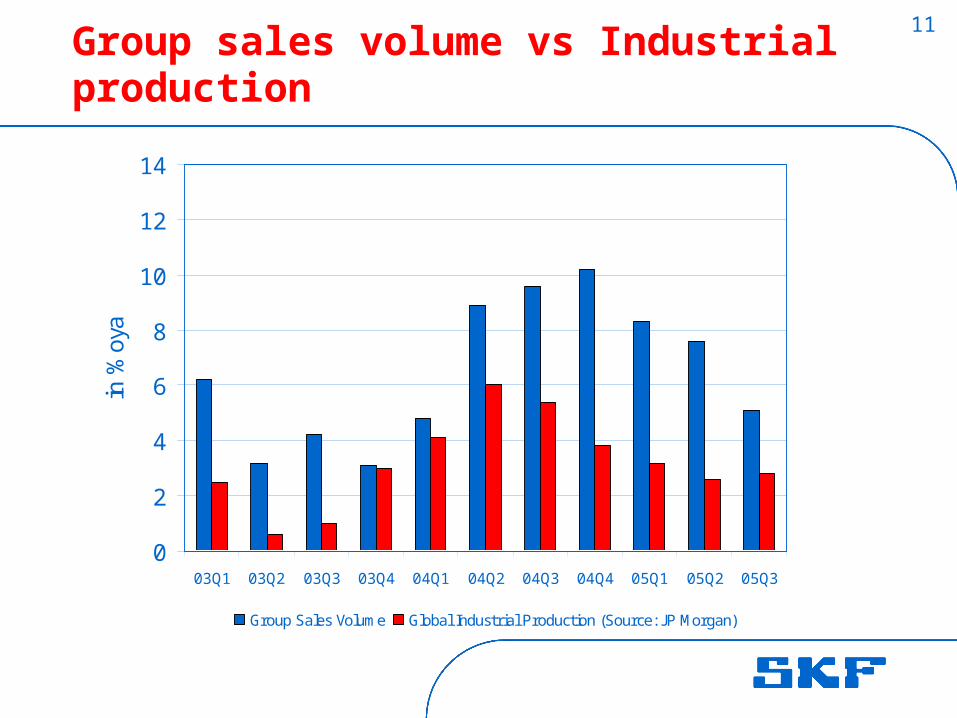
11Group sales volume vs Industrial production
0
2
4
6
8
10
12
14
03Q1 03Q2 03Q3 03Q4 04Q1 04Q2 04Q3 04Q4 05Q1 05Q2 05Q3
in %
oya
Group Sales Volume Global Industrial Production (Source: JP Morgan)

12
Growth development / local currency6% annual growth rate (whereof 4% organic)
% Y-o-Y
0
2
4
6
8
10
12
2002 2003 2004 2005
Acquisitions / Divestments
Organic growth
Up to September
(Organic 9.9, Net acq/div -0,2)
3.0
9.7
5.2
11.8
13
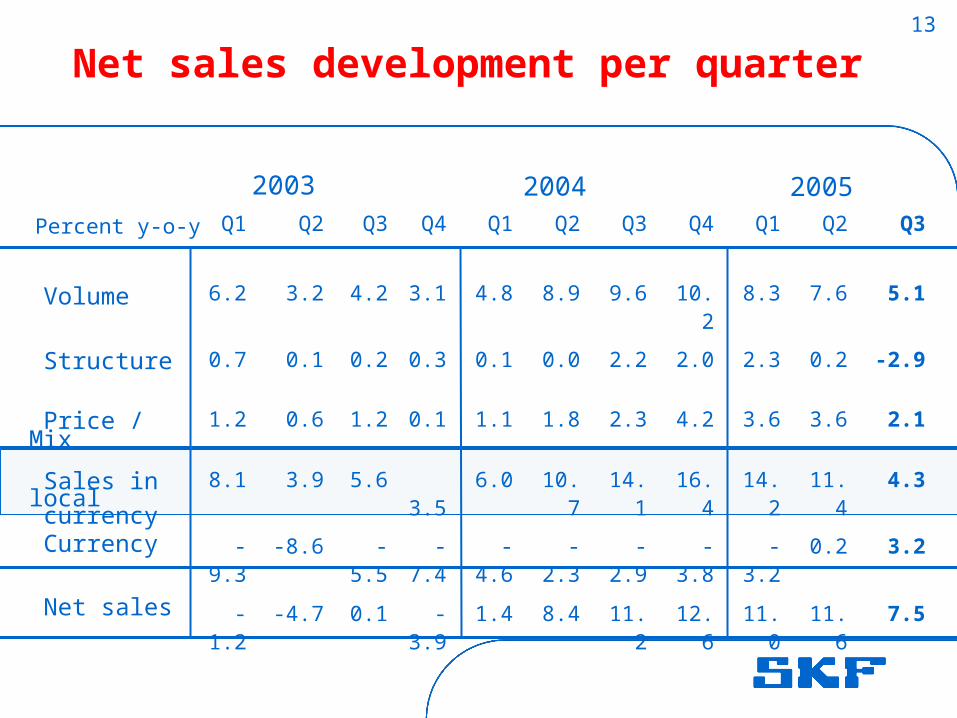
Net sales development per quarter
Q1 Q2 Q3 Q4 Q1 Q2 Q3 Q4 Q1 Q2 Q3
6.2 3.2 4.2 3.1 4.8 8.9 9.6 10.2 8.3 7.6 5.1
0.7 0.1 0.2 0.3 0.1 0.0 2.2 2.0 2.3 0.2 -2.9
1.2 0.6 1.2 0.1 1.1 1.8 2.3 4.2 3.6 3.6 2.1
8.1 3.9 5.6 3.5
6.0 10.7 14.1 16.4 14.2 11.4 4.3
-9.3 -8.6 -5.5 -7.4
-4.6 -2.3 -2.9 -3.8 -3.2 0.2 3.2
-1.2 -4.7 0.1 -3.9
1.4 8.4 11.2 12.6 11.0 11.6 7.5
Percent y-o-y
2003 2004
Volume
Structure
Price / Mix
Sales in local currency Currency
Net sales
2005
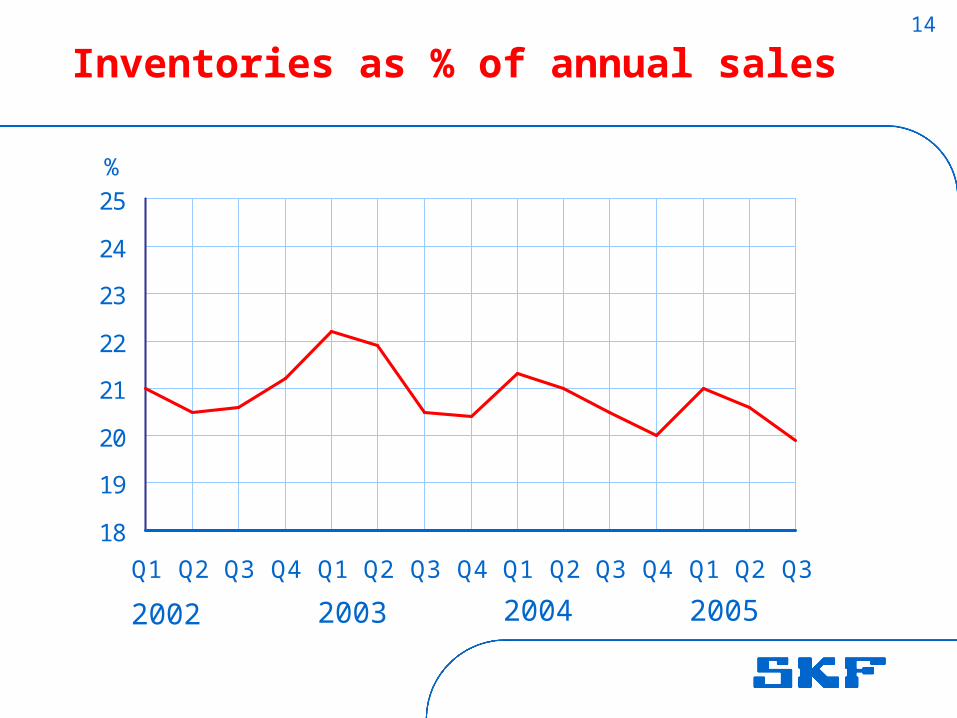
14
Inventories as % of annual sales
%
2002 2003 2004
18
19
20
21
22
23
24
25
Q1 Q2 Q3 Q4 Q1 Q2 Q3 Q4 Q1 Q2 Q3 Q4 Q1 Q2 Q3
2005
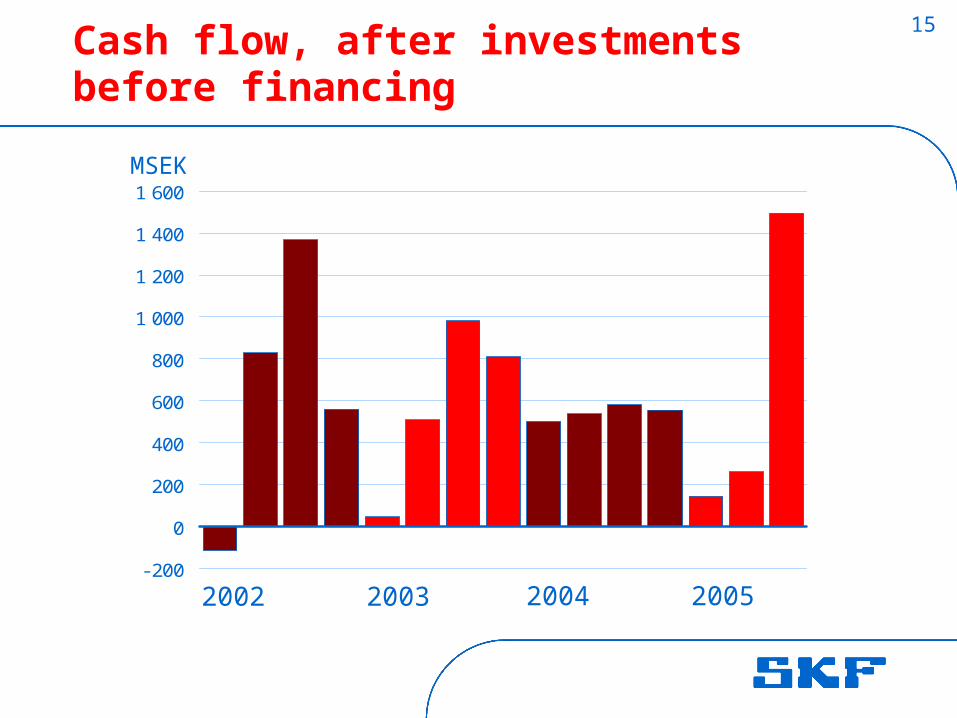
15Cash flow, after investments before financing
-200
0
200
400
600
800
1 000
1 200
1 400
1 600MSEK
2002 2003 2004 2005
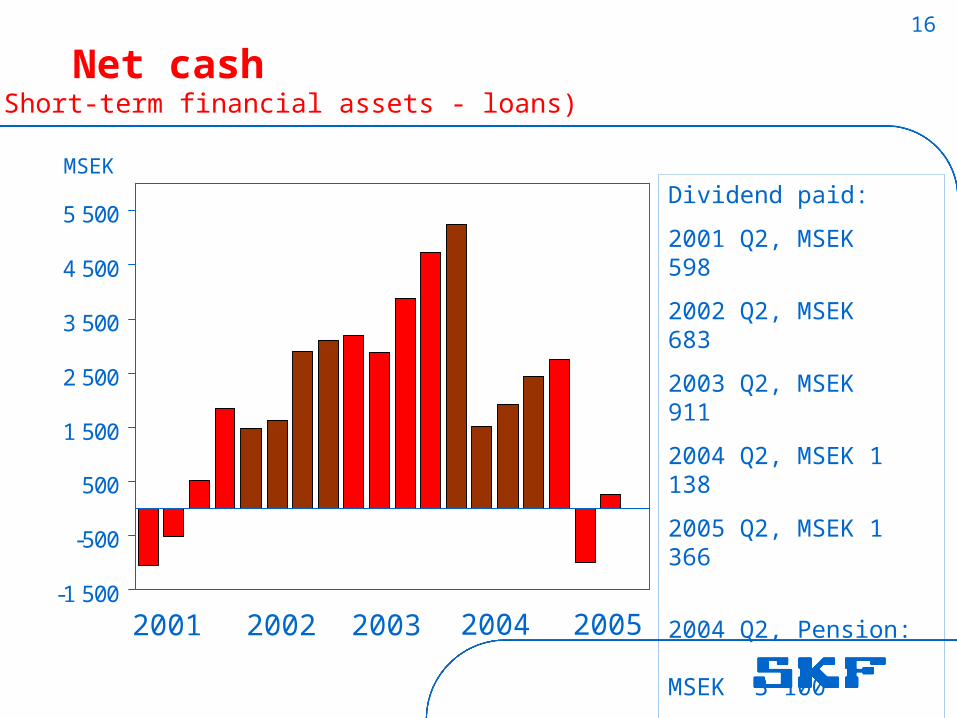
16
Net cash
-1 500
-500
500
1 500
2 500
3 500
4 500
5 500
MSEK
2001 2002 2003
Dividend paid:
2001 Q2, MSEK 598
2002 Q2, MSEK 683
2003 Q2, MSEK 911
2004 Q2, MSEK 1 138
2005 Q2, MSEK 1 366
2004 Q2, Pension: MSEK 3 100
2005 Q2, Redemption, MSEK 2 846
2004
(Short-term financial assets - loans)
2005

17
Net interest bearing liabilities
-6 000
-5 000
-4 000
-3 000
-2 000
-1 000
0
1 000
Q1 Q2 Q3 Q4 Q1 Q2 Q3 Q4 Q1 Q2 Q3
MSEK
(Short-term financial assets - loans - net postemployment benefits)
2003 2004 2005
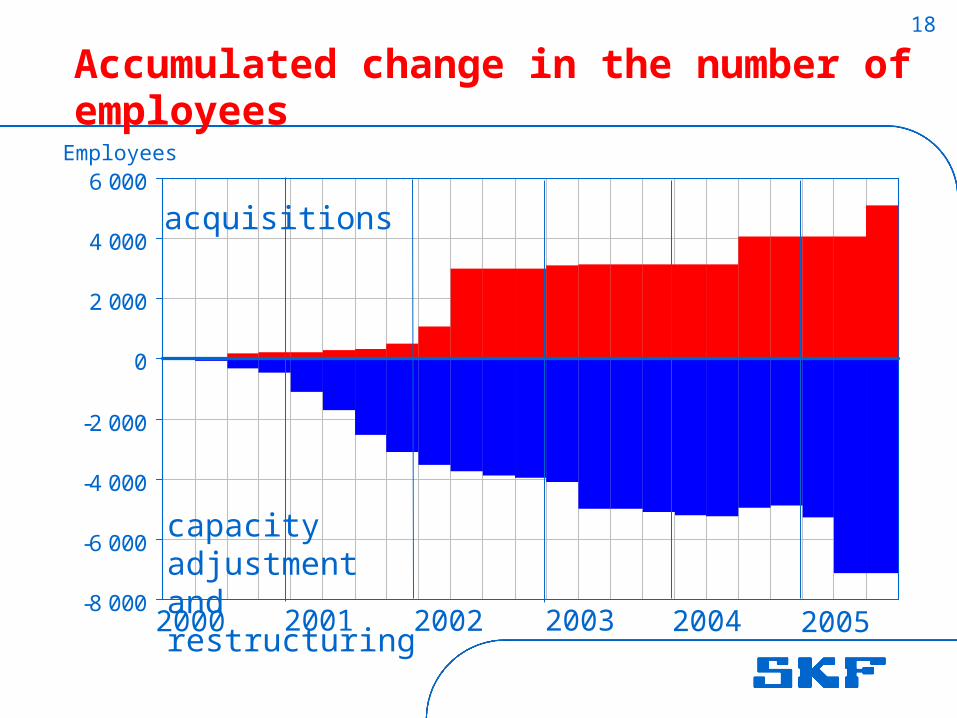
18
-8 000
-6 000
-4 000
-2 000
0
2 000
4 000
6 000
2000 2001
Accumulated change in the number of employees
2002
acquisitions
capacity adjustmentand restructuring
Employees
2003 2004 2005

19
Fixed assets / Sales
20
22
24
26
28
30
32
34
36
38
40
98 99 00 01 02 03 04 05
%%
Up to September

20
SKF Group targets
• 10% Operating margin level
• 6% Growth per annum
• 20% ROCE
• 18% Inventory / sales
2006
2007
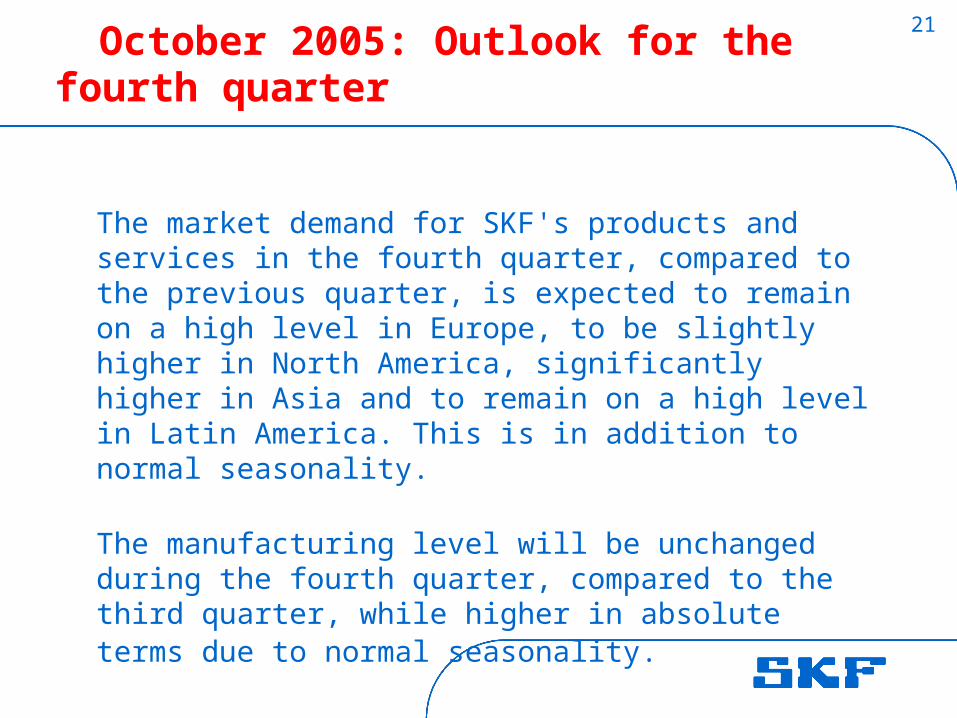
21 October 2005: Outlook for the fourth quarter
The market demand for SKF's products and services in the fourth quarter, compared to the previous quarter, is expected to remain on a high level in Europe, to be slightly higher in North America, significantly higher in Asia and to remain on a high level in Latin America. This is in addition to normal seasonality.
The manufacturing level will be unchanged during the fourth quarter, compared to the third quarter, while higher in absolute terms due to normal seasonality.
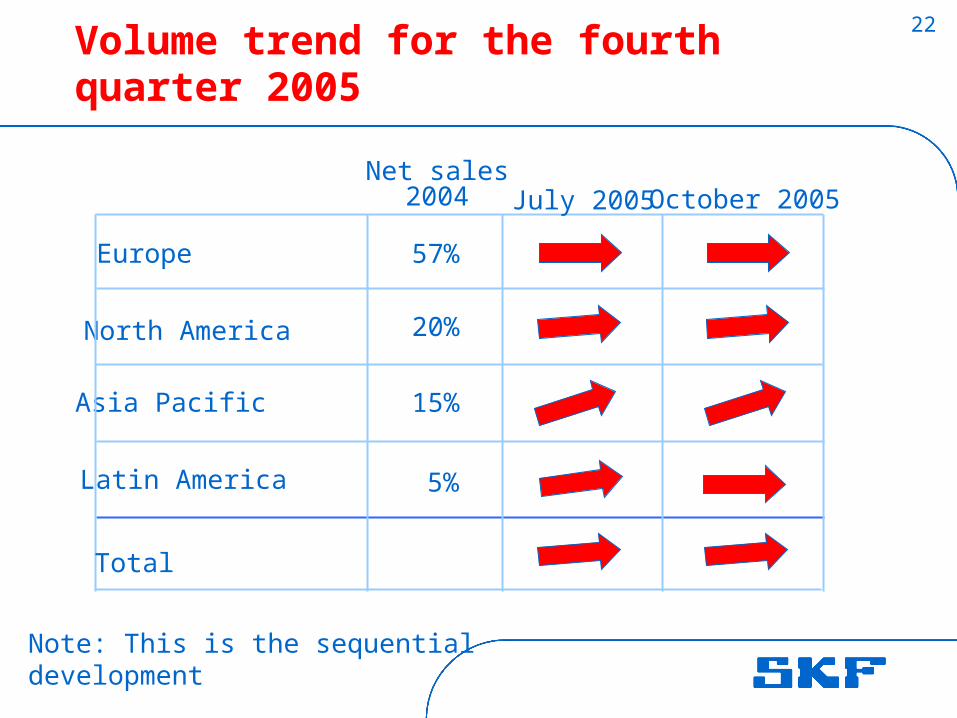
22Volume trend for the fourth quarter 2005
Europe 57%
20%
15%
5%
North America
Asia Pacific
Latin America
Net sales 2004 October 2005
Total
July 2005
Note: This is the sequentialdevelopment

23
Cautionary statement
This report contains forward-looking statements that are based on the current expectations of the management of SKF.
Although management believes that the expectations reflected in such forward-looking statements are reasonable, no assurance can be given that such expectations will prove to have been correct. Accordingly, results could differ materially from those implied in the forward-looking statements as a result of, among other factors, changes in economic, market and competitive conditions, changes in the regulatory environment and other government actions, fluctuations in exchange rates and other factors mentioned in SKF's latest 20-F report on file with the SEC (United States Securities and Exchange Commission) under "Forward-Looking Statements" and "Risk Factors".