The Size and Composition of the European Third Sector · Wolontariat W Organizacjach I Inne Formy...
46
49 © e Author(s) 2018 B. Enjolras et al., e ird Sector As A Renewable Resource for Europe, https://doi.org/10.1007/978-3-319-71473-8_3 3 The Size and Composition of the European Third Sector Lester M. Salamon and Wojciech Sokolowski Armed with this conceptualization of the third or social-economy (TSE) sector we are now in a position to estimate its dimensions and contours. But which dimensions can provide the most relevant description of this sector? Conventional economic measures, such as the monetary value of the sector’s contribution to the national economy (the so-called Gross Value Added or GVA), may not be the best measure because a very sub- stantial part of the TSE sector’s contribution to economy and society is provided at below market prices or free of charge and relies on unpaid volunteer labor. Likewise, the number of organizations, another measure widely used in popular accounts, is also misleading due to vast differences in the size of organizations. A sector with a relatively small number of large or mid-sized organizations can carry more weight than one with many very small organizations, yet simple counts of organizations may disguise this. What is more, existing listings of organizations are notori- ously unreliable because they tend not to be updated and fail to delete defunct organizations in a regular way. L. M. Salamon (*) • W. Sokolowski John Hopkins University, Baltimore, MD, USA e-mail: [email protected]
Transcript of The Size and Composition of the European Third Sector · Wolontariat W Organizacjach I Inne Formy...
49© The Author(s) 2018B. Enjolras et al., The Third Sector As A Renewable Resource for Europe, https://doi.org/10.1007/978-3-319-71473-8_3
3The Size and Composition
of the European Third Sector
Lester M. Salamon and Wojciech Sokolowski
Armed with this conceptualization of the third or social-economy (TSE) sector we are now in a position to estimate its dimensions and contours. But which dimensions can provide the most relevant description of this sector? Conventional economic measures, such as the monetary value of the sector’s contribution to the national economy (the so-called Gross Value Added or GVA), may not be the best measure because a very sub-stantial part of the TSE sector’s contribution to economy and society is provided at below market prices or free of charge and relies on unpaid volunteer labor. Likewise, the number of organizations, another measure widely used in popular accounts, is also misleading due to vast differences in the size of organizations. A sector with a relatively small number of large or mid-sized organizations can carry more weight than one with many very small organizations, yet simple counts of organizations may disguise this. What is more, existing listings of organizations are notori-ously unreliable because they tend not to be updated and fail to delete defunct organizations in a regular way.
L. M. Salamon (*) • W. SokolowskiJohn Hopkins University, Baltimore, MD, USAe-mail: [email protected]
50
Previous research (Salamon et al. 2004) has identified the following five dimensions as more revealing of important dimensions of the third sector and as providing the most useful basis in terms of which to compare a country’s TSE sector to its counterparts in different countries and to other segments of its own society and economy:
1. Workforce size, both paid and volunteer. For reasons cited earlier, this variable provides a better measure of the level of activity that this sector accounts for than does the economic value of its output. Because such entities often engage part-time workers as well as full-time ones, simple headcounts can be misleading. Accordingly, this variable has to be mea-sured in FTE terms, that is, a person working half time for a third sec-tor organization (TSO) would be counted as one-half of an FTE worker. Similarly, a volunteer who works on average eight hours a week each week of the year would count as 1/5th of a full-time worker.1
2. Workforce composition. Unlike the business or government sectors, the TSE relies extensively on both volunteer and paid employment. Therefore, it is important to generate information on both forms of labor, and to be able to differentiate between the two. What is more, it is important to measure both volunteer work that is channeled through organizations and that provided directly to other individuals. This is so because in some countries organizations with paid staff are rare, but robust third sectors heavily reliant on volunteers may still be present and highly active.
3. TSE sector activities, which can be most conveniently measured by the shares of the TSE sector workforce in different activity fields. To facili-tate comparison between TSE activities and those of the other sectors, we have used classification structures that have been developed to por-tray the composition of the other sectors as well.
4. TSE Sector revenue sources. TSE sector organizations receive their rev-enue from three kinds of major sources: government payments
1 Since volunteers and some paid workers work part-time or episodically, we converted all employ-ment data into FTE workers. This was done by dividing the total hours of paid or volunteer work in a given reference year by the number of hours considered to represent “full-time work,” which we assume to be on average 1760 hours. This number varies from country to country and it is generally lower in high-income countries of Western Europe than in medium-income countries of Eastern Europe.
L. M. Salamon and W. Sokolowski

51
(including grants, contracts and reimbursements for services rendered to eligible parties); market sales of goods and services and member-ship dues paid by private parties; and philanthropic donations from private individuals, foundations and corporations. Unfortunately, existing international statistical systems, such as the System of National Accounts, obscure these different revenue streams by treat-ing government grants along with philanthropy as transfers, and gov-ernment contracts and vouchers as market sales.2 Accordingly, great care must be taken to adjust the data to clearly reflect these three dis-tinct sources;
5. TSE sector institutional composition. As noted in Chap. 2, the TSE sec-tor as currently conceived includes at least four distinguishable com-ponents: in-scope NPIs, cooperatives and mutuals, social enterprises and direct volunteering, that is, volunteering not mediated by organi-zations.3 As will become clear below, however, these are not wholly distinct categories, since some cooperatives, mutuals and social enter-prises are also NPIs. This requires some careful adjustments to avoid double counting, since some data sources are not clear about this.
6. The average annual growth of the TSE active workforce, including both paid and volunteer workers, and its comparison to the growth of over-all employment in the economy.
In developing the measures of these five dimensions of the TSE in the European Union and Norway, we utilize the following data sources:
1. A comprehensive study of nonprofit institutions in over 40 countries, including 20 European countries, carried out under the auspices of the Johns Hopkins University Comparative Non-Profit Sector Project (CNP)4;
2 Salamon, Lester M., S. Wojciech Sokolowski, and Associates. (2004). Global Civil Society: Dimensions of the Nonprofit Sector, Volume Two. Bloomfield: Kumarian Press.3 Volunteer work carried out through organizations is also included, but its full-time equivalent amount is included in the count of NPI workers and those cooperatives and mutuals that are also NPIs.4 For a description of this project and its methodology, see Salamon et al. 2004. For an analysis of its results in the light of prevailing theories, see Salamon et al. 2017.
The Size and Composition of the European Third Sector
52
2. A report on the social economy in the European Union prepared by the International Centre of Research and Information on the Public, Social and Cooperative Economy (CIRIEC)5;
3. Nonprofit Institution Satellite Accounts and similar reports issued by the statistical agencies of Belgium, Czech Republic, Italy, Norway, Poland, Portugal and Sweden;
4. Time Use Surveys (TUSs) and other surveys in several European countries.6
It must be noted, however, that the estimates of the size and contours of the European TSE sector offered here are necessarily highly prelimi-nary. This is so because the data available on the key components of this sector remain grossly incomplete and, even where available, seriously out
5 José Luis Monzón Campos and Rafael Chaves Ávila, The Social Economy In The European Union, Brussels: European Economic and Social Committee, 2012. An update of this report was prepared in preliminary form and presented to the European Economic and Social Committee in June of 2017, but a final report with final estimates was not available as of the time this volume went into production. Based on the preliminary data, however, the basic estimates presented here would only be marginally affected by the updated estimates.6 Included here are the following sources: Miranda, V. (2011), “Cooking, Caring and Volunteering: Unpaid Work Around the World,” OECD Social, Employment and Migration Working Papers, No. 116, OECD Publishing. doi: 10.1787/5kghrjm8s142en; Erstellt vom Institut für inter-disziplinäre Nonprofit Forschung an der Wirtschaftsuniversität Wien (NPO-Institut), Freiwilliges engagement in österreich, Wien, 2009, http://www.bmask.gv.at; Główny Urząd Statystyczny, Wolontariat W Organizacjach I Inne Formy Pracy Niezarobkowej Poza Gospodarstwem Domowym—2011 (Volunteering Through Organizations And Other Types Of Unpaid Work Outside Own Household—2011, Warszawa, 2012; Pennerstorfer, A., Schneider, U. & Badelt, C. in: Simsa, R., Meyer, M. & Badelt, C.: (Hg.): Handbuch der Nonprofit-Organisation. Stuttgart 2013 (5. überarbeitete Auflage); oje, T. P., Fridberg, T., & Ibsen, B. (2006). Den frivillige sektor i Danmark. Omfang og betydning (Rapport 06:19). København: Socialforskningsinstituttet. Retrieved from: http://www.sfi.dk/Admin/Public/DWSDownload.aspx?File=%2fFiles%2fFiler%2fSFI%2fPdf%2fRapporter%2f2006%2f0619_Den_frivillige_sektor.pdf; Kaminski, P. (2005). Table1. The NPS in France, 2002 (version INSEE). Le compte des Institutions Sans But Lucratif (ISBL) en France (Année 2002). Paris: l’Institut National de la Statistique et des Études Économiques (INSEE); Nagy, R., & Sebestény, I. (2009). Table A 10 in Methodological Practice and Practical Methodology: Fifteen Years in Nonprofit Statistics (Hungarian Statistical Review Special Number 12). Budapest: Hungarian Central Statistical Office. Retrieved from: http://www.ksh.hu/statreview; ISTAT. (2014). Nonprofit institution profile based on 2011 census results. Rome: Istituto nazionale di statistica. Retrieved from: http://www.istat.it/en/files/2014/10/Nonprofit-Institution-Profile-based-on-2011-Census-results_EN_definitivo.pdf?title=Nonprofit+institutions+profile+-+9+Oct+2014+-+Full+text.pdf;
L. M. Salamon and W. Sokolowski

53
of date. Although a special Handbook on Nonprofit Institutions in the System of National Accounts was issued by the United Nations Statistical Division in 2003, only six EU countries plus Norway have seen fit to implement this Handbook. Similarly, while the Statistics Department of the International Labour Organization issued a Manual on the Measurement of Volunteer Work in 2011, only three countries in Europe have implemented it, leaving us dependent on TUS data that covers only 18 of the 27 EU countries. The Johns Hopkins Comparative Nonprofit Sector Project generated solid data on nonprofit institutions in 20 of the 27 EU countries, but these data were collected between the mid-1990s and the 2000s and have been updated for only a handful of the countries since then, making it necessary to rely on inevitably imperfect methods for “aging” the data. Systematic data on social enterprises are available on only a handful of countries, and even these use widely different defini-tions, and the data available on cooperatives make it difficult to deter-mine what share meet the in-scope criteria for inclusion in the third sector and also what share are actually recorded as nonprofit institutions in various data sources.
Fortunately, a revised version of the UN NPI Handbook has been developed and is available for implementation. This Satellite Account on Nonprofit and Related Institutions and Volunteer Work adheres closely to the definition of the TSE sector offered in this report and therefore offers the hope of generating more reliable data on the European third sector than is currently available. But it remains to be seen whether European statistical and policy officials will support implementation of this impor-tant new piece of statistical machinery.
While preliminary, however, the data presented here offer a solid first approximation of the scale and contours of the European TSE sector carefully defined in operational terms consistent with official national accounts concepts and based on the best data and estimating techniques available. For a detailed description of the various data sources and esti-mating procedures used, see Annex B.
To present these estimates, the balance of this chapter falls into three sections. In the section that follows, we report our estimates of the aggre-gate dimensions of the TSE sector in 28 EU countries and Norway. In
The Size and Composition of the European Third Sector

54
the second section, we examine regional variations in the scale and com-position of the TSE sector to the extent permitted by the data. These latter findings, in turn, pose the puzzle that the final section of this chap-ter will seek to unravel.
1 The Contours of the European TSE Sector: The Aggregate View
1.1 An Enormous Economic Engine
Perhaps the major aggregate finding that has emerged from the data examined here is that, contrary to many popular assumptions, the European TSE sector is an enormous economic force, outdistancing most major industries in the scale of its workforce. Taken together, as of 2014, the latest date for which data are available, the European TSE sector engages an estimated 29.1 million FTE workers (paid and volunteer) in the 28 EU countries and Norway. The European TSE sector thus accounts for slightly more than 13 percent of the European workforce. This is sig-nificant because any industry that accounts for 5 percent of the employ-ment of a country is considered to be a major industry. What is more, in the fields in which they operate, the TSE sector turns out to account for an even larger employment share.
Put somewhat differently, with over 29 million FTE workers, the European TSE sector has the third largest “workforce” of any industry in Europe, trailing only trade and manufacturing, but outdistancing the construction and transportation industries by 2:1, and the financial ser-vices industry by nearly 5:1 (see Fig. 3.1).
1.2 Volunteer Engagement
A second striking characteristic of the European TSE Sector is its engage-ment of volunteers in addition to paid employees. In fact, of the over 29 million FTE workers in the TSE sector in Europe, 55 percent—a total of
L. M. Salamon and W. Sokolowski

55
16 million FTE workers—are volunteers (Fig. 3.2). This means that the European TSE sector employs more FTE volunteer workers than there are FTE workers of any sort employed in any major European industry but trade and manufacturing.
Manufacturing 32,0
Trade 30,7
Third Sector 29,1
Construc�on 14,4
Transporta�on 13,1
Accommoda�on and food 12,5
Informa�on and communica�on 6,6
Finance and insurance 6,1
Real estate
0,0 5,0 10,0 15,0 20,0 25,0 30,0 35,0millions of FTE workers
Fig. 3.1 Size of the European TSE workforce versus employment in major indus-tries in 29 European countries, 2014
Paidemployees;
45%Volunteers;
55%
N=29.1 million FTE workers
Fig. 3.2 Composition of European TSE workforce, FTE Paid versus Volunteer Workers in 29 European countries, 2014
The Size and Composition of the European Third Sector

56
Of these 16 million FTE volunteer workers, nearly 7 million work through nonprofit organizations and the balance, roughly 9.0 million FTE volunteer workers, volunteer directly to help friends and neighbors outside of their own households or families. Clearly, this ability to mobilize a veritable army of volunteers is another potent measure of the reach and power of the TSE sector.
1.3 What does the European TSE Sector Do?
Not only are TSE sector organizations important in economic terms, but they are also important socially, politically and culturally. Indeed, third sector actors perform a multitude of social functions. For one thing, they are service providers, delivering significant shares of such services as health care, education, environmental protection, disaster relief and eco-nomic development promotion. Beyond this, however, they function as policy advocates, as promoters of a sense of community, as guardians of a crucial value emphasizing the importance of individual initiative for the common good and as vehicles for giving expression to a host of interests and values—whether religious, ethnic, social, cultural, racial, professional or gender-related (Salamon 2014a, b).
To gain some insight into the activities and functions that the European TSE sector performs, we classified the activities of the TSE sector workforce into three major categories: service, expressive and other functions.7 The service function entails activities in education, social services, health care and housing and community development. Direct volunteer action, which by definition involves help to other households, is considered a service activity in this report. The expressive function comprises activities in culture and recreation, membership organizations—including labor unions—business and professional organizations, environmental organizations and religious congrega-tions. Finally, the other function includes activities of charitable foun-dations, international organizations, as well as activities not elsewhere classified. Given the limitations of the existing data, more detailed
7 See Appendix 1 for the methodology used in this estimation.
L. M. Salamon and W. Sokolowski

57
classification of TSE sector activity by industry is not possible at this time. As Fig. 3.3 shows, we estimate that the overwhelming majority (72 percent) of TSE sector workforce activity is devoted to the service functions of the sector. At the same time, a substantial 24 percent of the activity goes into expressive functions.
1.4 Revenue Structure
The revenue structure of the civil society sector differs markedly from what many observers tend to believe. While charitable giving attracts the most public and media attention, it turns out to account for a relatively small share of TSE sector revenue. Thus, as shown in Fig. 3.4, taken all together, charitable contributions—from individuals, foundations and corporations—account on average for only about 9 percent of overall TSE sector revenue in Europe. By contrast, private fee income, which includes private payments for goods and services, membership dues and investment income, accounts for a much larger 54 percent of income on average. Finally, government support, which includes grants, contracts and
Other; 4%
Expressive; 24%
Service; 72%
N=29.1 million FTE workersMay not add to 100% due to rounding
Fig. 3.3 European TSE sector workforce activity, by function in 29 countries, 2014
The Size and Composition of the European Third Sector

58
reimbursements for services rendered to eligible private parties in such fields as health care or education, make up the balance of about 37 per-cent of TSE sector revenue.8
1.5 Institutional Structure
The final dimension of the European TSE sector that deserves attention is its institutional structure. As previously noted, this includes four ele-ments: NPIs, cooperatives and mutual societies, social enterprises and all direct volunteer activities.9
8 These estimates do not include any payments for direct volunteer action, which, if any, we assume to be insignificant. We furthermore assume that all income of cooperatives and mutual societies and social enterprises comes from market activities, and thus is considered to be fee income. Unfortunately, the data do not permit us to estimate the monetary values of these revenue streams at this time. For more information about this estimation methodology, see Annex 1.9 As previously noted, organization-based volunteering is treated here as an attribute of the organi-zations through which this work is mediated.
Privatephilanthropy;
9%
Government;37%
Private feesand sales; 54%
Excluding direct volunteer ac�on
Fig. 3.4 European TSE sector revenue structure in 29 countries, 2014
L. M. Salamon and W. Sokolowski
59
Several complications attend the separate depictions of these four components, however. For one thing, some cooperatives and mutuals are subject to a full nondistribution of profit constraint and thus are considered to be NPIs. Based on data available in at least one European country—France—we estimate that about 11 percent of the total recorded employment in cooperatives and mutuals is actually working in entities that are also NPIs. To avoid double counting, we have counted the workers in such cooperatives and mutuals as cooperative and mutual workers and adjusted our estimate of NPI employment accordingly. In addition, to ensure consistency with our definition of in-scope cooperatives and mutuals, a number of estimations had to be employed in countries where existing data for making the necessary distinctions was not available. Fortunately, solid statistical data were available in some countries that facilitated these estimates, as detailed more fully in Appendix 2.
Secondly, as already noted, reliable data on social enterprises, particu-larly those that meet our in-scope criteria, are unavailable on most coun-tries. However, in a number of countries, special legal or technical categories have been adopted to identify such enterprises. Included here are entities that are legally registered or otherwise designated as “Work Integration Social Enterprises (WISE),” “sheltered employment estab-lishments” or, in the case of the UK, “Community Interest Companies (CIC).” While it is not entirely clear how fully these designations line up with our definition of in-scope social enterprises, we were sufficiently encouraged that they provide a reasonable proxy to rely on them. Even so, data on employment in these forms of enterprises were available for only nine EU countries.10 In the remaining countries, no such designa-tions or other sources of data were available, though, as will become clear below, it was possible to make some rough imputations of the scope of such employment in the other countries.
Finally, in the case of volunteers, as previously noted, the portion of total FTE volunteer work that is carried out through other institutions is included in the data on the workforce of these other institutions and
10 See section “Social Enterprises” of Appendix 2 for more details.
The Size and Composition of the European Third Sector

60
broken out separately there. The direct volunteer work, that is, that vol-unteer work that is not mediated by other organizations but is carried out directly for persons outside the volunteer’s family or household is reported separately.
Figure 3.5 shows the distribution of the TS workforce among the four components: direct volunteering, NPIs (excluding those that are coop-eratives), cooperatives and mutuals (including those that are also NPIs), and social enterprises (including those that may be either cooperatives or NPIs), but only for the countries on which data are available.
It is clear that NPIs still engage the majority (59 percent) of the TSE sector workforce, and about 87 percent of the organizational component of the TSE sector. Of this NPI workforce, however, 40 percent is made up of FTE volunteers.
By contrast, cooperatives and mutual societies account for a much smaller 9 percent of the TSE sector workforce even with the coopera-tives operating as NPIs included. In the case of social enterprises, their share of total TSE employment cannot be estimated precisely for rea-sons mentioned earlier, but it is likely to vary only between 1.0 and 2.1 percent, depending on whether we include only the nine countries in which we are able to find reasonable estimates or impute the scale of
Directvolunteering;
31%
Socialenterpises**;
1%
NPIs *; 59%
Coops andmutuals; 9% *Excluding coopera�ves
** 9 countries only
Fig. 3.5 Institutional structure of the European TSE Sector in 29 countries, 2014
L. M. Salamon and W. Sokolowski
61
social enterprise employment in the other countries at the average rate for the countries for which data are available.
The final component of the TSE sector—direct volunteer action—accounts for a significant 31 percent of the FTE TSE sector workforce, and if the volunteers operating through nonprofit organizations are included, the overall volunteer share of total TSE sector’s FTE employ-ment would stand at 55 percent.
1.6 Longitudinal Changes
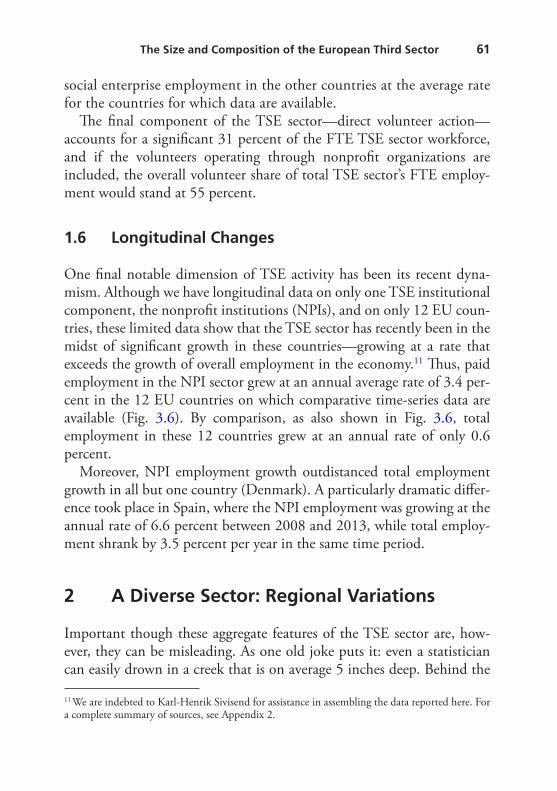
One final notable dimension of TSE activity has been its recent dyna-mism. Although we have longitudinal data on only one TSE institutional component, the nonprofit institutions (NPIs), and on only 12 EU coun-tries, these limited data show that the TSE sector has recently been in the midst of significant growth in these countries—growing at a rate that exceeds the growth of overall employment in the economy.11 Thus, paid employment in the NPI sector grew at an annual average rate of 3.4 per-cent in the 12 EU countries on which comparative time-series data are available (Fig. 3.6). By comparison, as also shown in Fig. 3.6, total employment in these 12 countries grew at an annual rate of only 0.6 percent.
Moreover, NPI employment growth outdistanced total employment growth in all but one country (Denmark). A particularly dramatic differ-ence took place in Spain, where the NPI employment was growing at the annual rate of 6.6 percent between 2008 and 2013, while total employ-ment shrank by 3.5 percent per year in the same time period.
2 A Diverse Sector: Regional Variations
Important though these aggregate features of the TSE sector are, how-ever, they can be misleading. As one old joke puts it: even a statistician can easily drown in a creek that is on average 5 inches deep. Behind the
11 We are indebted to Karl-Henrik Sivisend for assistance in assembling the data reported here. For a complete summary of sources, see Appendix 2.
The Size and Composition of the European Third Sector
62
averages often lie some significant cross-national and regional variations. And that is certainly true of the European TSE sector, as our discussion in Chap. 2 above made clear.
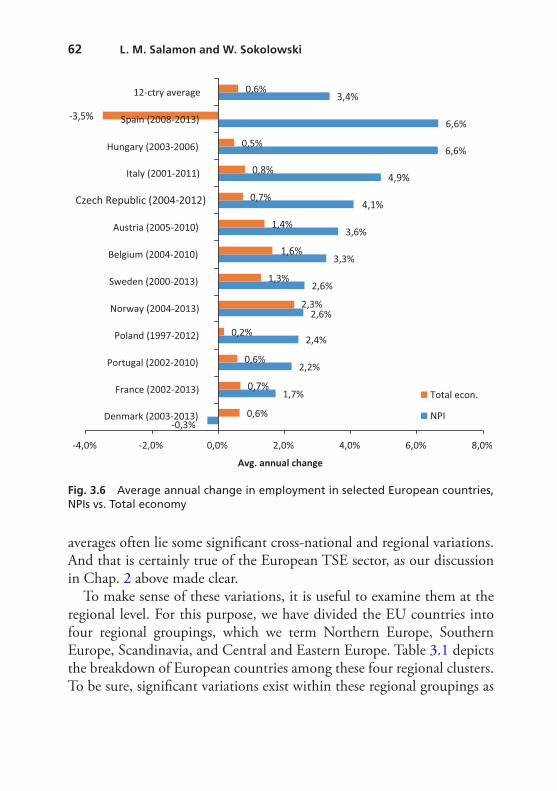
To make sense of these variations, it is useful to examine them at the regional level. For this purpose, we have divided the EU countries into four regional groupings, which we term Northern Europe, Southern Europe, Scandinavia, and Central and Eastern Europe. Table 3.1 depicts the breakdown of European countries among these four regional clusters. To be sure, significant variations exist within these regional groupings as
-3,5%
12-ctry average
Spain (2008-2013)
Hungary (2003-2006)
Italy (2001-2011)
0,6%
0,5%
0,8%
3,4%
4,9%
6,6%
6,6%
Czech Republic (2004-2012)
Austria (2005-2010)
Belgium (2004-2010)
Sweden (2000-2013)
0,7%
1,4%
1,6%
1,3%
4,1%
3,6%
3,3%
2,6%
Total econ.
NPI
Norway (2004-2013)
Poland (1997-2012)
Portugal (2002-2010)
France (2002-2013)
Denmark (2003-2013)-0,3%
0,2%
0,6%
0,7%
0,6%
2,3%2,6%
2,4%
2,2%
1,7%
-4,0% -2,0% 0,0% 2,0% 4,0% 6,0% 8,0%
Avg. annual change
Fig. 3.6 Average annual change in employment in selected European countries, NPIs vs. Total economy
L. M. Salamon and W. Sokolowski
63
well, and even within particular countries, but our data do not at this stage permit us to go below the regional level.
2.1 Regional Variations in Overall TSE Sector Scale
A useful starting point for this discussion of regional variations in the contours of the TSE sector is with the sector’s basic scale. Countries differ, of course, in the size of their populations, so it is natural that larger countries will have larger TSE sector workforces than do smaller ones. To draw valid comparisons, therefore, we focus not on the abso-lute numbers, but on the share that the TSE sector workforce repre-sents of the total number of people employed in each region. As Fig. 3.7 shows, that share varies from a high of 15 percent in the Northwestern European countries to a low of 9.5 percent in Central and Eastern Europe.12
12 See Appendix 2 for the values for individual countries.
Table 3.1 Regional grouping of EU countries plus Norway
Northern EuropeAustria IrelandBelgium LuxembourgFrance NetherlandsGermany UKSouthern EuropeCyprus MaltaGreece PortugalItaly SpainScandinaviaDenmark NorwayFinland SwedenCentral and Eastern EuropeBulgaria LithuaniaCroatia PolandCzech Republic RomaniaEstonia SlovakiaHungary SloveniaLatvia
The Size and Composition of the European Third Sector

64
2.2 Regional Variations in the Institutional Composition of the TSE Sector Workforce
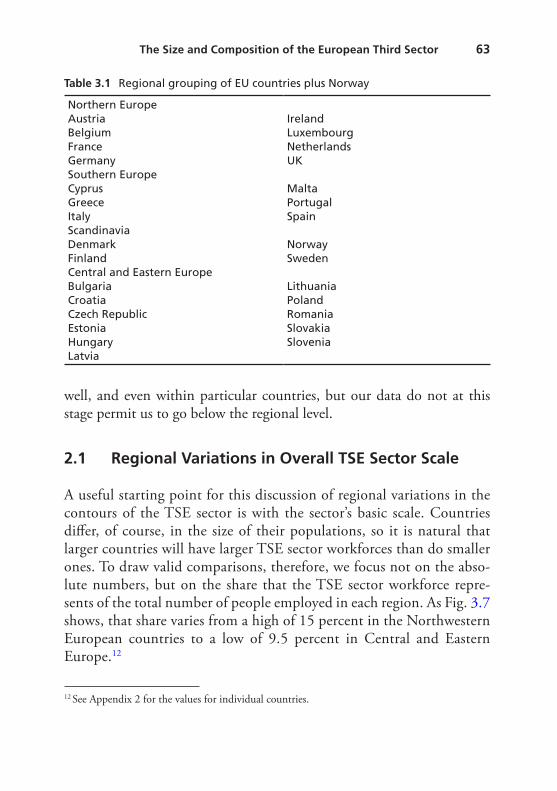
These overall disparities in the relative size of the TSE sector among regions are overshadowed, moreover, by the much larger disparities in the composition of the third sector in the different European regions. This is fully consistent with our discussion of regional variations in Chap. 2 above, but still deserves emphasis here. Thus, as shown in Fig. 3.8, in Central and Eastern Europe, 70 percent of third sector employment takes the form of direct volunteering. By contrast, employment in NPIs—both paid and volunteer—accounts for a much smaller 22 percent. This con-trasts sharply with Northwestern Europe, where 60 percent of the TSE sector employment is in NPIs, much of it in paid positions, while employ-ment in coops accounts for about 12 percent, social enterprises for less than 1 percent, and direct volunteering a relatively small 27 percent. This testifies to the still-embryonic nature of the more formal third sector institutions in the formerly Soviet-dominated territories and their much more robust development in the continent’s advanced northwestern tier.
29 countries 13,2%
North-Western Europe 15,0%
Scandinavia 14,4%
Southern Europe 13,2%
Central/Eastern Europe 9,5%
0,0% 2,0% 4,0% 6,0% 8,0% 10,0% 12,0% 14,0% 16,0%
Fig. 3.7 European TSE sector workforce as a percent of total employment, by region, 2014
L. M. Salamon and W. Sokolowski
65
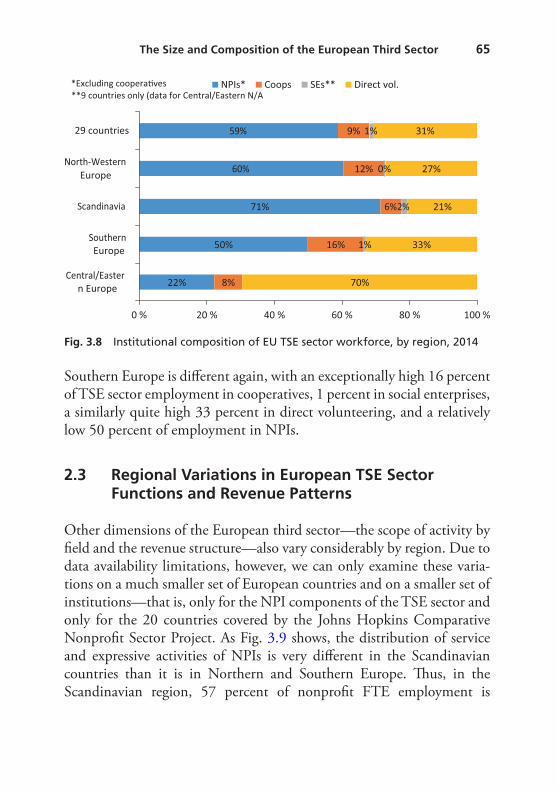
Southern Europe is different again, with an exceptionally high 16 percent of TSE sector employment in cooperatives, 1 percent in social enterprises, a similarly quite high 33 percent in direct volunteering, and a relatively low 50 percent of employment in NPIs.
2.3 Regional Variations in European TSE Sector Functions and Revenue Patterns
Other dimensions of the European third sector—the scope of activity by field and the revenue structure—also vary considerably by region. Due to data availability limitations, however, we can only examine these varia-tions on a much smaller set of European countries and on a smaller set of institutions—that is, only for the NPI components of the TSE sector and only for the 20 countries covered by the Johns Hopkins Comparative Nonprofit Sector Project. As Fig. 3.9 shows, the distribution of service and expressive activities of NPIs is very different in the Scandinavian countries than it is in Northern and Southern Europe. Thus, in the Scandinavian region, 57 percent of nonprofit FTE employment is
*Excluding coopera�ves NPIs* Coops SEs** Direct vol.
29 countries 59% 9% 1% 31%
North-WesternEurope 60% 12% 0% 27%
Scandinavia 71% 6%2% 21%
SouthernEurope 50% 16% 1% 33%
Central/Eastern Europe 22% 8% 70%
0 % 20 % 40 % 60 % 80 % 100 %
**9 countries only (data for Central/Eastern N/A
Fig. 3.8 Institutional composition of EU TSE sector workforce, by region, 2014
The Size and Composition of the European Third Sector

66
devoted to expressive functions and only 40 percent to service ones. By contrast, in Northern and Southern Europe, these proportions are reversed, with over 60 percent of TSE sector effort devoted to service provision and a much smaller 31–35 percent devoted to expressive func-tions. This reflects the much greater reliance on government for service provision in the Scandinavian lands and the long-standing tradition of nonprofit involvement in advocacy and sport activities there.
Similar disparities characterize the revenue structure of NPIs across Europe, as shown in Fig. 3.10. Thus, “fee income” (comprising mar-
43% 46% 11%
35% 57% 8%
53% 36% 11%
57% 35% 8%
39% 42% 19%
Fees Government Philanthropy
20 countries
Northern Europe
Southern Europe
Scandinavia
Central andEastern Europe
0% 20% 40% 60% 80% 100%
Percent of NPI revenue
Fig. 3.10 NPI revenue structure, by region, in 20 EU countries
55% 41% 4%
62% 31% 7%
61% 35% 4%
40% 57% 3%
53% 44% 4%
Service Expressive Other
20 countries
Southern Europe
Northern Europe
Scandinavia
Central andEastern Europe
0% 20% 40% 60% 80% 100%
Percent of NPI workforce
Fig. 3.9 European NPI workforce, by function, by region, 20 EU countries
L. M. Salamon and W. Sokolowski
67
ket sales, membership dues and interest earned) is the dominant rev-enue source for NPI entities in the Scandinavian countries, accounting for 57 percent of NPI revenue, whereas government is the dominant source in Northwestern Europe outside of Scandinavia, with a similar 57 percent of revenue coming from governmental sources in this region. Lacking both substantial government and fee income, NPIs in Central and Eastern Europe rely disproportionately on philanthropy, which accounts for 19 percent of NPI income, twice the share that it provides to the much larger NPI sectors in Scandinavia and Northern Europe.
2.4 Summary
As this section has shown, behind the aggregate picture of the European third sector lie some enormous cross-regional variations. What is more, these variations apply to each of the dimensions of the TSE sector that we have been able to examine, and often in apparently confusing ways. What has caused these variations? Is it possible that these variations hold the key to explaining what it is that determines the size, shape, functions and financing of the TS sector across Europe? It is to this intriguing set of questions that we turn in the next section.
3 Explaining Cross-national Variations in TSE Sector Dimensions13
Cross-national dimensions in different manifestations of TS activities have not, of course, totally escaped public scrutiny. Public officials, journalists, foundation officers, civil society activists and volunteers have long had hunches about different levels and manifestations of third sector activities among countries and regions, even though they have
13 This section draws heavily on Lester M. Salamon, S. Wojciech Sokolowski, and Megan Haddock, Explaining Civil Society Development: A Social Origins Approach. Baltimore, MD: Johns Hopkins University Press, 2017.
The Size and Composition of the European Third Sector
68
lacked solid empirical verification. Yet, the popular explanations of these differences are at best unconvincing and often misleading.
Perhaps the most popular explanation links these cross-country differ-ences in the manifestations of TS activities to different cultural values and sentiments. The key element of this line of argument is that social institu-tions such as civil society organizations result from the development of certain values, attitudes and norms of behavior, many of which are sup-posedly rooted in religious convictions and teachings. Societies that espouse norms and values favorable for charity, self-governance or altru-ism will have stronger nonprofit and philanthropic sectors than societies in which such impulses are weaker.
Variants of this argument can be found in the academic literature as well. For example, Banfield attributed the backwardness of southern Italy to a prevalent, but dysfunctional, moral code that he termed “amoral familism” that impeded cooperation among families or clans and thus the growth of associational ties. Fukuyama proposed a similar cultural explanation of the sources of civil society growth, emphasizing the cul-tural value of “trust.” Societies exhibiting high levels of trust create self- governing associations in both business and social life, whereas low- trusting societies rely on familial ties while the management of pub-lic affairs is carried out by a centralized authority (the state). “A thriving civil society,” Fukuyama therefore explains, “depends on a people’s habits, customs, and ethics—attributes that can be shaped only indirectly through conscious political action and must otherwise be nourished through an increased awareness and respect for culture.”14
Another line of argument, developed by American economists and popularized by the spread of the neoliberal ideology during the past 30 years, attributes these differences to the degree of heterogeneity of demand for public goods. According to this theory, the inability of the market to supply the level of collective goods that citizens demand neces-sitates that such goods are paid for by public funding rather than through ordinary market transactions. However, when the demand for public
14 Edward Banfield. (1958). The Moral Basis of a Backward Society. New York: Free Press.; Francis Fukuyama. (1995). Trust: The Social Virtues and the Creation of Prosperity. New York: The Free Press.;
L. M. Salamon and W. Sokolowski

69
goods is diversified due to different preferences of different socio-demo-graphic groups, it is difficult to obtain the level of political consensus needed to secure sufficient public funding for such goods. According to this theory, this set of circumstances leads to the growth of the nonprofit sector to supply the collective goods that neither the market nor the state can provide. This theory thus predicts that the lower the level of hetero-geneity in a population, the higher the level of government provision of public welfare services, and therefore the lower the level of TS develop-ment needed to provide the “collective goods” that citizens demand. In other words, the third sector should be less prominent where government spending is highest, and vice versa.15
Neither of these theories is very consistent with the findings reported here, however. So far as the cultural theories, and their religious ground-ing, are concerned, Europe, and especially the European Union countries, show a remarkable degree of cultural and religious similarity by global standards. All these countries share virtually identical religious roots—the Greco-Roman civilization and Christianity. Virtually every European country’s religious tradition emphasizes the importance of social solidar-ity, altruism, helping others, civic virtues and engagement in public affairs. Clearly, a factor that is so ubiquitous can hardly be counted on to explain the enormous variations that exist in the manifestations of the TSE sector in Europe. Indeed, countries with very similar religious tradi-tions, such as Italy, Ireland and Poland, all predominantly Catholic nations, have very different levels of TSE sector activities, especially with regard to their organizational component. Portugal and Spain share not only the same religion, but also the same cultural tradition, yet they differ markedly in their TSE sector manifestations.
This, of course, does not mean that cultural norms, values and ideolo-gies play no role in TSE sector development, but that the relationship between the ideological influences and TSE is far more complex than the cultural sentiments theories claim. On the one hand, the norms and val-ues can constrain even powerful social interests. At the same time,
15 Burton Weisbrod. (1977). The Voluntary Independent Sector. Lexington: Lexington Books; Henry Hansmann. (1987). “Economic Theories of Nonprofit Organizations.” In Walter W. Powell (ed.), The Nonprofit Sector: A Research Handbook, pp. 27–42. New Haven: Yale University Press.
The Size and Composition of the European Third Sector
70
whether particular values or norms gain support or legitimacy can be influenced by their consistency with group interests. Max Weber recog-nized this latter point in his concept of “elective affinity,” the tendency of social actors to lean toward cultural norms and values that align with their predispositions and group interests ([1904–05] 1958, see also Howe, 1978). Thus, according to Weber, Protestant religious doctrines emerging in fifteenth- and sixteenth-century Europe gained ground in important part because they were more aligned with the economic inter-ests of wealthy merchants than the traditional Catholic teaching renounc-ing worldly possessions.
This suggests that rather than being treated as general influences with-out observable causal links to particular social groupings or specific insti-tutional outcomes, the cultural and ideological influences must be linked to the power and actions of specific social actors. For example, the long- standing Catholic doctrine of subsidiarity, holding that social issues ought to be addressed by the social unit closest to the family, including, of course, the parish, provided a convenient template for conservative elements to use in resisting worker pressures for expanded state-provided social welfare protections in nineteenth century Germany by channeling such protections through politically “safe,” religiously affiliated, non-profit organizations. Hence, as will be explained more fully later in this chapter, this created a pattern of TSE development that we term “welfare partnership.”
With regard to the economic theories linking the rise of the third sec-tor to a combination of market failure and government failure that con-strains government social welfare spending and leads to increased reliance on nonprofit groups, the evidence presented here roundly refutes them. Indeed, far from being more limited, the European third sector is much larger and more robust in precisely those regions—Northwestern Europe and Scandinavia—where government social welfare spending is higher. This refutes both these market failure/government-failure theories and the common perception that Western European countries have built “welfare states.” In fact, what they have built are “welfare partnerships” in which governments have turned massively to nonprofit organizations to deliver state-funded social welfare services. This has been possible because, unlike the USA, most European countries have developed what Lijphart
L. M. Salamon and W. Sokolowski

71
terms “consensus democracy,” which differs from the winner-take-all image embodied in the government-failure theory by making provision for proportional representation of minority interests.16 This makes it pos-sible to build consensuses among various interest groups and thereby generate support for a much broader array of public goods than the hypothesized “median voter” might want and eliminates the binary “either-or” choice between government or third sector provision by designing cooperative arrangements that engage both. This may explain why the inverse relation between government social welfare spending and the size of the civil society sector predicted by the economic theory turns out to be powerfully refuted by much of the cross-national data we have assembled.
How, then, are we to account for the significant differences in TSE sector size and contours among the different European regions? Drawing in part on Robert Putnam’s influential study of the significant variations in the scope and scale of the nonprofit sector in Southern and Northern Italy, which Putnam links to different social class power relations in these different regions,17 the two authors of this chapter have developed a broader “social origins” theory of third sector development that links the development of the third sector to different configurations of power rela-tions among social groupings and institutions in various countries during the period of industrialization and modernization (Salamon et al. 2017). Thus, for example, in countries where industrial and commercial ele-ments were able to diffuse the influence of conservative landed elites and consolidate their own political and economic power during the period of industrialization, they were able to impose national policies favorable to their economic interests in limited government involvement in economic and social affairs, and reliance on markets and private initiative in address-ing the social problems resulting from industrialization. The consequence was the emergence of a “Liberal pattern” of civil society development, characterized by fairly substantial TSE sector institutions, but mostly
16 Lijphart, Arendt. (1999). Patterns of Democracy: Government Forms and Performance in Thirty Six Countries. New Haven: Yale University Press.17 Robert Putnam. (1993). Making Democracy Work: Civic Traditions in Modern Italy. Princeton: Princeton University Press.
The Size and Composition of the European Third Sector
72
dependent on private sources (fees and charity) for their support. In Europe, this pattern is most visible in the UK and Switzerland.
In countries where industrialization and the partial liberalization of social relations led to the substantial growth of a working class and of organizations representing its interests, but not to the point of displac-ing the dominant position of landed and/or industrial or commercial elites, a decidedly different pattern emerged characterized by greater state- sponsored social welfare protections—but channeled through “safe,” religiously affiliated, private voluntary organizations. This pro-duced a “Welfare Partnership pattern” of civil society sector develop-ment, mostly focused on service activities instead of protest and advocacy, heavily subsidized by the state, but safely held in check by conservative religious or other institutions. This pattern was most pronounced in the Northwestern European countries, especially in Germany and the Netherlands, but subsequently adopted by other countries now making up the EU.
Yet another pattern emerged where the power of both industrial and rural elites had been weakened by a rising working class along with small- farmer agrarian elements and urban professionals, creating a favorable environment for implementing generous governmental social welfare provisions. The upshot here was a social-democratic pattern where social welfare services are treated as a “right” of all citizens—not a gift bestowed by charitable institutions—and are delivered directly by governmental institutions subject to popular control by citizens.18 In Europe, this pat-tern emerged in the Scandinavian countries and Austria.
Still another pattern of civil society development could emerge where pre-modern landed elements retain power into the modern era and pro-long economic stagnation that threatens a country’s sovereignty. To counteract this threat, particularly in the face of foreign pressures, mili-tary leaders, senior civil servants, urban professionals or modernizing elites stage a revolutionary takeover of state institutions in order to push
18 K. H. Sivesind, and P. Selle (2010) “Civil society in the Nordic countries: Between displacement and vitality.” In R. Alapuro and H. Stenius (Eds.), Nordic Associations in a European Perspective (pp. 89–120). Baden-Baden: Nomos Verlagsgesellschaft.
L. M. Salamon and W. Sokolowski

73
through programs of rapid industrialization and modernization. To keep popular forces at bay and make it possible to channel whatever surplus is produced into modernization rather than consumption, such modern-izing elites often find it necessary to limit personal freedoms and, par-ticularly, restrict the growth of civil society organizations that could challenge governmental dominance and disrupt the rapid modernization agenda through demands for greater political voice and better living standards. This results in a “Statist pattern” of third sector development characterized by a highly constrained civil society sector operating in a narrow range of fields deemed critical for national development. One consequence of this constraint on third sector organizational develop-ment is a shifting of social welfare protections from the organizational to the informal social sphere. In Europe, this pattern first emerged in Russia, Turkey, Spain and Portugal, but after World War II, was forcibly exported to Central and Eastern Europe countries on the bayonets of the Red Army.
This social origins theory thus does a better job of explaining the regional variations in TSE sector dimensions in Europe than do the alter-native theories. First, it explains why the size of the organizational com-ponent of the TSE sector in Eastern European countries is markedly smaller than that elsewhere in Europe, while the size of direct voluntary action is markedly larger (Fig. 3.7). Until the 1990s, the Central and Eastern European countries remained tied to the statist pattern under which the organizational component of the TSE sector remained firmly in strict state control. As the legitimacy of the political regime waned, so did the legitimacy of these state-controlled civic organizations. As a con-sequence, virtually all spontaneous civic activities were conducted in the informal sphere of neighborly self-help activities and unorganized social movements. Although the economic and political reforms of the 1990s and the subsequent EU accession dramatically changed the environment in which civic organizations operate, the norms of social behavior that favor direct volunteer action over participation in organized civic action still linger.
A similar process took place in the Mediterranean countries, many of which fell under the statist regime during modernization. However,
The Size and Composition of the European Third Sector

74
unlike in Central and Eastern Europe, the statist regimes in the Mediterranean countries were democratized much earlier, in 1945 in Italy and in the early 1970s in Spain and Portugal. Also, these countries joined the EU much earlier than their Eastern European counterparts. Consequently, they enjoyed the benefits of a supportive environment for civic organizational development for a considerably longer period than the CEE countries. They also had partially Church-inspired cooperative institutions operating in financial and related spheres that muted the dominance of capitalist institutions and fostered broader cooperative and mutual ties. Cooperative institutions also emerged in Central and Eastern Europe, but with much greater state involvement and control.
The social origins theory also helps us understand the otherwise puz-zling dominance of expressive over service activities in the third sector of the Scandinavian countries, as contrasted with the countries in north-western Europe (Fig. 3.8). The social origins theory accounts for this dif-ference by noting that conservative landed and industrial elements retained substantial power well into the late-nineteenth century and channeled social welfare provisions for workers through safe, religiously affiliated nonprofit organizations, producing a characteristic welfare part-nership pattern with the religious organizations serving as junior partners of governments in delivering publicly funded welfare services. In the Scandinavian countries, by contrast, landed elites were weakened and a robust small-farmer agrarian class took its place and made common cause with the emerging working class to push for a social-democratic regime in which public welfare services were expanded and delivered predomi-nantly by the state. Because the welfare state took care of many tasks such as child care and elderly care, the families got more time to participate and volunteer in the culture, sports and recreation areas, which grew rap-idly from the 1960s as the welfare state matured and a leisure society emerged
The social origins theory also explains why the government share of nonprofit revenue is considerably higher in Northern Europe than elsewhere in Europe (Fig. 3.9). Northwestern Europe, especially Germany and the Netherlands, pioneered the policies of harnessing civic organizations into the provision of publicly funded services.
L. M. Salamon and W. Sokolowski

75
Although the original impulses behind these policies were to counter-act the radicalization of the working class, they proved to be a very effective mechanism of public service delivery that combines the secu-rity of public funding with the responsiveness of relatively small and nonbureaucratic civic organizations. As a result, the welfare partner-ship pattern continued to develop even after the original motivation behind it lost its relevance.
To summarize, the social origins theory of third sector development thus carries us considerably far down the road toward explaining the diverse size, shape, functions and support structure of the TSE sector in Europe, and does so considerably better than the alternative explanations that have been deployed up to now. What the analysis here shows is that while the TSE sector may be a conduit for altruistic sentiments and per-sonal preferences, the size of the sector and the shape that it takes depend heavily on the broader structures of power relationships in society. Restoring considerations of power to the center of analysis of the third sector thus emerges as a central imperative if we are to understand the path that civil society development takes.
This analysis also suggests a significant connection between the growth of the TS and the strength of labor movements and their political exten-sions. This connection is often missed in public perception, as “civil soci-ety” and “organized labor” are often seen as two separate social institutions pursuing wholly disparate, if not mutually antagonistic, goals. But the contribution of the labor movement to the development of the civil society sector is significant and takes two different forms. In the first place, organized labor has created a wide array of self-help groups and clubs serving the needs of the working class. And second, organized labor’s demands have often leveraged government policies that create favorable conditions for general civil society sector growth.
The social origins theory can not only explain existing developments, but also help forecast the future. This can offer valuable insights into pos-sible outcomes in rapidly changing parts of the world, and it can offer useful insights for the design of public policies facilitative of robust third sector development. But for these topics, it is necessary to turn to subse-quent chapters of this book.
The Size and Composition of the European Third Sector

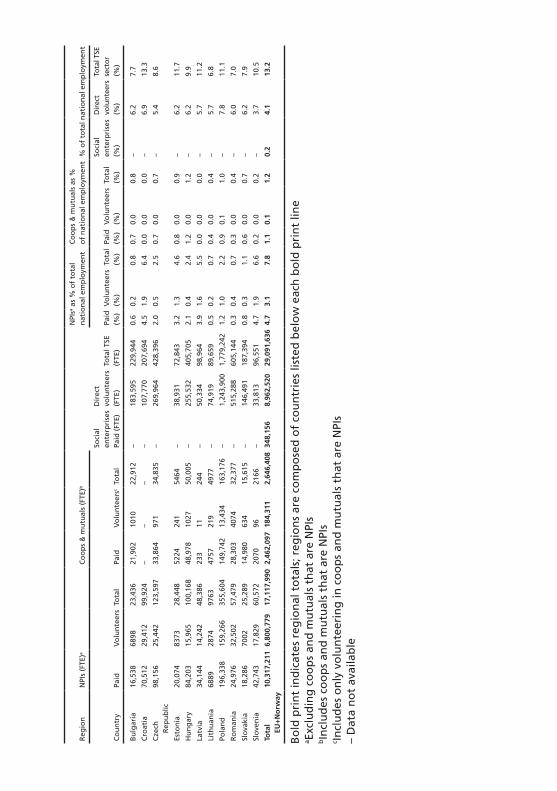
Ap
pen
dix
1: E
stim
ates
of
TSE
Sect
or
FTE
wo
rkfo
rce
in E
U a
nd
No
rway
, b
y C
om
po
nen
t, 2
014
Reg
ion
NPI
s (F
TE)a
Co
op
s &
mu
tual
s (F
TE)b
Soci
al
ente
rpri
ses
Paid
(FT
E)
Dir
ect
volu
nte
ers
(FTE
)To
tal T
SE
(FTE
)
NPI
sa as
% o
f to
tal
nat
ion
al e
mp
loym
ent
Co
op
s &
mu
tual
s as
%
of
nat
ion
al e
mp
loym
ent
% o
f to
tal n
atio
nal
em
plo
ymen
t
Co
un
try
Paid
Vo
lun
teer
sTo
tal
Paid
Vo
lun
teer
scTo
tal
Paid
(%
)V
olu
nte
ers
(%)
Tota
l (%
)Pa
id
(%)
Vo
lun
teer
s (%
)To
tal
(%)
Soci
al
ente
rpri
ses
(%)
Dir
ect
volu
ntee
rs
(%)
Tota
l TSE
se
ctor
(%
)
No
rth
ern
Eu
rop
e7,
218,
017
4,65
2,44
811
,870
,465
970,
006
68,5
881,
038,
593
291,
630
3,43
5,58
716
,636
,275
6.3
4.0
10.3
0.8
0.1
0.9
0.3
3.0
14.4
Au
stri
a15
6,82
522
8,54
138
5,36
633
,629
5420
39,0
5080
0020
0,14
163
2,55
73.
85.
69.
40.
80.
10.
90.
24.
915
.4
Bel
giu
m45
0,45
412
9,21
057
9,66
413
,534
429
13,9
6375
,000
185,
867
854,
494
9.9
2.8
12.8
0.3
0.0
0.3
1.7
4.1
18.8
Fran
ce1,
562,
866
1,05
9,88
32,
622,
749
161,
546
12,1
1717
3,66
340
,052
139,
572
2,97
6,03
66.
14.
110
.20.
60.
00.
70.
20.
511
.5
Ger
man
y2,
343,
848
1,27
8,25
63,
622,
104
486,
161
29,3
2451
5,48
5–
1,47
9,32
15,
616,
911
5.9
3.2
9.1
1.2
0.1
1.3
–3.
714
.1
Irel
and
179,
306
48,1
0222
7,40
723
,322
692
24,0
14–
76,6
3632
8,05
89.
42.
511
.91.
20.
01.
3–
4.0
17.1
Luxe
mb
ou
rg22
,544
17,9
7940
,523
1025
9011
16–
9664
51,3
039.
27.
316
.50.
40.
00.
5–
3.9
20.9
Net
her
lan
ds
847,
082
482,
389
1,32
9,47
199
,121
6243
105,
364
–28
1,75
61,
716,
591
10.3
5.9
16.1
1.2
0.1
1.3
–3.
420
.8
Un
ited
K
ing
do
m1,
655,
091
1,40
8,08
93,
063,
181
151,
668
14,2
7116
5,93
916
8,57
81,
062,
630
4,46
0,32
65.
44.
610
.00.
50.
00.
50.
63.
514
.6
Sou
ther
n
Euro
pe
2,01
9,48
31,
161,
168
3,18
0,65
198
5,78
762
,633
1,04
8,42
150
,035
2,09
6,12
26,
375,
228
4.2
2.4
6.6
2.0
0.1
2.2
0.1
4.3
13.2
Cyp
rus
23,0
4418
,378
41,4
2226
8723
729
24–
15,2
3859
,583
6.4
5.1
11.4
0.7
0.1
0.8
–4.
216
.4
Gre
ece
243,
424
194,
137
437,
561
8550
754
9304
–18
0,15
662
7,02
26.
95.
512
.40.
20.
00.
3–
5.1
17.7
Ital
y87
1,95
255
5,24
61,
427,
199
598,
387
42,1
4464
0,53
117
,635
812,
383
2,89
7,74
83.
92.
56.
42.
70.
22.
91.
13.
613
.0
Mal
ta10
,512
8384
18,8
9613
312
144
–73
2726
,368
5.8
4.6
10.4
0.1
0.0
0.1
–4.
014
.5
Port
ug
al18
6,75
054
,752
241,
501
28,6
2992
829
,557
–16
6,40
543
7,46
34.
21.
25.
40.
60.
00.
7–
3.7
9.7
Spai
n68
3,80
033
0,27
21,
014,
071
347,
402
18,5
5836
5,96
032
,400
914,
613
2,32
7,04
43.
91.
95.
82.
00.
12.
11.
25.
313
.4
Scan
din
avia
466,
852
667,
357
1,13
4,21
019
6,25
031
,373
227,
623
6492
510,
273
1,87
8,59
73.
75.
39.
01.
60.
21.
80.
14.
115
.0
Den
mar
k13
2,96
911
0,53
824
3,50
839
,682
3649
43,3
3134
8312
3,63
741
3,95
84.
94.
19.
01.
50.
11.
60.
14.
615
.3
Fin
lan
d67
,000
78,1
4614
5,14
654
,409
7019
61,4
2845
914
5,15
935
2,19
22.
73.
25.
92.
20.
32.
51.
15.
914
.4
No
rway
84,0
5414
3,63
722
7,69
1–
––
–85
,647
313,
339
3.2
5.5
8.7
0.0
0.0
0.0
–3.
311
.9
Swed
en18
2,82
933
5,03
651
7,86
510
2,15
920
,705
122,
864
2550
155,
830
799,
109
3.8
7.0
10.9
2.1
0.4
2.6
1.2
3.3
16.7
Cen
tral
an
d
East
ern
Eu
rop
e
612,
859
319,
805
932,
664
310,
054
21,7
1833
1,77
1–
2,92
0,53
84,
201,
535
1.4
0.7
2.1
0.7
0.0
0.7
–6.
69.
5
(co
nti
nu
ed)
Reg
ion
NPI
s (F
TE)a
Co
op
s &
mu
tual
s (F
TE)b
Soci
al
ente
rpri
ses
Paid
(FT
E)
Dir
ect
volu
nte
ers
(FTE
)To
tal T
SE
(FTE
)
NPI
sa as
% o
f to
tal
nat
ion
al e
mp
loym
ent
Co
op
s &
mu
tual
s as
%
of
nat
ion
al e
mp
loym
ent
% o
f to
tal n
atio
nal
em
plo
ymen
t
Co
un
try
Paid
Vo
lun
teer
sTo
tal
Paid
Vo
lun
teer
scTo
tal
Paid
(%
)V
olu
nte
ers
(%)
Tota
l (%
)Pa
id
(%)
Vo
lun
teer
s (%
)To
tal
(%)
Soci
al
ente
rpri
ses
(%)
Dir
ect
volu
ntee
rs
(%)
Tota
l TSE
se
ctor
(%
)
Bu
lgar
ia16
,538
6898
23,4
3621
,902
1010
22,9
12–
183,
595
229,
944
0.6
0.2
0.8
0.7
0.0
0.8
–6.
27.
7
Cro
atia
70,5
1229
,412
99,9
24–
––
–10
7,77
020
7,69
44.
51.
96.
40.
00.
00.
0–
6.9
13.3
Cze
ch
Rep
ub
lic98
,156
25,4
4212
3,59
733
,864
971
34,8
35–
269,
964
428,
396
2.0
0.5
2.5
0.7
0.0
0.7
–5.
48.
6
Esto
nia
20,0
7483
7328
,448
5224
241
5464
–38
,931
72,8
433.
21.
34.
60.
80.
00.
9–
6.2
11.7
Hu
ng
ary
84,2
0315
,965
100,
168
48,9
7810
2750
,005
–25
5,53
240
5,70
52.
10.
42.
41.
20.
01.
2–
6.2
9.9
Latv
ia34
,144
14,2
4248
,386
233
1124
4–
50,3
3498
,964
3.9
1.6
5.5
0.0
0.0
0.0
–5.
711
.2
Lith
uan
ia68
8928
7497
6347
5721
949
77–
74,9
1989
,659
0.5
0.2
0.7
0.4
0.0
0.4
–5.
76.
8
Pola
nd
196,
338
159,
266
355,
604
149,
742
13,4
3416
3,17
6–
1,24
3,90
01,
779,
242
1.2
1.0
2.2
0.9
0.1
1.0
–7.
811
.1
Ro
man
ia24
,976
32,5
0257
,479
28,3
0340
7432
,377
–51
5,28
860
5,14
40.
30.
40.
70.
30.
00.
4–
6.0
7.0
Slo
vaki
a18
,286
7002
25,2
8914
,980
634
15,6
15–
146,
491
187,
394
0.8
0.3
1.1
0.6
0.0
0.7
–6.
27.
9
Slo
ven
ia42
,743
17,8
2960
,572
2070
9621
66–
33,8
1396
,551
4.7
1.9
6.6
0.2
0.0
0.2
–3.
710
.5
Tota
l EU
+N
orw
ay10
,317
,211
6,80
0,77
917
,117
,990
2,46
2,09
718
4,31
12,
646,
408
348,
156
8,96
2,52
029
,091
,636
4.7
3.1
7.8
1.1
0.1
1.2
0.2
4.1
13.2
Bo
ld p
rin
t in
dic
ates
reg
ion
al t
ota
ls; r
egio
ns
are
com
po
sed
of
cou
ntr
ies
liste
d b
elo
w e
ach
bo
ld p
rin
t lin
ea E
xclu
din
g c
oo
ps
and
mu
tual
s th
at a
re N
PIs
bIn
clu
des
co
op
s an
d m
utu
als
that
are
NPI
sc In
clu
des
on
ly v
olu
nte
erin
g in
co
op
s an
d m
utu
als
that
are
NPI
s–
Dat
a n
ot
avai
lab
le

78
Appendix 2: Methodology for Estimating the Size of the Third Sector in Europe
Following the conceptual framework developed by the TSI project, the TSE sector consists of the following components: nonprofit institutions, cooperatives and mutuals, social enterprises and individual human activi-ties outside organizations. According to this conceptual framework, all nonprofit institutions not controlled by government are in in-scope of the TSE sector. However only some cooperatives, mutual associations and social enterprises meet the TSE sector’s definitional features, that is, those that are not controlled by government and are significantly limited by law or widely acknowledged custom from distributing any profits they earn to members, investors or other stakeholders. This framework also limits the individual activities in scope, as those that constitute work without pay performed for public benefit rather than for the benefit of the volunteers’ households or families. Data sources therefore had to be found that would provide a way to draw these operational distinctions. The methodology used in this project to estimate the size and related characteristics of the TSE sector’s paid and volunteer workforce therefore had to estimate each of these components separately and then add these estimates together to arrive at the estimate of the size and related charac-teristics of FTE employment in the entire TSE sector while avoiding potential double counting. The discussion below covers the methodology and data sources utilized in estimating these various parameters for each of these components in turn.
Nonprofit Institutions (NPIs)
The existing data sources on employment in NPIs include the Johns Hopkins Comparative Nonprofit Sector Project (JHU/CNP)(Lester M. Salamon, S. Wojciech Sokolowski and Megan Haddock (2017), Explaining Civil Society Development: A Social Origins Approach, Baltimore: Johns Hopkins University Press), NPI Satellite Accounts compiled by national statistical agencies, and other semi-official data sources. The JHU/CNP data cover both paid and volunteer employment
L. M. Salamon and W. Sokolowski

79
in the in-scope NPIs, as defined in chapter two of this book. These data sources cover 18 EU countries (Austria, Belgium, Czech Republic, Denmark, Finland, France, Germany, Hungary, Ireland, Italy, Netherlands, Poland, Portugal, Romania, Slovakia, Spain, Sweden and the UK) and Norway. For most of these countries, the data reported in these sources were “updated” to 2014 by calculating the ratios of NPI employment to total employment for the year for which the data were originally reported, and then applying these ratios to the 2014 total employment in the respective countries (as reported by Eurostat). This approach thus assumes, conservatively, that the NPI share of the total employment remained more or less constant over time even though the limited time-series data reported above suggests that nonprofit employ-ment is growing more rapidly than overall employment in all the coun-tries for which such data are available.
For two of these countries, France and Portugal, however, newer, reli-able data were published in time to be incorporated into this analysis. For France, the data come from the Atlas Commente de l’economie Sociale et Solidarie 2014, Observatorie National de L’ESS—CNRES. For Portugal, the data come from the satellite account for social economy released by Statistics Portugal.19
For the remaining 10 EU countries on which no NPI data are avail-able, a regression-based estimation methodology was used. This method-ology used a multivariate linear regression model to estimate the NPI share of total employment in the EU and non-EU countries on which NPI data are already available, and then applying the regression equation to countries for which no NPI data exists. Several predictor variables were tested, and the following were selected based on the amount of explained variance they accounted for in the base countries: (a) per Capita GDP in USD; the services share of GVA; and the revenue of NPISH units as a share of GDP.20 This model explains 71.5 percent of variance (66 percent
19 These data were downloaded from: https://www.ine.pt/xportal/xmain?xpid=INE&xpgid=ine_destaques&DESTAQUESdest_boui=278817467&DESTAQUESmodo=2&xlang=en20 NPISH stands for Nonprofit Institutions Serving Households. Prior to revisions of the System of National Accounts in 2008, NPISH was the only portion of the entire nonprofit sector visible in official economic statistics guided by the System of National Accounts. Formally, NPISH covers organizations that receive all or most of their income from philanthropy, though some countries apply it more broadly.
The Size and Composition of the European Third Sector
80
adjusted). For the 12 EU and non-EU countries on which NPISH data were not available, the missing data were replaced by averages for Eastern and Western Europe, respectively.
The regression equation was used to predict the NPI share of total employment in 10 countries for which CNP or NPI satellite account statistical data on NPIs were not available. In several of these countries, adjustments had to be made to the estimated NPI share values to restrict its variability to the actually observed ranges in the countries for which solid data were available:
For the five countries where the estimated value of the NPI share was lower than the lowest observed value in the 18-country data set, the low-est observed value (for Romania) was used;
For the two countries where the predicted value was higher than the highest observed value in the 18-country data set, the highest observed value was applied.
This estimation methodology results in a reasonably accurate estimate of NPI employment in the 10 countries as a group, but predictions for individual countries may be less reliable and should therefore be viewed with caution. These 10 countries as a group account for only about 5 percent of the NPI workforce (paid and volunteers) covered by this study.
Data for predictor variables come from the national accounts aggre-gates available at the UN Statistics Division website http://data.un.org/Explorer.aspx?d=SNAAMA
Cooperatives and Mutual Societies
The data on employment in cooperatives and mutual societies were drawn mostly from a report prepared by José Luis Monzón Campos and Rafael Chaves Ávila entitled The Social Economy in the European Union, Report drawn up for the European Economic and Social Committee by the International Centre of Research and Information on the Public, Social and Cooperative Economy (CIRIEC, 2012), covering the year 2010. The report provides paid employment data on all EU member countries covering the following separately identified types of organiza-tions: cooperatives, mutuals and associations. The CIRIEC team updated
L. M. Salamon and W. Sokolowski

81
these data through 2014 and reported the tentative results in a June 2017 briefing for the European Economic and Social Committee. However, no published version of these estimates was available as of the date the pres-ent publication went to press, and too little documentation of the sources of the tentatively released data were available to judge their validity. The 2010 data published in 2012 were therefore used as the basis for the esti-mates used here for most countries. Based on a comparison of these two data sets, we have confidence that the overall picture presented in this report would not have been affected significantly were we to have used the tentatively released newer data.
For a variety of reasons, while the CIRIEC data provided a starting point for our estimates of the employment and other features of in-scope cooperatives and mutuals for most countries, these data had to be adjusted to meet the operational criteria for such in-scope entities identified above. There were three reasons for this:
• First, because the CIRIEC data took as given the varying legal defini-tions of cooperatives, mutuals and associations found in the separate countries, rather than the operational criteria specified here. As a result, it appears to have included substantial numbers of cooperatives and mutual, particularly in the financial services field, that operate very much like regular for-profit banks and insurance companies and are therefore out-of-scope of the TSE sector as defined in Chap. 2 of this book;
• Second, little account seems to have been taken of the fact that a sig-nificant, but still unknown, number of cooperatives are actually NPIs, creating significant potential double counting in the estimates
• Finally, the data available to Monzón and Chaves tended to rely on practitioner assessments and unverified administrative registration records, both of which tend to overestimate the scope of actual employ-ment in this field.
Fortunately, to deal with these potential problems, we had available four more reliable and rigorous sources of data on cooperative and mutual employment: data generated by official statistical agencies or high-level research institutions in Portugal, France, Poland and Norway. All four of
The Size and Composition of the European Third Sector

82
these sources reported cooperative and mutual employment levels that fell well below those reported in the CIRIEC data. Not only did this provide better estimates of the actual cooperative and mutual employ-ment in these countries, but also they provided a statistically persuasive basis for estimating the “correction factors” needed to bring the CIRIEC estimates into better alignment with the criteria we adopted to identify the in-scope cooperatives and mutuals. In particular, to eliminate possi-ble out-of-scope units, we followed a procedure recommended by statisticians at Statistics Portugal, which identified cooperatives and mutual societies operating in the financial sector as most likely to be out-of-scope of the TSE sector as we defined it.21 Using the resulting Portugal data and a more detailed breakdown of cooperatives and mutuals avail-able in a 2014 French Atlas Commente de l’economie Sociale et Solidarie (Tableau 16), we were able to generate an empirically verified estimate of the average share of the total cooperative and mutual employment reported in the CIRIEC report that was likely to fit our definition of in-scope cooperative and mutual employment in Europe. Similar adjust-ments became possible in Poland, where statistical sources put the estimate of in-scope cooperative and mutual employment far lower than the adjustments found to be necessary In Portugal and France.22 To be conservative, we applied the average adjustment factor of the CIRIEC estimates found to be appropriate in France and Portugal (53.1 percent) to the CIRIEC estimates in all other countries except Poland and Norway. In the case of Poland, we used the Polish statistical office figures for Poland’s estimate. Since Norway is not an EU member country, the data for this country were not included in the CIRIEC publication. However, an NPI Satellite Account (NPISA) produced by Statistics Norway in accord with the United Nations Handbook on Nonprofit Institutions in the System of National Accounts yielded solid data on NPIs in Norway and the Norwegian TSI project research team determined that all cooperatives and mutuals that are in-scope of the TSE sector in Norway were included
21 Email communication from Ms. Cristina Ramos, National Accounts Statistician, Statistics Portugal, January 20, 2017 and February 6, 2017.22 Personal communication, Slawomir Nalecz, national account statistician, Government Statistical Office, Poland.
L. M. Salamon and W. Sokolowski
83
in the NPI Satellite Account (NPISA) released by Statistics Norway, and those not covered by the Norwegian NPISA were likely to be out-of- scope of our consensus definition.
To avoid double counting of cooperatives that may be treated as NPIs in various countries’ statistics, we developed an estimate of this possible over-lap using data available in the French Atlas Commente de l’economie Sociale et Solidarie 2014, Tableau 16. In particular, in consultation with French experts, we took as given that cooperatives and mutuals operating in the field of social action were likely to be NPIs. Employment in “social action” cooperatives and mutuals in France accounts for about 11 percent of total in-scope employment in those two types of institutions (after excluding employment in the financial cooperatives and mutuals). We applied this rate to the estimated in-scope employment in cooperatives and mutuals in the remaining countries covered by this book to determine the approxi-mate shares of cooperative and mutual employment that also qualify as NPI employment. In our discussion of the institutional breakdown of the TSE sector workforce in Chap. 3, we included this employment in coop-eratives and mutuals that are also NPIs with the cooperative and mutual employment and subtracted it from the estimate of NPI employment.
Social Enterprises
Very limited reliable data on social enterprises are available at this time. The TSI project country assessments suggested that since most of the in- scope social enterprises are already included in the NPI or cooperative data, it was not generally possible to separate them out for most coun-tries. The only clearly identifiable social enterprises are those that have been registered as such under the special legal categories that some coun-tries have recently established for such entities. These categories are vari-ously identified as “Work Integration Social Enterprises” (WISE), “sheltered employment establishments” and, in the case of the UK, “Community Interest Companies (CIC).” Only nine European countries have established such categories, however. In eight of these countries (Austria, Belgium, Denmark, Finland, France, Italy, Spain and Sweden), employment in WISEs and sheltered employment establishments could
The Size and Composition of the European Third Sector
84
be estimated using information provided in country reports of the European Commission’s publication A map of social enterprises and their eco-systems in Europe (European Union, 2014).23 Estimates of employ-ment in CICs in the UK were derived by combining data on the number of active social enterprise establishments provided in an official business register available at http://download.companieshouse.gov.uk/en_output.html, with data on average employment per establishment available in the UK country report included in the European Commission’s Map of social enterprises and their eco-systems in Europe. In the remaining coun-tries, social enterprises operate mostly as NPIs or cooperatives, making it highly likely that they are already included in our data, though it was not possible to report on them separately. Using the data on these nine coun-tries, we estimated that social enterprises accounted for roughly 1 percent of TSE sector employment in Europe. To get some sense of the potential scale of such enterprises in the other countries, we developed two addi-tional estimates—one assuming that the share that social enterprise employment would represent of total TSE employment in these other countries would be on a par with the average in the nine countries on which solid data were available, and the other assuming that the social enterprise share of TSE sector employment in these other countries would likely be on a par with that in the country with the lowest such share among countries for which data are available. It turned out that using the lower estimate would boost the overall share of social enterprise employ-ment from 1 percent to 1.3 percent, and that the higher share would boost it from 1 percent to 2.3 percent—still well within the range of our initial 1 percent estimate.
Direct Volunteering
The data on direct volunteering come from estimates based on national TUSs as reported by OECD. Methodological documentation on national TUS used for these estimates is in Miranda V. (2011) “Cooking, Caring and Volunteering: Unpaid Work Around the World,” OECD Social,
23 This publication is accessible at: http://ec.europa.eu/social/keyDocuments.jsp?pager.offset=0&&langId=en&mode=advancedSubmit&year=0&country=0&type=0&advSearchKey=socentcntryrepts&orderBy=docOrder.
L. M. Salamon and W. Sokolowski
85
Employment and Migration Working Papers, No. 116, OECD Publishing. doi: 10.1787/5kghrjm8s142-en.
TUS assigns the time respondents spend on various activities during a 24-hour period and extrapolates those values to the entire population. This allows estimation of the total time spent on these activities by the entire adult population of a country during the period of one year, and converting that time to FTE employment, assuming 1760 hours per FT job, though this latter number may actually vary from country to coun-try. Time spent on “care for non-household members” reported in TUS tabulations was used as a proxy for direct volunteering. This probably underestimates direct volunteering that does not involve helping other households, such as unorganized community work or protest actions.
Eighteen European countries are covered by the TUS data in the OECD report. The countries are: Austria, Belgium, Canada, Denmark, Estonia, Finland, France, Germany, Hungary, Ireland, Italy, Netherlands, Norway, Poland, Portugal, Slovenia, Spain, Sweden and the UK. However, for Poland, an alternative data source (GUS, Volunteering Through Organizations And Other Types Of Unpaid Work Outside Own Household—2011, Warsaw, 2012) offers a more accurate estimate based on the methodology outlined in the ILO Manual on the Measurement of Volunteer Work. The value reported in the latter source is about 5 percent lower than that estimated from the TUS data for Poland. For the remain-ing 11 countries covered by this report, the averages calculated separately for Western and Eastern Europe, respectively, were used.
The estimation methodology used the average number of minutes per adult spent on caring for nonhousehold members reported in the TUS, and multiplied that number by 365 days and by the size of the adult population (15-65 years of age) in a respective country to estimate the total number of hours spent on these activities during one year. That number was then converted to FTE workers by dividing it by 1760 hours.
Estimation of the TSE Sector Size
Employment in each of the institutional components described above (1 through 4) was summed up for each of the 29 countries covered by this
The Size and Composition of the European Third Sector
86
chapter to arrive at the total size of the workforce (paid and volunteers) in the TSE sector. The values presented here are conservative estimates of that size due to a limited ability to estimate social enterprises and the accurate value of employment in cooperatives.
Estimation of Service and Expressive Shares of the Workforce
The core data for estimating the relative shares of service and expressive activities of the TSE sector workforce were collected through the Johns Hopkins Comparative Nonprofit Sector Project for 20 European coun-tries. Unweighted country averages of these shares were calculated to estimate the respective shares of the NPI component of the workforce engaged in these respective activities in the remaining EU countries. In the case of the cooperative, mutual, social enterprise and direct volun-teering components of the TSE workforce, it was assumed that these workers were entirely involved in service activities. Although it is pos-sible that some direct volunteering involved expressive activities, this kind of direct volunteering was not captured by the TUS data that asked only about help for other households. Our estimate therefore unavoidably likely underestimates the expressive share of the TSE sec-tor workforce.
Estimation of TSE Sector Revenue Shares
The core data for estimating the shares of TSE sector revenue coming from government payments (grants, contracts and reimbursements), fees (mar-ket sales, membership dues and investments), and private philanthropy in NPI revenues were collected through the Johns Hopkins Comparative Nonprofit Sector Project for 20 European countries. Unweighted country averages of these shares were calculated to estimate the respective shares of NPI revenue for the remaining countries. Since, in the European context, government reimbursements for individual services account for most of government support to NPIs, and such reimbursements are reported in conventional economic statistics as market sales to individuals, our esti-
L. M. Salamon and W. Sokolowski

87
mate of government support of TSE sector organizations will diverge from estimates provided in conventional economic statistics.
This NPI estimate of revenue shares from these three main sources was then supplemented by data for cooperatives, mutuals and social enter-prises, which assumed that this revenue comes chiefly from fees and market sales. The value of direct volunteering, estimated at the replace-ment cost, was counted as private philanthropy and factored in propor-tionally to the direct volunteering share of the TS workforce.
Summary of Sources of Data on TSE Sector Average Annual Employment Changes by Country
Compiled by Karl Henrik Sivesind, Institute for Social Research, Norway
AustriaNumber of employed persons 2005 and 2010: Pennerstorfer, A., Schneider, U. &
Badelt, C. in: Simsa, R., Meyer, M. & Badelt, C.: (Hg.): Handbuch der Nonprofit- Organisation. Stuttgart 2013 (5. überarbeitete Auflage).
Volunteering FTE 1997: Heitzmann, Karin (2001): Dimensionen, Strukturen und Bedeutung des Nonprofit Sektors. Eine theoretisch-konzeptionelle und empirische Analyse für Österreich. Wien: Facultas Copy Store.
Volunteering FTE 2000: Badelt, Christoph and Hollerweger, Eva (2007): Ehrenamtliche Arbeit im Nonprofit Sektor, in: Badelt, C./Meyer, M./Simsa, R. (eds.), Handbuch der Nonprofit Organisationen. Strukturen und Management (4., überarbeitete Auflage ed., pp. 503-531). Stuttgart: Schäffer-Poeschel.
Volunteering FTE 2006: Statistik Austria (2008): Struktur und Volumen der Freiwilligenarbeit in Österreich. Bericht im Auftrag des BMSK. Wien: Bundesministerium für Soziales und Konsumentenschutz.
BelgiumFTE employment, and sources of funding 1995 from: Salamon, L. M., Anheier,
H. K., List, R., Toepler, S., Sokolowski, S. W., & Associates. (1999). Global civil society. Dimensions of the nonprofit sector, Volume I. Baltimore, MD: The Johns Hopkins Center for Civil Society Studies.
Number of employed persons, and sources of funding 2004 from:Institut des comptes nationaux. (2007). Comptes nationaux. Le compte satellite
des institutions sans but lucratif 2000-2004. Bruxelles: Banque nationale de Belgique. Retrieved from: https://www.nbb.be/doc/dq/f/dq3/histo/nfds0004.pdf Number of employed persons 2010, and sources of funding from:
Institut des comptes nationaux. (2007). Comptes nationaux. Le compte satellite des institutions sans but lucratif 2009-2010. Bruxelles: Banque nationale de Belgique. Retrieved from: https://www.nbb.be/doc/dq/f/dq3/nfds.pdf
The Size and Composition of the European Third Sector

88
Sources of funding 2008:Salamon, L. M., Sokolowski, S. W., Haddock, M., & Tice, H. S. (2013). The state
of global civil society and volunteering comparative nonprofit sector (Working Paper no. 49). Baltimore, MD: Johns Hopkins University, Center for Civil Society Studies. Figure 12: NPI revenue, by source, by country.
Czech RepublicNumber of employed persons 2004 and 2012 from: http://apl.czso.cz/pll/
rocenka/rocenka.indexnu_en_satSources of funding 2009: Salamon, L. M., Sokolowski, S. W., Haddock, M., &
Tice, H. S. (2013). The state of global civil society and volunteering comparative nonprofit sector (Working Paper no. 49). Baltimore, MD: Johns Hopkins University, Center for Civil Society Studies. Figure 12: NPI revenue, by source, by country.
DenmarkFTE paid employment and volunteering, and sources of funding 2003 from:
Boje, T. P., Fridberg, T., & Ibsen, B. (2006). Den frivillige sektor i Danmark. Omfang og betydning (Rapport 06:19). København: Socialforskningsinstituttet. Retrieved from: http://www.sfi.dk/Admin/Public/DWSDownload.aspx?File=%2fFiles%2fFiler%2fSFI%2fPdf%2fRapporter%2f2006%2f0619_Den_frivillige_sektor.pdf
FTE paid employment and volunteering, and funding from donations 2013 from: Boje, T. P. (2016). Danmark NPO sektoren inøgletal—foreløbige tal for det nationale sample. Roskilde: Roskilde Universitet.
FranceFTE employment 2002: Kaminski, P. (2005). Table1. The NPS in France, 2002
(version INSEE). Le compte des Institutions Sans But Lucratif (ISBL) en France (Année 2002). Paris: l’Institut National de la Statistique et des Études Économiques (INSEE).
FTE employment 2013:Connaissance locale de l’appareil productif (CLAP) Caractéristiques des établissements au 31 décembre 2013. Paris: l’Institut National de la Statistique et des Études Économiques (INSEE).
Sources of funding 2005 and 2011: Tchernonog, V. (2013). Les associations entre crise et mutations: les grandes évolutions. Paris: Association pour le Développement des Données sur l’Economie Sociale(ADDES). Retrieved from: https://hal- paris1.archives-ouvertes.fr/halshs-00962135/fr/
GermanyData on full-time equivalent employment in the third sector in 2007 are from
the business register 2011. Thanks to Holger Krimmer, Head of civil society research at Stiftverband für die Deutsche Wissenschaft.
L. M. Salamon and W. Sokolowski
89
HungaryThe number of the employees of nonprofit organizations, 1993–2006 from:
Nagy, R., & Sebestény, I. (2009). Table A 10 in Methodological Practice and Practical Methodology: Fifteen Years in Nonprofit Statistics (Hungarian Statistical Review Special Number 12). Budapest: Hungarian Central Statistical Office. Retrieved from: http://www.ksh.hu/statreview
Volunteering 1995 for the whole third sector p. 308: Salamon, L. M., Anheier, H. K., List, R., Toepler, S., Sokolowski, S. W., & Associates. (1999). Global civil society. Dimensions of the nonprofit sector, Volume I. Baltimore, MD: The Johns Hopkins Center for Civil Society Studies.
ItalyNumber of employees and outworkers of active non-profit institutions and
sources of funding 2001 and 2011 retrieved from: ISTAT. (2014). Nonprofit institution profile based on 2011 census results. Rome: Istituto nazionale di statistica. Retrieved from http://www.istat.it/en/files/2014/10/Nonprofit-Institution-Profile-based-on-2011-Census-results_EN_definitivo.pdf?title=Nonprofit+institutions+profile+-+9+Oct+2014+-+Full+text.pdf; http://dati-censimentoindustriaeservizi.istat.it
NetherlandsFTE paid employment and volunteering, and sources of funding 2002 from:
Dekker, P., & Kuhry, B. (2007). CNP Data Master for the Netherlands 2002. Personal communication.
NorwayFTE employment 2006 and 2013 from: Statistisk sentralbyrå. (2015).
Table 08520: Full-time equivalent persons, by activity (ICNPO). Satellite account for non-profit institutions. Retrieved from https://ssb.no/orgsat
PolandFTE paid employment 2012: Wilk, R., Knapp, A., & Borysiak, K. (2014).
Ekonomiczny wymiar działalności badanych organizacji (The economic dimension of the activities of the organizations). In K. Goś-Wójcicka (Ed.), Trzeci Sektor w Polsce: Stowarzyszenia, fundacje, społeczne podmioty wyznaniowe, organizacje samorządu zawodowego, gospodarczego i pracodawców w 2012 r (The third sector in Poland: associations, foundations, faith-based charities, professional and business associations, employers’ organizations in 2012). Warsaw: Central Statistical Office of Poland, pp. 104 & 106.
http://stat.gov.pl/obszary-tematyczne/gospodarka-spoleczna-wolontariat/gospodarka-spoleczna-trzeci-sektor/trzeci-sektor-w-polsce-stowarzyszenia-fundacje-spoleczne-podmioty-wyznaniowe-samorzad-zawodowy-i-gospodarczy-oraz-organizacje-pracodawcow-w-2012-r-,1,3.html?BHT-9530df09-411f-4044-a26e-8e451762e454.0
The Size and Composition of the European Third Sector
90
FTE volunteering: Volunteering 1995 for the whole third sector p. 328: Salamon, L. M., Anheier, H. K., List, R., Toepler, S., Sokolowski, S. W., & Associates. (1999). Global civil society. Dimensions of the nonprofit sector, Volume I. Baltimore, MD: The Johns Hopkins Center for Civil Society Studies.
table 5.5.9. p. 209, in Nałęcz, S. & Goś-Wójcicka, K. (Eds). (2012). Wolontariat w organizacjach i inne formy pracy niezarobkowej poza gospodarstwem domowym—2011 (Volunteering thorough organizations and other types of unpaid work outside own household—2011). Warsaw: Central Statistical Office of Poland.
Sources of funding 2012: table 4(5) Annex tables in Goś-Wójcicka, K. (Ed.) (2014). Trzeci sektor w Polsce: Stowarzyszenia, fundacje, społeczne podmioty wyznaniowe, organizacje samorządu zawodowego, gospodarczego i pracodawców w 2012 r (The third sector in Poland: Associations, foundations, faith-based charities, professional and business associations, employers’ organizations in 2012)
Thanks to Sławomir Nałęcz for help with sources and calculations.
PortugalNumber of employees 2002: Salamon, L. M., Sokolowski, S. W., & Associates
(Eds.). (2004). Portugal: Workforce, expenditures, and revenue data (2002). Baltimore: Johns Hopkins Center for Civil Society Studies. Retrieved from: http://ccss.jhu.edu/wp-content/plugins/download-monitor/download.php?id=Portugal_Data_2002.pdf
Number of employees and sources of funding 2006: Salamon, L. M., Sokolowski, S. W., Haddock, M., & Tice, H. S. (2012). Portugal: Portugal’s nonprofit sector in comparative context, 2006. Baltimore: Johns Hopkins Center for Civil Society Studies in collaboration with Instituto Nacional de Estatistica—INE. Retrieved from: http://ccss.jhu.edu/wp-content/plugins/download-monitor/download.php?id=Portugal_Comparative-Report_FINAL_4.2012.pdf
FTE paid employment 2010: Misericórdias, Fundações, Associações e outras OES Quadro 1.1—Principais indicadores por grupos de entidades da Economia Social (2010)
Welfare share of employment: (Ensino e Investigação, Saúde e Bem-Estar, Ação Social) Gráfico 1.2—Emprego remunerado na ES (ETC)
Instituto Nacional de Estatística. (2013). Conta Satélite da Economia Social 2010. Estatísticas oficiais. Lisboa: Instituto Nacional de Estatística, I.P. Retrieved from: https://www.ine.pt/ngt_server/attachfileu.jsp?look_parentBoui=157544893&att_display=n&att_download=y
Total FTE employment and welfare employment 2010 is missing in the ILOSTAT database. Source: Table A.4.17—Full-time equivalent employ-ment by industry (N.°; annual), Portuguese National Accounts—ESA2010, base 2011.
L. M. Salamon and W. Sokolowski

91
SpainNumber of employees 2008: Monzón, J. L. Las grandes cifras de la economía
social en España. Ámbito, entidades y cifras clave. Año 2008. Valencia: CIRIEC. Cuadro 2.38. Entidades singulares de la economía social. Año 2008; Cuadro 2.41. Asociaciones activas: empleados, voluntarios y gastos por actividad; Cuadro 2.46. Fundaciones privadas al servicio de los hogares activas por actividad principal. Año 2008
Systeme Innovación y Consultoría. (2015). The third sector of social action in 2015: Impact of the crisis (Executive summary) Madrid: Plataforma de ONG de Acción Social/Plataforma Tercer Sector. Retrieved from: http://www.plataformaong.org/ciudadaniaactiva/tercersector/executive_summary_TSSA_in_2015_impact_of_t he_crisis.pdf
There is no data on total nonprofit employment in 2013. It is estimated by adding the number of non-welfare employees in 2008 to the welfare employees from 2013. The assumption is that non-welfare employment has been on the same level in real numbers, while the data shows that the welfare employment has increased. This means that Spain has had a decrease in non-welfare employment from 1995 to 2013 of −0.53 percentage points per year, while total NPO employment has increased by 0.11 percentage points per year due to documented welfare growth. If growth had been estimated by using 2008 data, the decrease in non-welfare employment would have been −0.81 and total NPO employment would have decreased by −1.17 percentage points per year. This would seem to be a too strong decline given the recent growth in welfare employment. In addition, total employment has declined in real numbers from 2008 to 2013, which further increases the share of the NPO sector. On the welfare field, the NPO employment has increased fast while the total employment has grown slightly in health and social services from 2008 to 2013.
Volunteering data for 2008 seem to be not comparable (number of volunteers, not FTE?).
Volunteering 1995 for the whole third sector p. 166: Salamon, L. M., Anheier, H. K., List, R., Toepler, S., Sokolowski, S. W., & Associates. (1999). Global civil society. Dimensions of the nonprofit sector, Volume I. Baltimore, MD: The Johns Hopkins Center for Civil Society Studies.
SwedenNumber of employees 1992: Lundström, T., & Wijkström, F. (1997). The
nonprofit sector in Sweden. Manchester: Manchester University Press.Number of employees 2000 for NPO welfare: Sveriges officiella statistik. (2009).
Table 15. Sysselsatta fördelat på verksamheter och kön år 2007, in Finansiärer och utförare inom vård, skola och omsorg 2007 (Sveriges Oficiella Statistik, Serie Offentlig ekonomi OE 29 SM 0901): Statistiska centralbyrån. Retrieved from: http://www.scb.se/Statistik/OE/OE0112/2007A01/OE0112_2007A01_SM_OE29SM0901.pdf
The Size and Composition of the European Third Sector

92
Number of employees 2002 for the nonprofit sector: Wijkström, F., & Einarsson, T. (2006). Från nationalstat til näringsliv. Det civila samhällets organisasjonsliv i förändring (Rapport. Stockholm: Ekonomiska Forskningsinstitutet, Handelshögskolan i Stockholm).
FTE volunteering 2005: Olsson, Lars-Erik, Lars Svedberg & Eva Jeppson Grassman (2006), Medborgarnas insatser och engagemang i civilsamhället—några grundläggande uppgifter från en ny befolkningsstudie. Arbetsrapportserie nr 39. Sköndal: Sköndalsinstitutet.
Number of employees 2013 for the nonprofit sector: Statistics Sweden. (2015). Tabell 13. Sektorindelad statistik över det civila samhället, 2013. The Civil Society 2013—Satellite accounts and surveys. Örebro: Statistics Sweden. Retrieved from: http://www.scb.se/Statistik/_Publikationer/NV0117_2013A01_BR_X105BR1501.pdf
Number of employees 2013 for the nonprofit welfare services: Sveriges officiella statistik. (2015). Table 13: Employment within education, health care and social services 2000, 2008–2013. Finansiärer och utförare inom vård, skola och omsorg 2013: Statistiska centralbyrån. Retrieved from: http://www.scb.se/Statistik/OE/OE0112/2013A01/OE0112_2013A01_SM_OE29SM1501.pdf
Sources of funding for the nonprofit sector 2007: Sveriges officiella statistik. (2009). Table 1-3 in Finansiärer och utförare inom vård, skola och omsorg 2007: Statistiska centralbyrån. Retrieved from: http://www.scb.se/sv_/Hitta-statistik/Publiceringskalender/Visa-detaljerad-information/?W=serie&publobjid=11229There is only information about income for market producing nonprofit units.
Sources of funding for the nonprofit sector 2013: Statistics Sweden. (2015). Tabell 10. Transfereringsinkomster per verksamhet enligt ICNPO, 2013 in The Civil Society 2013—Satellite accounts and surveys. Örebro: Statistics Sweden. Retrieved from: http://www.scb.se/Statistik/_Publikationer/NV0117_2013A01_BR_X105BR1501.pdf
SwitzerlandFTE employment and sources of funding for 2005: Helmig, B., Gmür, M.,
Bärlocher, C., von Schnurbein, G., Degen, B., Nollert, M., Salamon, L. M. (2011). The Swiss Civil Society sector in a comparative perspective (VMI Research Series Volume 6). Fribourg: Institute for Research on Management of Associations, Foundations and Cooperatives (VMI), University of Fribourg. Retrieved from: http://www.vmi.ch/de/165-vmi_forschungsreihe.html
References
Banfield, E. (1958). The moral basis of a backward society. New York: Free Press.Fukuyama, F. (1995). Trust: The social virtues and the creation of prosperity.
New York: Free Press.
L. M. Salamon and W. Sokolowski
93
Hansmann, H. (1987). Economic theories of nonprofit organizations. In W. W. Powell (Ed.), The nonprofit sector: A research handbook (pp. 27–42). New Haven: Yale University Press.
ISTAT. (2014). Nonprofit institution profile based on 2011 census results. Rome: Istituto nazionale di statistica. Retrieved from http://www.istat.it/en/files/2014/10/Nonprofit-Institution-Profile-based-on-2011-Census-results_EN_definitivo.pdf?title=Nonprofit+institutions+profile+-+9+Oct+2014+-+Full+text.pdf
Kaminski, P. (2005). Table1. The NPS in France, 2002 (version INSEE). Le compte des Institutions Sans But Lucratif (ISBL) en France (Année 2002). Paris: l’Institut National de la Statistique et des Études Économiques (INSEE).
Lijphart, A. (1999). Patterns of democracy: Government forms and performance in thirty six countries. New Haven: Yale University Press.
Monzón Campos, J. L., & Ávila, R. C. (2012). The social economy in the European Union. Brussels: European Economic and Social Committee.
Nagy, R., & Sebestény, I. (2009). Table A 10 in methodological practice and practical methodology: Fifteen years in nonprofit statistics (Hungarian Statistical Review Special Number 12). Budapest: Hungarian Central Statistical Office. Retrieved from http://www.ksh.hu/statreview
Putnam, R. D. (1993). Making democracy work: Civic traditions in modern Italy. Princeton, NJ: Princeton University Press.
Salamon, L. M. (2014a). Leverage for good: An introduction to the new frontiers of philanthropy and social investment. New York: Oxford University Press.
Salamon, L. M. (2014b). The new frontiers of philanthropy: A guide to the new actos and tools reshaping global philanthropy and social investment. Oxford: Oxford University Press.
Salamon, L. M., Sokolowski, S. W., & Associates (Eds.). (2004). Global civil society: Dimensions of the nonprofit sector (Vol. II). Bloomfield, CT: Kumarian Press.
Salamon, L. M., Sokolowski, S. W., & Haddock, M. A. (2017). Explaining civil society development: A social origins approach. Baltimore: Johns Hopkins University Press.
Sivesind, K.-H., & Selle, P. (2010). Civil society in the Nordic countries: Between displacement and vitality. In R. Alapuro & H. Stenius (Eds.), Nordic associations in a European perspective (pp. 89–120). Baden-Baden: Nomos.
United Nations Statistics Division. (2003). Handbook on non-profit institutions in the system of national accounts. New York: United Nations.
Weisbrod, B. A. (1977). The voluntary nonprofit sector. Lexington, MA: D.C. Heath.
The Size and Composition of the European Third Sector
94
Open Access This chapter is distributed under the terms of the Creative Commons Attribution 4.0 International License (http://creativecommons.org/licenses/by/4.0/), which permits use, duplication, adaptation, distribution and reproduction in any medium or format, as long as you give appropriate credit to the original author(s) and the source, a link is provided to the Creative Commons license and any changes made are indicated.
The images or other third party material in this chapter are included in the work’s Creative Commons license, unless indicated otherwise in the credit line; if such material is not included in the work’s Creative Commons license and the respective action is not permitted by statutory regulation, users will need to obtain permission from the license holder to duplicate, adapt or reproduce the material.
L. M. Salamon and W. Sokolowski
![[300-1-2]-1955-3976 · 2012. 12. 20. · Xaždy pracuáacy mie*siažeczke pracy. DO kBiQŽeczk$ ( over) NO. '9.76155 zapisuje sie czas pracy, przyjecie zwòlnienie z pracy. Ksi4Žecz—](https://static.fdocuments.in/doc/165x107/60a65d0a838cb902ca6bb48c/300-1-2-1955-3976-2012-12-20-xady-pracuacy-miesiaeczke-pracy-do-kbiqeczk.jpg)