The Sixth Carbon Budget Buildings
79
The Sixth Carbon Budget Buildings
Transcript of The Sixth Carbon Budget Buildings
1
The Sixth Carbon Budget
Buildings

2
This document contains a summary of content for the buildings sector from the
CCC’s Sixth Carbon Budget Advice, Methodology and Policy reports.
3
The Committee is advising that the UK set its Sixth Carbon Budget (i.e. the legal limit
for UK net emissions of greenhouse gases over the years 2033-37) to require a
reduction in UK emissions of 78% by 2035 relative to 1990, a 63% reduction from
2019. This will be a world-leading commitment, placing the UK decisively on the
path to Net Zero by 2050 at the latest, with a trajectory that is consistent with the
Paris Agreement.
Our advice on the Sixth Carbon Budget, including emissions pathways, details on
our analytical approach, and policy recommendations for the buildings sector is
presented across three CCC reports, an accompanying dataset, and supporting
evidence.
• An Advice report: The Sixth Carbon Budget – The UK’s path to Net Zero,
setting out our recommendations on the Sixth Carbon Budget (2033-37)
and the UK’s Nationally Determined Contribution (NDC) under the Paris
Agreement. This report also presents the overall emissions pathways for the
UK and the Devolved Administrations and for each sector of emissions, as
well as analysis of the costs, benefits and wider impacts of our
recommended pathway, and considerations relating to climate science
and international progress towards the Paris Agreement. Section 2 of
Chapter 3 contains an overview of the emissions pathways for the buildings
sector.
• A Methodology Report: The Sixth Carbon Budget – Methodology Report,
setting out the approach and assumptions used to inform our advice.
Chapter 3 of this report contains a detailed overview of how we
conducted our analysis for the buildings sector.
• A Policy Report: Policies for the Sixth Carbon Budget and Net zero , setting
out the changes to policy that could drive the changes necessary
particularly over the 2020s. Chapter 3 of this report contains our policy
recommendations for the buildings sector.
• A dataset for the Sixth Carbon Budget scenarios, which sets out more
details and data on the pathways than can be included in this report.
• Supporting evidence including our public Call for Evidence, 10 new
research projects, three expert advisory groups, and deep dives into the
roles of local authorities and businesses.
All outputs are published on our website (www.theccc.org.uk).
For ease, the relevant sections from the three reports for each sector (covering
pathways, method and policy advice) are collated into self-standing documents
for each sector. A full dataset including key charts is also available alongside this
document. This is the self-standing document for the buildings sector. It is set out in
three sections:
1) The approach to the Sixth Carbon Budget analysis for the buildings sector
2) Emissions pathways for the buildings sector
3) Policy recommendations for the buildings sector
The approach to the Sixth Carbon
Budget analysis for the buildings
sector
1. Current and historical emissions in buildings 6
2. Options for reducing emissions 9
3. Approach to analysis for the Sixth Carbon Budget advice 18
5
Introduction and key messages The following sections are taken directly from Chapter 3 of the CCC’s
Methodology Report for the Sixth Carbon Budget.1
This chapter sets out the method for the buildings sector Sixth Carbon Budget
pathways.
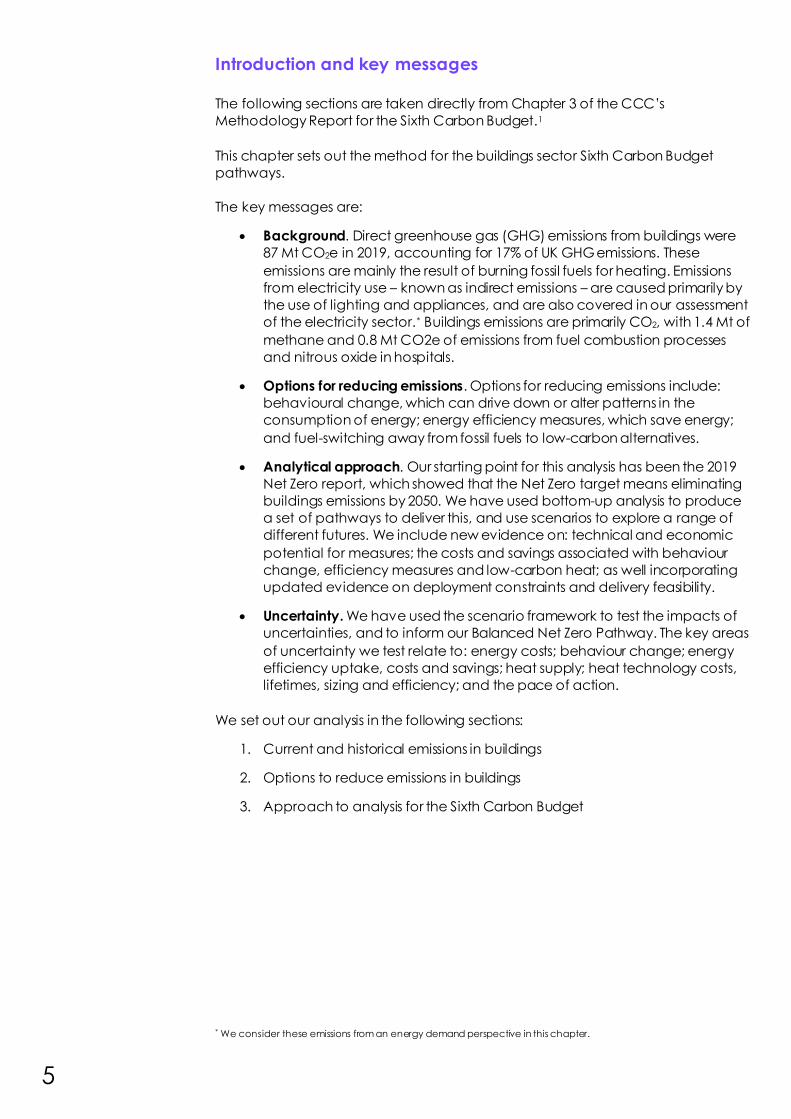
The key messages are:
• Background. Direct greenhouse gas (GHG) emissions from buildings were
87 Mt CO2e in 2019, accounting for 17% of UK GHG emissions. These
emissions are mainly the result of burning fossil fuels for heating. Emissions
from electricity use – known as indirect emissions – are caused primarily by
the use of lighting and appliances, and are also covered in our assessment
of the electricity sector.* Buildings emissions are primarily CO2, with 1.4 Mt of
methane and 0.8 Mt CO2e of emissions from fuel combustion processes
and nitrous oxide in hospitals.
• Options for reducing emissions. Options for reducing emissions include:
behavioural change, which can drive down or alter patterns in the
consumption of energy; energy efficiency measures, which save energy;
and fuel-switching away from fossil fuels to low-carbon alternatives.
• Analytical approach. Our starting point for this analysis has been the 2019
Net Zero report, which showed that the Net Zero target means eliminating
buildings emissions by 2050. We have used bottom-up analysis to produce
a set of pathways to deliver this, and use scenarios to explore a range of
different futures. We include new evidence on: technical and economic
potential for measures; the costs and savings associated with behaviour
change, efficiency measures and low-carbon heat; as well incorporating
updated evidence on deployment constraints and delivery feasibility.
• Uncertainty. We have used the scenario framework to test the impacts of
uncertainties, and to inform our Balanced Net Zero Pathway. The key areas
of uncertainty we test relate to: energy costs; behaviour change; energy
efficiency uptake, costs and savings; heat supply; heat technology costs,
lifetimes, sizing and efficiency; and the pace of action.
We set out our analysis in the following sections:
1. Current and historical emissions in buildings
2. Options to reduce emissions in buildings
3. Approach to analysis for the Sixth Carbon Budget
* We consider these emissions from an energy demand perspective in this chapter.
6
1. Current and historical emissions in buildings
Direct greenhouse gas emissions from buildings were 87 MtCO2e in 2019, around
17% of the UK total.2 Including indirect emissions, buildings account for 23% of the
UK total (Figure M3.1):3
• Direct building CO₂ emissions. These were 85 MtCO₂ in 2019, split between
homes (77%), commercial buildings (14%) and public buildings (9%).4 Direct
emissions in buildings result primarily from the use of fossil fuels for heating.
Around 74% of the UK’s heating and hot water demand in buildings is met
by natural gas, and 10% by petroleum,† with smaller amounts of other fuels
such as coal and biomass.5
• Indirect building emissions. Buildings are responsible for 59% of UK electricity
consumption,‡ equivalent to a further 31 MtCO₂e of indirect emissions.6
Most electricity use (counted as indirect emissions) stems from appliances
and lighting in homes, and cooling, catering and ICT equipment in non-
residential buildings.
• Non-CO2. Around 1.4 MtCO₂e of methane and 0.8 MtCO2e of nitrous oxide
emissions were associated with buildings in 2019.7 The use of nitrous oxide as
an anaesthetic accounts for just under 0.6 MtCO2e of these emissions.
Other non-CO2 emissions are produced by fuel combustion processes.
† Includes heating oil and LPG.
‡ Including a proportional share of intermediate consumption in the power sector.
Buildings emissions mainly stem from burning fossil fuels for heating.

7
Figure M3.1 Breakdown of buildings sector GHG emissions (2019)
Source: National Atmospheric Emissions Inventory (2020) Breakdown of UK GHG emissions by source and
greenhouse gas; BEIS (2020) DUKES, Electricity: commodity balances (DUKES 5.1).
8
a) Trends and drivers
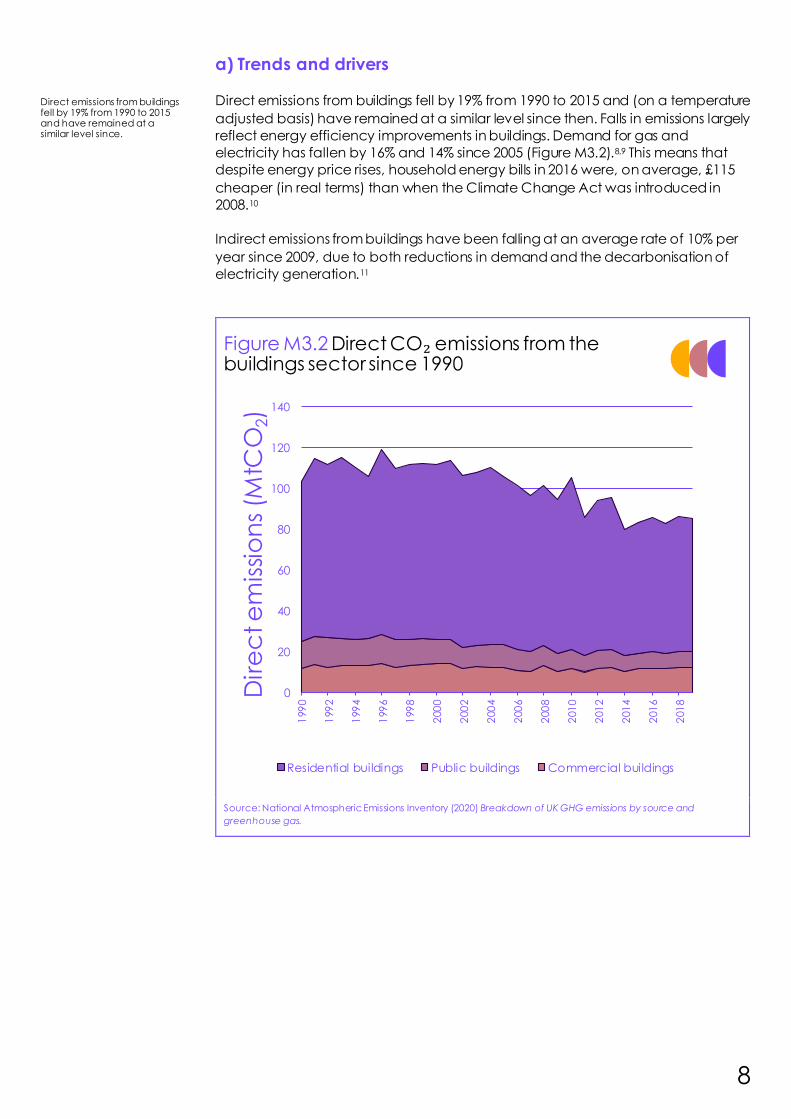
Direct emissions from buildings fell by 19% from 1990 to 2015 and (on a temperature
adjusted basis) have remained at a similar level since then. Falls in emissions largely
reflect energy efficiency improvements in buildings. Demand for gas and
electricity has fallen by 16% and 14% since 2005 (Figure M3.2).8,9 This means that
despite energy price rises, household energy bills in 2016 were, on average, £115
cheaper (in real terms) than when the Climate Change Act was introduced in
2008.10
Indirect emissions from buildings have been falling at an average rate of 10% per
year since 2009, due to both reductions in demand and the decarbonisation of
electricity generation.11
Figure M3.2 Direct CO₂ emissions from the buildings sector since 1990
Source: National Atmospheric Emissions Inventory (2020) Breakdown of UK GHG emissions by source and
greenhouse gas.
Direct emissions from buildings fell by 19% from 1990 to 2015 and have remained at a similar level since.
0
20
40
60
80
100
120
140
199
0
199
2
199
4
199
6
199
8
200
0
200
2
200
4
200
6
200
8
201
0
201
2
201
4
201
6
201
8
Dir
ec
t e
mis
sio
ns
(MtC
O2)
Residential buildings Public buildings Commercial buildings
9
2. Options for reducing emissions
In the buildings sector, there are opportunities for emission reductions in four main
areas: behaviour change, increasing the energy efficiency of the building stock,
improving the energy efficiency of lighting and electrical appliances, and
switching away from fossil-fuel based heat.
In general, switching to efficient electric systems now delivers the largest readily
available savings. These savings will grow steadily as the power sector continues to
rapidly decarbonise.
a) Behaviour change
i) Residential buildings
There is significant potential to deliver emissions savings, just by changing the way
we use our homes. Our Balanced Pathway for residential buildings finds that
behaviour change can deliver operational cost savings in the region of £0.4 billion
a year by 2050 (Box M3.1) and greater savings may well be possible.
Where homes are sufficiently well insulated, it is possible to pre-heat ahead of peak
times, enabling access to cheaper tariffs which reflect the reduced costs
associated with running networks and producing power during off-peak times. This
means that pre-heating in particular can play an important role when switching to
smart, flexible electric heating such as heat pumps with smart controls. If all homes
with heat pumps pre-heated their homes, it would save an estimated £2 billion a
year in a highly electrified scenario.§
Box M3.1
Behaviour change evidence and assumptions in homes
There is a range of steps we can take to reduce and manage energy use in our homes,
saving on both emissions and bills. We examine the following range of measures across
our scenarios:
• Turning off lights: We assume that turning off lights when not in use can deliver annual
electricity savings of 0.4 TWh by 2035. However this is dwarfed by the 5.4 TWh saved by
deploying more energy efficient lighting in our scenarios relative to today.
• Pre-heating: Where homes are sufficiently well insulated, it is possible to pre-heat ahead of peak times. This enables access to cheaper tariffs which reflect the reduced
costs associated with producing power off-peak and reducing requirements for
network reinforcement to manage peak loads. Our scenarios assume that all new
homes and between 25-50% of post-1952 homes can pre-heat, shifting their space heating consumption up to 4 hours ahead of peak and enabling access to cheaper
energy prices as a result.12
• Smarter heating management and use: We assume a 3-6% reduction in heat demand
can be achieved through more informed and smarter management of heating in
existing homes. Smart meters and real time displays have been found to result in
energy savings of around 3%, driven by associated actions such as turning the
thermostat down or reducing the amount of time the heating is on.13
§ CCC analysis drawing on Imperial (2018) Analysis of alternative heat decarbonisation pathways and based on the
electrification scenario. We have made a conservative assumption in our Balanced Pathway and only assume that
25% of eligible existing homes (post-1952 homes) pre-heat. The number of homes with potential to pre-heat would
be expected to be higher after insulation is applied.
Our analysis includes new evidence on pre-heating homes, smart heating management, hot water use and new business models such as heat-as-a-service propositions.
Opportunities to reduce emissions exist in four main areas: behaviour change, fabric energy efficiency, energy efficiency of lighting and appliances and switching away from fossil-fuel based heat.
10
• There is evidence that multizone control can drive higher savings – we make a
conservative assumption that 6% heat demand savings can be realised through
multizone control on the basis of analysis undertaken by the Energy System Catapult.**14 However, there is evidence to suggest the savings could be much
higher.††,15 Public Health England recommend that homes should be heated to a
minimum temperature of 18°C, with Age UK recommending the main living space in a
home is heated to 21°C.16
• Low-flow shower heads: We assume widespread use of low flow shower heads across
our scenarios, delivering a 5% reduction in heat demand.17 These are also an important adaptation measure to prepare for the impacts of climate change, which
will increase water stress in the UK.
• Hot water temperature: For the majority of our scenarios we assume a constant 60°C
hot water temperature in existing homes. In our Widespread Engagement scenario,
we assume a 50°C water temperature in homes with heat pumps, with allowance for
a daily legionella cycle of one-hour duration. The Health and Safety Executive is currently undertaking work with the Chartered Institution of Building Services Engineers
to look at guidance for low-temperature systems to manage legionella risk.
• Water softening: Build-up of limescale in a home’s central heating system due to hard
water can reduce the efficiency of heating systems. We therefore include measures
for water softening in our scenarios.18
• Heat as a service: The Energy Systems Catapult has published evidence suggesting
that guarantees around comfort levels and costs of heating could increase the
consumer acceptability of low-carbon heat.19 ‘Heat as a service’ delivery models can provide this, and involve consumers purchasing service bundles or ‘outcomes’ from
providers (such as a certain number of warm hours) in place of kWhs of fuel. In our
Widespread Innovation and Tailwinds scenarios, we assume that the heat-as-a-service
delivery model proliferates in existing homes. Based on engagement with a range of stakeholders, we assume that this delivery model can be associated with 3% financial
savings20 and a 15% increase in heat pump efficiency resulting from better installation
and operation. We also assume that it is associated with a 7.5% commercial cost of
capital and a 5% increase in energy consumption (reflecting losses associated with
shifting time of use).21
Source: CCC analysis; Element Energy for the CCC (2020) Development of trajectories for
residential heat decarbonisation to inform the Sixth Carbon Budget.
ii) Public and commercial buildings
Evidence for both behaviour change and energy efficiency potential for non-
residential buildings has been drawn from the Building Energy Efficiency Survey
(BEES).22 These two categories of measures have not explicitly been separated in
our analysis. BEES includes a number of measures with a strong behavioural aspect,
for example, improved energy management, awareness campaigns and training
and procurement practices.
** The majority of UK homes rely on a single room thermostat, located in a hall or living room, to control the temperature
in the home. This often overrides local control by thermostatic radiator valves, causing underheating or over-
heating. Multi-zone control uses digital wireless technology to enable temperature to be controlled using a
thermostat and managed radiator control in each individual room, facilitating improved temperature
management.
†† Research by the Energy Systems Catapult suggests gas usage reductions of up to 20% are possible, and research by
Loughborough University suggests an aggregate saving of around 12% for the UK.
11
b) Efficiency
i) Residential buildings
Our scenarios examine the role a wide range of energy efficiency measures can
play in reducing energy use in homes. We look at the potential for savings resulting
from improving the efficiency of lighting in homes, and from the purchase of more
efficient appliances.
For fabric energy efficiency in new homes, our scenarios build on the
recommendations made by the CCC in our 2019 report UK housing: Fit for the
future?, and assume ultra-high standards of energy efficiency in new homes from
2025 at the latest, delivered through measures such as triple glazing and high levels
of airtightness.23 We note that Government has signalled that they will bring
forward the date of introduction to 2023, in line with our advice.24
For existing homes, we deploy measures such as loft, floor and wall insulation
across our scenarios, as well as modelling low cost measures such as draught
proofing and hot water tank insulation. Our Sixth Carbon Budget analysis i s based
on a comprehensive update of evidence, to underpin our modelling of energy
efficiency retrofits (Box M3.2). This starts with the real-world performance of
measures in homes, adjusted to reflect some closure of the performance gap.‡‡
Previously, our Fifth Carbon Budget analysis was based primarily on a modelled
assessment of performance, with adjustment factors applied.25
Measures to address thermal efficiency, overheating, indoor air quality and
moisture must be considered together when retrofitting or building new homes. We
therefore also examine illustrative cost ranges for shading and ventilation measures
in addition to our scenarios. See Chapter 3 of our Advice Report for further
discussion.
‡‡ Regulations and monitoring metrics are focussed substantially on the modelled performance of dwellings as
designed, rather than their actual performance 'as-built'. There is a large body of evidence which points to a
substantial gap between the two. This is the 'performance gap'.
12
Box M3.2
New evidence on fabric energy efficiency in existing homes
We have updated our energy efficiency assumptions in four key areas, relative to our
previous work: technical potential, range of measures, costs, and savings. Our updated
assumptions around costs and savings draw on a comprehensive assessment of the latest
available evidence, undertaken by University College London.26
• Technical and economic potential: We have updated our assessment of the technical and economic potential for fabric energy efficiency measures in the UK housing stock,
based on the latest Government statistical releases, data from housing surveys, and
research on the prevalence of non-standard cavity walls and lofts.§§,27 Despite some
progress having been made in insulation installations, the assessment has led to an overall increase in the assumed technical potential for lofts and cavities relative to the
Fifth Carbon Budget. Amongst other changes, the latest assessment reflects new
evidence from the National House Building Council that 72% of homes built from 1991-
1995 were built with unfilled cavity walls (previously assumed to be insulated).28 While technical potential for cavities and lofts has increased, our assessment of economic
potential has remained broadly similar (Table B3.2). Our assessment of economic
potential is informed by new evidence on the prevalence and cost of treating non-
standard cavity walls and lofts.
• Range of measures: We have updated the range of energy efficiency measures
modelled relative to our work for the Fifth Carbon Budget and Net Zero report. Key changes include the incorporation of new and emerging evidence on the costs and
performance of thin internal wall insulation, and a first step in modelling deep whole
house retrofits.29
We have also separately modelled ranges of costs which could be associated with
delivering ventilation and overheating measures to accompany our scenarios, necessary
as part of a holistic approach to retrofit (Box 3.2.a, Sixth Carbon Budget Advice Report).
• Energy savings associated with measures: UCL’s assumptions for the savings
associated with measures are drawn primarily from the Government’s National Energy
Efficiency Data (NEED) Framework.30 The data framework matches gas and electricity annualised meter data, with data on energy efficiency measures installed in homes
from the Homes Energy Efficiency Database (HEED), Green Deal, the Energy
Company Obligation (ECO) and the Feed-in Tariff scheme. The results are then
weighted to produce statistics representative of the whole housing stock. While real world performance data are expected to improve the accuracy of modelling, they
are representative of past and current practice and therefore have the potential to
underestimate the future performance of measures where improvements are
delivered in installation practices and use. Our scenarios are predicated on best-practice delivery and we therefore assume some uplifts to savings associated with
closing the performance gap, modelled as uplifts based on in-use factors.31
• Costs associated with measures: UCL’s cost assumptions draw on the latest available
evidence, including the ‘What does it cost to retrofit homes?’ research undertaken by
Cambridge Architectural Research for BEIS, and research from the Energy Savings Trust
on the costs of insulating non-standard cavities and lofts.32 This has been supplemented with evidence on supplementary costs such as scaffolding and survey
and design, and by additional evidence from field trials, case study data and
discussions with retrofit professionals (Table B3.2).
While assumptions draw on the best available evidence, there remains uncertainty over
the costs and savings associated with measures. Importantly, energy efficiency must be
viewed in the context of the substantial wider benefits which can be delivered (discussed
further in Chapter 3 of the Sixth Carbon Budget Advice Report).
§§ Technical potential represents the number of measures which could technically be applied across the UK stock.
Economic potential represents a subset, examining only those measures deemed to be deliverable at reasonable
cost. We generally excluded measures from our economic potential where costs came in above £700/tCO2e for a
typical home (assumed to be a medium semi-detached home, scaffolding and design costs not included in
calculations for economic potential). Some non-standard lofts and cavities were excluded on this basis and our
economic potential includes only the following non-standard categories: standard lofts with access issues, cavity
walls in concrete dwellings, cavity walls with conservatories, narrow cavities, and high cavity walls. Glazing is not
modelled, apart from in deep retrofits, but current rates of upgrade would be assumed to continue.
We also draw on new evidence of the technical potential, costs and performance of efficiency measures in the home. This is based on the National Energy Efficiency Database which looks at the impact of measures which have been installed to date.
13
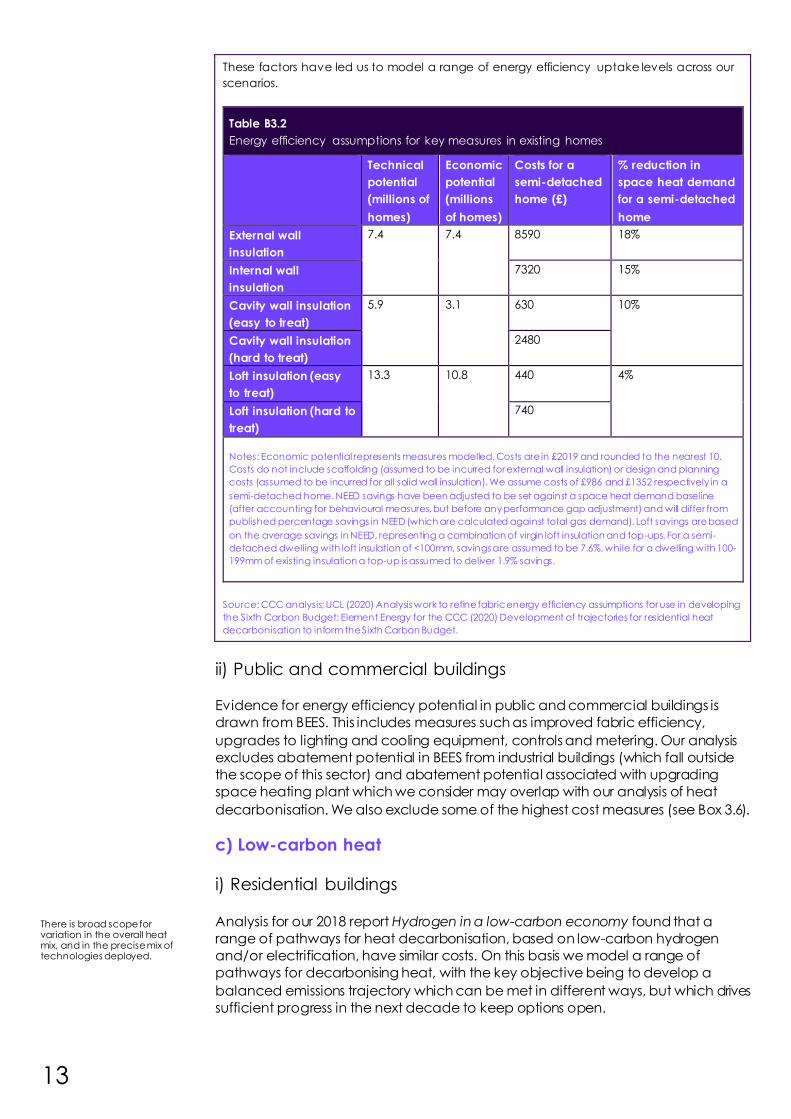
These factors have led us to model a range of energy efficiency uptake levels across our
scenarios.
Table B3.2
Energy efficiency assumptions for key measures in existing homes
Technical
potential
(millions of
homes)
Economic
potential
(millions
of homes)
Costs for a
semi-detached
home (£)
% reduction in
space heat demand
for a semi-detached
home
External wall
insulation
7.4 7.4 8590 18%
Internal wall
insulation
7320 15%
Cavity wall insulation
(easy to treat)
5.9 3.1 630 10%
Cavity wall insulation
(hard to treat)
2480
Loft insulation (easy
to treat)
13.3 10.8 440 4%
Loft insulation (hard to
treat)
740
Notes: Economic potential represents measures modelled. Costs are in £2019 and rounded to the nearest 10.
Costs do not include scaffolding (assumed to be incurred for external wall insulation) or design and planning
costs (assumed to be incurred for all solid wall insulation). We assume costs of £986 and £1352 respectively in a
semi-detached home. NEED savings have been adjusted to be set against a space heat demand baseline
(after accounting for behavioural measures, but before any performance gap adjustment) and will differ from
published percentage savings in NEED (which are calculated against total gas demand). Loft savings are based
on the average savings in NEED, representing a combination of virgin loft insulation and top-ups. For a semi-
detached dwelling with loft insulation of <100mm, savings are assumed to be 7.6%, while for a dwelling with 100-
199mm of existing insulation a top-up is assumed to deliver 1.9% savings.
Source: CCC analysis; UCL (2020) Analysis work to refine fabric energy efficiency assumptions for use in developing
the Sixth Carbon Budget; Element Energy for the CCC (2020) Development of trajectories for residential heat
decarbonisation to inform the Sixth Carbon Budget.
ii) Public and commercial buildings
Evidence for energy efficiency potential in public and commercial buildings is
drawn from BEES. This includes measures such as improved fabric efficiency,
upgrades to lighting and cooling equipment, controls and metering. Our analysis
excludes abatement potential in BEES from industrial buildings (which fall outside
the scope of this sector) and abatement potential associated with upgrading
space heating plant which we consider may overlap with our analysis of heat
decarbonisation. We also exclude some of the highest cost measures (see Box 3.6).
c) Low-carbon heat i) Residential buildings
Analysis for our 2018 report Hydrogen in a low-carbon economy found that a
range of pathways for heat decarbonisation, based on low-carbon hydrogen
and/or electrification, have similar costs. On this basis we model a range of
pathways for decarbonising heat, with the key objective being to develop a
balanced emissions trajectory which can be met in different ways, but which drives
sufficient progress in the next decade to keep options open.
There is broad scope for variation in the overall heat mix, and in the precise mix of technologies deployed.
14
There is broad scope for variation in the overall heat mix, and in the precise mix of
technologies deployed. Our scenarios include illustrative mixes of a wide range of
technologies, including low-carbon district heat networks (Box M3.4), air source
heat pumps (ASHPs) and ground source heat pumps (GSHPs), resistive and storage
heating, solar thermal, and hydrogen technologies including hydrogen boilers and
hydrogen hybrid heat pumps. We also model thermal storage in homes.
Our assessment of the economy-wide best use of biomass indicates that use in
buildings should be minimised as far as possible.33 Some scenarios exclude a role
for biofuels. Others include a limited role, restricted to use in hybrid configurations
alongside heat pumps in the hardest-to-heat off-gas homes, such that biofuels
provide a back-up role in meeting peak demands on the coldest winter days.***
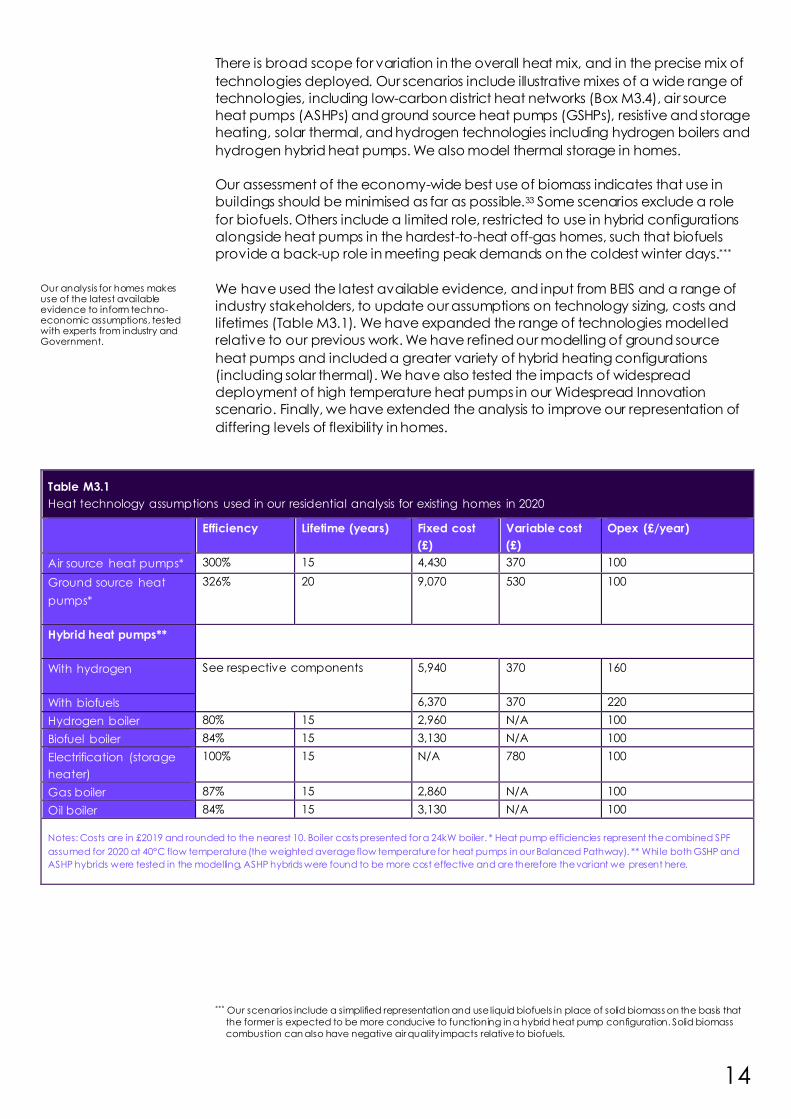
We have used the latest available evidence, and input from BEIS and a range of
industry stakeholders, to update our assumptions on technology sizing, costs and
lifetimes (Table M3.1). We have expanded the range of technologies modelled
relative to our previous work. We have refined our modelling of ground source
heat pumps and included a greater variety of hybrid heating configurations
(including solar thermal). We have also tested the impacts of widespread
deployment of high temperature heat pumps in our Widespread Innovation
scenario. Finally, we have extended the analysis to improve our representation of
differing levels of flexibility in homes.
Table M3.1
Heat technology assumptions used in our residential analysis for existing homes in 2020
Efficiency Lifetime (years) Fixed cost
(£)
Variable cost
(£)
Opex (£/year)
Air source heat pumps* 300% 15 4,430 370 100
Ground source heat
pumps*
326% 20 9,070 530 100
Hybrid heat pumps**
With hydrogen See respective components 5,940 370 160
With biofuels 6,370 370 220
Hydrogen boiler 80% 15 2,960 N/A 100
Biofuel boiler 84% 15 3,130 N/A 100
Electrification (storage
heater)
100% 15 N/A 780 100
Gas boiler 87% 15 2,860 N/A 100
Oil boiler 84% 15 3,130 N/A 100
Notes: Costs are in £2019 and rounded to the nearest 10. Boiler costs presented for a 24kW boiler. * Heat pump efficiencies represent the combined SPF
assumed for 2020 at 40°C flow temperature (the weighted average flow temperature for heat pumps in our Balanced Pathway). ** Whi le both GSHP and
ASHP hybrids were tested in the modelling, ASHP hybrids were found to be more cost effective and are therefore the variant we present here.
*** Our scenarios include a simplified representation and use liquid biofuels in place of solid biomass on the basis that
the former is expected to be more conducive to functioning in a hybrid heat pump configuration. Solid biomass
combustion can also have negative air quality impacts relative to biofuels.
Our analysis for homes makes use of the latest available evidence to inform techno-economic assumptions, tested with experts from industry and Government.

15
Our Sixth Carbon Budget scenarios explore a range of decarbonisation routes for
public and commercial buildings, with a varying balance between electrification
and hydrogen. We see low-carbon district heat networks providing a significant
share of public and commercial heat demand and serving as key anchor loads for
networks. This is equivalent to around 22% by 2035 and 42% by 2050 in the majority
of our scenarios. Our analysis of district heating is based on a refresh of evidence
commissioned for our Fifth Carbon Budget analysis (Box M3.4). Our Widespread
Innovation scenario explores lower district heat deployment, with a higher share of
building level technologies.
Our analysis of building level heat is based on an illustrative selection of
technologies including air-to-air heat pumps, low temperature air-to-water heat
pumps, resistive electric heating and hydrogen boilers. Our energy and cost
analysis uses air source heat pumps as an illustrative example, but in practice a
wider range of technologies is available and could represent a part of the mix, for
example ground source heat pumps, high temperature air-to-water heat pumps,
hybrid heat pumps with biofuels, or in some limited cases, biomass boilers making
use of local biomass sources or biogenic wastes. As a principle however, we have
not included biomass boilers as a replacement technology for public or
commercial buildings over the Sixth Carbon Budget period, based on our view that
biomass resources could be better used as part of engineered removals or in other
sectors where alternatives are limited. This is a slightly different approach than in
homes, where there is a greater need for hybrid-based solutions, based on
stakeholder feedback.
Our assumptions on heat technology technical potential, efficiencies, lifetimes and
costs are primarily drawn from new research commissioned by BEIS for non-
residential buildings in England and Wales (Box M3.3). We apply the evidence
drawn from this study to UK heat demand in our analysis. Assumptions on capacity
and load factors are mainly drawn from our Fifth Carbon Budget analysis.
Box M3.3
New evidence on Heating, Ventilation and Air Conditioning (HVAC) technologies in non-
domestic buildings
This study was commissioned by BEIS to determine the potential across England and
Wales to reduce carbon emissions by implementing low-carbon space heating, hot
water, ventilation and cooling (HVAC) technologies in non-domestic buildings. The study
provides an evidence base on the applicability and cost effectiveness of low -carbon
heat measures.
This study is based on data gathered in BEES on HVAC systems currently in the stock. A
framework for reinterpreting the BEES data and predicting the HVAC servicing
arrangements for each building within the BEES dataset was developed; resulting in the
records being categorised into a set of building ‘archetypes’ with common HVAC
characteristics.
Information on low-carbon HVAC system costs and performance was gathered through a
literature review (involving detailed review of 52 sources) and industry engagement
(including supply chain interviews and eight sub-sector deep dive interviews) to validate
the data collected and fill gaps. The evidence gathered was used in modelling to
quantify the potential to save carbon emissions from switching to low -carbon HVAC
technologies, mapping potential options to archetypes.
A validation process tested the findings with external experts, including engaging a panel
of experts through a project approach review workshop and commissioning an industry
expert for a detailed review of the modelling inputs and outputs.
We have drawn on new evidence commissioned by BEIS on the performance, cost and technical suitability of heating options in public and commercial buildings.
ii) Public and commercial buildings
16
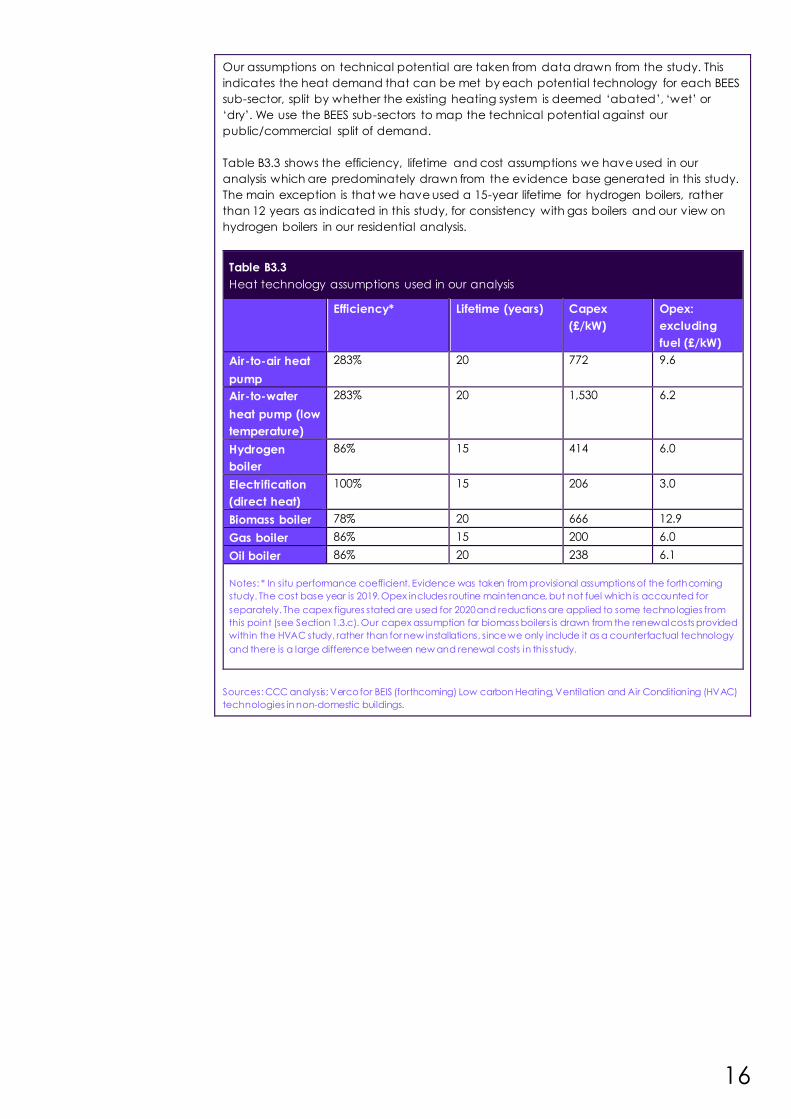
Our assumptions on technical potential are taken from data drawn from the study. This
indicates the heat demand that can be met by each potential technology for each BEES
sub-sector, split by whether the existing heating system is deemed ‘abated’, ‘wet’ or
‘dry’. We use the BEES sub-sectors to map the technical potential against our
public/commercial split of demand.
Table B3.3 shows the efficiency, lifetime and cost assumptions we have used in our
analysis which are predominately drawn from the evidence base generated in this study.
The main exception is that we have used a 15-year lifetime for hydrogen boilers, rather
than 12 years as indicated in this study, for consistency with gas boilers and our view on
hydrogen boilers in our residential analysis.
Table B3.3
Heat technology assumptions used in our analysis
Efficiency* Lifetime (years) Capex
(£/kW)
Opex:
excluding
fuel (£/kW)
Air-to-air heat
pump
283% 20 772 9.6
Air-to-water
heat pump (low
temperature)
283% 20 1,530 6.2
Hydrogen
boiler
86% 15 414 6.0
Electrification
(direct heat)
100% 15 206 3.0
Biomass boiler 78% 20 666 12.9
Gas boiler 86% 15 200 6.0
Oil boiler 86% 20 238 6.1
Notes: * In situ performance coefficient. Evidence was taken from provisional assumptions of the forthcoming
study. The cost base year is 2019. Opex includes routine maintenance, but not fuel which is accounted for
separately. The capex figures stated are used for 2020 and reductions are applied to some technologies from
this point (see Section 1.3.c). Our capex assumption for biomass boilers is drawn from the renewal costs provided
within the HVAC study, rather than for new installations, since we only include it as a counterfactual technology
and there is a large difference between new and renewal costs in this study.
Sources: CCC analysis; Verco for BEIS (forthcoming) Low carbon Heating, Ventilation and Air Conditioning (HVAC)
technologies in non-domestic buildings.
17
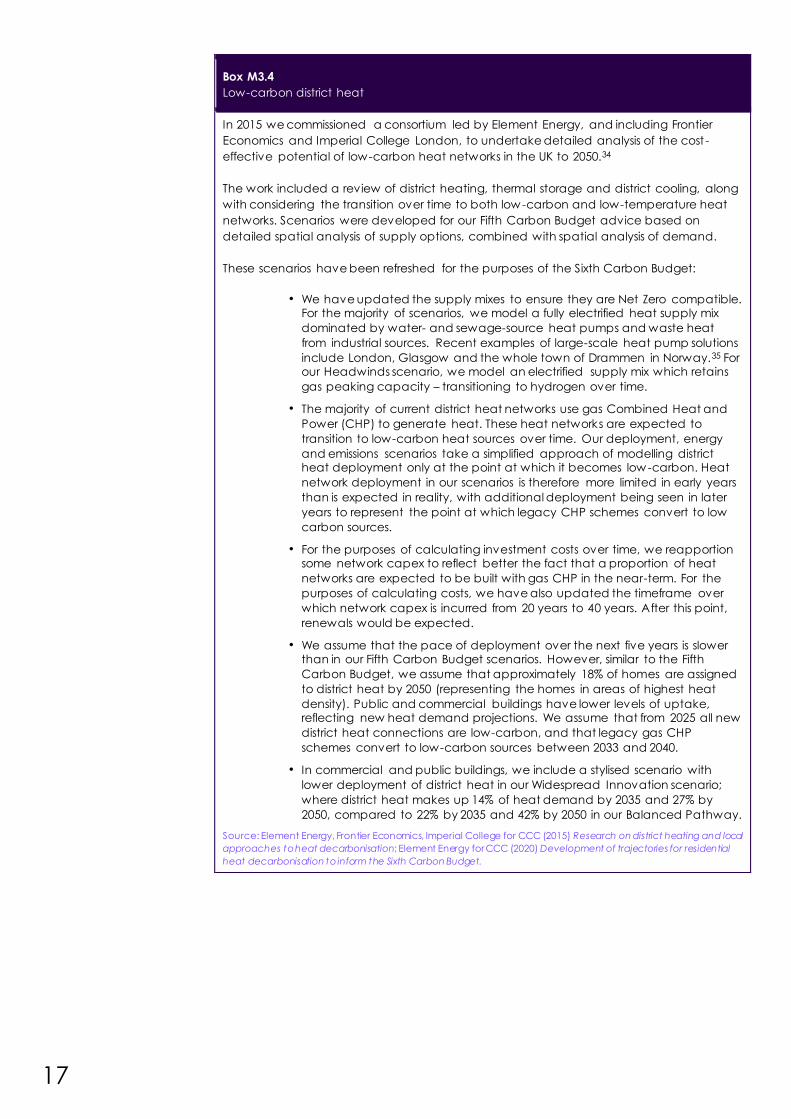
Box M3.4
Low-carbon district heat
In 2015 we commissioned a consortium led by Element Energy, and including Frontier
Economics and Imperial College London, to undertake detailed analysis of the cost -
effective potential of low-carbon heat networks in the UK to 2050.34
The work included a review of district heating, thermal storage and district cooling, along
with considering the transition over time to both low-carbon and low-temperature heat
networks. Scenarios were developed for our Fifth Carbon Budget advice based on
detailed spatial analysis of supply options, combined with spatial analysis of demand.
These scenarios have been refreshed for the purposes of the Sixth Carbon Budget:
• We have updated the supply mixes to ensure they are Net Zero compatible. For the majority of scenarios, we model a fully electrified heat supply mix
dominated by water- and sewage-source heat pumps and waste heat
from industrial sources. Recent examples of large-scale heat pump solutions
include London, Glasgow and the whole town of Drammen in Norway.35 For our Headwinds scenario, we model an electrified supply mix which retains
gas peaking capacity – transitioning to hydrogen over time.
• The majority of current district heat networks use gas Combined Heat and
Power (CHP) to generate heat. These heat networks are expected to
transition to low-carbon heat sources over time. Our deployment, energy
and emissions scenarios take a simplified approach of modelling district heat deployment only at the point at which it becomes low -carbon. Heat
network deployment in our scenarios is therefore more limited in early years
than is expected in reality, with additional deployment being seen in later
years to represent the point at which legacy CHP schemes convert to low
carbon sources.
• For the purposes of calculating investment costs over time, we reapportion some network capex to reflect better the fact that a proportion of heat
networks are expected to be built with gas CHP in the near-term. For the
purposes of calculating costs, we have also updated the timeframe over
which network capex is incurred from 20 years to 40 years. After this point,
renewals would be expected.
• We assume that the pace of deployment over the next five years is slower than in our Fifth Carbon Budget scenarios. However, similar to the Fifth
Carbon Budget, we assume that approximately 18% of homes are assigned
to district heat by 2050 (representing the homes in areas of highest heat
density). Public and commercial buildings have lower levels of uptake, reflecting new heat demand projections. We assume that from 2025 all new
district heat connections are low-carbon, and that legacy gas CHP
schemes convert to low-carbon sources between 2033 and 2040.
• In commercial and public buildings, we include a stylised scenario with
lower deployment of district heat in our Widespread Innovation scenario;
where district heat makes up 14% of heat demand by 2035 and 27% by
2050, compared to 22% by 2035 and 42% by 2050 in our Balanced Pathway.
Source: Element Energy, Frontier Economics, Imperial College for CCC (2015) Research on district heating and local
approaches to heat decarbonisation; Element Energy for CCC (2020) Development of trajectories for residential
heat decarbonisation to inform the Sixth Carbon Budget.
18
3. Approach to analysis for the Sixth Carbon Budget advice
Our starting point for the analysis is the 2019 Net Zero report, which showed that the
Net Zero target means eliminating buildings emissions by 2050.
We have used bottom-up analysis to produce a set of pathways to zero emissions
from buildings in 2050.
We use the scenarios to explore a range of different futures, including ones with
higher levels of innovation and behaviour change. We work on the basis of an
underlying aim to minimise costs and disruption for households and businesses,
working with technology lifetimes to minimise scrappage. In determining the
pathways, we have also tested a range of regulatory policy levers as well as new
business models. Our starting point is current Government policy. We then look at
the impacts of a range of additional policy levers, including phase-out dates for
fossil fuel boilers. Our scenarios aim to simulate what can be achieved under an
ambitious and effective wide-ranging policy package that deals decisively with
the various barriers to action.
Our analysis is split by residential and non-residential buildings, with low-carbon
heat network pathways based on buildings-wide analysis produced for the Fifth
Carbon Budget, which has been refreshed.
The following sections cover the analytical methodology behind our scenarios, our
approach to deriving pathways for the devolved administrations and our
approach to uncertainty (including impacts of COVID-19).
a) Analytical methodology
i) Residential buildings
Our 2019 analysis demonstrated that getting to very low levels of emissions in
residential buildings is possible. For the purposes of the Sixth Carbon Budget, we
have modelled paths which reach zero by 2050.†††
Our Sixth Carbon Budget scenarios for residential buildings are composed of five
analytical workstreams, looking at decarbonisation pathways for heat in existing
homes, heat in new homes, appliance efficiency, the decarbonisation of gas
cooking, and the decarbonisation of household and garden machinery. The
modelling for the decarbonisation of heat in existing homes draws on a project by
Element Energy (Box M3.5), while the latter four analytical workstreams draw on in-
house analysis.
For energy efficiency and heat in existing homes, we started by looking at different
2050 mixes, where we explored balances of behaviour change, fabric efficiency,
and fuel-switching. We then determined pathways for decarbonisation, starting
with current Government policy and considering additional levers on top of this.
Our analysis was designed to respect the limits of feasibility and desirability for
consumers (considering plausible ranges of behaviour change and technology
uptake) and to allow time for supply chains and skills to ramp up (incorporating
assumptions for deployment constraints amongst other things).
††† There remain a very small volume of emissions in all of our scenarios (<1Mt) associated with limited use of biofuels,
house fires, and non-aerosol household products.
Our scenarios explore a range of future worlds, including ones with higher levels of innovation and behaviour change.
Our starting point is current Government policy. We then look at the impacts of a range of additional policy levers, including phase-out dates for fossil fuel boilers.
We commissioned new modelling of pathways for existing homes, and produced in-house analysis covering new homes and electrical efficiency measures.
19
Boiler lifetimes of around 15 years imply a need to scale up markets and supply
chains for low-carbon heating to cover all new installations by the mid-2030s at the
latest, if the Net Zero target is to be met. The pace of decarbonisation across our
scenarios is therefore led by dates for regulated phase out of new fossil fuel boilers,
in areas not designated for hydrogen or district heat conversion.
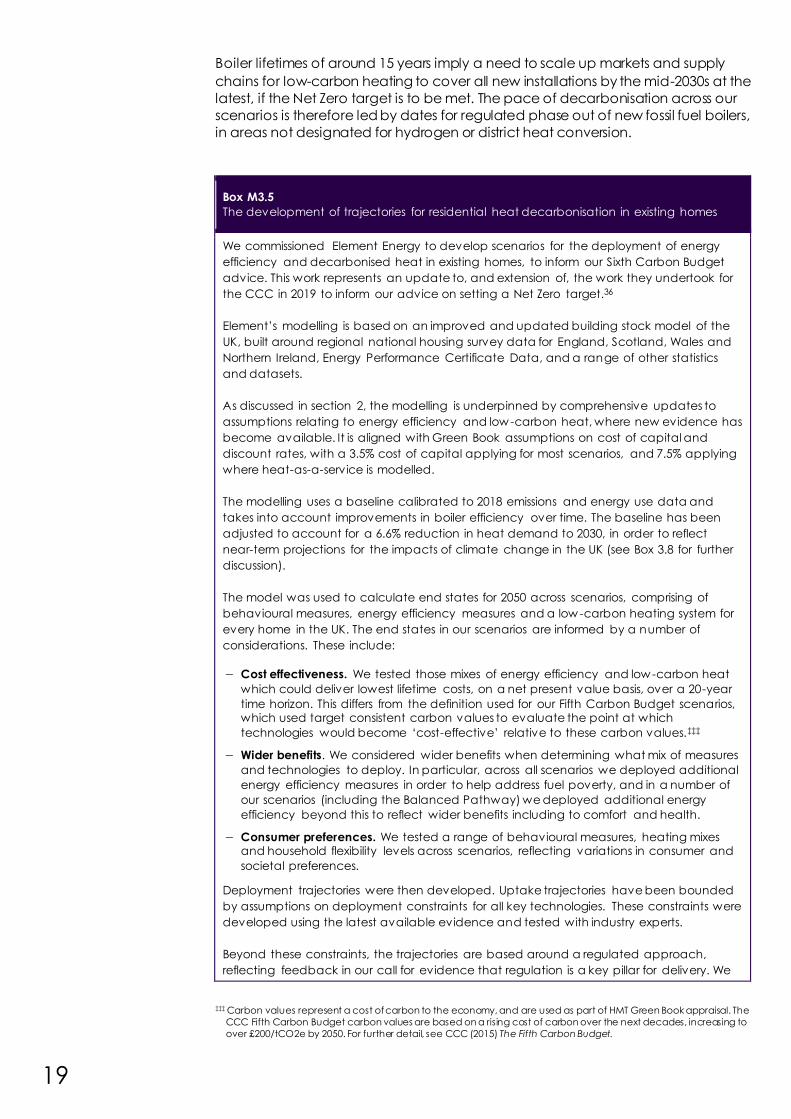
Box M3.5
The development of trajectories for residential heat decarbonisation in existing homes
We commissioned Element Energy to develop scenarios for the deployment of energy
efficiency and decarbonised heat in existing homes, to inform our Sixth Carbon Budget
advice. This work represents an update to, and extension of, the work they undertook for
the CCC in 2019 to inform our advice on setting a Net Zero target.36
Element’s modelling is based on an improved and updated building stock model of the
UK, built around regional national housing survey data for England, Scotland, Wales and
Northern Ireland, Energy Performance Certificate Data, and a range of other statistics
and datasets.
As discussed in section 2, the modelling is underpinned by comprehensive updates to
assumptions relating to energy efficiency and low-carbon heat, where new evidence has
become available. It is aligned with Green Book assumptions on cost of capital and
discount rates, with a 3.5% cost of capital applying for most scenarios, and 7.5% applying
where heat-as-a-service is modelled.
The modelling uses a baseline calibrated to 2018 emissions and energy use data and
takes into account improvements in boiler efficiency over time. The baseline has been
adjusted to account for a 6.6% reduction in heat demand to 2030, in order to reflect
near-term projections for the impacts of climate change in the UK (see Box 3.8 for further
discussion).
The model was used to calculate end states for 2050 across scenarios, comprising of
behavioural measures, energy efficiency measures and a low -carbon heating system for
every home in the UK. The end states in our scenarios are informed by a number of
considerations. These include:
– Cost effectiveness. We tested those mixes of energy efficiency and low-carbon heat
which could deliver lowest lifetime costs, on a net present value basis, over a 20-year
time horizon. This differs from the definition used for our Fifth Carbon Budget scenarios, which used target consistent carbon values to evaluate the point at which
technologies would become ‘cost-effective’ relative to these carbon values.‡‡‡
– Wider benefits. We considered wider benefits when determining what mix of measures
and technologies to deploy. In particular, across all scenarios we deployed additional
energy efficiency measures in order to help address fuel poverty, and in a number of
our scenarios (including the Balanced Pathway) we deployed additional energy
efficiency beyond this to reflect wider benefits including to comfort and health.
– Consumer preferences. We tested a range of behavioural measures, heating mixes and household flexibility levels across scenarios, reflecting variations in consumer and
societal preferences.
Deployment trajectories were then developed. Uptake trajectories have been bounded
by assumptions on deployment constraints for all key technologies. These constraints were
developed using the latest available evidence and tested with industry experts.
Beyond these constraints, the trajectories are based around a regulated approach,
reflecting feedback in our call for evidence that regulation is a key pillar for delivery. We
‡‡‡ Carbon values represent a cost of carbon to the economy, and are used as part of HMT Green Book appraisal. The
CCC Fifth Carbon Budget carbon values are based on a rising cost of carbon over the next decades, increasing to
over £200/tCO2e by 2050. For further detail, see CCC (2015) The Fifth Carbon Budget.
20
took our starting point as current Government policy – in particular the plans to improve
the energy efficiency of all buildings over the next 10-15 years, and the plans to phase-
out the installation of new high-carbon fossil fuels in the 2020s.
We then modelled additional levers on top of this, testing a range of phase-out dates for
the installation of fossil fuel boilers. These phase-out dates drive uptake of electrified
technologies on and off the gas grid.
Separate trajectories were developed for uptake of hydrogen and low -carbon district
heating. For hydrogen, an uptake trajectory was developed to reflect hydrogen grid
conversion, led by use of hydrogen in industrial clusters. For low -carbon district heat, our
Fifth Carbon Budget scenarios were used as a basis, and updated to reflect slower
progress in the early years, with CHP phase out for new low-carbon heat networks in 2025,
and conversion of all legacy schemes to low-carbon sources by 2040 (Box 3.4).
Source: CCC analysis; Element Energy for the CCC (2020) Development of t rajectories for residential heat
decarbonisation to inform the Sixth Carbon Budget.
Our scenarios for the decarbonisation of heat and energy efficiency measures in
new homes build on the recommendations made in our 2019 report UK housing: Fit
for the future?, and assume that from the mid-2020s at the latest, no new homes
are connected to the gas grid and instead are built with ultra-high energy
efficiency standards and heated through low-carbon sources (either heat pumps
or district heat). Our scenarios draw heavily on analysis undertaken for the CCC by
Currie Brown and Aecom in 2019.37 The following key assumptions underpin the
new build analysis:
• We assume that build rates profile up to meet Government new build
commitments of 300,000 homes per year by the mid-2020s in England, with
rates held constant for the devolved administrations. Projections thereafter
follow a profile developed by Element Energy for the Fifth Carbon Budget.
• We assume that any homes built between now, and the date at which
regulations on low-carbon heat come into force, must be retrofitted with
low-carbon heat at the point of heating system renewal.
• All new build homes are assumed to pre-heat and therefore be capable of
accessing lower electricity costs.
• We model costs on the basis of modelling undertaken by Currie & Brown
which uses a 7.5% cost of capital for one year.38 We take a simplified
approach of modelling costs in representative years for ten different house
types, including homes and flats using different low-carbon heating systems
and at different levels of energy efficiency.
Our Sixth Carbon Budget scenarios for lighting and appliance efficiency in homes
draw on analysis undertaken for the Fifth Carbon Budget, updated to better align
with evidence on the heat replacement effect and to reflect updated
assumptions on electricity costs and the rate of decarbonisation.§§§
We separately model the decarbonisation of gas cooking appliances (2.1% of
residential direct emissions), and household and garden machinery (0.6% of
residential direct emissions).
We assume that gas cooking appliances are replaced with electric appliances in
most scenarios. Our calculations conservatively assume the efficiency levels of
conventional electric hobs, although induction hobs are increasingly popular, and
§§§ The heat replacement effect occurs because as lighting and other electricity products become more efficient,
they produce less waste heat. Our assessment allows for a small amount of additional heating requirement.

21
provide superior performance and greater efficiency savings where suitable. In
Headwinds we assume that gas cooking appliances are mainly replaced by
hydrogen appliances.
Hydrogen cooking appliances are expected to provide similar performance to gas
cookers and could be used wherever the gas grid is converted. The timeframes for
cooking decarbonisation are aligned with the dates of phase out for new gas
boiler sales and with hydrogen switchover trajectories in the Headwinds scenario.
We assume that the phase out of petrol and diesel household and garden
machinery (such as lawnmowers, garden tractors, and hedge trimmers) is aligned
with the phase out of petrol vehicles in the transport sector (i.e. all new sales are
zero-carbon from 2032 at the latest in our Balanced Pathway).
ii) Public and commercial buildings
All our scenarios are based on non-residential buildings reaching near-zero
emissions ahead of 2050. As in our Net Zero analysis, the main source of remaining
emissions in 2050 is N2O used for anaesthesia, which seems relatively costly to
abate by replacement. We note the NHS now has a target to reduce these
emissions by 40% by 2050 as part of its strategy for delivering a Net Zero emission
health service.39 We plan to undertake further work in this area in the future.
Our baseline energy demand is primarily based on BEIS’ Energy and Emission
Projections.40. These are stylised and do not take account of any potential
changes in trends associated with increased home-working resulting from the
COVID-19 pandemic (see Box 3.7).
Our scenarios are grounded in current policy. For example, we use expected dates
for the phase out of high-carbon fossil fuel heating such as oil, based on policy. We
assess our rollout profile of energy efficiency against relevant commitments such as
the Government’s goal to enable businesses and industry to improve energy
efficiency by at least 20% by 2030 and its aim to reduce public sector emissions by
50% by 2032 against 2017 levels.
We then develop a pathway based on the pace of hydrogen conversion of the
grid, district heat development and boiler stock turn over for buildings assumed not
to convert to hydrogen or district heat. We apply different dates where no new
gas boilers would be installed across our scenarios reflecting the potential for
regulated phase out of fossil fuels. Each of these ensures that gas is fully phased out
before 2050 through natural replacement cycles.
The non-residential buildings analysis was approached by reducing baseline
emissions in the following sequence: subtracting energy savings from behavioural
measures and energy efficiency, allocating a share of remaining heat demand to
district heating, then analysing fuel-switching and improved system efficiency for
remaining building-level heat and catering and other fossil fuel demands.
The level of energy savings reached at maximum deployment from behavioural
measures and energy efficiency is held constant across scenarios. We vary the
profile over which the savings develop according to scenario and the value of the
savings varies across scenarios according to different energy prices. Our method of
deriving energy savings from BEES and our cost methodology for energy efficiency
is described in Box 3.6.
After accounting for reduced heat demand following energy efficiency and
uptake of district heating, we consider the mix of technologies for the remaining
heat demand.
All our non-residential scenarios are based on buildings reaching near-zero emissions ahead of 2050.
As in our Net Zero analysis, the main source of remaining emissions in 2050 is N2O used for anaesthesia, which seems relatively costly to abate by replacement.
Hydrogen rollout aligns to the pace in homes and is informed by our industrial analysis.
22
• We align the uptake of hydrogen boilers in public and commercial
buildings to the share of on-gas homes (excluding district heat) that
convert to hydrogen in the residential analysis. We assume that grid
conversions radiate out from industrial clusters.
• For the share of remaining buildings not assigned to convert to hydrogen,
we model uptake of heat pumps and resistive electric heating based on
turnover from our assumed phase-out dates.
• Our interpretation of the HVAC study technical potential implies all wet-
based systems (gas, oil and biomass boilers) convert to air-to-water heat
pumps, while dry systems (resistive electric heating) convert to air-to-air
heat pumps, and localised gas heating systems such as found in storage
facilities convert to a mixture of air-to-air heat pumps and resistive elective
heating.41
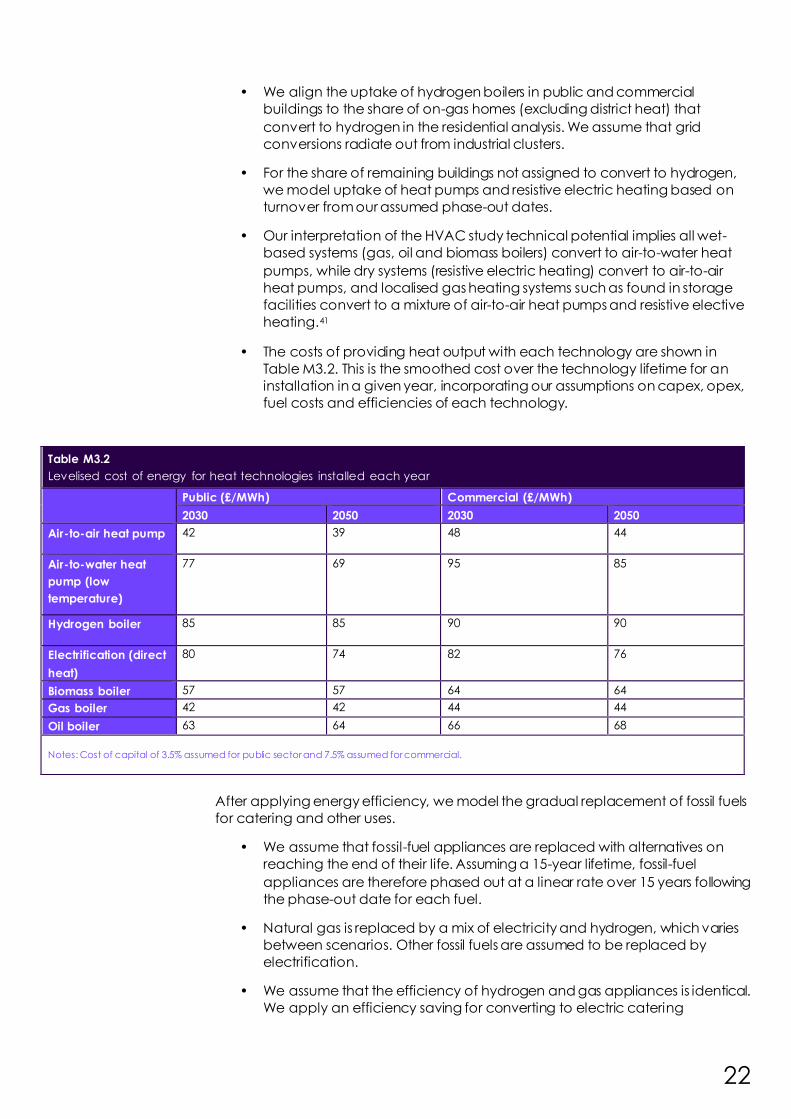
• The costs of providing heat output with each technology are shown in
Table M3.2. This is the smoothed cost over the technology lifetime for an
installation in a given year, incorporating our assumptions on capex, opex,
fuel costs and efficiencies of each technology.
Table M3.2
Levelised cost of energy for heat technologies installed each year
Public (£/MWh) Commercial (£/MWh)
2030 2050 2030 2050
Air-to-air heat pump 42 39 48 44
Air-to-water heat
pump (low
temperature)
77 69 95 85
Hydrogen boiler 85 85 90 90
Electrification (direct
heat)
80 74 82 76
Biomass boiler 57 57 64 64
Gas boiler 42 42 44 44
Oil boiler 63 64 66 68
Notes: Cost of capital of 3.5% assumed for public sector and 7.5% assumed for commercial.
After applying energy efficiency, we model the gradual replacement of fossil fuels
for catering and other uses.
• We assume that fossil-fuel appliances are replaced with alternatives on
reaching the end of their life. Assuming a 15-year lifetime, fossil-fuel
appliances are therefore phased out at a linear rate over 15 years following
the phase-out date for each fuel.
• Natural gas is replaced by a mix of electricity and hydrogen, which varies
between scenarios. Other fossil fuels are assumed to be replaced by
electrification.
• We assume that the efficiency of hydrogen and gas appliances is identical.
We apply an efficiency saving for converting to electric catering

23
equipment, based on the efficiencies of different types of appliance,
weighted by their current aggregate annual consumption.
• Other uses mainly involve the heating of water (e.g. for swimming pools
and hospital steam systems). We make the conservative assumption that
these are replaced by resistive electric heating (in practice, heat pumps
are used increasingly as a source for swimming pools globally).
• Cost estimates for converting catering and other fossil fuel uses are based
on fuel costs alone. We assume that other running costs and capital
expenditure are identical to fossil fuel equipment.
Box M3.6 Using the Building Energy Efficiency Survey
The Building Energy Efficiency Survey (BEES), commissioned by BEIS, reports on the energy
use and potential for reduction in energy use in non-residential buildings in England and
Wales in 2014-15. Abatement potential for a 39% reduction from current energy
consumption was identified.
Our analysis excludes abatement potential in BEES from industrial buildings (which fall
outside the scope of this sector) and abatement potential associated with upgrading
space heating plant which we consider may overlap with our analysis of heat
decarbonisation.
Since the BEES data are for England and Wales only, we scale the abatement potential
and baseline energy consumption in BEES upwards to reflect inclusion of Scotland and
Northern Ireland in our analysis. We do so with a scaling factor derived from sub-national
energy consumption data for electricity and gas (which is applied to non-electric
energy).
We compared the adjusted baseline energy demands from BEES with the baseline
energy developed for our analysis which is based on BEIS’ Energy and Emission Projections
(EEP): 42
• This showed the adjusted BEES baseline energy demand was significantly lower
that our baseline for 2018, particularly for non-electric energy consumption.
• The disparity grows through time with static BEES data and generally an upward trend to EEP, so the difference would be larger by the time we assume the
savings are delivered (some point in the early 2030s).****
• We have applied uplifts of 35% and 20% to commercial and public non-electric
abatement potential respectively. This makes up for only a share of the baseline
discrepancy which we judge to be a conservative approach reflecting that not
all the abatement potential identified might be representative of all non-residential energy demands (e.g. in other locations) and that growth in baseline
demand over time will be driven by a range of factors (including new build).
We have excluded some of the most expensive measure categories in BEES from our
analysis based on cost:
• We have excluded humidification, small appliances, ventilation, air conditioning
and cooling, and building services distribution systems. This reduces non-electrical
energy savings marginally and electrical energy savings by around 23%.
• We consider that where electrical energy savings would have a high abatement
cost over the carbon values, this may be better dealt with through the electricity
supply side where electricity will be very low carbon in later years.
**** The projections show strong growth in commercial electricity consumption and public gas consumption, slight
growth in commercial gas consumption and declining public electricity consumption.
We use evidence from BEES to assess the potential energy savings and costs associated with behavioural and energy efficiency measures.
24
• We have made exclusions based on cost only at the category level, so we may
be excluding some measures within this that would not be prohibitively expensive
(i.e. over around £150/tCO2e in 2030).
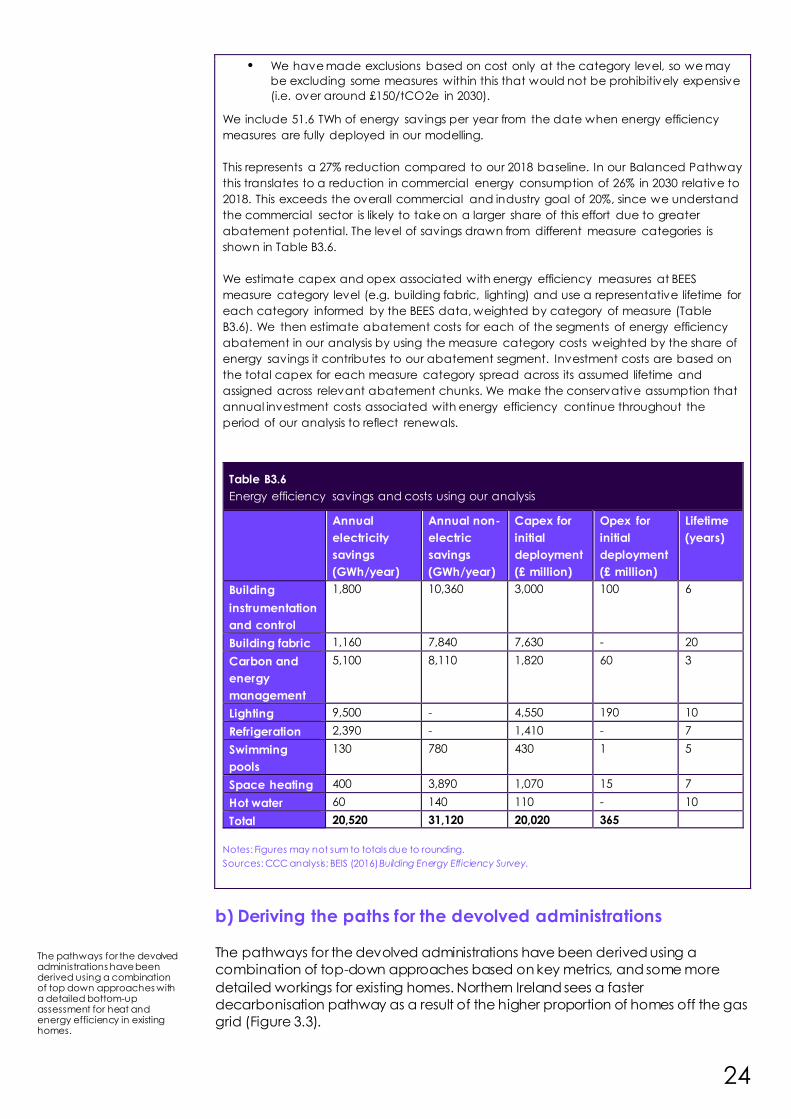
We include 51.6 TWh of energy savings per year from the date when energy efficiency
measures are fully deployed in our modelling.
This represents a 27% reduction compared to our 2018 baseline. In our Balanced Pathway
this translates to a reduction in commercial energy consumption of 26% in 2030 relative to
2018. This exceeds the overall commercial and industry goal of 20%, since we understand
the commercial sector is likely to take on a larger share of this effort due to greater
abatement potential. The level of savings drawn from different measure categories is
shown in Table B3.6.
We estimate capex and opex associated with energy efficiency measures at BEES
measure category level (e.g. building fabric, lighting) and use a representative lifetime for
each category informed by the BEES data, weighted by category of measure (Table
B3.6). We then estimate abatement costs for each of the segments of energy efficiency
abatement in our analysis by using the measure category costs weighted by the share of
energy savings it contributes to our abatement segment. Investment costs are based on
the total capex for each measure category spread across its assumed lifetime and
assigned across relevant abatement chunks. We make the conservative assumption that
annual investment costs associated with energy efficiency continue throughout the
period of our analysis to reflect renewals.
Table B3.6
Energy efficiency savings and costs using our analysis
Annual
electricity
savings
(GWh/year)
Annual non-
electric
savings
(GWh/year)
Capex for
initial
deployment
(£ million)
Opex for
initial
deployment
(£ million)
Lifetime
(years)
Building
instrumentation
and control
1,800 10,360 3,000 100 6
Building fabric 1,160 7,840 7,630 - 20
Carbon and
energy
management
5,100 8,110 1,820 60 3
Lighting 9,500 - 4,550 190 10
Refrigeration 2,390 - 1,410 - 7
Swimming
pools
130 780 430 1 5
Space heating 400 3,890 1,070 15 7
Hot water 60 140 110 - 10
Total 20,520 31,120 20,020 365
Notes: Figures may not sum to totals due to rounding.
Sources: CCC analysis; BEIS (2016) Building Energy Efficiency Survey.
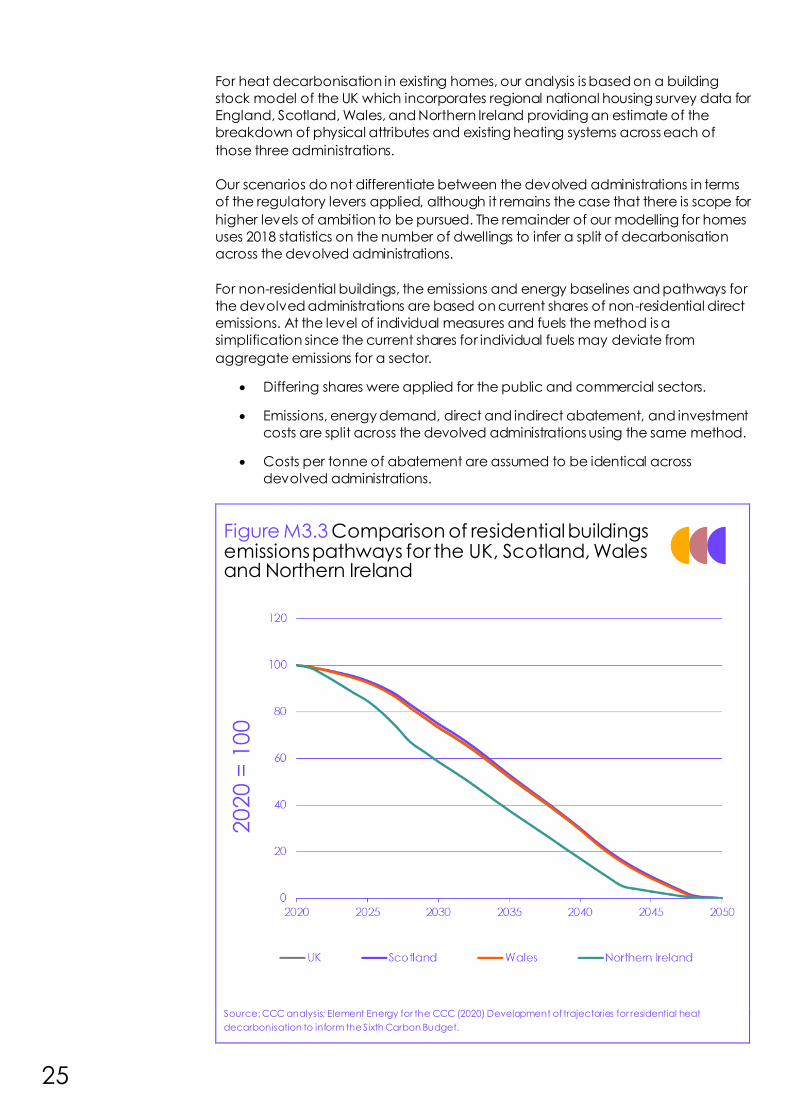
b) Deriving the paths for the devolved administrations
The pathways for the devolved administrations have been derived using a
combination of top-down approaches based on key metrics, and some more
detailed workings for existing homes. Northern Ireland sees a faster
decarbonisation pathway as a result of the higher proportion of homes off the gas
grid (Figure 3.3).
The pathways for the devolved administrations have been derived using a combination of top down approaches with a detailed bottom-up assessment for heat and energy efficiency in existing homes.
25
For heat decarbonisation in existing homes, our analysis is based on a building
stock model of the UK which incorporates regional national housing survey data for
England, Scotland, Wales, and Northern Ireland providing an estimate of the
breakdown of physical attributes and existing heating systems across each of
those three administrations.
Our scenarios do not differentiate between the devolved administrations in terms
of the regulatory levers applied, although it remains the case that there is scope for
higher levels of ambition to be pursued. The remainder of our modelling for homes
uses 2018 statistics on the number of dwellings to infer a split of decarbonisation
across the devolved administrations.
For non-residential buildings, the emissions and energy baselines and pathways for
the devolved administrations are based on current shares of non-residential direct
emissions. At the level of individual measures and fuels the method is a
simplification since the current shares for individual fuels may deviate from
aggregate emissions for a sector.
• Differing shares were applied for the public and commercial sectors.
• Emissions, energy demand, direct and indirect abatement, and investment
costs are split across the devolved administrations using the same method.
• Costs per tonne of abatement are assumed to be identical across
devolved administrations.
Figure M3.3 Comparison of residential buildings emissions pathways for the UK, Scotland, Wales and Northern Ireland
Source: CCC analysis; Element Energy for the CCC (2020) Development of trajectories for residential heat
decarbonisation to inform the Sixth Carbon Budget.
26
c) Approach to uncertainty
In developing our advice, we have sought to consider the key uncertainties which
could influence the path for buildings decarbonisation in the UK. We explore these
uncertainties primarily through our use of scenario analysis:
• The exploratory scenarios reach Net Zero emissions by 2050 in quite different
ways, illustrating the range of ways in which it can be achieved. We use
these scenarios to guide judgements on the achievable and sensible pace
of decarbonisation in the face of uncertainty, and to understand how less
success in one area can be compensated for elsewhere.
• The Tailwinds scenario assumes considerable success on both innovation
and societal/behavioural change and goes beyond the Sixth Carbon
Budget Pathway to achieve Net Zero before 2050. This scenario is intended
to be at the limits of feasibility.
• Our Balanced Pathway is designed to drive progress through the 2020s,
while creating options in a way that seeks to keep the three ‘exploratory’
scenarios open.
The key sources of uncertainty we test through our Buildings scenarios include:
• Energy costs. We use differing assumptions for economy-wide changes in
grid carbon intensity and energy costs across scenarios. We additionally
explore the impacts of higher bound hydrogen prices in our residential
Headwinds scenario for the purposes of determining energy efficiency
uptake in homes. For further discussion on uncertainties in energy costs, see
Chapter 1.
• Behaviour change. We test varying levels of behaviour change across our
scenarios for homes. For existing homes, this includes varying levels of pre-
heating and demand reduction, as well as considering the heat-as-a-
service delivery model in some scenarios (Table M3.3).
• Energy efficiency. We explore a wide range of energy efficiency uptake
levels across our scenarios for homes. We also vary our assumptions on costs
of different low-carbon measures, and the level of closure of the
performance gap which might be achieved across scenarios. For public
and commercial buildings, we vary the rates at which measures are rolled
out (Table 3.3).
• Heat mixes. We explore a range of routes to decarbonising heat across our
scenarios, ranging from a fully electrified heating mix in our Widespread
Engagement scenario, to a hydrogen-heavy heating mix in our Headwinds
scenario. A number of our scenarios, including the Balanced Pathway,
represent a hybrid system (Table M3.3).
• Heating technology costs, lifetimes and sizing. We explore different levels of
technology cost reductions across our scenarios. We also vary the assumed
technology lifetimes and sizing for heat pumps across scenarios for homes
(Table M3.3).
• Heat technology efficiency. In line with our Fifth Carbon Budget analysis, we
assume improvements in heat pump Seasonal Performance Factors (SPF) of
0.5 between 2020 and 2030. For the Widespread Innovation and Tailwinds
We use our exploratory scenarios to test a range of uncertainties.
This includes uncertainties around energy costs, levels of behaviour change, techno-economic assumptions for energy efficiency, heat mixes, techno-economic assumptions for heating, and the pace of action.
27
scenarios, we assume a further 15% efficiency uplift for all years. For homes,
this is based on a heat-as-a-service delivery model.
• Pace of action. We vary the dates of regulatory levers across scenarios, and
the pace of uptake within deployment constraints, to test varying rates of
progress.
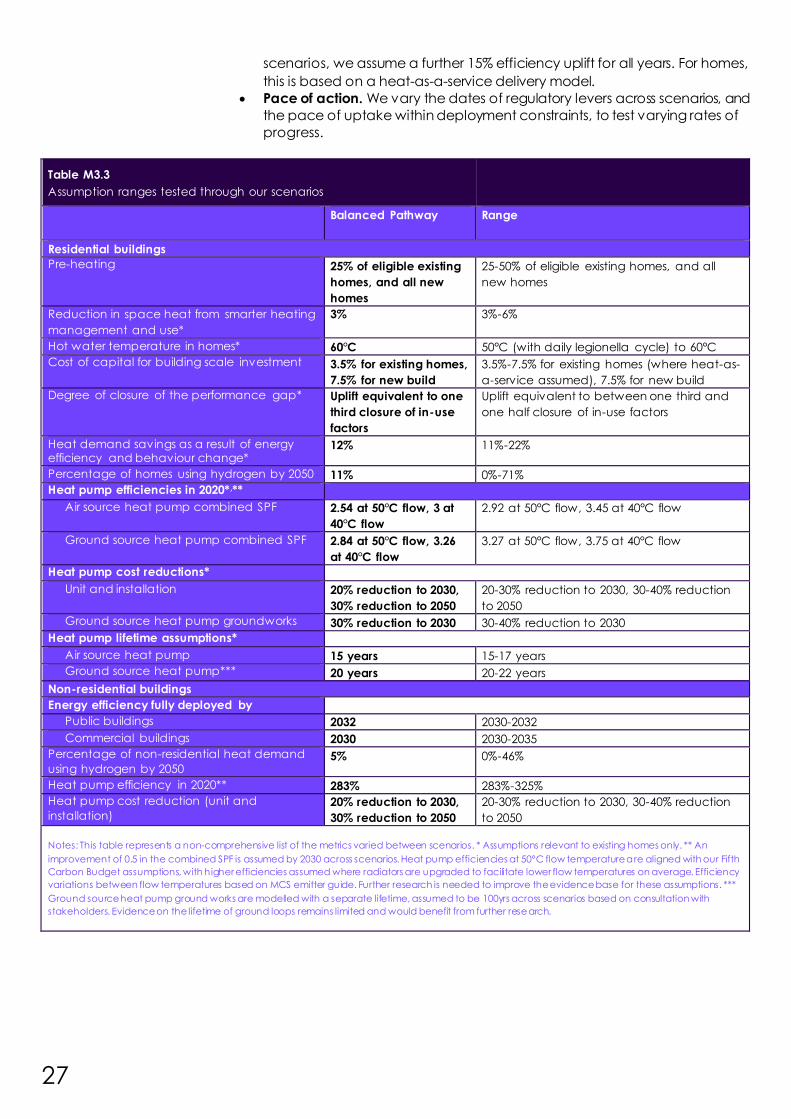
Table M3.3
Assumption ranges tested through our scenarios
Balanced Pathway Range
Residential buildings
Pre-heating 25% of eligible existing
homes, and all new
homes
25-50% of eligible existing homes, and all
new homes
Reduction in space heat from smarter heating
management and use*
3% 3%-6%
Hot water temperature in homes* 60°C 50°C (with daily legionella cycle) to 60°C
Cost of capital for building scale investment 3.5% for existing homes,
7.5% for new build
3.5%-7.5% for existing homes (where heat-as-
a-service assumed), 7.5% for new build
Degree of closure of the performance gap* Uplift equivalent to one
third closure of in-use
factors
Uplift equivalent to between one third and
one half closure of in-use factors
Heat demand savings as a result of energy efficiency and behaviour change*
12% 11%-22%
Percentage of homes using hydrogen by 2050 11% 0%-71%
Heat pump efficiencies in 2020*,**
Air source heat pump combined SPF 2.54 at 50°C flow, 3 at
40°C flow
2.92 at 50°C flow, 3.45 at 40°C flow
Ground source heat pump combined SPF 2.84 at 50°C flow, 3.26
at 40°C flow
3.27 at 50°C flow, 3.75 at 40°C flow
Heat pump cost reductions*
Unit and installation 20% reduction to 2030,
30% reduction to 2050
20-30% reduction to 2030, 30-40% reduction
to 2050
Ground source heat pump groundworks 30% reduction to 2030 30-40% reduction to 2030
Heat pump lifetime assumptions*
Air source heat pump 15 years 15-17 years
Ground source heat pump*** 20 years 20-22 years
Non-residential buildings
Energy efficiency fully deployed by
Public buildings 2032 2030-2032
Commercial buildings 2030 2030-2035
Percentage of non-residential heat demand
using hydrogen by 2050 5% 0%-46%
Heat pump efficiency in 2020** 283% 283%-325%
Heat pump cost reduction (unit and
installation) 20% reduction to 2030,
30% reduction to 2050
20-30% reduction to 2030, 30-40% reduction
to 2050
Notes: This table represents a non-comprehensive list of the metrics varied between scenarios. * Assumptions relevant to existing homes only. ** An
improvement of 0.5 in the combined SPF is assumed by 2030 across scenarios. Heat pump efficiencies at 50°C flow temperature are aligned with our Fifth
Carbon Budget assumptions, with higher efficiencies assumed where radiators are upgraded to facilitate lower flow temperatures on average. Efficiency
variations between flow temperatures based on MCS emitter guide. Further research is needed to improve the evidence base for these assumptions. ***
Ground source heat pump ground works are modelled with a separate lifetime, assumed to be 100yrs across scenarios based on consultation with
stakeholders. Evidence on the lifetime of ground loops remains limited and would benefit from further research.
28
We have not explicitly modelled the impacts of COVID-19 on demand and note
that the longevity of any impacts remains highly uncertain. Any long-term shift to
home working would lead to a shift in emissions from non-residential to residential
buildings, particularly during the heating season. This could imply an increase in
emissions in aggregate due to the loss in efficiency of having people working in a
greater number of spaces which all need heating during working hours. Research
undertaken by the International Energy Agency suggests there may be some net
gains from a shift to homeworking where this displaces a commute by private car.
However, the net impacts remain highly uncertain (Box M3.7).
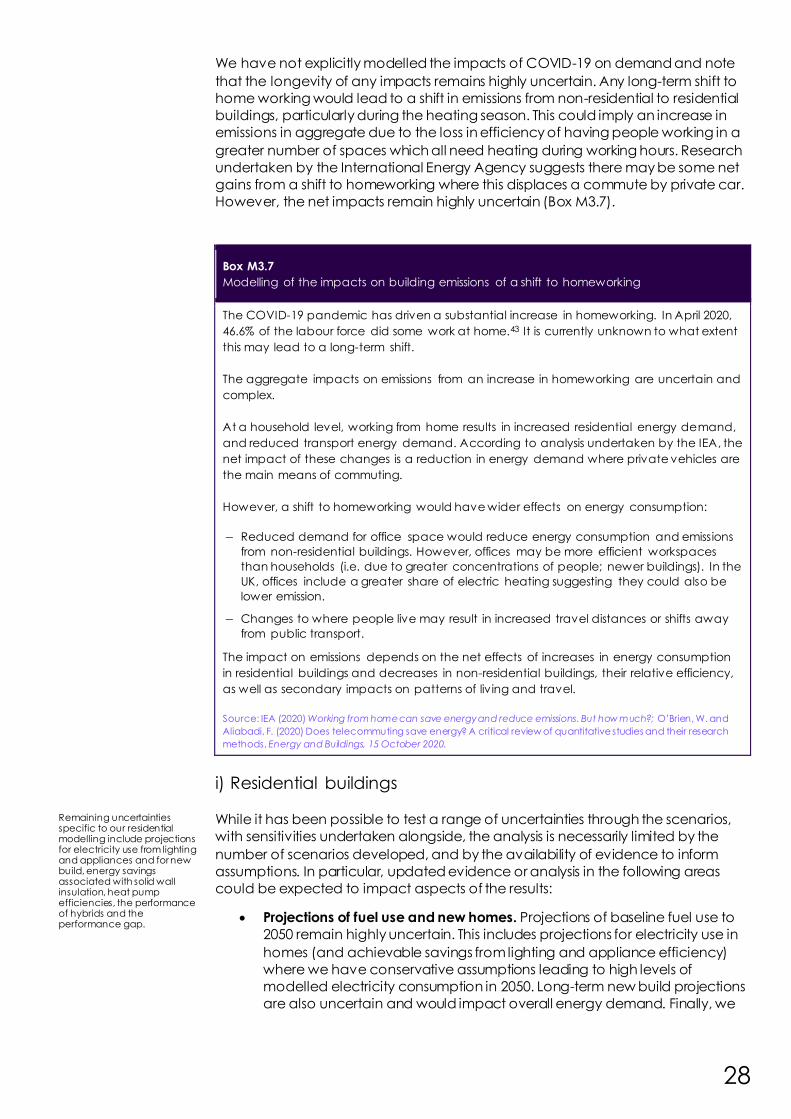
Box M3.7
Modelling of the impacts on building emissions of a shift to homeworking
The COVID-19 pandemic has driven a substantial increase in homeworking. In April 2020,
46.6% of the labour force did some work at home.43 It is currently unknown to what extent
this may lead to a long-term shift.
The aggregate impacts on emissions from an increase in homeworking are uncertain and
complex.
At a household level, working from home results in increased residential energy demand,
and reduced transport energy demand. According to analysis undertaken by the IEA, the
net impact of these changes is a reduction in energy demand where private vehicles are
the main means of commuting.
However, a shift to homeworking would have wider effects on energy consumption:
– Reduced demand for office space would reduce energy consumption and emissions
from non-residential buildings. However, offices may be more efficient workspaces
than households (i.e. due to greater concentrations of people; newer buildings). In the
UK, offices include a greater share of electric heating suggesting they could also be
lower emission.
– Changes to where people live may result in increased travel distances or shifts away
from public transport.
The impact on emissions depends on the net effects of increases in energy consumption
in residential buildings and decreases in non-residential buildings, their relative efficiency,
as well as secondary impacts on patterns of living and travel.
Source: IEA (2020) Working from home can save energy and reduce emissions. But how much?; O’Brien, W. and
Aliabadi, F. (2020) Does telecommuting save energy? A critical review of quantitative studies and their research
methods, Energy and Buildings, 15 October 2020.
i) Residential buildings
While it has been possible to test a range of uncertainties through the scenarios,
with sensitivities undertaken alongside, the analysis is necessarily limited by the
number of scenarios developed, and by the availability of evidence to inform
assumptions. In particular, updated evidence or analysis in the following areas
could be expected to impact aspects of the results:
• Projections of fuel use and new homes. Projections of baseline fuel use to
2050 remain highly uncertain. This includes projections for electricity use in
homes (and achievable savings from lighting and appliance efficiency)
where we have conservative assumptions leading to high levels of
modelled electricity consumption in 2050. Long-term new build projections
are also uncertain and would impact overall energy demand. Finally, we
Remaining uncertainties specific to our residential modelling include projections for electricity use from lighting and appliances and for new build, energy savings associated with solid wall insulation, heat pump efficiencies, the performance of hybrids and the performance gap.
29
make assumptions about the impact of climate change on future heat
demand, and the demand for cooling which remain uncertain (Box M3.8).
• Solid wall insulation. While the evidence base on the potential energy
savings associated with fabric energy efficiency measures has improved
relative to previous work, achievable savings remain highly uncertain in
some cases. In particular, evidence used to inform our assumptions
indicates lower cost effectiveness for solid wall insulation than has been
suggested by previous work. This could in part be a function of U-values of
solid uninsulated walls being lower than has been assumed historically,
leading to lower observed savings from insulation in the NEED data.44
However, there are also known uncertainties in the NEED data in relation to
the number of partial wall installations in the sample (which would be
expected to suppress savings). On this basis the savings we assume are
expected to be an underestimate to some degree.
• Heat pump efficiency. Our Fifth Carbon Budget assumptions on heat pump
efficiency were informed by field trials and monitoring for the Renewable
Heat Premium Payment (RHPP) scheme, leading to conservative
assumptions in the near term. While deficiencies in this data are widely
acknowledged, in the absence of large-scale new published evidence, our
Sixth Carbon Budget assumptions have used these conservative
assumptions as a starting point. Our assumptions have then been updated
to seek to reflect the higher efficiencies that might be achieved at lower
flow temperatures, where radiators are replaced. The evidence for these
assumptions remains limited and subject to uncertainty.45 The Metering and
Monitoring Service Package data is expected to provide an updated and
expanded evidence base on in-situ heat pump performance which will
support future analysis.
• Hybrid heat pumps. There remains uncertainty over how hybrid
technologies will perform in-situ. Based on work undertaken by Imperial
College London our base assumption is that hybrid heat pumps can
operate in heat pump mode up to 80% of the time.46 Other trial data (e.g.
from Passiv Systems, when combined with smart controls) supports the
Imperial assumptions. Trials undertaken by the Energy Systems Catapult
have shown that performance can be highly variable and dependent on
household heating behaviours.47 We test the impacts of this through
sensitivities on our scenarios.
• The performance gap. Our new-build modelling does not include a
representation of the performance gap and is therefore likely to
underestimate near-term fuel consumption to some degree. We include a
representation of some closure of the performance gap for retrofit energy
efficiency measures in existing homes. In both cases there is a high level of
uncertainty over the precise scale of the performance gap, although a
large body of evidence points to it being substantial.
30
Box M3.8
The impacts of climate warming
Changes in the UK’s climate will impact on the energy demand of buildings between
now and 2050. Our scenarios for homes have been designed to reflect a number of
expected dynamics resulting from the changing climate:
– We assume that increasing winter temperatures result in reduced demand for heating.
Based on the average from an ensemble of UK regional climate projections, we assume that increases in average winter temperatures to 2030 result in a 6.6%
reduction in heat demand. We hold this reduction constant from 2030 to 2050.††††, ‡‡‡‡
– We assume that increasing summer temperatures result in additional demand for
cooling. We allow for an additional energy demand of 5TWh annually by 2050. This is
aligned with the Energy Systems Catapult’s projections, based on an increase in
energy demand for cooling calibrated to levels for households in EU countries which currently experience similar levels of Cooling Degree Days to those predicted for the
UK in 2050.48
– We have separately examined the costs associated with retrofitting shading and
ventilation measures in homes to manage overheating risk. This is discussed further in
Chapter 3, Box 3.2.a.
The precise impacts of the changing climate on energy demand are uncertain, as they
depend on behavioural responses to changes in summer and winter temperatures. We
do not model the impacts for public and commercial buildings on the basis that these
buildings are expected to be subject to more complex trade-offs between heating and
cooling demand that it has not been possible to capture through our Sixth Carbon
Budget analysis. Further analysis on energy demand will be covered in the next UK
Climate Change Risk Assessment Evidence Report, due to be published by the
Adaptation Committee in summer 2021.
Sources: Met Office analysis; CCC analysis; Element Energy for the CCC (2020) Development of trajectories for
residential heat decarbonisation to inform the Sixth Carbon Budget; Robert Sansom for Energy Systems Catapult
(2020) Domest ic heat demand study.
ii) Public and commercial buildings
There are a number of further uncertainties and limitations associated with the non-
residential analysis that could impact results:
• Energy efficiency costs. We have taken a conservative approach to the
estimation of energy efficiency abatement and investment costs, which is
likely to overestimate costs.
– We have used the full capex value derived from BEES (for the
scope of abatement that we have included). This would mean
that all the cost is additional to what would have been incurred
in the baseline, whereas in practice we anticipate that a share of
the measures would be in place of business-as-usual investment
(e.g. replacing lighting or refrigeration equipment). If
replacements take place near the end of a product’s natural life
†††† Our residential heat analysis is based on an assessment of end state technology mixes in 2050, which are then
deployed over the trajectory to 2050. While further warming after 2030 is expected, we hold the heat demand
reduction constant to ensure that the technologies deployed in our modelling are able to meet the heat demands
expected from 2030 onwards.
‡‡‡‡ Based on Met Office analysis of Heating Degree Day data derived from the 2018 UK Climate Projections,
calculated for a 15.5 degree threshold and based on the RCP8.5 pathway – note that the outputs are similar for any
emissions scenarios before 2050 (Riahi et al 2007).
Remaining uncertainties specific to our non-residential modelling include energy efficiency costs, heat technology costs and baseline projections.
31
then there may be no additional capital cost, or possibly even
some cost saving.
– We also assume renewal costs continue throughout the appraisal
period. With some very short measure lifetimes (e.g. less than five
years), this means the costs are repeated several times. If the
benefits of some measures could be maintained (e.g. the impact
of training or procurement practice) without reinvesting, then
costs could be considerably lower than our estimates.
• Heat and hot water. We have taken a simplified approach of modelling
heat and hot water demands together which is likely to slightly
underestimate demand and costs.
– Suitability and uptake are driven by space heating demand,
which are applied to hot water demands. This is an
oversimplification. For example, hot water makes up 7% of
baseline electrical heat and hot water demand that is converted
to air-to-air heat pumps, whereas a supplementary technology
would be necessary for the hot water.
– Our costs for delivering all heat and hot water demands are
based on costs for generating heat which is likely to lead to an
underestimation of costs.
• Heat technology mixes. We have modelled all ‘wet’ based systems that
convert to heat pumps using low temperature air-to-water heat pumps,
and ‘dry’ systems converting to air-to-air heat pumps. A wider range of
technologies are available which would have different energy
requirements and costs. It may also be feasible for buildings with ‘wet’
systems to convert to lower cost air-to-air heat pumps instead of air-to-
water heat pumps and take on additional work in converting distribution
systems.
• Heat technology costs. Our cost inputs (£/kW) are drawn from the HVAC
study commissioned by BEIS. Our cost methodology pairs these with
capacity and load factor assumptions drawn primarily from our Fifth
Carbon Budget analysis. Capacity and load factors are difficult to assess.
We believe we have based our analysis on the best information available
but recognise the potential for incompatibility between these data sources
and the relatively large impact changing any of these assumptions can
have on heat costs.
• Baseline projections. There are discrepancies between data sources on
commercial and public energy consumption for 2018. We understand a
revision to reallocate 18TWh of oil from industry to other final users has
resulted in higher energy consumption for public and commercial buildings
in Energy Consumption in the UK (ECUK) than is reflected in inventory data
or BEIS Energy and Emission Projections (EEP). §§§§,49,50 Due to a closer
mapping to inventory data, we have grounded our analysis on EEP data for
2018 and scaled this slightly to align fully to inventory data. The balance
between public and commercial sub-sectors and fuel types varies by data
source, so introduces a few elements of uncertainty. Projections of energy
use to 2050 are clearly uncertain. Our baseline projections are generally
based on BEIS’ EEP which shows a strong growth in commercial electricity
consumption to 2035, which leads to a 77% increase in commercial
electricity from 2018 -2050 in our analysis. Taking this baseline is a cautious
§§§§ Other final users include the public sector, commercial buildings and agriculture.
We have taken a simplified approach to modelling both hot water and heat technology mixes in the analysis and note modelled potential for abating emissions resulting from the use of anaesthetics in health care.

32
approach which may be leading to more low-carbon electricity
generation requirements than may be necessary.
• N2O emissions from anaesthetics. In line with our Net Zero analysis, we have
not modelled the potential for abating 0.6MtCO2e of N2O emissions arising
through use in anaesthesia. A recent NHS report suggests these emissions
can be reduced by up to 75% by 2050. 51 This abatement and associated
costs are not included in our analysis.
Our scenarios and analytical approach have been deliberately designed to
explore and test the implications of uncertainties, allowing us to develop a
balanced assessment of achievable carbon savings which might be met in a
range of ways. While uncertainties will inevitably remain, the analysis undertaken
provides a solid basis on which to proceed.
33
1 CCC (2020) The Sixth Carbon Budget – Methodology Report. Available at: www.theccc.org.uk
2 National Atmospheric Emissions Inventory (NAEI) (2020) Breakdown of UK GHG emissions by
source and greenhouse gas.
3 Department for Business, Energy & Industrial Strategy (BEIS) (2020) DUKES, Electricity: commodity
balances (DUKES 5.1).
4 NAEI (2020) Breakdown of UK GHG emissions by source and greenhouse gas. 5 BEIS (2020) Energy Consumption in the UK (ECUK, End uses data tables, Table U2.
6 BEIS (2020) DUKES, Electricity: commodity balances (DUKES 5.1).
7 NAEI (2020) Breakdown of UK GHG emissions by source and greenhouse gas.
8 BEIS (2020) DUKES, Natural gas: commodity balances (DUKES 4.1). 9 BEIS (2020) DUKES, Electricity: commodity balances (DUKES 5.1).
10 CCC (2017) Energy Prices and Bills – impacts of meeting carbon budgets.
11 BEIS (2020) DUKES, Electricity: commodity balances (DUKES 5.1).
12 See Figure 4-5: Imperial College London for the CCC (2018) Analysis of Alternative UK Heat
Decarbonisation Pathways.
13 Aecom (2011) Energy Demand Research Project: Final Analysis. 14 Energy Systems Catapult (2019) Pathways to Low Carbon Heating: Dynamic Modelling of Five
UK Homes. 15 Energy Systems Catapult (2020) Achieving energy savings using zonal control; Beizaee, A.
Allinson, D. Lomas, K. J. Foda, E. and Loveday, D. L. (2015) Measuring the potential of zonal
space heating controls to reduce energy use in UK homes: The case of un-furbished 1930s
dwellings. Energy and Buildings, vol. 92, pp. 29-44, 2015.
16 PHE (2014) Minimum home temperature thresholds for health in winter – A systematic literature
review; https://www.ageuk.org.uk/latest-news/articles/2018/february/age-uk-urges-older-
people-to-claim-help-with-heating-costs-as-more-heavy-snow-and-freezing-conditions-hit-the-
uk/ accessed on 18/11/2020. 17 Based on difference between standard shower head (18l/min) vs low flow (6l/min). Element
Energy for the CCC (2020) Development of trajectories for residential heat decarbonisation to
inform the Sixth Carbon Budget.
18 Battelle Memorial Institute (2009) Final report study on benefits of removal of water hardness
(calcium and magnesium ions) from a water supply; Element Energy for the CCC (2020)
Development of trajectories for residential heat decarbonisation to inform the Sixth Carbon
Budget.
19 Energy Systems Catapult (2019) Smart Energy Services for Low Carbon Heat; Energy
Technologies Institute (2018) How can people get the heat they want at home, without the
carbon? 20 Energy Systems Catapult (2019) Heat as a Service Case Study.
21 Values for financial savings and energy consumption increase were taken from nominal results
by Energy Systems Catapult: Energy Systems Catapult (2019) Smart Systems and Heat Phase 2
D10 - D14: Market Transformations Report. These findings are sensitive to assumptions regarding
future market structures and service propositions. Assumptions on cost of capital in scenarios
using heat-as-a-service are conservative, on the basis that the 7.5% cost of capital is applied to
all low-carbon heat and energy efficiency in existing homes.
22 BEIS (2016) Building Energy Efficiency Survey.
23 CCC (2019) UK housing: Fit for the future; Currie & Brown and Aecom for the CCC (2019) The
costs and benefits of tighter standards for new buildings.
24 CCC (2020) Letter: Future Homes Standard and proposals for tightening Part L in 2020.
34
25 SAP methodology was used to calculate energy savings from measures, and in-use factors
applied to correlate better the modelled data with real-world performance. For further detail
see Element Energy and the Energy Saving Trust for the CCC (2013) Review of potential for
carbon savings from residential energy efficiency.
26 UCL (2020) Analysis work to refine fabric energy efficiency assumptions for use in developing the
Sixth Carbon Budget.
27 Energy Saving Trust (2016) Quantification of non-standard cavity walls and lofts in Great Britain;
Energy Saving Trust (2019) Determining the costs of insulating non-standard cavity walls and lofts.
28 Referenced in Energy Saving Trust for DECC (2016) Quantification of non-standard cavity walls
and lofts in Great Britain.
29 Assumptions for thin internal wall insulation based on forthcoming research by Leeds Beckett
University for BEIS, Thin Internal Wall Insulation (TIWI) Project. Assumptions for deep whole house
retrofits informed by evidence provided by Energiesprong. It should be noted that our modelling
of deep retrofits differs from the Energiesprong model in a number of important ways; notably
we do not model onsite generation or counterfactual maintenance costs which are core to the
Energiesprong business case. For further discussion of the benefits of the Energiesprong retrofit
model see CCC (2018) UK housing: Fit for the future?
30 BEIS (2019) National Energy Efficiency Data Framework (NEED): impact of measures data tables
2019.
31 For further discussion see Element Energy for the CCC (2020) Development of trajectories for
residential heat decarbonisation to inform the Sixth Carbon Budget.
32 Cambridge Architectural Research for BEIS (2017) What does it cost to retrofit homes; EST for BEIS
(2019) Determining the costs of insulating non-standard cavity walls and lofts.
33 CCC (2018) Biomass in a low-carbon economy.
34 Element Energy, Frontier Economics and Imperial College London (2015) Research on district
heating and local approaches to heat decarbonisation.
35 Euroheat and Power (2020) 100% RE District – Drammen, Norway,
https://www.euroheat.org/knowledge-hub/case-studies/100-re-district-drammen-norway/.
36 Element Energy for the CCC (2020) Development of trajectories for residential heat
decarbonisation to inform the Sixth Carbon Budget.
37 CCC (2019) UK housing: Fit for the future?; Currie & Brown and Aecom for the CCC (2019) The
costs and benefits of tighter standards for new buildings.
38 Currie & Brown and Aecom for the CCC (2019) The costs and benefits of tighter standards for
new buildings.
39 NHS (2020) Delivering a ‘Net Zero’ National Health Service. 40 BEIS (2019) 2018 Updated Energy and Emission Projections.
41 Verco for BEIS (forthcoming) Low carbon Heating, Ventilation and Air Conditioning (HVAC)
technologies in non-domestic buildings.
42 BEIS (2019) 2018 Updated Energy and Emission Projections.
43 ONS (2020) Coronavirus and homeworking in the UK: April 2020. Office for National Statistics.
https://www.ons.gov.uk/employmentandlabourmarket/peopleinwork/employmentandemploye
etypes/bulletins/coronavirusandhomeworkingintheuk/april2020.
44 BRE (2016) Solid wall heat losses and the potential for energy saving.
45 Based on the MCS Emitter Guide, for further detail see Element Energy for the CCC (2020)
Development of trajectories for residential heat decarbonisation to inform the Sixth Carbon
Budget.
46 CCC calculations based on Imperial College (2018) Analysis of alternative heat
decarbonisation pathways (Hybrid heat pump 10 Mt scenario).
47 Energy Systems Catapult for BEIS (2019) D8 Decarbonising Heat: Understanding how to increase
the appeal and performance of heat pumps.
48 Robert Sansom for Energy Systems Catapult (2020) Domestic heat demand study.

35
49 BEIS (2019) Energy Trends: June 2019, special feature article - Change to method of estimating
sector demand for oil products.
50 BEIS (2019) Energy Consumption in the UK (ECUK).
51 NHS (2020) Delivering a ‘Net Zero’ National Health Service
36
Emissions pathways for the
buildings sector
1. The Balanced Net Zero Pathway for buildings 38
2. Alternative routes to delivering abatement in the mid 2030s 44
3. Impacts of the scenarios: costs, benefits and co-impacts on society 48
37
Introduction and key messages
The following sections are taken directly from Chapter 3 of the CCC’s Advice
Report for the Sixth Carbon Budget.52
Direct buildings emissions were 87 MtCO2e in 2019. Progress in delivering emissions
reductions has broadly flatlined since 2015, when comparing on a temperature
adjusted basis.
Our pathways to 2050 aim to reduce emissions in buildings to zero by 2050 at the
latest, based on the findings of our Net Zero report. They also aim to ensure
buildings of the future are comfortable, healthy spaces to be year-round, which
are resilient to overheating and other climate risks.
Our Balanced Net Zero Pathway reflects four priorities over the coming decade or
so:
• Deliver on the Government’s energy efficiency plans to upgrade all
buildings to EPC C over the next 10-15 years.
• Scale up the market for heat pumps as a critical technology for
decarbonising space heating, while maintaining quality.
• Expand the rollout of low-carbon heat networks in heat dense areas like
cities, using anchor loads such as hospitals and schools. Prepare to shift
away from using fossil fuel Combined Heat and Power (CHP) as a supply-
source towards low-carbon and waste heat by preference from the mid-
2020s.
• Prepare for a potential role for hydrogen in heat through a set of trials
building on the current innovation programme.
This programme requires a major ramp-up from what is happening today in supply chains for insulation, heat pumps and heat networks. Our detailed analysis demonstrates that this is feasible:
• We commissioned Element Energy to undertake bottom-up modelling of
heat decarbonisation for existing homes. Alongside modelling undertaken
in house, the assessment indicates that delivering net zero emissions in
buildings is feasible.
• This assessment is underpinned by the latest available evidence on the cost
and performance of measures, and on deployment constraints, informed
by a literature review and through evidence gathering from expert
stakeholders.
• The installation rates for insulation measures such as lofts and cavity walls
are within the range previously achieved under the supplier obligations in
the early 2010s. Solid wall installation rates are more ambitious but
considered achievable with strong policy in our testing with stakeholders.
The rest of this section is set out in three parts:
a) The Balanced Net Zero Pathway for buildings
b) Alternative routes to delivering abatement in the mid-2030s
c) Impacts of the Scenarios – costs and benefits
Our pathways reduce emissions in buildings to zero by 2050 at the latest, whilst adapting to a changing climate.
They require a major ramp up in supply chains for insulation, heat pumps and heat networks, which our analysis shows is feasible.
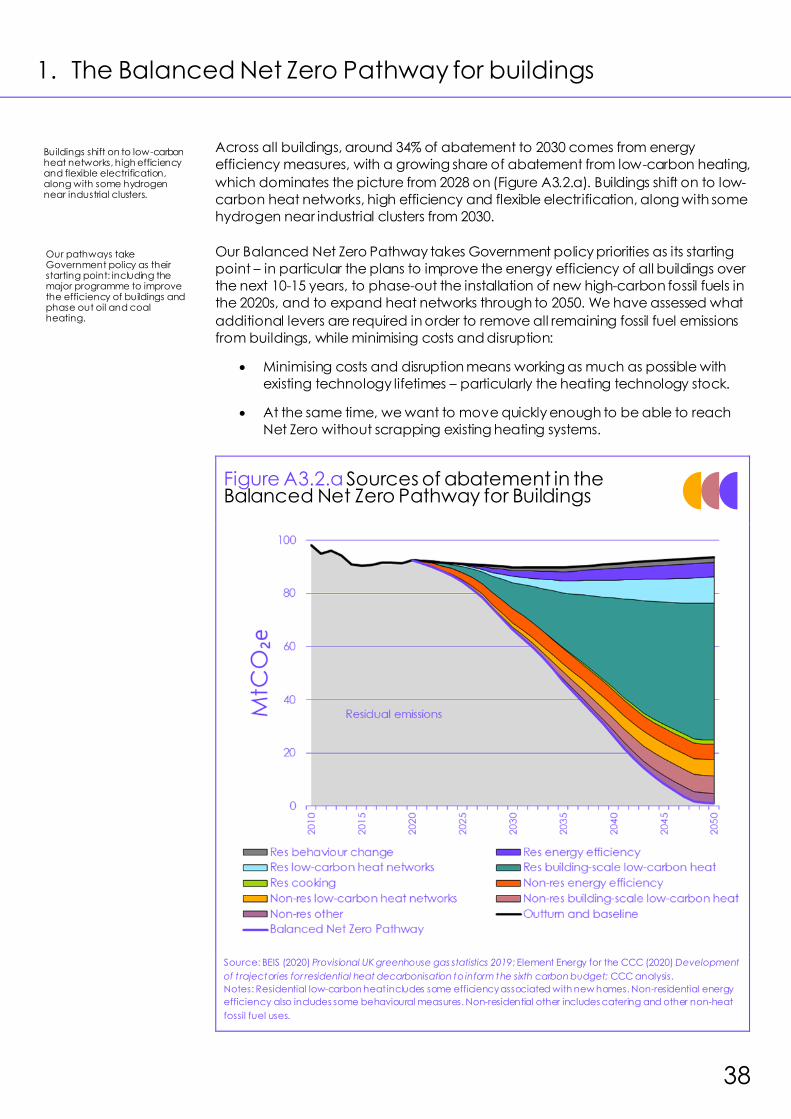
38
1. The Balanced Net Zero Pathway for buildings
Across all buildings, around 34% of abatement to 2030 comes from energy
efficiency measures, with a growing share of abatement from low-carbon heating,
which dominates the picture from 2028 on (Figure A3.2.a). Buildings shift on to low-
carbon heat networks, high efficiency and flexible electrification, along with some
hydrogen near industrial clusters from 2030.
Our Balanced Net Zero Pathway takes Government policy priorities as its starting
point – in particular the plans to improve the energy efficiency of all buildings over
the next 10-15 years, to phase-out the installation of new high-carbon fossil fuels in
the 2020s, and to expand heat networks through to 2050. We have assessed what
additional levers are required in order to remove all remaining fossil fuel emissions
from buildings, while minimising costs and disruption:
• Minimising costs and disruption means working as much as possible with
existing technology lifetimes – particularly the heating technology stock.
• At the same time, we want to move quickly enough to be able to reach
Net Zero without scrapping existing heating systems.
Figure A3.2.a Sources of abatement in the Balanced Net Zero Pathway for Buildings
Source: BEIS (2020) Provisional UK greenhouse gas statistics 2019; Element Energy for the CCC (2020) Development
of t rajectories for residential heat decarbonisation to inform the sixth carbon budget; CCC analysis.
Notes: Residential low-carbon heat includes some efficiency associated with new homes. Non-residential energy
efficiency also includes some behavioural measures. Non-residential other includes catering and other non-heat
fossil fuel uses.
Our pathways take Government policy as their starting point: including the major programme to improve the efficiency of buildings and phase out oil and coal heating.
Buildings shift on to low-carbon heat networks, high efficiency and flexible electrification, along with some hydrogen near industrial clusters.

39
Given boiler lifetimes of around 15 years, we have looked at phasing out the
installation of fossil fuel boilers, in advance of 2035. We adopt a central date of
2033 for gas boilers across buildings, with public buildings moving faster:
• For homes, we pick a central phase out date of 2028 for high-carbon fossil
fuel boilers not connected to the gas grid, and a phase out date of 2033
for gas boilers.
• The key date of 2033 balances the need to scale up heat pump supply
chains sustainably, while allowing for a small amount of headroom over a
typical 15-year boiler stock turnover before 2050.
• In non-residential buildings we use 2025 for high-carbon fossil fuel boilers in
public buildings and 2026 in commercial buildings, based on the feasibility
and benefits of moving faster. We use phase out dates for gas boilers of
2033 in commercial buildings and 2030 in public buildings in the Balanced
pathway. The faster pace in public buildings allows the Government to
meet its targeted 50% reduction in emissions by 2032.
• These dates operate alongside the deployment of low-carbon heat
networks and a regional rollout of hydrogen conversion of the gas grid,
informed by our industry scenarios. This means that the phase-out does not
apply in any areas designated for these alternatives.
The other key dates are then based on the need to build critical supply chains and
skills, and prepare the building stock for the transition to low-carbon heating, with
most of the energy efficiency programme completed by the time fossil fuel boiler
installations are phased out from 2033 (Table A3.2.a).
This energy efficiency programme is also underpinned by a timetable of standards
–rented homes achieve EPC C by 2028 in line with new Government proposals,
with social homes aligned to the same timetable.
We test two new policy proposals for the two-thirds of homes which are owner-
occupied, and therefore not covered by existing proposals outside of Scotland.
This includes a requirement on lenders to first report on and then improve the
average efficiency of their mortgage portfolios, covering just under half of the
owner-occupied stock. A further subset are captured by regulations at point of
sale, drawing on proposals published by the Scottish Government.
We look at a set of additional policy levers: a phase out date for the installation of natural gas boilers in 2033, along with new standards on mortgage lenders and at point of sale to drive efficiency renovations in the 2020s and 2030s.
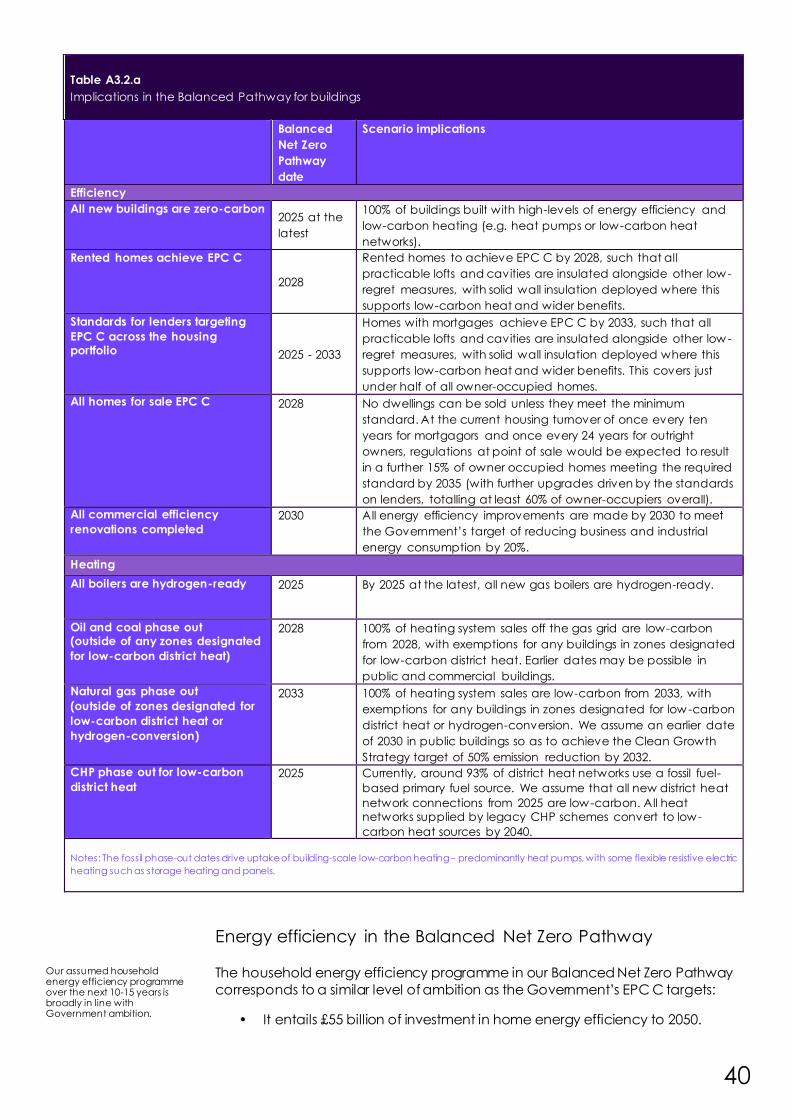
40
Table 1.11:Table 1.11
Table A3.2.a
Implications in the Balanced Pathway for buildings
Critical dates and Balanced
Net Zero
Pathway
date
Scenario implications
Efficiency
All new buildings are zero-carbon 2025 at the
latest
100% of buildings built with high-levels of energy efficiency and
low-carbon heating (e.g. heat pumps or low-carbon heat
networks).
Rented homes achieve EPC C
2028
Rented homes to achieve EPC C by 2028, such that all
practicable lofts and cavities are insulated alongside other low -
regret measures, with solid wall insulation deployed where this
supports low-carbon heat and wider benefits.
Standards for lenders targeting
EPC C across the housing portfolio 2025 - 2033
Homes with mortgages achieve EPC C by 2033, such that all
practicable lofts and cavities are insulated alongside other low -
regret measures, with solid wall insulation deployed where this
supports low-carbon heat and wider benefits. This covers just
under half of all owner-occupied homes.
All homes for sale EPC C 2028 No dwellings can be sold unless they meet the minimum
standard. At the current housing turnover of once every ten
years for mortgagors and once every 24 years for outright
owners, regulations at point of sale would be expected to result
in a further 15% of owner occupied homes meeting the required
standard by 2035 (with further upgrades driven by the standards
on lenders, totalling at least 60% of owner-occupiers overall).
All commercial efficiency
renovations completed 2030 All energy efficiency improvements are made by 2030 to meet
the Government’s target of reducing business and industrial
energy consumption by 20%.
Heating
All boilers are hydrogen-ready 2025 By 2025 at the latest, all new gas boilers are hydrogen-ready.
Oil and coal phase out (outside of any zones designated
for low-carbon district heat)
2028 100% of heating system sales off the gas grid are low-carbon
from 2028, with exemptions for any buildings in zones designated
for low-carbon district heat. Earlier dates may be possible in
public and commercial buildings.
Natural gas phase out
(outside of zones designated for
low-carbon district heat or
hydrogen-conversion)
2033 100% of heating system sales are low-carbon from 2033, with
exemptions for any buildings in zones designated for low -carbon
district heat or hydrogen-conversion. We assume an earlier date
of 2030 in public buildings so as to achieve the Clean Growth
Strategy target of 50% emission reduction by 2032.
CHP phase out for low-carbon
district heat 2025 Currently, around 93% of district heat networks use a fossil fuel-
based primary fuel source. We assume that all new district heat
network connections from 2025 are low-carbon. All heat networks supplied by legacy CHP schemes convert to low-
carbon heat sources by 2040.
Notes: The fossil phase-out dates drive uptake of building-scale low-carbon heating – predominantly heat pumps, with some flexible resistive electric
heating such as storage heating and panels.
Energy efficiency in the Balanced Net Zero Pathway
The household energy efficiency programme in our Balanced Net Zero Pathway
corresponds to a similar level of ambition as the Government’s EPC C targets:
• It entails £55 billion of investment in home energy efficiency to 2050.
Our assumed household energy efficiency programme over the next 10-15 years is broadly in line with Government ambition.
41
• BEIS’s published estimate of £35-65 billion to achieve the EPC C standard
implies a broadly consistent level of ambition.
• It remains important that EPCs are reformed to ensure they drive the energy
efficiency measures needed, as detailed in our accompanying Policy
report.
In total, 15 million households receive one of the main insulation measures
(loft/wall/floor) and a further 8 million benefit from draught-proofing. Most homes
with hot water tanks benefit from hot water tank insulation. All fuel poor homes
receive a high efficiency upgrade:
• We deploy low-cost measures such as draft proofing and hot water tank
insulation in all homes, as well as insulating all practicable cavities and lofts
(including top-ups where existing insulation is below 200mm).
• Our assessment is that this leads to the deployment of around 3 million
cavity insulation measures and 11 million loft insulation measures to 2050.
• We include solid wall insulation in just under half of all uninsulated solid-
walled homes (3.4 million in total) including all those in fuel poverty.
Energy efficiency and behavioural measures in our Balanced Pathway deliver a
12% reduction in heat demand to 2050 (compared to a 22% reduction in our
Tailwinds scenario).* This is a conservative estimate which reflects how measures
are currently performing when installed in existing homes (further detailed in the
accompanying Method report). Higher savings are possible with greater
improvements in tackling the performance gap, innovation and public
engagement.
There remains uncertainty over the balance of costs and benefits for wall insulation
in solid walled homes in particular, as well as levels of public support. This includes
uncertainty over the energy savings which can be achieved and the potential for
innovative new approaches which minimise cost and disruption (detailed in the
separate Methodology report). Further research is needed here to inform
deployment. To the extent there is any under delivery of solid wall insulation relative
to our scenarios, the abatement would need to be delivered in other ways e.g.
through increased uptake or performance of other energy efficiency measures, or
through a faster rate of heat pump deployment.
The timetable associated with our Balanced Net Zero Pathway allows for rapid
scale-up of supply chains for critical insulation measures (Figure A3.2.b):
• Total loft insulations rise rapidly from just 27,000 lofts insulated in the past
year to back to over 700,000 installations per year by 2025. This compares to
1.6 million which were insulated in 2012 under the supplier obligations.
• The rate of cavity wall insulation rises from 41,000 cavities to over 200,000 a
year by 2025.
• Solid wall insulation measures also increase to just over 250,000 a year by
2025 from just 11,000 in the past year. This puts us on track for insulating 3.4
* This represents an aggregate reduction in heat demand across the stock, taking into account technical and
economic potential, and is not reflective of the savings which might be delivered in an individual home which has
minimal existing insulation. A typical household in our Balanced Pathway which installs cavity wall insulation, loft
insulation, and floor insulation sees heat demand savings of 30%, while very deep retrofits might deliver savings in the
region of 57% (Element Energy for the CCC (2020) Development of trajectories for residential heat decarbonisation
to inform the sixth carbon budget). The lower stock-level heat demand savings relative to our Net Zero analysis
reflect a number of factors, including updated savings assumptions based on data from the National Energy
Efficiency Database, and the latest evidence on costs and technical and economic potential. These factors lead to
lower deployment relative to Net Zero, but similar deployment to that modelled for the Fifth Carbon Budget.
15 million homes get one of the main measures (wall/roof/floor insulation).
We conservatively estimate heat efficiency savings of 12% based on evidence of how measures currently performed when installed.
Public willingness to adopt solid wall insulation is highly uncertain, as are the costs and benefits. Our Balanced Pathway insulates 3.5 million solid walls (out of a total of 8 million).
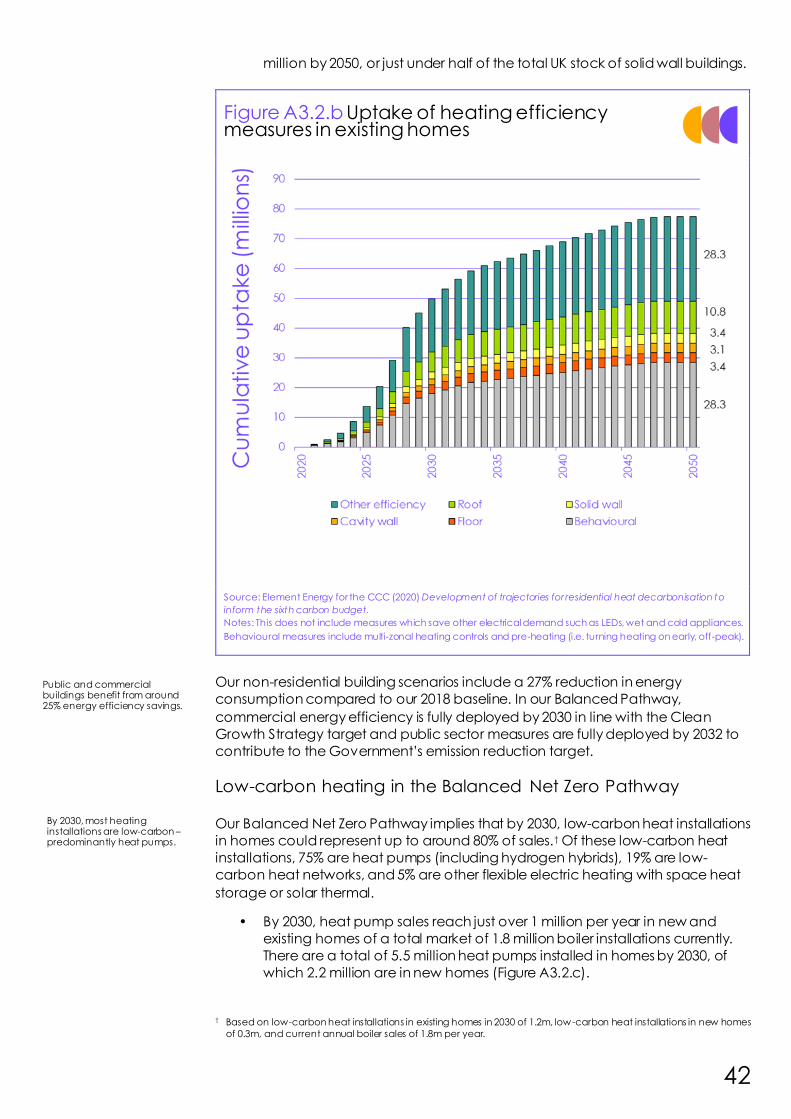
42
million by 2050, or just under half of the total UK stock of solid wall buildings.
Figure A3.2.b Uptake of heating efficiency measures in existing homes
Source: Element Energy for the CCC (2020) Development of trajectories for residential heat decarbonisation to
inform the sixth carbon budget.
Notes: This does not include measures which save other electrical demand such as LEDs, wet and cold appliances.
Behavioural measures include multi-zonal heating controls and pre-heating (i.e. turning heating on early, off-peak).
Our non-residential building scenarios include a 27% reduction in energy
consumption compared to our 2018 baseline. In our Balanced Pathway,
commercial energy efficiency is fully deployed by 2030 in line with the Clean
Growth Strategy target and public sector measures are fully deployed by 2032 to
contribute to the Government’s emission reduction target.
Low-carbon heating in the Balanced Net Zero Pathway
Our Balanced Net Zero Pathway implies that by 2030, low-carbon heat installations
in homes could represent up to around 80% of sales.† Of these low-carbon heat
installations, 75% are heat pumps (including hydrogen hybrids), 19% are low-
carbon heat networks, and 5% are other flexible electric heating with space heat
storage or solar thermal.
• By 2030, heat pump sales reach just over 1 million per year in new and
existing homes of a total market of 1.8 million boiler installations currently.
There are a total of 5.5 million heat pumps installed in homes by 2030, of
which 2.2 million are in new homes (Figure A3.2.c).
† Based on low-carbon heat installations in existing homes in 2030 of 1.2m, low-carbon heat installations in new homes
of 0.3m, and current annual boiler sales of 1.8m per year.
Public and commercial buildings benefit from around 25% energy efficiency savings.
By 2030, most heating installations are low-carbon – predominantly heat pumps.
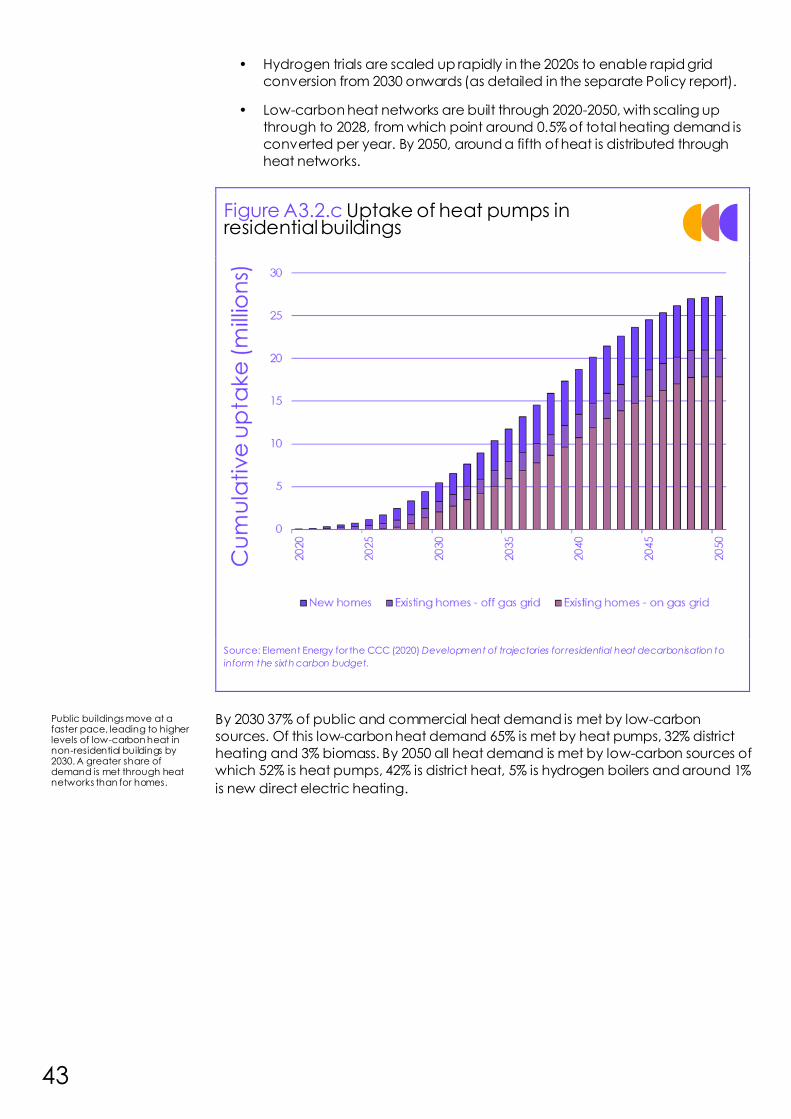
43
• Hydrogen trials are scaled up rapidly in the 2020s to enable rapid grid
conversion from 2030 onwards (as detailed in the separate Policy report).
• Low-carbon heat networks are built through 2020-2050, with scaling up
through to 2028, from which point around 0.5% of total heating demand is
converted per year. By 2050, around a fifth of heat is distributed through
heat networks.
Figure A3.2.c Uptake of heat pumps in residential buildings
Source: Element Energy for the CCC (2020) Development of trajectories for residential heat decarbonisation to
inform the sixth carbon budget.
By 2030 37% of public and commercial heat demand is met by low-carbon
sources. Of this low-carbon heat demand 65% is met by heat pumps, 32% district
heating and 3% biomass. By 2050 all heat demand is met by low-carbon sources of
which 52% is heat pumps, 42% is district heat, 5% is hydrogen boilers and around 1%
is new direct electric heating.
Public buildings move at a faster pace, leading to higher levels of low-carbon heat in non-residential buildings by 2030. A greater share of demand is met through heat networks than for homes.
44
2. Alternative routes to delivering abatement in the mid-2030s
All buildings scenarios achieve close to zero emissions by 2050. The Tailwinds and
Widespread Engagement pathways are faster than the Balanced Pathway,
reducing to close to zero by 2044 (Figure A3.2.d).‡ By 2035, the pathways achieve
reductions of 45% - 65%, relative to current emissions.
We explore different contexts by varying the key timings, costs and performance
assumptions and by exploring the impact of innovation such as new business
models (Table A3.2.b):
• Widespread Engagement. Households and businesses are prepared to
undertake renovations at scale through the 2020s, with high levels of pre-
heating and other behaviour change in homes.§ They also support earlier
regulatory approaches.
• Innovation. Power sector innovation drives down electricity costs.
Households adopt smart, flexible electric heating including hybrid heat
pumps, as well as high-temperature heat pumps (which are able to
operate at higher temperatures, reducing the need for radiator
upgrades).53** New business models such heat-as-a-service and new
financial models for deep retrofits become common, delivering high
performance solutions. High levels of cost reduction through learning, and
increases in performance over time.
• Headwinds. People change behaviour and new technologies develop, but
there are no widespread behavioural shifts or innovations that significantly
reduce the cost of green technologies ahead of current projections.
Alongside strong electrification, there is widespread use of hydrogen, led
by the conversion of industrial clusters.
• Tailwinds. Households and businesses support early regulatory approaches,
and minimise their use of energy through behaviour change and the
highest uptake of energy efficiency measures. At the same time, innovation
drives down costs (with 40% reductions in heat pump costs to 2050) and
drives up performance.
Availability of hydrogen in Headwinds is increased at an ambitious rate in the
2030s, implying that some possible hydrogen-dominated pathways could lead to
lower emissions in the budget period. However, as a result this scenario has
considerably higher overall hydrogen demand, creating a substantially bigger
challenge to source sufficient volumes of low-carbon hydrogen. In turn, this is likely
to lead to more use of fossil gas reforming with carbon capture and storage (CCS),
increasing residual emissions from hydrogen production and increasing reliance on
CCS and fossil gas imports (see section 5). While higher buildings demands could
be conceived of, they are not included in our scenarios due to these supply
challenges and residual emissions.
‡ Some additional rollout of low-carbon heat networks occurs to 2050.
§ Where homes are sufficiently well insulated, it is possible to pre-heat ahead of peak times, enabling access to
cheaper tariffs which reflect the reduced costs associated with running networks and producing power off-peak.
Other behavioural measures are summarised in table 3.2.a.
** While high temperature heat pumps are specifically designed for high temperature operation, the designs of
‘conventional’ heat pumps are increasingly being improved to reach 60-65°C at reasonable efficiency. We assume
that radiator upgrades could be avoided where flow temperatures of 65-70°C are reached. An efficiency penalty is
associated with operation at these higher temperatures, although discussions with manufacturers suggest efficiency
benefits relative to resistive heating are maintained even in very cold weather.
We explore a range of scenarios which achieve 45-65% reduction in emissions by 2035, against current levels.
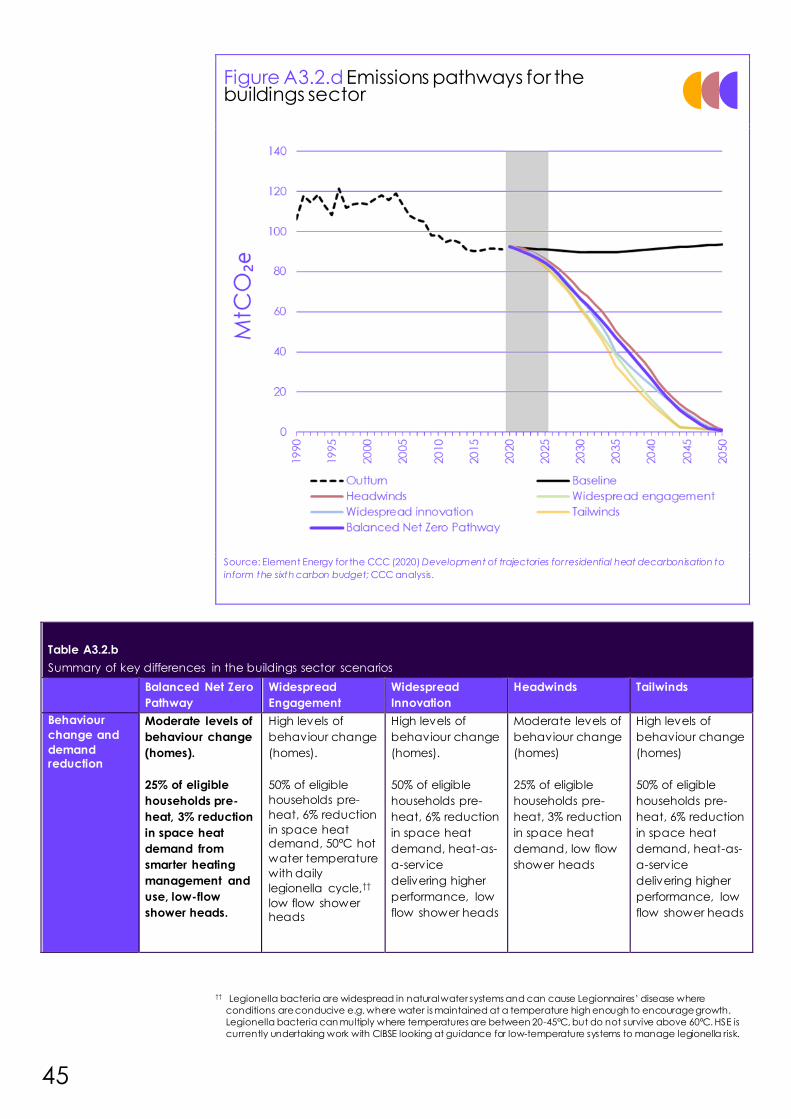
45
Figure A3.2.d Emissions pathways for the buildings sector
Source: Element Energy for the CCC (2020) Development of trajectories for residential heat decarbonisation to
inform the sixth carbon budget; CCC analysis.
Table 1.11:Table 1.11
Table A3.2.b
Summary of key differences in the buildings sector scenarios
Balanced Net Zero
Pathway
Widespread
Engagement
Widespread
Innovation
Headwinds Tailwinds
Behaviour
change and
demand reduction
Moderate levels of
behaviour change
(homes).
25% of eligible
households pre-
heat, 3% reduction
in space heat
demand from
smarter heating
management and
use, low-flow
shower heads.
High levels of
behaviour change
(homes).
50% of eligible
households pre-
heat, 6% reduction
in space heat demand, 50°C hot
water temperature
with daily
legionella cycle,††
low flow shower heads
High levels of
behaviour change
(homes).
50% of eligible
households pre-
heat, 6% reduction
in space heat
demand, heat-as-
a-service
delivering higher
performance, low
flow shower heads
Moderate levels of
behaviour change
(homes)
25% of eligible
households pre-
heat, 3% reduction
in space heat
demand, low flow
shower heads
High levels of
behaviour change
(homes)
50% of eligible
households pre-
heat, 6% reduction
in space heat
demand, heat-as-
a-service
delivering higher
performance, low
flow shower heads
†† Legionella bacteria are widespread in natural water systems and can cause Legionnaires’ disease where
conditions are conducive e.g. where water is maintained at a temperature high enough to encourage growth.
Legionella bacteria can multiply where temperatures are between 20-45°C, but do not survive above 60°C. HSE is
currently undertaking work with CIBSE looking at guidance for low-temperature systems to manage legionella risk.

46
Efficiency Moderate energy
efficiency uptake
in homes. Loft and
wall insulation for
all fuel poor.
Fast commercial
uptake;
Moderate-paced
public uptake.
Moderate-high
energy efficiency
uptake in homes.
Loft and wall
insulation for all
fuel poor.
Fast uptake of
energy efficiency
in other buildings.
Lower energy
efficiency uptake
in homes. Loft and
wall insulation for
all fuel poor.
Innovation drives
down energy
efficiency costs
and delivers high
performing deep
retrofits.
Moderate-paced
uptake in other
buildings.
Lower energy
efficiency uptake
in homes. Loft and
wall insulation for
all fuel poor.
Slow commercial
uptake; moderate-
paced public
uptake.
High energy
efficiency uptake
in homes (full
economic
potential). Loft
and wall insulation
for all fuel poor.
Fast uptake of
energy efficiency
in other buildings.
Low-carbon
fuels/
technology
Hybrid hydrogen
scenario in homes,
with 11% of homes
using hydrogen for
heat. Limited use
of biofuels in
homes.
Heat networks fully
electrified.‡‡
Non-residential
buildings heat and
catering demands
mainly electrified
with some
hydrogen.
Fully electrified
scenario (including
heat networks). No
biofuels in homes.
Hybrid hydrogen
scenario in homes,
with 10% of homes
using hydrogen for
heat. Widespread
uptake of high-
temperature heat
pumps and flexible
technology. No
biofuels in homes.
Heat networks fully
electrified. Lower
levels of low-
carbon heat
networks in non-
residential
buildings.
Non-residential
buildings heat and
catering demands
mainly electrified
with some
hydrogen.
Higher efficiency
of heat pumps
and greater
reduction in cost
over time.
Widespread
network
conversion to
hydrogen, with
71% of homes
using hydrogen for
heat. Smaller role
for heat pumps
across all buildings;
13 million in homes.
In homes,
hydrogen boilers in
north and heat
pump-hydrogen
hybrids in south.
Limited use of
biofuels.
Heat networks
supplied by
hydrogen and
large-scale heat
pumps.
Catering and
cooking demands
predominantly
met with
hydrogen.
Buildings fully
electrified, except
for areas around
industrial clusters
which use H2
boilers. 11% of
homes using
hydrogen for heat.
No biofuels in
homes.
Higher efficiency
of heat pumps
and greater
reduction in cost
over time.
‡‡ Dominated by water- and sewage-source heat pumps and waste heat from industrial sources.
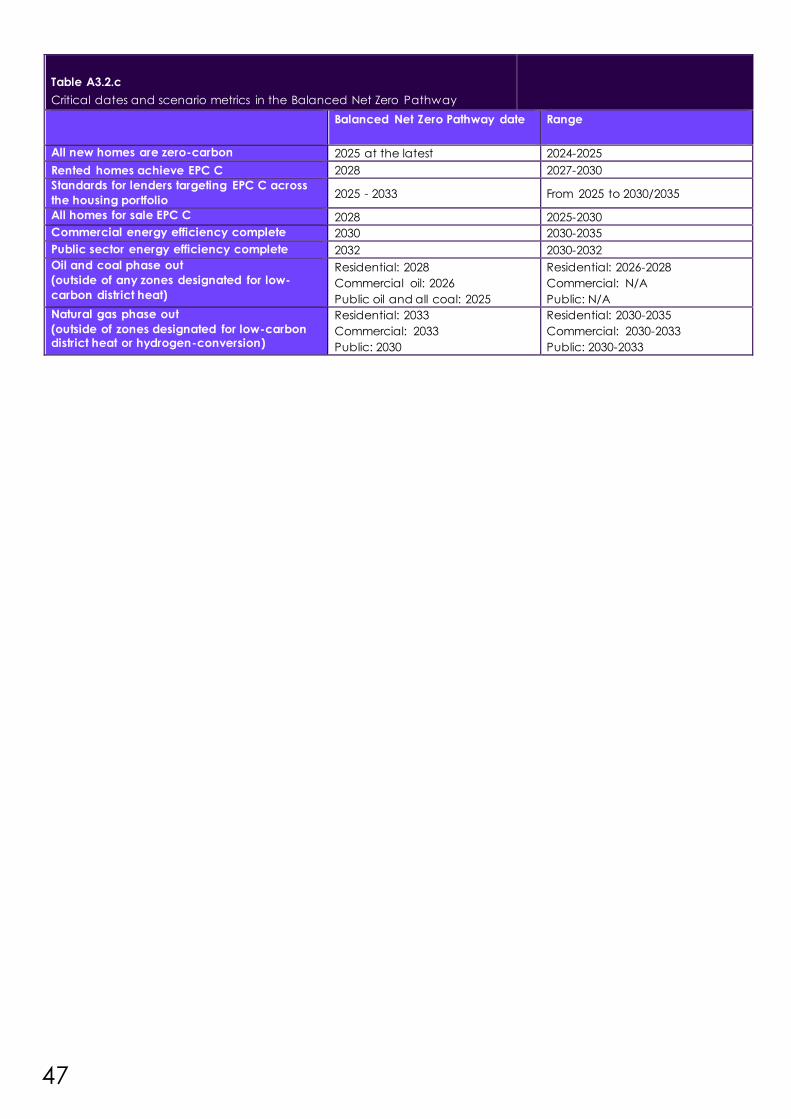
47
Table 1.11:Table 1.11
Table A3.2.c
Critical dates and scenario metrics in the Balanced Net Zero Pathway
Balanced Net Zero Pathway date Range
All new homes are zero-carbon 2025 at the latest 2024-2025
Rented homes achieve EPC C 2028 2027-2030
Standards for lenders targeting EPC C across
the housing portfolio 2025 - 2033 From 2025 to 2030/2035
All homes for sale EPC C 2028 2025-2030
Commercial energy efficiency complete 2030 2030-2035
Public sector energy efficiency complete 2032 2030-2032
Oil and coal phase out
(outside of any zones designated for low-
carbon district heat)
Residential: 2028
Commercial oil: 2026
Public oil and all coal: 2025
Residential: 2026-2028
Commercial: N/A
Public: N/A
Natural gas phase out
(outside of zones designated for low-carbon district heat or hydrogen-conversion)
Residential: 2033
Commercial: 2033
Public: 2030
Residential: 2030-2035
Commercial: 2030-2033
Public: 2030-2033
48
3. Impacts of the scenarios: costs, benefits and co-impacts on
society
In our 2019 Net Zero report, we identified buildings as one of the most costly
challenges across the economy, with in-year costs in 2050 of around £15 billion per
year and uncertainty around the total costs throughout the period to 2050. Our
updated Sixth Carbon Budget pathways estimate these full costs.
The Balanced Pathway requires investment across all buildings (residential and
non-residential) at an average rate of around ~£12 billion per year to 2050, offset
by reductions in operating costs of ~£5 billion per year:
• Total investment costs are £360 billion to 2050, of which around £250 billion is
for the programme of upgrading homes (Figure A3.2.e) and £110 billion in
public and commercial buildings.
• Total investment in the programme of efficiency in existing homes in this
scenario is around £45 billion to 2035 with a total spend of £55 billion by
2050. This compares to BEIS’s published estimate of £35-65 billion to achieve
the EPC C standard.54
• Total investment costs are less than £10,000 per household on average in
our Balanced Pathway. 63% of homes need spend no more than £1000 on
retrofitting energy efficiency measures.
• The deployment of all energy efficiency potential in public and
commercial buildings entails £2 billion per year of commercial investment
to 2030 and £0.5 billion per year of public sector investment to 2032. Annual
operating cost savings of around £1.5 billion and £0.5 billion result for
commercial and public buildings respectively.
• Including low-carbon heat increases this to £2.8 billion per year investment
in commercial buildings and £0.9 billion in public buildings through the
2030s and 2040s. This is associated with total operating cost savings of £3
billion per year across public and commercial buildings.
Energy efficiency is projected to deliver ongoing operating cost savings (Figure
A3.2.e), resulting in lower overall bills for households in all scenarios apart from
Headwinds. Behaviour change in our Balanced Pathway is estimated to contribute
around £0.4 billion of savings per year by 2050.
The Balanced Pathway requires investment at an average rate of around ~£12 billion per year to 2050, offset by reductions in fuel costs of ~£5 billion per year.
Total investment costs are less than £10,000 per household.
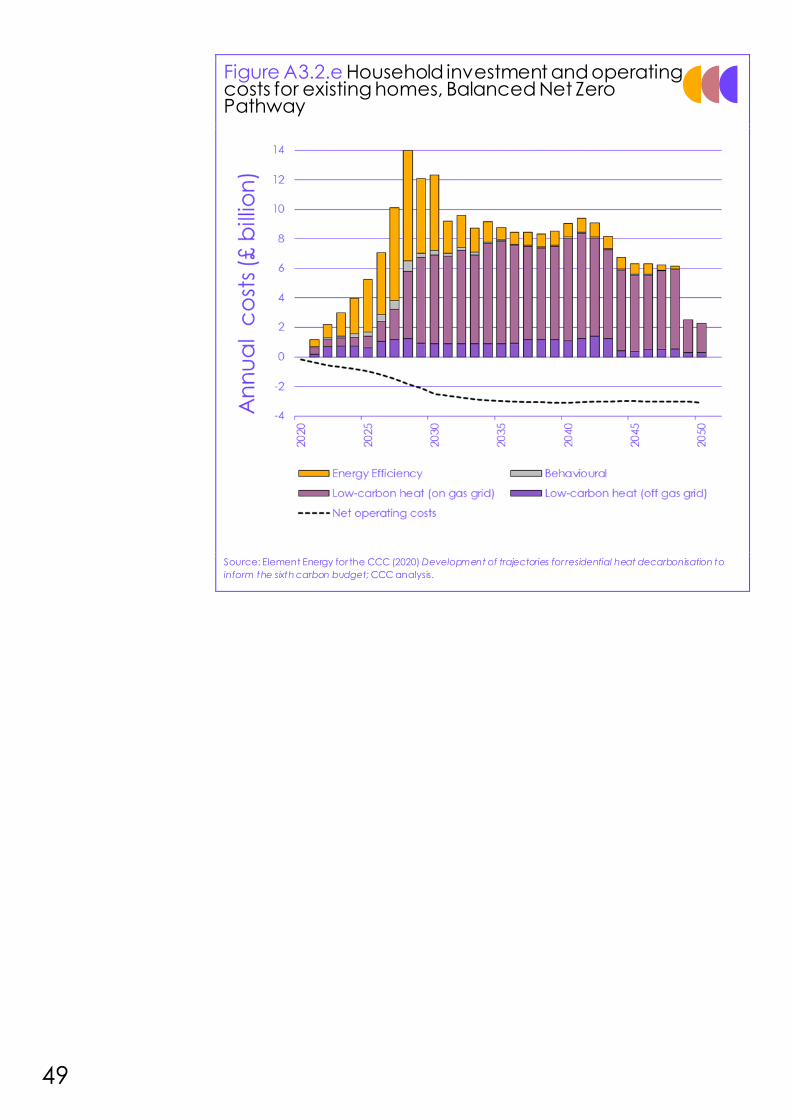
49
Figure A3.2.e Household investment and operating costs for existing homes, Balanced Net Zero Pathway
Source: Element Energy for the CCC (2020) Development of trajectories for residential heat decarbonisation to
inform the sixth carbon budget; CCC analysis.
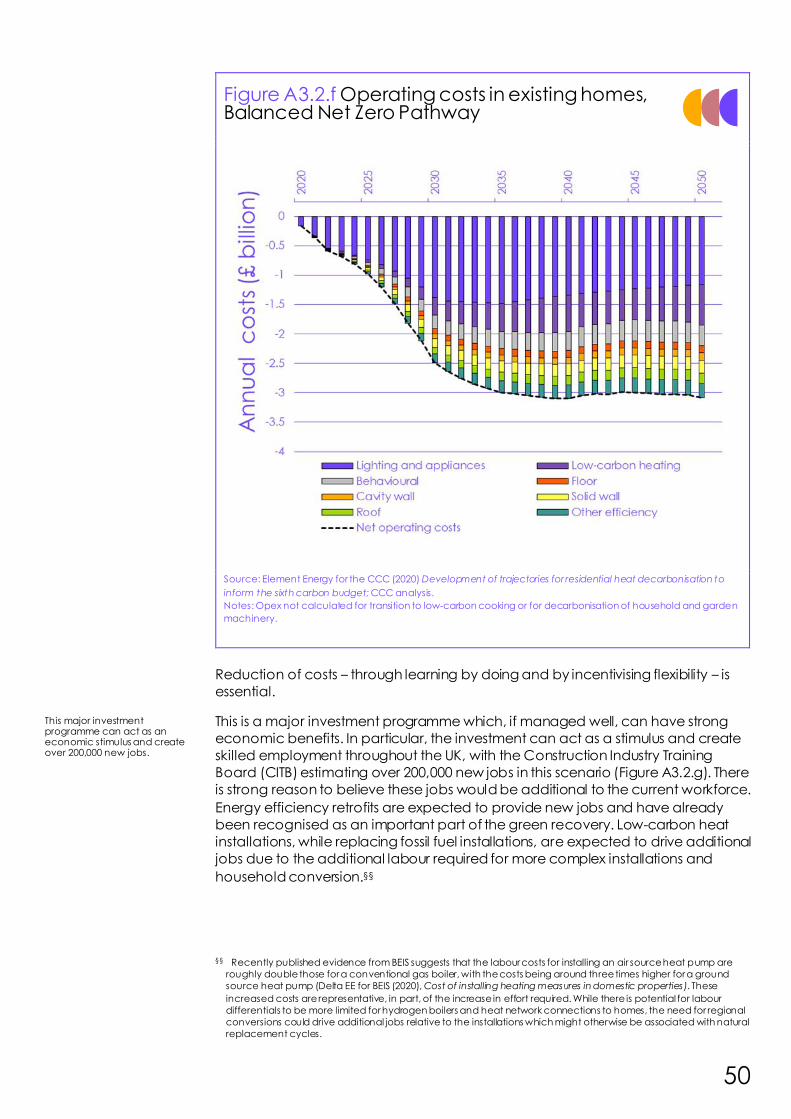
50
Figure A3.2.f Operating costs in existing homes, Balanced Net Zero Pathway
Source: Element Energy for the CCC (2020) Development of trajectories for residential heat decarbonisation to
inform the sixth carbon budget; CCC analysis.
Notes: Opex not calculated for transition to low-carbon cooking or for decarbonisation of household and garden
machinery.
Reduction of costs – through learning by doing and by incentivising flexibility – is
essential.
This is a major investment programme which, if managed well, can have strong
economic benefits. In particular, the investment can act as a stimulus and create
skilled employment throughout the UK, with the Construction Industry Training
Board (CITB) estimating over 200,000 new jobs in this scenario (Figure A3.2.g). There
is strong reason to believe these jobs would be additional to the current workforce.
Energy efficiency retrofits are expected to provide new jobs and have already
been recognised as an important part of the green recovery. Low-carbon heat
installations, while replacing fossil fuel installations, are expected to drive additional
jobs due to the additional labour required for more complex installations and
household conversion.§§
§§ Recently published evidence from BEIS suggests that the labour costs for installing an air source heat pump are
roughly double those for a conventional gas boiler, with the costs being around three times higher for a ground
source heat pump (Delta EE for BEIS (2020), Cost of installing heating measures in domestic properties). These
increased costs are representative, in part, of the increase in effort required. While there is potential for labour
differentials to be more limited for hydrogen boilers and heat network connections to homes, the need for regional
conversions could drive additional jobs relative to the installations which might otherwise be associated with natural
replacement cycles.
This major investment programme can act as an economic stimulus and create over 200,000 new jobs.

51
Upgrading the building stock will deliver a significant set of wider benefits in terms
of improved comfort and health, particularly for the fuel poor. The current
estimated cost to the NHS from poor quality housing is £1.4-2 billion per year, in
England alone.55 Energy efficiency – done alongside ventilation and shading
upgrades – can improve comfort levels year-round and guard against damp (Box
A3.2.a). The retrofit of homes to both address and adapt to climate change has
potential to deliver regeneration benefits. More widely, the shift to electrification
and heat networks can also deliver improved energy security and improved air
quality. There is some evidence to suggest that there could also be air quality
benefits from switching to hydrogen heating in terms of reduced NOx emissions,
although further research is needed.56
Figure A3.2.g Additional FTE requirements for each qualification level and specialist skill
Source: CITB (2020) Building Skills for Net Zero (draft report); CCC analysis.
Notes: Figures adjusted to represent a 2-year rolling average. ‘TrustMark retrofit other specialisms’ includes retrofit
designers, installers, advisers and assessors. FTE equivalent by skills do not sum exactly to equivalent numbers by
trade due to mapping.
Wider benefits include improved health outcomes, levels of comfort and adapting to a changing climate.

52
Box 3.2.a
A holistic approach to retrofit
Measures to address thermal efficiency, overheating, indoor air quality and moisture
must be considered together when retrofitting or building new homes.
There are zero cost actions householders can take now to better ventilate and shade
their homes, including shutting curtains during the day to limit solar gains, and opening
windows to improve ventilation.*** There are also home upgrade measures which can
improve overheating and ventilation further.
• Shading measures can include high specification blinds (e.g. with reflective backing)
and/or external shading or awnings. We estimate that installing moderate cost
measures to the most at-risk property types would add £4-£5 billion of total investment
costs to 2050.†††57
• Ventilation measures (which can also help mitigate overheating risk) include extract fans, mechanical extract ventilation (MEV) and mechanical extract ventilation and
heat recovery (MVHR). Installing extract fans is estimated to cost around £550 per
home, while MEV or MVHR could add between £1,700-£4,100 per home.58
Wider adaptation needs, such as water efficiency and flood resilience, should be
considered as part of retrofit needs but have not been costed as part of this work.
Sources: CCC and Element Energy analysis.
*** Windows should be opened when room temperatures reach 22 degrees, but should remain closed if outdoor
temperatures rise above indoor temperatures. Overheating and ventilation can both be improved by opening
windows during the night to purge heat.
††† This assumes all flats within the housing stock install high specification blinds designed to reflect solar gain and/or
allow for windows to be open during use. These costs would be additional to those presented in Figure 3.2.e.

53
52 CCC (2020) The Sixth Carbon Budget – The Path to Net Zero. Available at: www.theccc.org.uk
53 For further discussion see The Carbon Trust and Rawlings Support Services for BEIS (2016)
Evidence Gathering – Low Carbon Heating Technologies and Delta EE for BEIS (2018) Technical
feasibility of electric heating in rural off-gas grid dwellings.
54 Government response to BEIS Select Committee’s recommendations.
55 Nicol S. et al. (2015) The cost of poor housing to the NHS.
56 Gersen, S. Darmeveil, H. Van Essen, M. Martinus, G.H. and Teerlingc, O.J (2020) Domestic
hydrogen boilers in practice: enabling the use of hydrogen in the built environment. These
findings are supported by testing currently being undertaken by Worcester Bosch.
57 Element Energy for the CCC (2020) Development of trajectories for residential heat
decarbonisation to inform the sixth carbon budget
58 UCL (2020) Analysis work to refine fabric energy efficiency assumptions for use in developing the
sixth carbon budget; Currie & Brown (2019) The costs and benefits of tighter standards for new
buildings; Element Energy for the CCC (2020) Development of trajectories for residential heat
decarbonisation to inform the sixth carbon budget.

Policy recommendations for the
buildings sector
1. Current Government policy commitments 58
2. Key changes needed 60

55
Introduction The following sections are taken directly from [Chapter [2] of the CCC’s Policy
Report for the Sixth Carbon Budget.59
This chapter sets out the Committee’s recommendations in buildings for delivering
the Sixth Carbon Budget, building on the recommendations put forward in the
CCC’s 2020 Progress Report to Parliament (Table P3.1). The pathways set out in our
Advice Report see buildings emissions fall by just under 50% from 2019 to 2035, on
the way to reaching near-zero by 2050. By 2033, all of the UK’s buildings should be
energy efficient and all boiler replacements should use low-carbon technologies
such as heat pumps – or be designated as part of a zone for district heating, or
possibly hydrogen.
Table P3.1
Summary of policy recommendations in buildings
Heat and buildings
strategy
Produce a robust and ambitious heat strategy which sets the direction for the next decade, with
clear signals on the phase out of fossil heating and commitments to funding.
This must include a clear set of standards; plans to rebalance policy costs while making low-
carbon more financially attractive; plans to introduce green building passports, and a role for
area-based energy plans.
Standards for existing
buildings
Bring forward the date to reach EPC C in social homes to 2028, in line with the Private Rented
Sector (PRS) proposals, and finalise the delivery mechanism. Implement PRS proposals for homes
and non-residential buildings in line with new proposals and implement improvements to the EPC
framework, including ensuring they drive the energy efficiency measures needed. Develop
options to cover the regulatory policy gap for owner-occupied homes, looking at trigger points
at point of sale and through mortgages.
Publish proposals for standards to phase out liquid and solid fossil fuels by 2028, and in-use
standards in commercial buildings.
Newbuild standards Implement a strong set of standards – with robust enforcement – that ensure buildings are
designed for a changing climate and deliver high levels of energy efficiency, alongside low
carbon heat. Publish a robust definition of the Future Homes Standard and legislate in advance
of 2023.
Green recovery and
supply chain
development
Provide a stable long-term policy framework to support sustained growth at sufficient scale (i.e.
600,000 heat pumps per year in existing homes by 2028). Ensure continuing support for non-
residential heat pump installations beyond 2022, including low -carbon heat sources for district
heating schemes. Create a level-playing field for hybrid heat pumps by continuing to support
new business models off the gas grid both financially and by ensuring hybrid heat pumps are an
integral part of PAS2035 retrofit coordinator advice.
Hydrogen
development
BEIS and Ofgem should undertake a programme of research to identify priority candidate areas
for hydrogen, along with areas which are unlikely to be suitable, to inform development and
network investments. Undertake one or more hydrogen trials at a representative scale in the
early 2020s (e.g. 300-3000 homes), to inform decisions on low-carbon zoning from 2025. All new
boilers to be hydrogen-ready by 2025 at the latest. Continue further pilots in the late 2020s,
where valuable to inform large-scale take-up.
Buildings is a particularly challenging sector to decarbonise.
• Progress has been slow to date, with emissions remaining flat or rising for the
last five years.
• The implementation of key measures remains at very low levels, with weak
supply chains for key measures such as insulation and heat pumps, and
hydrogen use still in a development phase.
• Levels of public engagement are low - in particular, there is low awareness
of the need to shift to low-carbon heating.
Low levels of public engagement and higher upfront costs of low-carbon heating make buildings particularly challenging to decarbonise.
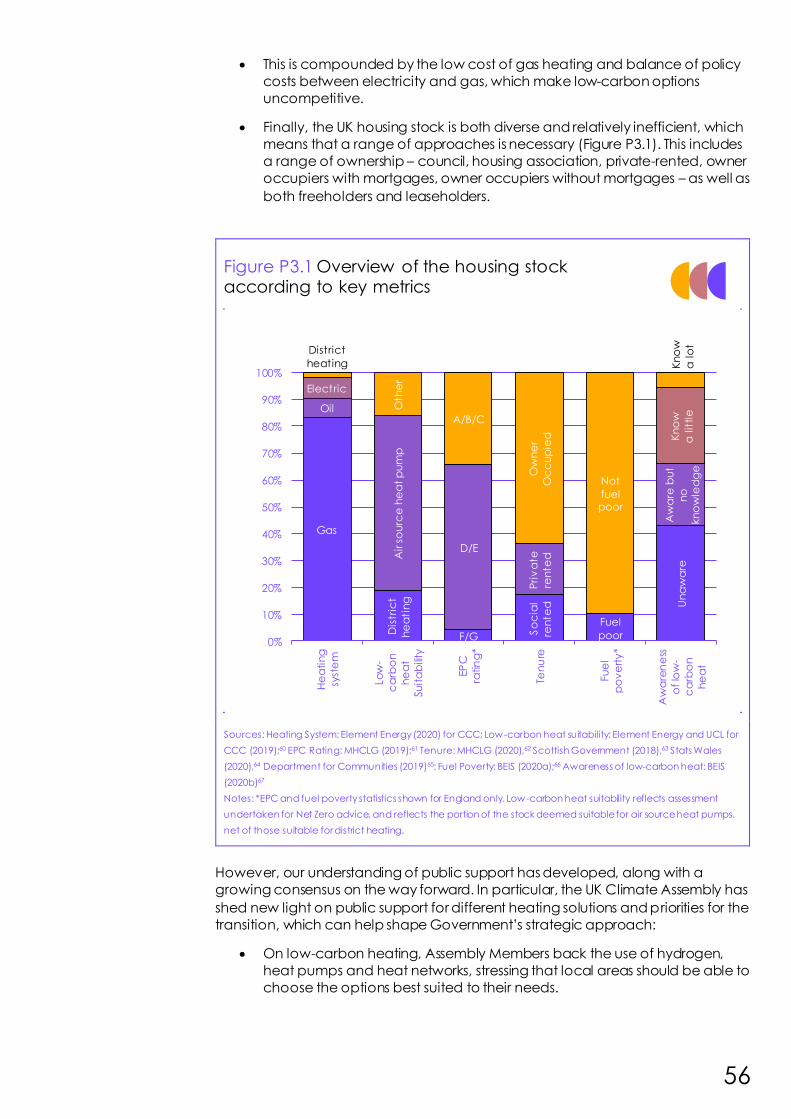
56
• This is compounded by the low cost of gas heating and balance of policy
costs between electricity and gas, which make low-carbon options
uncompetitive.
• Finally, the UK housing stock is both diverse and relatively inefficient, which
means that a range of approaches is necessary (Figure P3.1). This includes
a range of ownership – council, housing association, private-rented, owner
occupiers with mortgages, owner occupiers without mortgages – as well as
both freeholders and leaseholders.
Figure P3.1 Overview of the housing stock according to key metrics
Sources: Heating System: Element Energy (2020) for CCC; Low-carbon heat suitability: Element Energy and UCL for
CCC (2019);60 EPC Rating: MHCLG (2019);61 Tenure: MHCLG (2020),62 Scottish Government (2018),63 Stats Wales
(2020),64 Department for Communities (2019)65; Fuel Poverty: BEIS (2020a);66 Awareness of low-carbon heat: BEIS
(2020b)67
Notes: *EPC and fuel poverty statistics shown for England only. Low-carbon heat suitability reflects assessment
undertaken for Net Zero advice, and reflects the portion of the stock deemed suitable for air source heat pumps,
net of those suitable for district heating.
However, our understanding of public support has developed, along with a
growing consensus on the way forward. In particular, the UK Climate Assembly has
shed new light on public support for different heating solutions and priorities for the
transition, which can help shape Government’s strategic approach:
• On low-carbon heating, Assembly Members back the use of hydrogen,
heat pumps and heat networks, stressing that local areas should be able to
choose the options best suited to their needs.
Gas
Oil
Electric
District
heating
Dis
tric
t
he
ati
ng
Air
so
urc
e h
ea
t p
um
pO
the
r
F/G
D/E
A/B/C
So
cia
l
ren
ted
Pri
va
te
ren
ted
Ow
ne
r
Oc
cu
pie
d
Fuel
poor
Not
fuel poor
Un
aw
are
Aw
are
bu
t
no
kn
ow
led
ge
Kn
ow
a l
ittl
eK
no
w
a l
ot
0%
10%
20%
30%
40%
50%
60%
70%
80%
90%
100%
He
ati
ng
syst
em
Lo
w-
ca
rbo
n
he
at
Su
ita
bili
ty
EP
C
ratin
g*
Ten
ure
Fu
el
po
ve
rty
*
Aw
are
ne
ss
of
low
-
ca
rbo
n
he
at
57
• On home retrofits, they emphasised the need to minimise disruption in the
home, put in place support around costs and offer flexibility and choice to
householders.
BEIS and MHCLG are currently developing a Heat and Buildings Strategy for
imminent publication, following on from the 2018 evidence assessment.68 This aims
to address the challenges and set the policy direction through the next decade.
We have worked up a set of policy recommendations based on evidence of what
works,69 insights from our pathways work and significant stakeholder input, to
support the development of the strategy. This was presented at an Autumn
Ministerial roundtable and is set out in the following section. Further detail on how
we have developed our scenarios is set out in the Method report.
The following sections cover:
1. Current policy commitments
2. Key changes required
Government’s Heat and Buildings Strategy aims to address these challenges and is due shortly. This advice supports that strategy development.
58
1. Current Government policy commitments
The UK Government has developed plans to improve the energy efficiency of all
buildings over the next 10-15 years, and plans to phase-out the installation of new
high-carbon fossil fuels in the 2020s:
• Home efficiency. In the 2017 Clean Growth Strategy, the Government
committed to getting all fuel poor and rented homes to EPC C by 2030,
and other owner-occupied homes by 2035. In September 2020 it published
proposals to bring forward the date for private-rented homes to 2028.
• Rented commercial and public buildings. Existing regulations require all
privately-rented properties in England and Wales to be at least EPC E by
April 2023. In October 2019 the Government published proposals for all non-
residential private-rented buildings in England and Wales to meet EPC B by
April 2030 where cost-effective, based on meeting a seven-year payback
test. BEIS estimate 64% of the stock will meet the EPC B target, 20% to fail
but meet EPC C cost-effectively and 17% to be unable to meet EPC C cost-
effectively.70
• New buildings. Under the proposed Future Homes Standard, no new
buildings will be built with fossil fuel heating. UK Government is looking to
introduce this in advance of 2025 in England and Wales, with the Scottish
Government aiming for the same outcome from 2024.
• Commercial efficiency. In the Clean Growth Strategy, the Government set
a goal to enable businesses and industry to improve energy efficiency by
at least 20% by 2030.
• Public buildings. Government is aiming to reduce public sector emissions by
50% by 2032 against 2017 levels.
• High-carbon fossil fuel phase out. The commitment here is to phase out the
installation of new coal and petroleum appliances in the 2020s, on which a
consultation is due shortly. This covers 11% of the current energy
consumption for heating and hot water71.
This regulatory timetable is supported by £9.2 billion of funding targeting public
sector buildings, social homes and the fuel poor, on top of at least £4 billion
committed under the ECO programme. An additional £2.0 billion of funding for
homes has recently been announced through the Green Homes Grant, now
extended until the end of the 2021/22 financial year.72
The UK Government’s 2020 Ten Point Plan includes a number of further
commitments. It is aiming to achieve sales of 600,000 heat pumps a year (across all
homes) by 2028, and investing in hydrogen development, including a 300 home
trial in Fife.73
The Scottish Government has a more ambitious programme in place in some
areas. It has published proposals for point-of-sale standards to require all owner-
occupied homes to meet EPC C, to be introduced from 2024, with a cap of
£15,000 per home. This means that any homes which are below an EPC C
efficiency rating will need to be upgraded before they can be sold. This is
supported by £1.6 billion of funding to 2025 across buildings heat and efficiency.
Smaller amounts of funding are available in Wales and Northern Ireland.
The Government plans to get all homes to EPC C over the next 10-15 years.
Energy efficiency funding is targeted at the fuel poor, at social homes and public buildings at a UK level.
There are plans to phase out liquid and solid fossil fuels but no current proposals to phase out natural gas.
59
The main regulatory policy gaps are efficiency standards for 15.5 million owner-
occupiers (of which over 65% are below EPC C), owner-occupied commercial
buildings and plans for phasing out natural gas heating:
• There are currently about 29 million homes in the UK, of which 19 million are
below EPC C. Of the 29 million, 18 million are owner-occupied, of which
around 1.5m are fuel poor*. Accounting for the Scottish Government
proposals, this means that there are 15.5 million potentially ‘able-to-pay’
properties not currently covered by proposed standards.
• Commercial buildings which are owned rather than leased are likewise not
covered by current policy proposals.
• Around 85% of existing homes and 63% of public and commercial heating is
met through natural gas which is not currently covered by regulatory
proposals to phase out natural gas.
In the next section, we set out what more is required to address this regulatory
policy gap as part of a broader policy package which creates employment and
delivers a broad set of wider benefits in terms of comfort, health and ongoing
energy bills savings.
* Calculated from percentage for England, in: BEIS (2020) 'Table 18: Fuel poverty detailed tables 2020', Fuel poverty
stat istics report for 2020. Department for Business, Energy & Industrial Strategy.
15.5 million ‘owner-occupied’ homes are not currently covered by proposed efficiency standards in England, Wales and Northern Ireland.
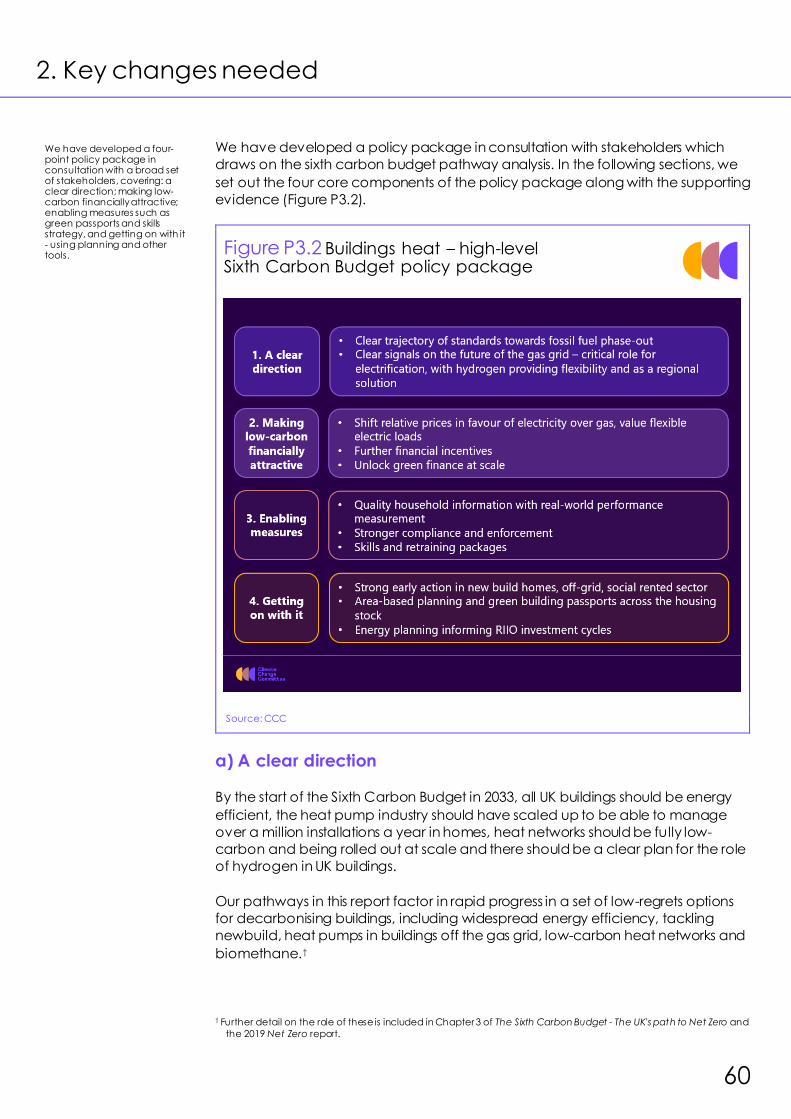
60
2. Key changes needed
We have developed a policy package in consultation with stakeholders which
draws on the sixth carbon budget pathway analysis. In the following sections, we
set out the four core components of the policy package along with the supporting
evidence (Figure P3.2).
Figure P3.2 Buildings heat – high-level Sixth Carbon Budget policy package
Source: CCC
a) A clear direction
By the start of the Sixth Carbon Budget in 2033, all UK buildings should be energy
efficient, the heat pump industry should have scaled up to be able to manage
over a million installations a year in homes, heat networks should be fully low-
carbon and being rolled out at scale and there should be a clear plan for the role
of hydrogen in UK buildings.
Our pathways in this report factor in rapid progress in a set of low-regrets options
for decarbonising buildings, including widespread energy efficiency, tackling
newbuild, heat pumps in buildings off the gas grid, low-carbon heat networks and
biomethane.†
† Further detail on the role of these is included in Chapter 3 of The Sixth Carbon Budget - The UK's path to Net Zero and
the 2019 Net Zero report.
We have developed a four-point policy package in consultation with a broad set of stakeholders, covering: a clear direction; making low-carbon financially attractive; enabling measures such as green passports and skills strategy, and getting on with it - using planning and other tools.
61
i) The importance of electrification
Our Balanced Pathway is informed by the following judgements regarding the gas
grid:
1. Efficiency is a fundamental first step, or the scale of the problem gets too
big.
2. Low-carbon heat networks are a competitive and flexible solution in heat
dense areas such as cities.
3. System costs are not a major differentiator between electrical and
hydrogen heat for remaining homes on the gas grid,74 so public support is
likely to determine the shape of our decarbonised future. With
coordination, solutions can vary by region, depending on local resources,
infrastructure and consent.
4. Full hydrogen conversion is unwieldy due to the low system efficiency which
poses a significant supply-side challenge (Chapter 2, Advice Report). As a
worked example, 800 TWh of hydrogen would require 100-150 GW of gas
reforming with CCS; or 300 GW offshore wind capacity if just using
electrolysers. On this basis we do not recommend planning on a full
hydrogen conversion. Full electrification would be challenging (though not
impossible) as it requires considerable flexible supply and possibly an
element of boiler scrappage if delays in building supply chains persist. This
means it is sensible to plan for a range of solutions.
This implies electrification is of primary strategic importance for Net Zero; crucially,
this strategic importance remains true even where hydrogen grid conversion is
widespread (as illustrated in our Headwinds Pathway). Hydrogen is particularly
valuable where it can provide flexibility – either at a system-level within the power
sector, or at a buildings level through hybrid heat pumps. It could also play a
supporting role through targeted regional gas grid conversion, where there is
public support and an underlying technical case (for example, due to co-location
with an industrial hydrogen cluster). Hybrid heat pumps offer a number of benefits
and should be covered by the policy package (Box P3.1).
It is essential that the Government sets a clear commitment to electrification
through the 2020s, including a stable and long-term support framework to build the
heat pump supply chain to sufficient scale to deliver near term emissions
reductions and keep full electrification on the table (1 million heat pumps a year in
homes by 2030) (Box P3.2).
Government needs to give clear signals – electrification is of primary strategic importance; hydrogen provides flexibility and could play a role in regional grids, particularly in areas near industrial clusters.
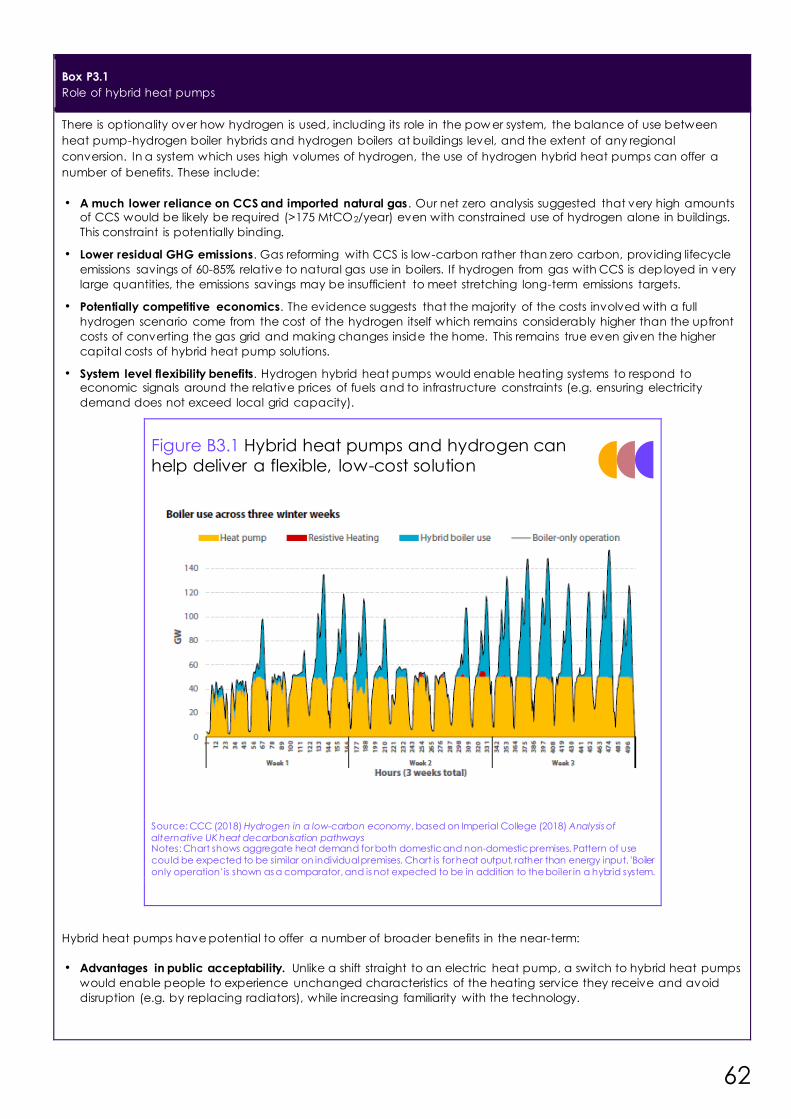
62
Box P3.1
Role of hybrid heat pumps
There is optionality over how hydrogen is used, including its role in the pow er system, the balance of use between
heat pump-hydrogen boiler hybrids and hydrogen boilers at buildings level, and the extent of any regional
conversion. In a system which uses high volumes of hydrogen, the use of hydrogen hybrid heat pumps can offer a
number of benefits. These include:
• A much lower reliance on CCS and imported natural gas. Our net zero analysis suggested that very high amounts of CCS would be likely be required (>175 MtCO2/year) even with constrained use of hydrogen alone in buildings.
This constraint is potentially binding.
• Lower residual GHG emissions. Gas reforming with CCS is low-carbon rather than zero carbon, providing lifecycle
emissions savings of 60-85% relative to natural gas use in boilers. If hydrogen from gas with CCS is dep loyed in very
large quantities, the emissions savings may be insufficient to meet stretching long-term emissions targets.
• Potentially competitive economics. The evidence suggests that the majority of the costs involved with a full
hydrogen scenario come from the cost of the hydrogen itself which remains considerably higher than the upfront
costs of converting the gas grid and making changes inside the home. This remains true even given the higher
capital costs of hybrid heat pump solutions.
• System level flexibility benefits. Hydrogen hybrid heat pumps would enable heating systems to respond to economic signals around the relative prices of fuels and to infrastructure constraints (e.g. ensuring electricity
demand does not exceed local grid capacity).
Figure B3.1 Hybrid heat pumps and hydrogen can help deliver a flexible, low-cost solution
Source: CCC (2018) Hydrogen in a low-carbon economy, based on Imperial College (2018) Analysis of
alternative UK heat decarbonisation pathways Notes: Chart shows aggregate heat demand for both domestic and non-domestic premises. Pattern of use
could be expected to be similar on individual premises. Chart is for heat output, rather than energy input. 'Boiler
only operation' is shown as a comparator, and is not expected to be in addition to the boiler in a hybrid system.
Hybrid heat pumps have potential to offer a number of broader benefits in the near-term:
• Advantages in public acceptability. Unlike a shift straight to an electric heat pump, a switch to hybrid heat pumps
would enable people to experience unchanged characteristics of the heating service they receive and avoid
disruption (e.g. by replacing radiators), while increasing familiarity with the technology.
63
• Scope for accelerated near term deployment and emissions reductions. Hybrid heat pumps can be installed
alongside existing systems such that distressed purchases need not be a barrier, and installation is more viable in
advance of boiler end of life. It can also be installed alongside, rather than follow ing improvements to the energy
efficiency of buildings.
• Suitability in hard-to-decarbonise properties, particularly in homes off the gas grid. There are estimated to be around 1.3 million heritage homes, including 400,000 listed buildings. Homes off the gas grid are larger on average.
For a portion of hard-to-decarbonise homes, hybrid solutions and cascading heat pumps will be more cost-
effective than extensive efficiency upgrades with a large single heat pump.75
• Reducing reliance on single set of government-led decisions in mid 2020s. By taking the first part of the decision
(i.e. on a move to hybrid heat pump-boiler systems) over how to decarbonise heat fully for on-gas properties now,
the second part – on how to reduce emissions from the considerably lower residual natural gas use – could
potentially follow in the second half of the 2020s.
In the context of the benefits that hybrid heat pumps have potential to provide, it remains that there are risks and
uncertainties which would also need to be overcome. While hybrid heat pumps can offer a host of benefits, in order
to achieve these it is important that hybrids are used effectively in homes. Based on work undertaken by Imperial
College London our base assumption is that hybrid heat pumps can operate in hea t pump mode up to 80% of the
time.76 Other trial data (e.g. from Passiv Systems, when combined with smart controls) supports the Imperial
assumptions. However there is also evidence of homes using heat pump components of hybrids much less.‡ A
sensitivity conducted on our scenarios suggests that hybrid heat pumps which only operate in heat pump mode 50%
of the time (relative to 80% of the time in the baseline case) are significantly less cost effective.
In order to overcome challenges of this kind, standards on smart heating controls and operation, and rebalancing of
gas and electricity prices, would be important parts of any policy package.
Sources: CCC analysis; Energy Systems Catapult for BEIS (2019); Element Energy and UCL for CCC (2019)1
Box. P3.2
Heat pump deployment in homes over the coming decade
Our Balanced Pathway includes deployment of 5.5 million heat pumps in homes to 2030, of which 2.2 million are in
new build homes, with a large proportion of the remainder expected to be installed off the gas grid. This is consistent
with deployment rates reaching just over 1 million a year in homes by 2030, compared to just 26,000 a year currently.
The deployment trajectory for heat pumps in our Balanced Pathway reflects our assessment that there remains a
strong case for delivering growth of this scale, regardless of the heat mix chosen post-2030:
• Clear market signals. A commitment to strong near-term uptake provides the policy certainty necessary to support the levels of electrification across scenarios (with Headwinds also reaching deployment of 1 million heat
pumps a year by the early 2030s).
• Preparing supply chains to keep options open for full electrification. For full electrification, boiler lifetimes imply a
need to scale up markets and supply chains to cover all new installations by the mid-2030s at the latest,
representing up to 1.8 million heat pumps a year in existing homes. Supply chains must grow steadily to
accommodate not only first-time heat pump installations in existing homes, but also new build installations
(including retrofits for those homes being built now with gas) and replacements (Figure B3.2).
• Further benefits of early deployment. These include driving down near-term emissions (reducing the scale of the challenge to 2050), increasing consumer familiarity ahead of further widespread adoption and driving down the
costs through learning by doing.
Our analysis finds that deployment at this scale is achievable. The level of deployment remains well within the
deployment constraints developed in discussion with stakeholders, assumed to reach around 1.3 million heat pumps
by 2030. There is also evidence to suggest that this level of deployment may not be contingent on significant retrofit,
with nearly 7 million homes in our scenarios receiving no or low energy efficiency packages. Where deployment
comes in the form of hybrid heat pumps, early deployment is likely to be possible across a wider variety of homes.
‡ The Energy Systems Catapult conducted a trial where the performance of hybrid heat pumps was shown to be highly
dependent on household heating behaviours, with heat pumps operating as part of hybrid heating systems
delivering between 6% and 63% of the heating in different homes.

64
Figure B3.2 Annual heat pump deployment in homes
Source: CCC analysis, Element Energy for the CCC (2020) Development of t rajectories for residential heat
decarbonisation to inform the Sixth Carbon Budget
Source: CCC analysis; Element Energy for the CCC (2020) Development of t rajectories for residential heat decarbonisation to inform the Sixth Carbon
Budget.
ii) Phase-out dates and standards
The second element to setting direction is a clear timetable, backed by standards.
We have set out an indicative timetable based on Government’s existing
commitments, and extending its current regulatory approach (Table 3.1). This is
driven by the need to minimise costs and disruption, which means working as
much as possible with existing technology lifetimes, while minimising scrappage. It
would be possible to deliver a similar outcome through higher levels of subsidy and
later regulation, but our modelling suggests that this is the minimum level of
additional regulatory commitment required to deliver the programme of Net Zero
buildings in the Sixth Carbon Budget pathway. Alternative regulatory approaches
could also be possible, where they deliver similar levels of ambition.
0
500
1,000
1,500
2,000
2,500
202
0
202
5
203
0
203
5
204
0
204
5
205
0
An
nu
al
he
at
pu
mp
inst
alla
tion
s
(th
ou
san
ds)
New build heat pumps - replacements Retrofit hybrid heat pumps - replacements
Retrofit GSHPs - replacements Retrofit ASHPs - replacements
New build heat pumps Retrofit hybrid heat pumps
Retrofit GSHPs Retrofit ASHPs
A clear timetable is needed, backed by standards. We have set out an indicative timetable based on extending the current regulatory approach and working as much as possible with existing technology lifetimes to minimise costs and disruption.

65
Setting a phase out date for natural gas (outside of designated hydrogen or district
heat conversion zones) can build on the approach for high-carbon fossil fuels. The
UK Citizens Assembly supported a ban on new gas boilers between 2030-2035, with
86% in favour.77
§ In Scotland, these requirements are subject to spending caps. Our scenarios also implicitly assume spending limits
form part of the minimum standards for all homes – for instance, we exclude measures from our economic potential
where the costs are deemed too high, including for some hard-to-treat measures.
Table P3.2
Critical dates and policy implications in the Balanced Pathway for buildings
Indicative
date
Policy implications
Efficiency
All new buildings are
zero-carbon
2025 at
the latest
Implement a strong set of standards that ensure buildings are designed for a
changing climate and deliver high levels of energy efficiency, alongside low -
carbon heat. Commit to publishing a robust definition of the Future Homes
Standard which is legislated in advance of 2023.
Rented homes achieve
EPC C
2028 This means reforming EPCs to make them fit for purpose, aligning the
timetable for social homes to private-rented sector (PRS) proposals, finalising
a delivery mechanism for social homes, and legislating the PRS proposals.
Standards for lenders
targeting EPC C across
the housing portfolio
2025 - 2033 Government to pursue options set out in the Green Finance Strategy for
mandatory disclosure by lenders of average efficiency across the mortgage
portfolios, and introduce a progressive set of minimum standards.
All homes for sale EPC
C
2028 No buildings can be sold unless they meet the minimum standard.§ At the
current housing turnover of once every ten years for mortgagors and once
every 24 years for outright owners, regulations at point of sale would be
expected to result in a further 15% of owner occupied homes meeting the
required standard by 2035 (with further upgrades driven by the standards on
lenders, totalling at least 60% of owner-occupiers overall).
All commercial
efficiency renovations
completed
2030 BEIS must accelerate plans for a new in-use performance standard for
commercial properties along with plans for SMEs and legislate the private-
rented proposals.
Heating
All boilers are
hydrogen-ready
2025 Based on projected additional costs of £100 or less per boiler, and with a view
to minimising scrappage, we recommend appliance standards for hydrogen-
ready boilers. Should costs prove higher or safety considerations materialise,
this should be reviewed. Early commitments and widespread standards
would be expected to drive costs down through competition and economies
of scale.
Oil and coal phase out
(outside of any zones
designated for low
carbon district heat)
2028 BEIS must now publish long-awaited proposals to phase out the installation of
new high-carbon fossil heating. Further support is needed in the near-term to
build critical supply chains and to channel investment in networks.
Natural gas phase out
(outside of any zones
designated for low-
carbon district heat or
hydrogen-conversion
areas)
2033 A decision-making framework spanning national, regional and local levels,
and informed by regional and local area planning, is needed to facilitate
decisions on the future of heat. A programme of area-based energy planning
can provide a locus for meaningful public engagement. In areas not
designated as areas for hydrogen or heat networks, standards phasing out
the installation of gas appliances will allow low-carbon heating to become
widespread by 2050.
Gas CHP phase out for
low-carbon heat
networks
2025 Relative Gas Combined Heat and Power (CHP) carbon benefits reduce as
the grid intensity continues to fall through the 2020s. On this basis, we assume
that all new district heat network connections from 2025 are low -carbon,
requiring emissions performance standards and funding for low -carbon heat
sources. All heat networks supplied by legacy CHP schemes convert to low -
carbon heat sources by 2040.

66
Boiler lifetimes of 15 years imply a phase out date for the installation of fossil fuel
boilers in advance of 2035. Our Balanced Pathway picks a central date of 2033.**
This in turn implies:
• The need to prepare the building stock for low-carbon heating in advance
of this, through an approach which completes the majority of energy
efficiency installations by the time the full-scale transition occurs. Our
Balanced scenario assumes 76% of fabric energy efficiency measures in
homes are deployed by 2033 and that 100% of public and commercial
energy efficiency measures included in the scenario are complete. ††
• The need to build low-carbon heat supply chains in the near term, such
that they are able to service up to around 1.8 million homes by 2033 and
50% of the non-residential heating market.‡‡
• The need to designate areas for low carbon district heat networks and
hydrogen conversion well in advance of 2033.
– This would enable buildings in these areas to be given an exemption
from a ban on fossil fuel boilers, such that they need only undergo one
low-carbon heating transition and that infrastructure costs can be
minimised.§§
– An exemption could take different forms and could still require new
heating systems in these areas to meet certain conditions (such as
hybrid heat pump configurations) even where some continued role for
fossil fuels is permitted beyond 2033.
Moreover, keeping hydrogen in play means progressive steps building through the
2020s to develop an integrated approach across buildings, CCS, industry and
transport (Figure P3.3).
• Where electrification remains the primary route to decarbonise buildings, it
is expected that decisions on the future of the gas grid are most likely to
comprise of a series of decisions on hydrogen zoning, informed by cross
sectoral considerations.
• Decisions on those areas which will not be converted will be of equal
importance, with early designation enabling effective targeting of electric
heating and district heating, and associated infrastructure upgrades.
• This approach to decision-making can help minimise the risk of remaining
uncertainties holding up progress on decarbonisation.
• It also implies the need for careful consideration of how the distributional
implications of staggered low-carbon heat conversions might be
managed.
** Phase out regulations on the gas grid are envisaged to prevent the installation of new fossil fuel boilers in areas not
designated for hydrogen or low carbon heat network conversion. An earlier date of 2030 is adopted for public
buildings in order to achieve the targeted 50% cut in emissions by 2032.
†† See Chapter 3 of the Methodology Report for details of what is included for public and commercial energy
efficiency in our scenarios.
‡‡ 1.8 million homes based on current annual boiler sales. Some of these homes would be expected to switch onto
district heat, with a small number potentially needing low-efficiency electrified solutions.
§§ For instance, heat density is a key determinant of the costs of low carbon district heat provision. On this basis it is
preferable to maximise the number of buildings using low carbon district heat where a heat network is in operation,
This suggests the need to minimise alternative heating solutions.
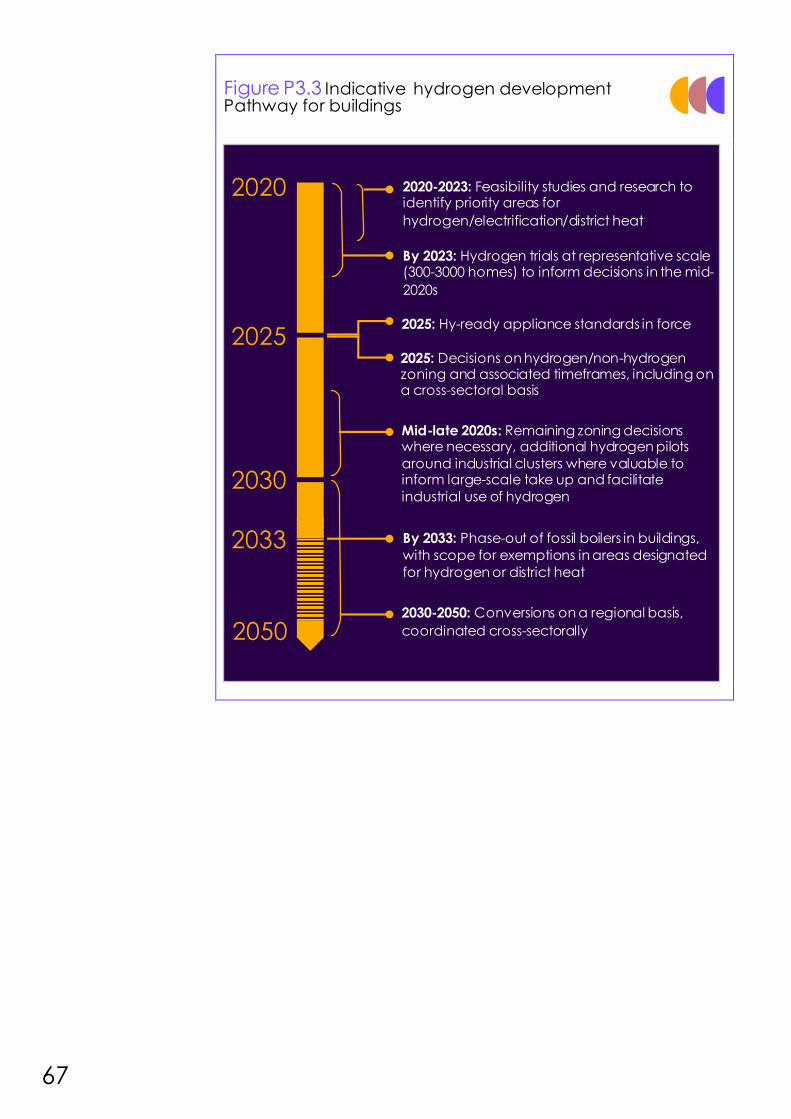
67
Figure P3.3 Indicative hydrogen development Pathway for buildings
2020
2030
2020-2023: Feasibility studies and research to identify priority areas for
hydrogen/electrification/district heat
By 2023: Hydrogen trials at representative scale (300-3000 homes) to inform decisions in the mid-
2020s
2025: Hy-ready appliance standards in force
2050
Mid-late 2020s: Remaining zoning decisions where necessary, additional hydrogen pilots
around industrial clusters where valuable to inform large-scale take up and facilitate
industrial use of hydrogen
By 2033: Phase-out of fossil boilers in buildings,
with scope for exemptions in areas designated
for hydrogen or district heat
2030-2050: Conversions on a regional basis,
coordinated cross-sectorally
2025
2033
2025: Decisions on hydrogen/non-hydrogen zoning and associated timeframes, including on a cross-sectoral basis
68
b) Making low-carbon buildings financially attractive
Policy must make low-carbon heat affordable and cost-competitive by targeting
cost reduction, rebalancing policy costs and increasing funding for low-carbon
heat.
i) Cost reduction
The first step is to minimise costs through fabric efficiency measures, through
learning by doing, and by enabling household-level flexibility:
• When installed in energy efficient homes, low-carbon heat can offer
running cost savings relative to fossil fuel alternatives
• Innovation provides scope for cost savings over time in both energy
efficiency and low-carbon heat, including through innovative roll-out
models, modularisation and improved system design***,78
• Valuing and enabling flexible loads can cut costs and carbon. We estimate
that pre-heating could save up to £2 billion per year.79
Government and Ofgem can enable household-level flexibility through
implementing their Smart Systems and Flexibility Plan, including rolling out
mandatory half-hourly settlement, and supporting cost-reflective charging and
smart tariffs. Standards on smart heating could help maximise emissions reductions
and minimise the system costs of electrifying heat.
ii) Rebalancing policy costs Rebalancing policy costs on electricity and gas is also a critical enabler, cutting
running costs for electric heating where it is displacing fossil fuels (Figure P3.4).
A favourable VAT regime – including on the sale and installation low-carbon
technology – can also support low-carbon solutions.
More broadly, it will be essential for Government to assess how the costs of all forms
of heating – electric, hydrogen, hydrogen-hybrid and heat networks – can be
made fair, and protect vulnerable and low-income households. This is particularly
important with different solutions emerging in different parts of the country.
*** This could include a role for area-based approaches to retrofit, making use of the ‘mass customisation’ model
described in a recent report by the Connected Places Catapult and the Housing Innovation Programme.
Energiesprong provides an excellent example of an approach which can deliver holistic deep retrofits for groups of
homes whilst also offering guaranteed performance.
Policy must make low-carbon heat affordable and cost-competitive by targeting cost reduction, rebalancing policy costs and increasing funding for low-carbon heat.
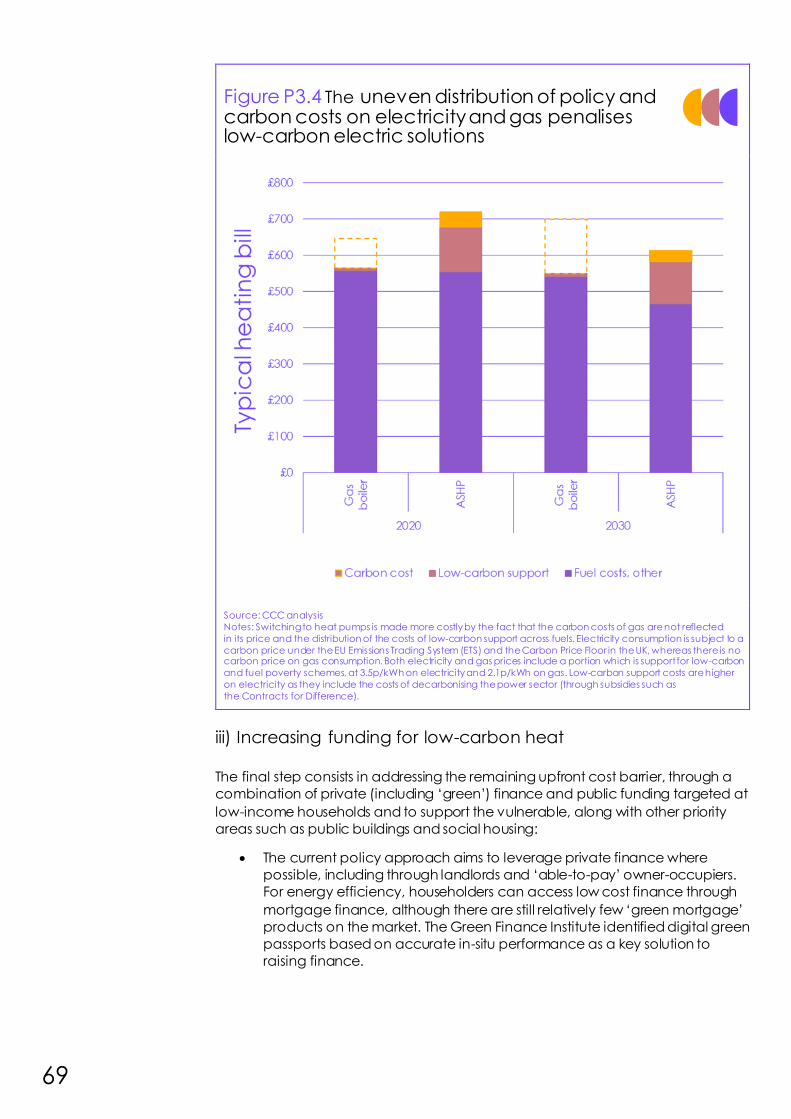
69
iii) Increasing funding for low-carbon heat The final step consists in addressing the remaining upfront cost barrier, through a
combination of private (including ‘green’) finance and public funding targeted at
low-income households and to support the vulnerable, along with other priority
areas such as public buildings and social housing:
• The current policy approach aims to leverage private finance where
possible, including through landlords and ‘able-to-pay’ owner-occupiers.
For energy efficiency, householders can access low cost finance through
mortgage finance, although there are still relatively few ‘green mortgage’
products on the market. The Green Finance Institute identified digital green
passports based on accurate in-situ performance as a key solution to
raising finance.
Figure P3.4 The uneven distribution of policy and carbon costs on electricity and gas penalises low-carbon electric solutions
Source: CCC analysis
Notes: Switching to heat pumps is made more costly by the fact that the carbon costs of gas are not reflected
in its price and the distribution of the costs of low-carbon support across fuels. Electricity consumption is subject to a
carbon price under the EU Emissions Trading System (ETS) and the Carbon Price Floor in the UK, whereas there is no carbon price on gas consumption. Both electricity and gas prices include a portion which is support for low-carbon
and fuel poverty schemes, at 3.5p/kWh on electricity and 2.1p/kWh on gas. Low-carbon support costs are higher
on electricity as they include the costs of decarbonising the power sector (through subsidies such as
the Contracts for Difference).
70
• Public spending should be prioritised for low income households and areas
of the economy which do not have recourse to other funding. Additional
Exchequer-funding may facilitate the transition (see Chapter 6 of our
Advice report).
• Public spend can also act as an economic stimulus as part of the Green
Recovery. This has been recognised by the Government in the launch of
the Green Homes Grant and Public Sector Decarbonisation scheme.
We have mapped current public commitments against investment projections for
existing buildings. Our assessment is that, by and large, existing public funds are
well targeted. However, we have identified three major funding gaps to 2030:
public sector buildings, along with bridge funding for heat pumps and low-carbon
heat networks (Table P3.3).
In our accompanying Advice report (Chapter 6), we set out an illustrative funding
package in 2030 of £5-7 billion/year in 2030, including an additional £0.5
billion/year for low-income households; £0.5 billion/year for social homes and £1
billion/year for public sector buildings.
We also map current funding commitments against investment projections for
public and commercial buildings, finding a shortfall in support for public buildings
and negligible support for commercial buildings (Table P3.3):
• Funding for decarbonising the public sector currently stands at around £1
billion with a pledge to increase this to £3 billion, including grants under the
Public Sector Decarbonisation Scheme in England, the Public Sector Low
Carbon Skills Fund and additional funds in Scotland and Wales.80,81 We
estimate costs of delivering public sector energy efficiency and heat
pumps to 2030 of over £5 billion in our Balanced Pathway, suggesting a
shortfall which will need to be met by central Government and/or
supplemented by public bodies using interest free loans such as Salix or
raising other funds.
• A substantial amount of investment in commercial energy efficiency is
required in our scenarios, which may need to be largely met by the private
sector. BEIS has a BASEE innovation fund to develop new business models
that encourage take up of energy efficiency projects by small and medium
businesses (SMEs).82 Implementing in-use performance monitoring of
commercial buildings could drive progress and low-cost finance will be
needed to facilitate.
There is little planned financial support for low-carbon heat in the commercial
sector. The Non-Domestic RHI closes to new applicants on 31 March 2021, with a
year extension to submit full applications for accreditation due to COVID 19
disruption; and a new allocation of tariff guarantees to provide certainty to larger,
better value for money installations. The proposed Clean Heat Grant for 2022-24 is
set to include the smallest commercial businesses as well as homes.83 With a
capacity restriction of 45kW and limited funding, there will remain a significant gap
in support to drive commercial low-carbon heat.
We have mapped current public commitments against investment projections, and identified three major funding gaps for existing homes: public sector buildings, along with bridge funding for heat pumps and low-carbon heat networks.

71
Table P3.3
Investment costs to 2030 in our Balanced Pathway alongside committed public expenditure
Segment Estimated
investment costs
to 2030
Committed public expenditure to 2030
(estimated)
Comment and RAG rating
Fuel poor owner-
occupied homes,
energy efficiency
£4.5- 8.9 billion**
UK Govt: ~£5-6 billion across fuel poor
homes (ECO, portion of the Home
Upgrade Grant, portion of Green Homes
Grant)
Around £0.5 billion at Devolved
Administration level
Further funding possible from Scottish
Government*
Funding in line with projected
costs
Social housing,
energy efficiency
£3.1-4.0 billion**
UK Govt: £3.8 billion
Further funding from Scottish Government*
Funding in line with projected
costs
Other owner-
occupied homes,
energy efficiency
£10.6 billion UK Govt: £1-2 billion (a portion of the
Green Homes Grant)
Further funding from Scottish Government*
Current funding in place to 2022
with a focus on private finance
for remainder
Private-rented
homes, energy
efficiency
£11.1-13.5 billion** UK Govt: fuel poor funding (see top row)
and Green Homes Grant
Possible further funding from Scottish
Government*
Regulatory approach designed
to leverage private finance
Heat pump scale
up to 2025,
existing homes
Estimated £3.0
billion
UK Govt: Estimated £0.5-2 billion (Clean
Heat Grant plus a portion of Green Homes
Grant and Home Update Grant)
Further funding from Scottish Government*
Additional funding is required to
support the scale up of supply
chains ahead of the introduction
of standards
Heat pumps, 2025-
2030, existing
homes
£17.7 billion
including £2.8
billion in social
homes
Negligible Current gap in social homes –
extent of additional gap will
depend on funding model
Heat networks (all
buildings)
£17.5 billion in
total, of which
£~5.5 billion to
leverage private
investment
UK Govt: £0.6 billion, aiming to leverage
~£2 billion private finance
Further funding from Scottish Government*
Further funding required,
particularly for low-carbon heat
sources post-2022
Public sector
energy efficiency
and heat pumps
£5.4 billion total
cost to 2030.
UK Govt: £3 billion
Further funding from Scottish Government*
Public funding will be required for
the gap
Commercial
energy efficiency
£21 billion UK Govt: £6 million
Further funding from Scottish Government*
Proposed standards to leverage
private finance
Possible gap for SMEs
Commercial heat
pumps
£0.5 billion total
cost to 2030. £80
million to 2025 if
funding heat
pumps at 80%.
UK Govt: <0.1bn under Clean Heat Grant
for heat pumps <45kW
Further funding from Scottish Government*
Additional bridge funding may
be required until standards are
introduced to build the supply
chains
Sources: BEIS (2020),21,22,23,24,84 The Conservative Party (2019),85 Scottish Government (2020),86 Welsh Government (2019),87 HMG (2020)13
Notes: Estimates of committed policy spend are based on limited information and are subject to change. They are appr oximated based on current
Government announcements and involve a number of judgements, particularly regarding how the Green Homes Grant, the Home Upgrade Grant and
ECO will be apportioned between segments (reflected in ranges). Rows are not designed to be summed due to overlaps. *The Scottish Government has
committed £1.4 billion of funding over the next Parliament, but it is not possible to disaggregate this currently. ** The top end of the range includes floor
insulation in all fuel poor homes. This was implemented in Element's modelling by assigning high energy efficiency packages to these homes, and as such
floor insulation was also included. In practice, it is likely that deployment of floor insulation may be more limited (partic ularly where this is more expensive
solid floor insulation).

72
c) Enabling measures: information and skills
i) Information
High-quality advice and information is critical for guiding householders’ decisions,
and scored highly with the UK Climate Assembly.88
EPCs have been a useful source of basic comparable information but they have
extensive issues (poor quality/low robustness; modelled rather than actual
performance; they do not show benefits of decarbonising electricity or savings
possible from smart tariffs; they do not always incentivise the measures needed to
support decarbonisation).
Government has recognised the urgent need to improve EPCs to ensure they are
fit to support near-term progress, with a range of improvements proposed in the
recent EPC action plan. It is important that alongside this, the methodology is
designed to drive deployment of the necessary energy efficiency measures on a
holistic basis,††† and does not disincentivise low-carbon heat. Onsite generation is
not a replacement for energy efficiency or low-carbon heat.
As a next stage, home retrofit plans are a tailored approach which can bring in
wider dimensions of comfort, aesthetics and affordability as well as adaptation
needs (Figure P3.5). Combining these with the opportunity of smart meter data in a
digital Green Building passport could unlock green finance at scale by providing a
robust, quality source of information to raise finance against, track progress and
help make standards enforceable. Approaches like this are required to scale up
additional finance to the £~8 billion/year on home renovation by 2030 implied by
our Balanced Pathway.
††† Measures to address thermal efficiency, overheating, indoor air quality and moisture must be considered together
when retrofitting or building new homes.
High quality advice and information is a critical enabling measure.
There is an urgent need to reform EPCs to ensure they are fit to support near-term progress.
Green Building Passports could provide holistic guidance to householders and unlock green finance at scale.
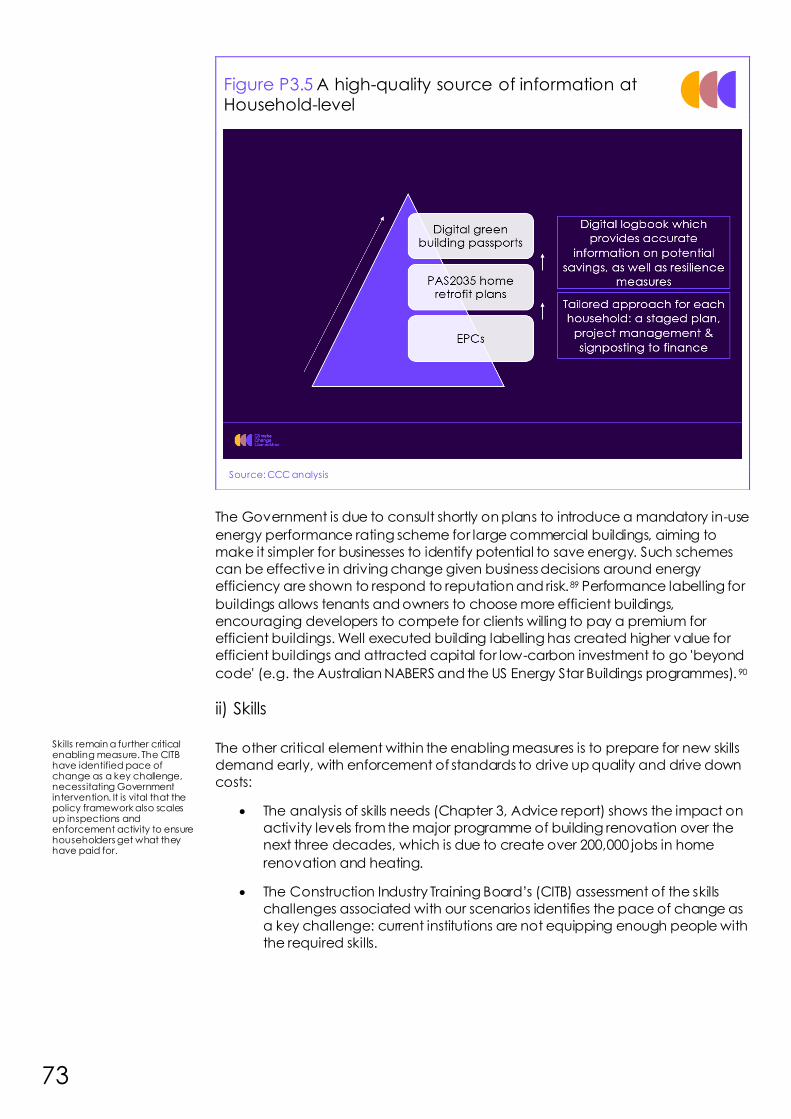
73
The Government is due to consult shortly on plans to introduce a mandatory in-use
energy performance rating scheme for large commercial buildings, aiming to
make it simpler for businesses to identify potential to save energy. Such schemes
can be effective in driving change given business decisions around energy
efficiency are shown to respond to reputation and risk.89 Performance labelling for
buildings allows tenants and owners to choose more efficient buildings,
encouraging developers to compete for clients willing to pay a premium for
efficient buildings. Well executed building labelling has created higher value for
efficient buildings and attracted capital for low-carbon investment to go 'beyond
code' (e.g. the Australian NABERS and the US Energy Star Buildings programmes). 90
ii) Skills The other critical element within the enabling measures is to prepare for new skills
demand early, with enforcement of standards to drive up quality and drive down
costs:
• The analysis of skills needs (Chapter 3, Advice report) shows the impact on
activity levels from the major programme of building renovation over the
next three decades, which is due to create over 200,000 jobs in home
renovation and heating.
• The Construction Industry Training Board’s (CITB) assessment of the skills
challenges associated with our scenarios identifies the pace of change as
a key challenge: current institutions are not equipping enough people with
the required skills.
Figure P3.5 A high-quality source of information at Household-level
Source: CCC analysis
Skills remain a further critical enabling measure. The CITB have identified pace of change as a key challenge, necessitating Government intervention. It is vital that the policy framework also scales up inspections and enforcement activity to ensure householders get what they have paid for.
74
• It is unlikely that the market will develop the requisite skills in time, potentially
resulting in poor quality installations (Box P3.3). Government intervention,
working closely with installers and others in the private sector and with local
government, is required to ensure that the skills that employers need are
available at the required scale on a timely basis.
It is vital that the policy framework also prepares to scale up inspections and
enforcement activity to ensure householders genuinely get what they have paid
for, and see the savings realised through their energy bills.
Box P3.3
Current and future skills needs
There is an urgent need to upskill our workforce, both to meet current building standards,
and to meet the immediate-term challenges ahead.
Skills issues exist for the standards and needs we have today. Deficits have been identified
in areas such as repair and maintenance, and work on traditional buildings.91 Skills
deficits are expected to be a major contributor to the current performance gap.92
On top of this, the sector remains unequipped for the major and immediate-term
challenges ahead. The chopping and changing of UK Government policy has inhibited
skills development in design, construction and in the installation of new measures. An
upcoming report by the CITB identifies low demand for skills and training linked to Net
Zero, and finds the current training supply not yet ‘Net Zero ready’. A survey undertaken
for the CITB revealed that 78% of respondents considered there to be a skills gap in their
occupation/profession for decarbonisation. 93
This is a solvable issue. The same survey found that 90% of respondents would be willing to
retrain, with a similar percentage willing to diversify their business offer or profession.
External funding to cover some or all of the cost of training, and receiving an accredited
qualification, were seen as the most important factors when undertaking decarbonisation
retraining or upskilling.94 Progress in standards has also been seen; a good case study is
the PAS 2030 standard which addressed the need to look at ventilation alongside energy
efficiency; PAS 2035 also represents a major step forward.
The CITB find that a rapid increase in skills capacity is needed, with large-scale re-skilling
of the existing workforce and key structural issues addressed; including build quality,
sector reputation and training readiness. All parties - Government, industry and the
training sector – have responsibilities to deliver this. Actions for Government identified by
the CITB include a clear decarbonisation policy framework; a planned approach to skills
provision to balance immediate with future needs (with the recently launched Green
Jobs Taskforce being a route to deliver this); requirements on the use of retrofit standards
and a redesign building regulations around as-built performance; and support for SME
innovation.
Sources: CITB (2020) Building Skills for Net Zero (draft report); CCC analysis.
75
d) Getting on with it
A mix of solutions displacing gas heating, and in particular any regional role for
hydrogen in the gas grid, will not be achievable without a strategic, coordinated
and planned approach. Institutional frameworks will need to evolve, and national,
regional and local decision-making frameworks will need to be determined in
order to deliver this. Regional and local area energy planning and engagement
can also minimise disruption and inform timely network investment.
While Area-based Energy Planning is not the whole solution, where underpinned by
a robust methodology, it can provide better information to facilitate the process
and is a hook to engage the public. A coordinated and planned rollout will also
ensure that electricity network upgrades can be delivered in time and at
reasonable cost (Box P3.4). This is particularly urgent in areas off the gas grid.
The Energy Systems Catapult estimates that the total cost for undertaking detailed-
planning across Great Britain is £80-100 million – less than 0.5% of the costs of the
transition in buildings.
In the immediate term, a better understanding at a national level of suitable
candidate areas for hydrogen – together with areas which are clearly unsuitable –
can help target investment in the gas grid better and enable targeted progress on
electrification. BEIS and Ofgem would be well-placed to collaborate on a major
study to identify prime candidate areas for hydrogen or full electrification, with
input from networks on current capacity.95
Beyond this, there are a number of options for addressing the governance gap
over the next decade and facilitating a set of decisions on the future of the gas
grid in different parts of the UK, including Pathfinder Cities and other regional and
local demonstrators, a new Heat Delivery and heat zoning:
• Pathfinder Cities/areas. Building on the approach signalled in the Ten Point
Plan and existing demonstrators, these offer a route to scaling up,
engaging the public and improving our understanding of system
integration challenges. A BEIS/MHCLG-led process could identify up to
three areas for demonstrators 2025-2030 plus pipeline for 2030s. 2025 local
council elections are an opportunity to test with the public.
• Heat Delivery Body. The CBI and Birmingham University Heat Commission
has recommended that a new heat delivery body be established to
formalise governance structures and coordinate national, regional and
local government.96
• Next set of Local Area Energy Plan pilots, with full rollout after 2025. Part of
the focus will need to be in areas off the gas grid to inform network
investment, given more rapid timelines.
• Zoning for heat networks. Given the spatial nature of heat networks and the
importance of managing demand-risk, a zoning approach supported by
policy such as licensing will help provide a robust framework for
deployment at scale.
Government should aim to move forward with an equivalent set of proposals in its
forthcoming strategy.
A mix of solutions displacing gas heating, and in particular any regional role for hydrogen in the gas grid, will not be achievable without a strategic, coordinated and planned approach to deliver heat decarbonisation.
76
Box P3.4
The need for further strategic planning and local evidence to inform infrastructure
investments
We surveyed UK Distribution Network Operators earlier this year to understand and gather
views on preparedness of distribution networks for Net Zero delivery. All six respondents
considered indicative electric vehicle and heat pump pathways to 2035 to be
achievable ‘if certain conditions are met’ (particularly from a regulatory framework
perspective) but levels of heat pump deployment in particular were more aggressive
than a number have previously been planning for.
DNOs stressed the need for careful coordination and forward planning if this is to be
achievable – and to control costs.
It was noted that significant cost savings could be achieved where EV and electric heat
rollout is planned and coordinated such that streets only need to be dug once for cable
upgrades, with one DNO quoting 85% of the costs of low voltage upgrades being
excavations. This is supported by previous analysis from Vivid Economics and Imperial
College London.97 One suggested meeting net zero to be ‘impossible’ without planned
and coordinated approach.
Policy recommendations included: the need for a ten-year strategy (including target
heating fuels for different segments and timelines for transition); coordinated/regional
rollout including taking a whole energy systems approach; valuing flexible loads; making
charging cost reflective; and a focus on fairness/protecting the vulnerable. Network
upgrade lead times were reported as ranging from a matter of weeks to up to eight years
depending a wide range of factors relating to the specific upgrade needed.
Similar themes around the importance of co-ordination emerged from our Call for
Evidence, where respondents argued that an uncoordinated approach to the
decarbonisation of heat could put the net-zero target at risk if the different infrastructure
requirements are not in place to support different solutions. A piecemeal approach was
also seen to risk increasing costs (e.g. reducing economies of scale, and leading to
unnecessary investment in multiple infrastructure networks).98
Source: CCC analysis
77
59 CCC(2020) Policies for the Sixth Carbon Budget and Net Zero . Available at: www.theccc.org.uk
60 Element Energy and UCL for CCC (2019) Analysis on abating direct emission from hard-to-
decarbonise homes
61 MHCLG (2019) Annex Table 1.2: Energy efficiency rating bands, by tenure, 2008, 2013 and 2018',
English Housing Survey: Energy efficiency, 2018-19;
62 MHCLG (2020) 'Table 109: by tenure and region, from 1991', Live tables on dwelling stock 63 Scottish Government (2018) Housing statistics: Stock by tenure
64 Stats Wales (2020) Dwelling stock estimates by year and tenure
65 Department for Communities (2019) 'Northern Ireland Housing Statistics 2018-19 Section 1 Tables
- Supply', Northern Ireland Housing Statistics 2018-19
66 BEIS (2020a) 'Table 18: Fuel poverty detailed tables 2020', Fuel poverty statistics report for 2020
67 BEIS (2020b) 'Cross-tabulation tables', BEIS Public Attitudes Tracker: Wave 32. 68 BEIS (2018) Clean growth: transforming heating - overview of current evidence
69 CCC, UCL and Imperial College (2016) What Works studies on residential energy efficiency, non-
residential energy efficiency and low-carbon heat, published alongside CCC (2016) Next Steps
for UK Heat Policy 70 BEIS (2019) Consultation Stage Impact Assessment for amending the Private Rented Sector
Regulations 71 BEIS (2020c) ‘Table U2’, Energy Consumption in the UK (ECUK): End uses data tables.
Department for Business, Energy & Industrial Strategy. 72 HMG (2020) The Ten Point Plan for a Green Industrial Revolution
73 Ibid
74 Imperial College (2018) Analysis of alternative heat decarbonisation pathways
75 Element Energy and UCL for CCC (2019) Analysis on abating direct emission from hard-to-
decarbonise homes
76 CCC calculations based on Imperial College (2018) Analysis of alternative heat
decarbonisation pathways (Hybrid heat pump 10 Mt scenario).
77 Climate Assembly UK (2020) The path to net zero, Climate Assembly UK full report 78 Vivid Economics and partners (2019) Energy Innovation Needs Assessment, Sub-theme report:
Building fabric; Vivid Economics and partners (2019) Energy Innovation Needs Assessment, Sub-
theme report: Heating and cooling; Connected Places Catapult and the Housing Innovation
Programme (2020) Retrofit – Towards a sector-wide roadmap 2020.
79 CCC analysis drawing on Imperial (2018) Analysis of alternative heat decarbonisation pathways
and based on the electrification scenario.
80 BEIS (2020d) ‘Public Sector Decarbonisation Scheme (PSDS)’
https://www.gov.uk/government/publications/public-sector-decarbonisation-scheme-psds
81 BEIS (2020e) ‘Public Sector Low Carbon Skills Fund’
https://www.gov.uk/government/publications/public-sector-low-carbon-skills-fund
82 BEIS (2020f) ‘Boosting access for SMEs to energy efficiency (BASEE) competition: winning
projects’ https://www.gov.uk/government/publications/boosting-access-for-smes-to-energy-
efficiency-basee-competition-winning-projects
83 BEIS (2020g) Future support for low carbon heat
84 BEIS (2020h) ‘Impact Assessment (IA): Consultation Stage IA: Future Support for Low Carbon
Heat’.
85 The Conservative Party (2019) ‘Our manifesto gets Brexit done and unleashes the po tential of
the whole country’
86 Scottish Government (2020) Protecting Scotland, Renewing Scotland: The Government's
Programme for Scotland 2020-2021
78
87 Welsh Government (2019) Prosperity for All: A Low Carbon Wales.
88 BEIS (2020g) Future support for low carbon heat
89 Dr Peter Mallaburn, UCL for the CCC (2016) A new approach to non-domestic energy efficiency
policy
90 CCC (2016) Next steps for UK heat policy 91 CITB (2020) Building Skills for Net Zero (draft report)
92 For further discussion see CCC (2019) UK housing: Fit for the future?
93 CITB (2020) Building Skills for Net Zero (draft report)
94 CITB (2020) Building Skills for Net Zero (draft report) 95 Element Energy for the CCC (2020) Development of trajectories for residential heat
decarbonisation to inform the Sixth Carbon Budget. 96 CBI and University of Birmingham (2020) Net Zero: The Road to Low-Carbon Heat
97 Vivid Economics and Imperial College London (2019) Accelerated electrification and the GB
electricity system.
98 Committee on Climate Change (2020) The Sixth Carbon Budget & Welsh emissions targets,
Summary of responses to Call for Evidence.